Article

Study on the Hydrodynamic Performance of Swing-Type Flapping Hydrofoil Bionic Pumps Affected by Foil Camber

1
College of Mechanical Engineering, Zhejiang University of Technology, Hangzhou 310023, China
2
School of Mechanical and Electrical Engineering, Zhejiang Industry Polytechnic College, Shaoxing 312000, China
3
School of Mechanical & Automotive Engineering, Zhejiang University of Water Resources and Electric Power, Hangzhou 310018, China
*
Author to whom correspondence should be addressed.
Water 2024, 16(4), 595; https://doi.org/10.3390/w16040595
Submission received: 19 January 2024 / Revised: 11 February 2024 / Accepted: 15 February 2024 / Published: 17 February 2024

Abstract

:
The flapping hydrofoil bionic pump is an innovative hydrodynamic device that utilizes flapping hydrofoil technology. Flapping hydrofoil bionic pumps are crucial in addressing issues like inadequate river hydropower and limited water purification capabilities in flat river network regions. Optimizing the foil characteristics is essential for enhancing the hydrodynamic efficiency of the flapping hydrofoil bionic pump. This study investigates the impact of foil camber parameters on the hydrodynamic performance of swing-type asymmetric flapping bionic pumps. The NACA series standard foils with varying cambers are analyzed using the overlapping grid technology and finite volume method. The thrust coefficient, flow rate, pumping efficiency, and flow field structure of the flapping hydrofoil bionic pump are examined under pressure inlet conditions with the foil camber. The findings indicate that increasing the foil’s curvature within a specific range can greatly enhance the maximum values of thrust coefficient, propulsive efficiency, and pumping efficiency of the flapping hydrofoil bionic pump. Specifically, when the foil curvature is 6%c, the maximum value of the instantaneous thrust coefficient of the flapping hydrofoil bionic pump is significantly improved by 31.25% compared to the symmetric foil type under the condition of an oscillating frequency of f = 1 HZ. The flapping hydrofoil bionic pump achieves its maximum pumping efficiency when the oscillation frequency is within the range of f ≤ 2.5 Hz. This efficiency is 11.7% greater than that of the symmetric foil, and it occurs when the foil curvature is 8%c. Within the frequency range of f > 2.5 Hz, the flapping hydrofoil bionic pump that has a foil curvature of 6%c exhibits the highest enhancement in pumping efficiency. It achieves a maximum increase of 12.8% compared to the symmetric foil type. Nevertheless, the average head was less than 0.4 m, making it suitable for ultra-low-head applications.

1. Introduction

Rivers and lakes serve as the primary conduits for terrestrial water resources, and the condition of their surroundings and ecosystems is closely linked to the standard of regional economic and social progress. Due to the increasing intensity of human activities and the approaching limit of water resource capacity, the water environment and ecological issues in the plain river network have become more noticeable [1,2]. The primary cause is the diminished channel ratio of minor rivers within the river network on the plain, resulting in inadequate hydropower and restricted self-purification capacity. The common approach employed to enhance hydrodynamics for these issues is the incorporation of pump gate devices into the river network [3,4]. Currently, the primary pump gate devices mostly comprise high-capacity, low-head axial flow pumps, specifically the vertical axial flow pump device and the horizontal cross-flow pump device employed in the South-to-North Water Diversion Project. Among various pump gate devices, the design and use of low-lift axial flow pump devices, which are suitable for lifts ranging from 3 to 8 m, are well-established. However, the performance of conventional pump gate devices is constrained by the impeller, leading to subpar performance and common issues such as severe cavitation [5,6,7], excessive vibration [8,9], and low efficiency [10]. According to a study, the flapping hydrofoil bionic pump water-pushing mechanism is highly beneficial for enhancing the hydrodynamics of tiny rivers, particularly in ultra-low-head conditions (H < 1 m) [11].
Both domestic and international experts have extensively researched the underwater propulsion mechanism of the flapping hydrofoil bionic pump. Previous studies (References [12,13,14,15]) have examined hydraulic models of river networks. These models are classified into three types based on the distinct physical qualities being examined: one-dimensional models, two-dimensional models, and three-dimensional models. One-dimensional river network hydraulic models are mostly employed to simulate flow in a linear manner in a single direction. In contrast, two-dimensional and three-dimensional models consider vertical water flow, resulting in improved simulation accuracy and processing efficiency. This work employs a two-dimensional model for research, taking into account both computing efficiency and accuracy. Knoller and Betz [16] were the initial researchers to elucidate the mechanics behind the formation of flapping propulsion. It has been discovered that the interaction between the vortex generated at the leading edge and the vortex generated at the trailing edge of a flapping foil results in the formation of a reverse Karman vortex street. This phenomenon is accountable for the robust propulsion and efficiency of water-flapping hydrofoils. The influence of various motion variables on the propulsion performance of water-flapping hydrofoils was examined in references [17,18,19]. This study primarily aimed to examine the impact of the phase difference between the plunge and pitch motions of the water flap, the maximum angle of attack α, the amplitude of lift and pitch, and the higher-order terms in the equations of motion on the propulsive efficiency of the flap bionic pump.
In a two-dimensional plane, a flapping hydrofoil bionic pump demonstrates three degrees of freedom: surging, pitching, and plunging. Research conducted in references [20,21,22] has examined the influence of various combinations of these movements on the pumping efficiency of a flapping hydrofoil bionic pump. The research findings demonstrate a 35% enhancement in the efficiency of pumps that possess three interconnected degrees of freedom, as opposed to those with only two degrees of freedom. Prior research [23,24,25,26] has investigated the influence of various geometric characteristics of foil structures on the efficiency of propulsion in flapping hydrofoils through the use of numerical simulations and experimental methods. The characteristics encompass wingtip shape, aspect ratio, root chord ratio, and more factors. The experiments demonstrate a positive link between the performance of oscillating hydrofoils and the aspect ratio, while a negative correlation is detected with the root chord ratio. Additional evidence from citations [27,28] has substantiated that the propulsion performance of flapping hydrofoils is influenced by factors in their immediate surroundings, such as the distance from walls and the structure of the channel.
The aforementioned research findings demonstrate substantial discrepancies in the hydrodynamic efficiency of the flapping hydrofoil bionic pump when it is subjected to various operational circumstances. While many studies have mainly concentrated on examining the motion characteristics of symmetrical foil profiles in flapping hydrofoil bionic pumps, there is a scarcity of studies on flapping using non-symmetrical foil profiles, especially those with curvature. This research focuses on the curvature of flapping foils and develops a motion model using fishtail oscillation. This study investigates the hydrodynamic performance changes of a flapping hydrofoil bionic pump using varying foil curvatures. The objective is to offer valuable information for enhancing the design of foil profiles in bio-inspired flapping.

2. Motion Description and Mechanical Model

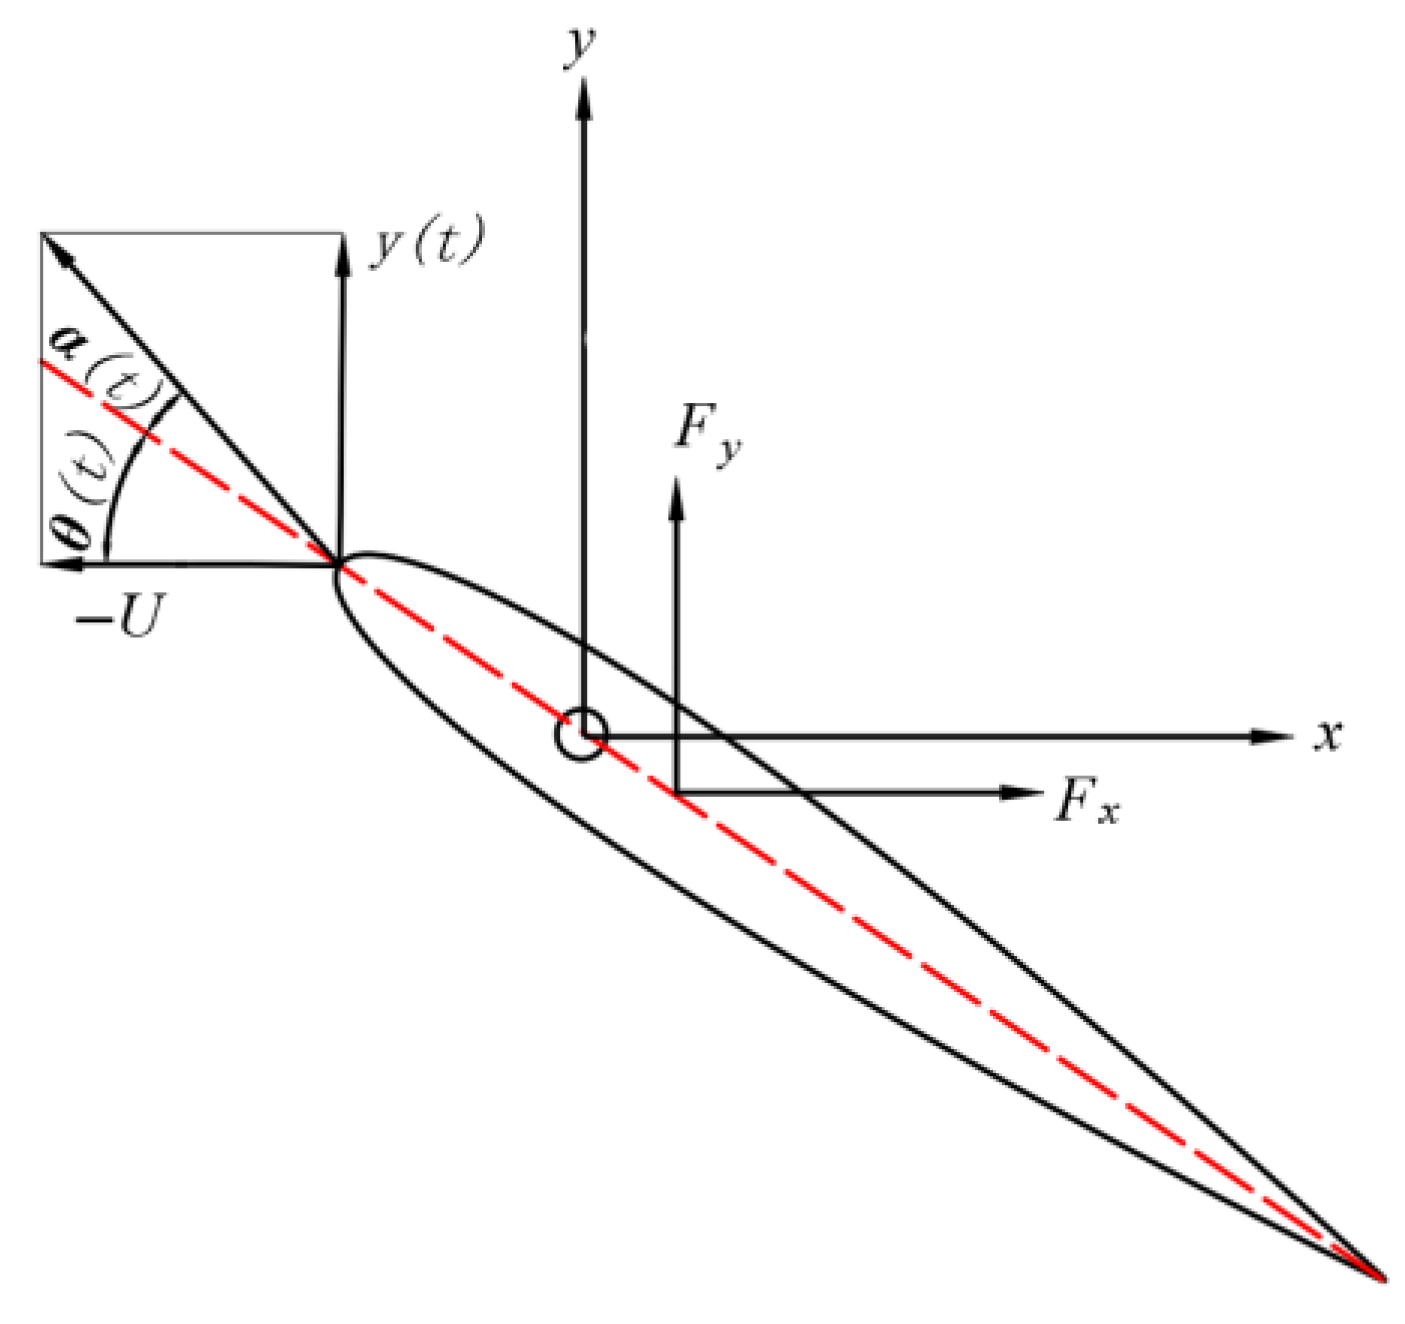
2.1. Motion Description

The flapping hydrofoil bio-inspired pump imitates the tail morphology of a fish, utilizing 2 degrees of freedom (pitching motion and plunging motion) linked to motion. The tail fin is streamlined into a rigid hydrofoil, which produces the flapping motion trajectory depicted in Figure 1.
In Figure 1, T represents the flapping motion period, and Amax and θmax denote the maximum amplitudes of plunging motion and pitching motion, respectively. In this study, the fundamental equation for flapping hydrofoil motion is defined [29], as shown in Equation (1):
y ( t ) = A max sin ( 2 π f t ) θ ( t ) = θ max sin ( 2 π f t + ϕ )
In Equation (1), y(t) denotes the vertical displacement of the flapping hydrofoil, while θ(t) indicates the angle of pitch of the flapping hydrofoil. This angle refers to the deviation between the direction of fluid flow and the chord of the foil, as seen by the red line in Figure 1. f represents the frequency of the linked motion, which establishes the identical frequency for both the plunging and pitching movements of the flapping hydrofoil. The variable ϕ represents the disparity in phase between the two movements, and its value in the numerical computations performed in this work is π /2.
By differentiating Equation (1), we derive
v ( t ) = y ˙ ( t ) = 2 π f A max cos ( 2 π f t ) ω ( t ) = θ ˙ ( t ) = 2 π f θ max cos ( 2 π f + ϕ )
In the above Equation (2), v(t) and ω(t) represent the plunging and pitching velocities of the flapping hydrofoil, respectively.

2.2. Mechanical Model and Pumping Indicators

Taking the point at 0.2c along the foil as the pivot position, where c is the chord length of the flapping hydrofoil, we establish a coordinate system with the x-axis in the positive direction representing the horizontal motion velocity relative to the oncoming flow and the y-axis representing the plunging motion direction of the flapping hydrofoil, as illustrated in Figure 2.
In Figure 2, U represents the horizontal velocity of the water flow relative to the flapping hydrofoil. θ ( t ) denotes the instantaneous pitch angle of the flapping hydrofoil, while α ( t ) denotes the instantaneous angle of attack. The force between the fluid and the surface of the hydrofoil during the movement of the flapping hydrofoil is denoted by F. Fx and Fy represent the components of this force along the x-axis and y-axis, respectively. The components of the force, Fx, contribute favorably to the propulsive action of the water body.
The angle of attack has been found to affect the propulsion performance of biomimetic flapping hydrofoil pumps, as demonstrated by a prior study [19]. The size of the angle of attack is influenced by both the incoming flow velocity U and the pitching angle of the flapping hydrofoil. The instantaneous angle of attack function is defined as
α ( t ) = arctan ( v ( t ) U ) θ ( t )
Assessing the propulsive capabilities of the water-flapping hydrofoil relies on key indications such as the instantaneous thrust coefficient Cx, the instantaneous lift coefficient Cy, and the mean power coefficient C P ¯ . The formulas that establish specific characteristics are
C x = 2 F x ( t ) ρ U 2 c s C y = 2 F y ( t ) ρ U 2 c s C p ¯ = 2 P ¯ ρ U 3 c s
In the given Formula (4), ρ represents the density of water, s represents the span of the flapping foil, F x t represents the instantaneous thrust, F y t represents the instantaneous lift, P ¯ represents the mean input power of the flapping hydrofoil, which is calculated according to Formula (5), and U represents the mean flow velocity at the outlet section of the flow channel after the flow field has stabilized.
P ¯ = 1 k T ( n k ) T n T F x ( t ) v ( t ) d t + ( n k ) T n T M ( t ) ω ( t ) d t
The average thrust coefficient Cx and the average lift coefficient Cy are the mean values of the instantaneous thrust F x t and instantaneous lift F y t over one cycle. They are defined by the following equations:
C x ¯ = 1 k T ( n k ) T n T F x ( t ) d t 0.5 ρ U 2 c s C y ¯ = 1 k T ( n k ) T n T F y ( t ) d t 0.5 ρ U 2 c s
In the above Equation (6), the variable k represents the number of cycles, T represents the period, and n represents the number of calculated cycles.
To enhance the comprehensiveness of the hydrodynamic efficiency analysis for the flapping hydrofoil bio-inspired pump device, it is imperative to take into account the conventional indications used for evaluating the performance of pump stations. Thus, hydraulic performance characteristics such as flow rate, head, propulsion efficiency, and pump efficiency are presented. The average flow rate Q of the flapping hydrofoil bio-inspired pump mechanism is determined by the following formula:
Q = U S 0
In Equation (7), S0 denotes the cross-sectional area of the channel’s outflow. The average head H of the flapping hydrofoil bio-inspired pump device can be determined by monitoring the static pressure differential at the inlet and outlet of the channel and performing calculations. The equation for determining the average head H is defined as follows:
H = p 2 ¯ p 1 ¯ ρ g
In the above Equation (8), p 1 ¯ denotes the mean pressure at the entrance of the channel, p 2 ¯ denotes the mean pressure at the exit of the channel, and g = 9.8 m/s2.
The formulas for calculating the propulsion efficiency η ph and the pump efficiency η pm of the flapping hydrofoil bio-inspired pump device are defined as follows:
η ph = 1 k T ( n k ) T n T F x ( t ) d t 0.5 ρ U 2 c s 2 P ¯ ρ U 3 c s
η pm = k T p 2 ¯ p 1 ¯ · U S 0 ( n k ) T n T F x ( t ) v ( t ) d t + ( n k ) T n T M ( t ) ω ( t ) d t

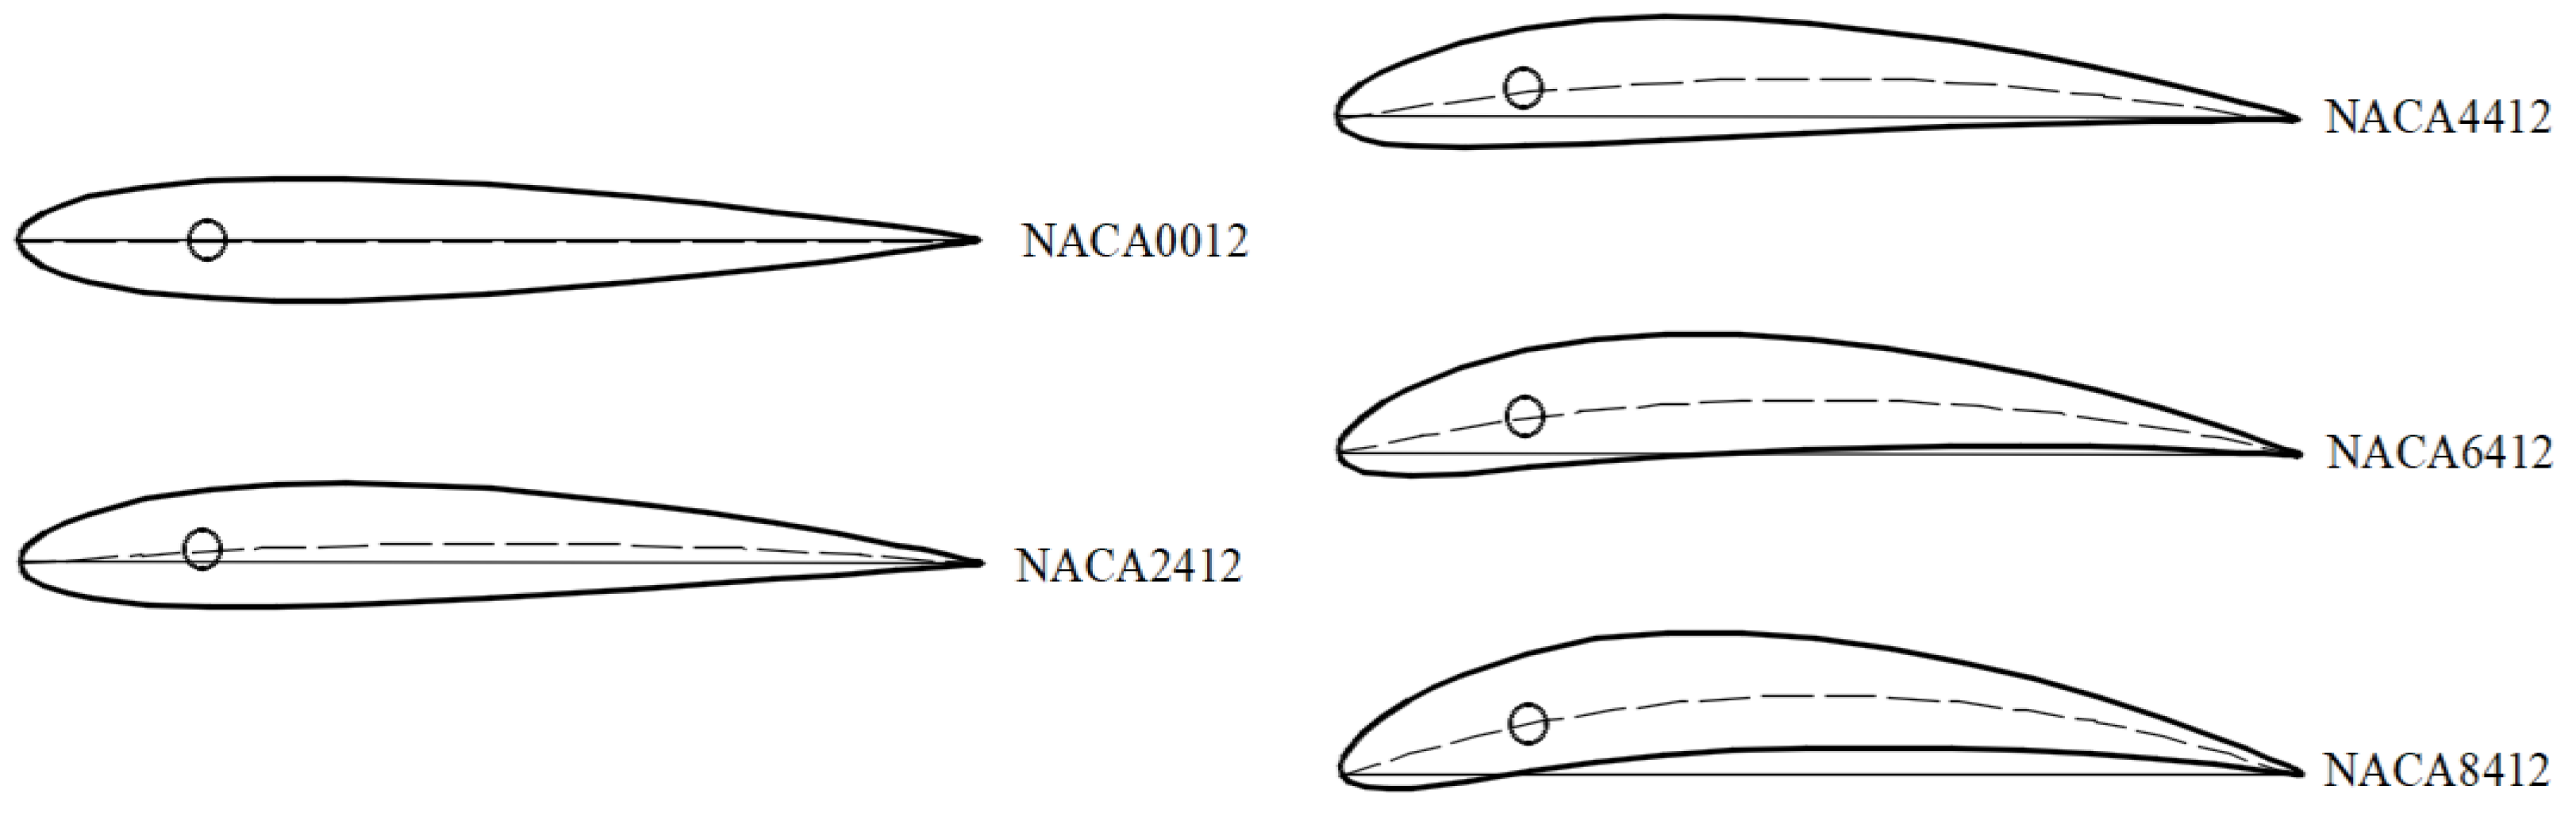
3. Foil Geometry Parameter Model

Upon careful observation, it becomes apparent that the cross-section of the fishtail exhibits a distinct curve, resembling the shape of an actual fish’s tail. In close proximity to the pivot axis, the fish tail’s skeletal structure is occupied by muscles, which gradually diminish in size and eventually vanish near the tail’s extremity. This bears a resemblance to the cross-sectional configuration of an airplane wing. Thus, in order to examine the influence of foil curvature on the hydrodynamic efficiency of the flapping hydrofoil bio-inspired pump, we have selected the NACA series standard airfoils as the subjects of our study. Figure 3 displays the foil profile and primary characteristics of the flapping hydrofoil bio-inspired pump. The figure illustrates the foil’s characteristics, where c, b, and e denote the chord length, maximum thickness, and maximum camber, respectively. The parameters derived by dividing each of these numbers by the foil chord length c are known as the non-dimensional values of these parameters, which are utilized to depict the geometric shape of the foil. For instance, the highest thickness value b ¯ = b/c, and the highest camber value e ¯ = e/c. Furthermore, the measurement of the flapping foil’s width is represented as s. Figure 4 depicts the geometric configurations of foils with varying curvatures that were examined in this research. When studying the curvature of a foil, the thickness of the foil remains consistent at 12% of the length of the chord. The foil’s greatest curvature is located at a distance of 40% of the chord length from the leading edge. The relative maximum camber e ¯ ranges from 0% to 8%. Table 1 displays the fundamental characteristics of foils with varying cambers.

4. Calculation Method

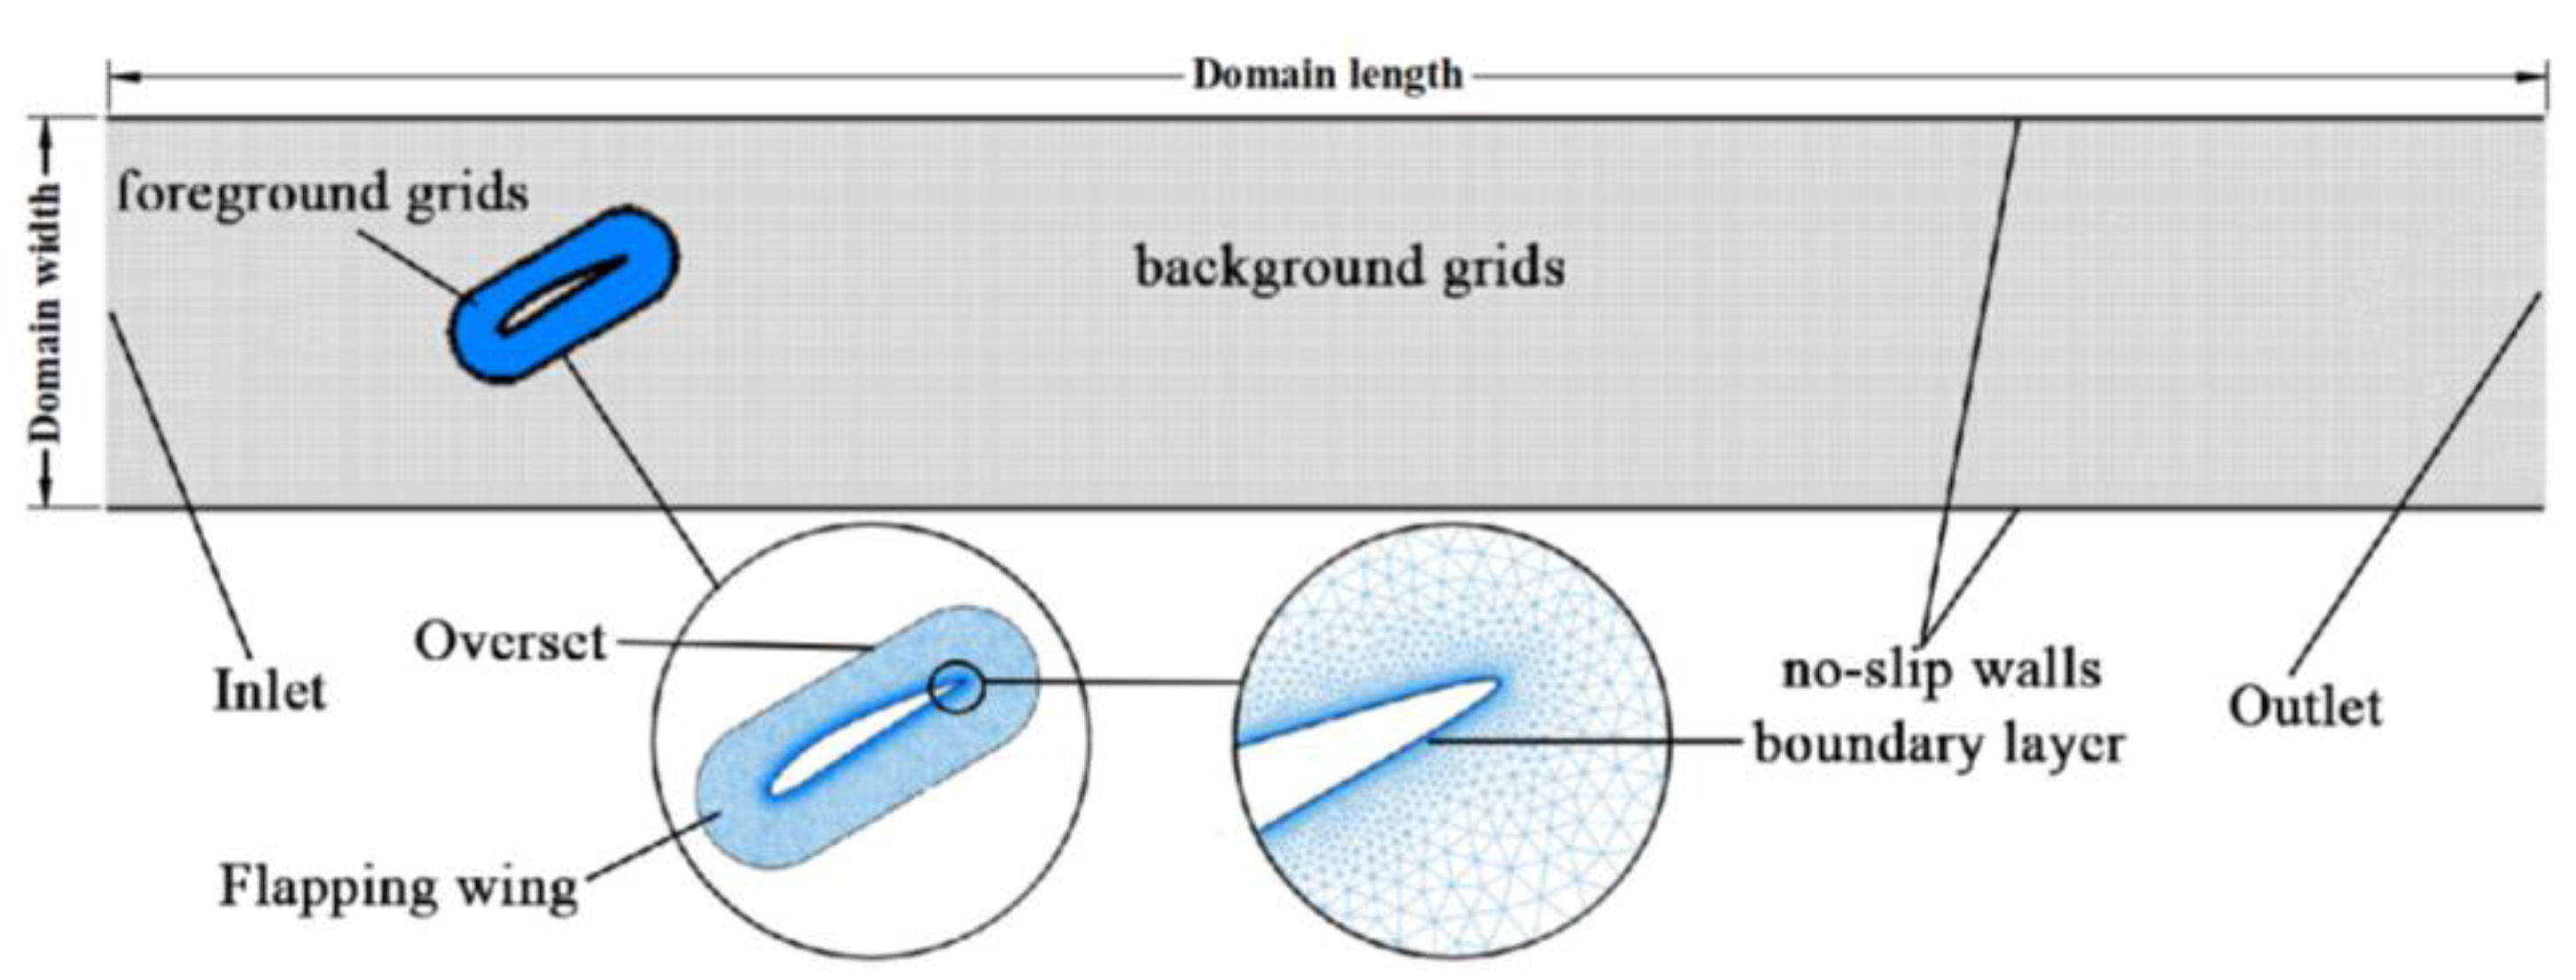
4.1. Mesh Generation and Solution Settings

This study employed the simulation software Ansys Fluent 2020 to simulate and analyze the characteristics of two-dimensional incompressible turbulent flow fields. The simulation is based on the Reynolds-averaged Navier–Stokes equations, which are explained in the literature [30]. The turbulent flow model R e a l i z a b l e k ε is employed for the resolution of the Navier–Stokes equations, with the relevant equations provided in reference [31]. This work utilizes overlapping grid technology to capture the flow field behind the flapping hydrofoil accurately and optimize computational resources. The adoption of this technique ensures both high precision and efficiency in the numerical simulation. The channel’s computational domain is defined as 800 mm × 5000 mm. In Fluent, the span s of the flapping foil numerical model is set to 300 mm. The pitching center of the flapping hydrofoil is located at a distance of 0.2 times the chord length (c) from the leading edge of the foil. Additionally, the reference point (pivot) for the fluid domain is established 500 mm away from the inlet of the channel. This study divides the computational domain into background grids (rectangular fluid domain) and foreground grids (flapping hydrofoil fluid domain), as shown in Figure 5. Both the foreground and background grids consist of structured grids with a uniform size of 8 mm.
In order to accurately catch the flow field near the wall, it is crucial to establish boundary layers around the flapping hydrofoil and no-slip walls. This is due to the substantial variation in the normal velocity gradient near the wall, as depicted in Figure 5. This study establishes a boundary layer on the foil surface with a first layer height of 4 × 10⁻³ mm, which is then split into 12 layers. The growth rate of the mesh boundary layer is defined at 1.2, resulting in a determined Y+ < 1.

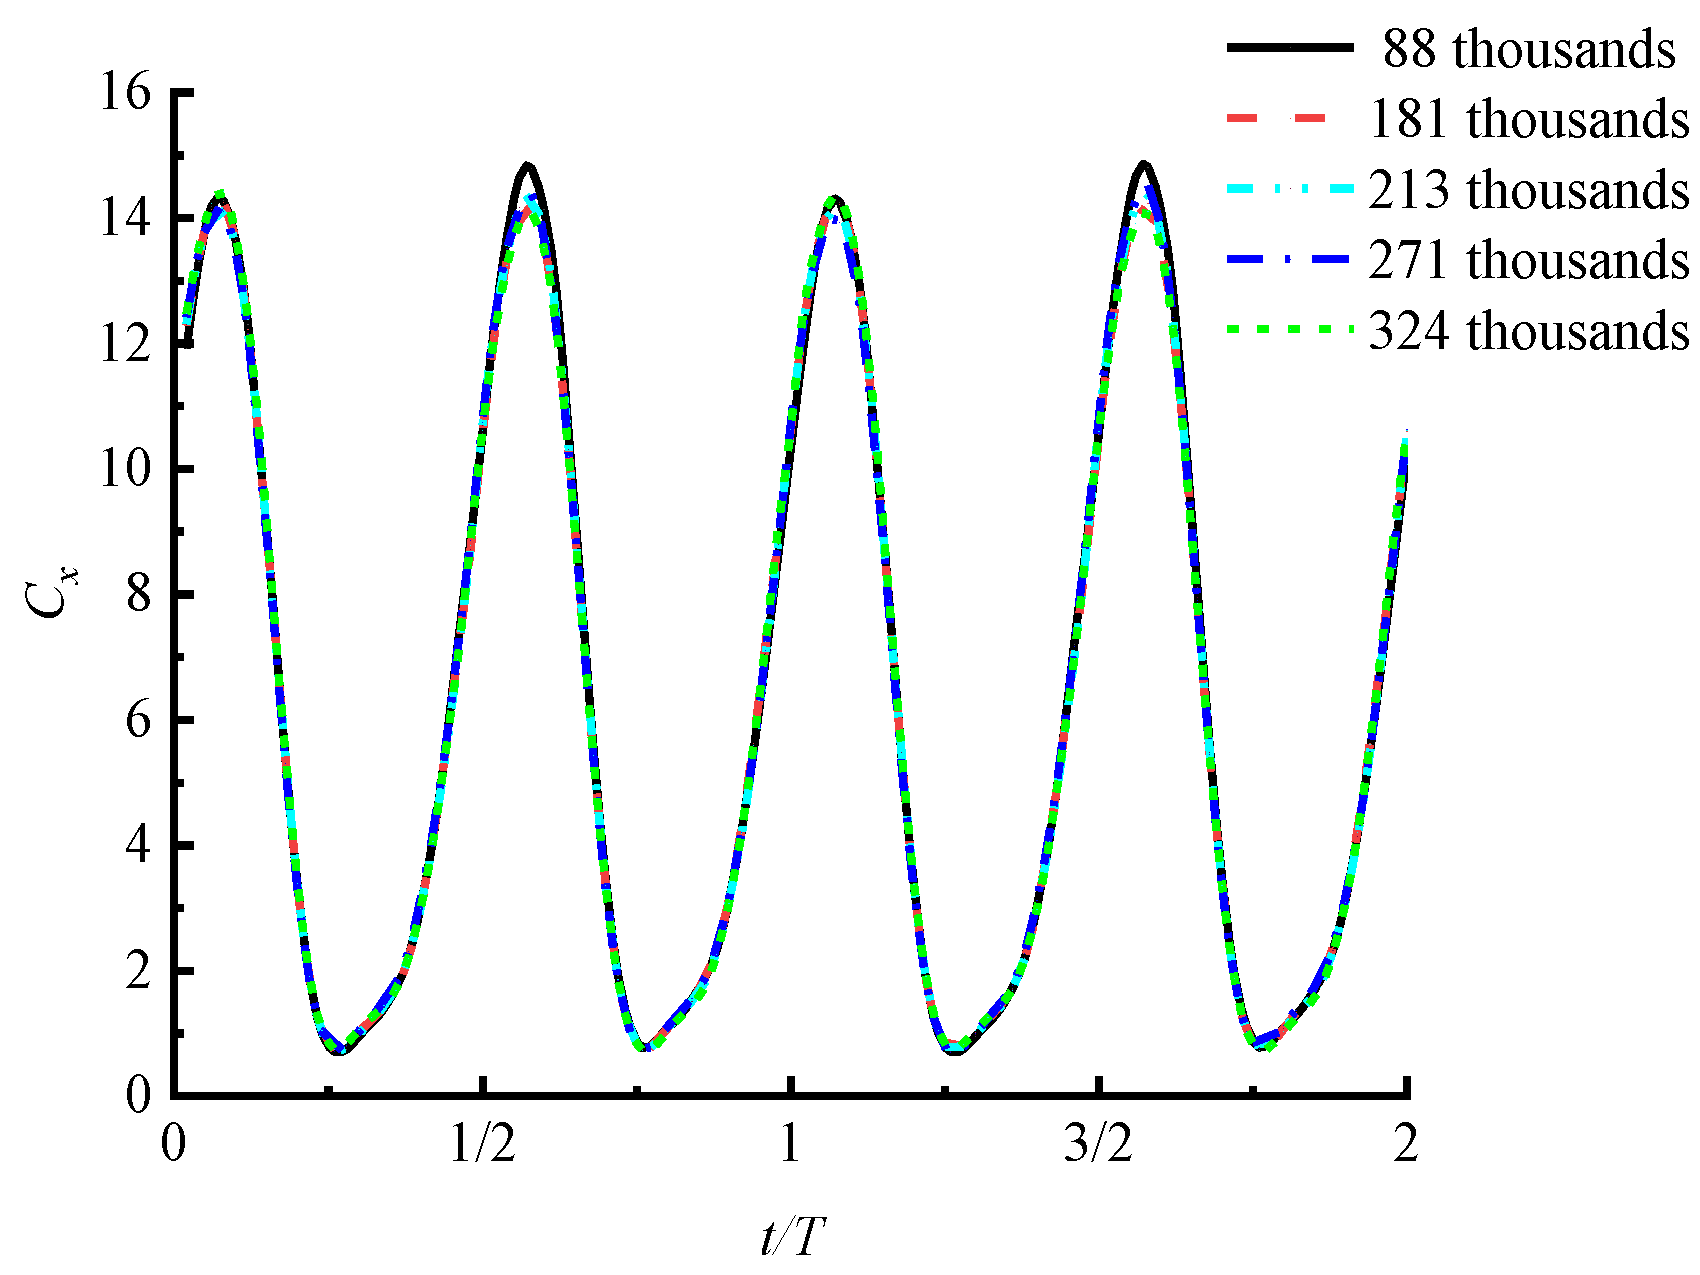
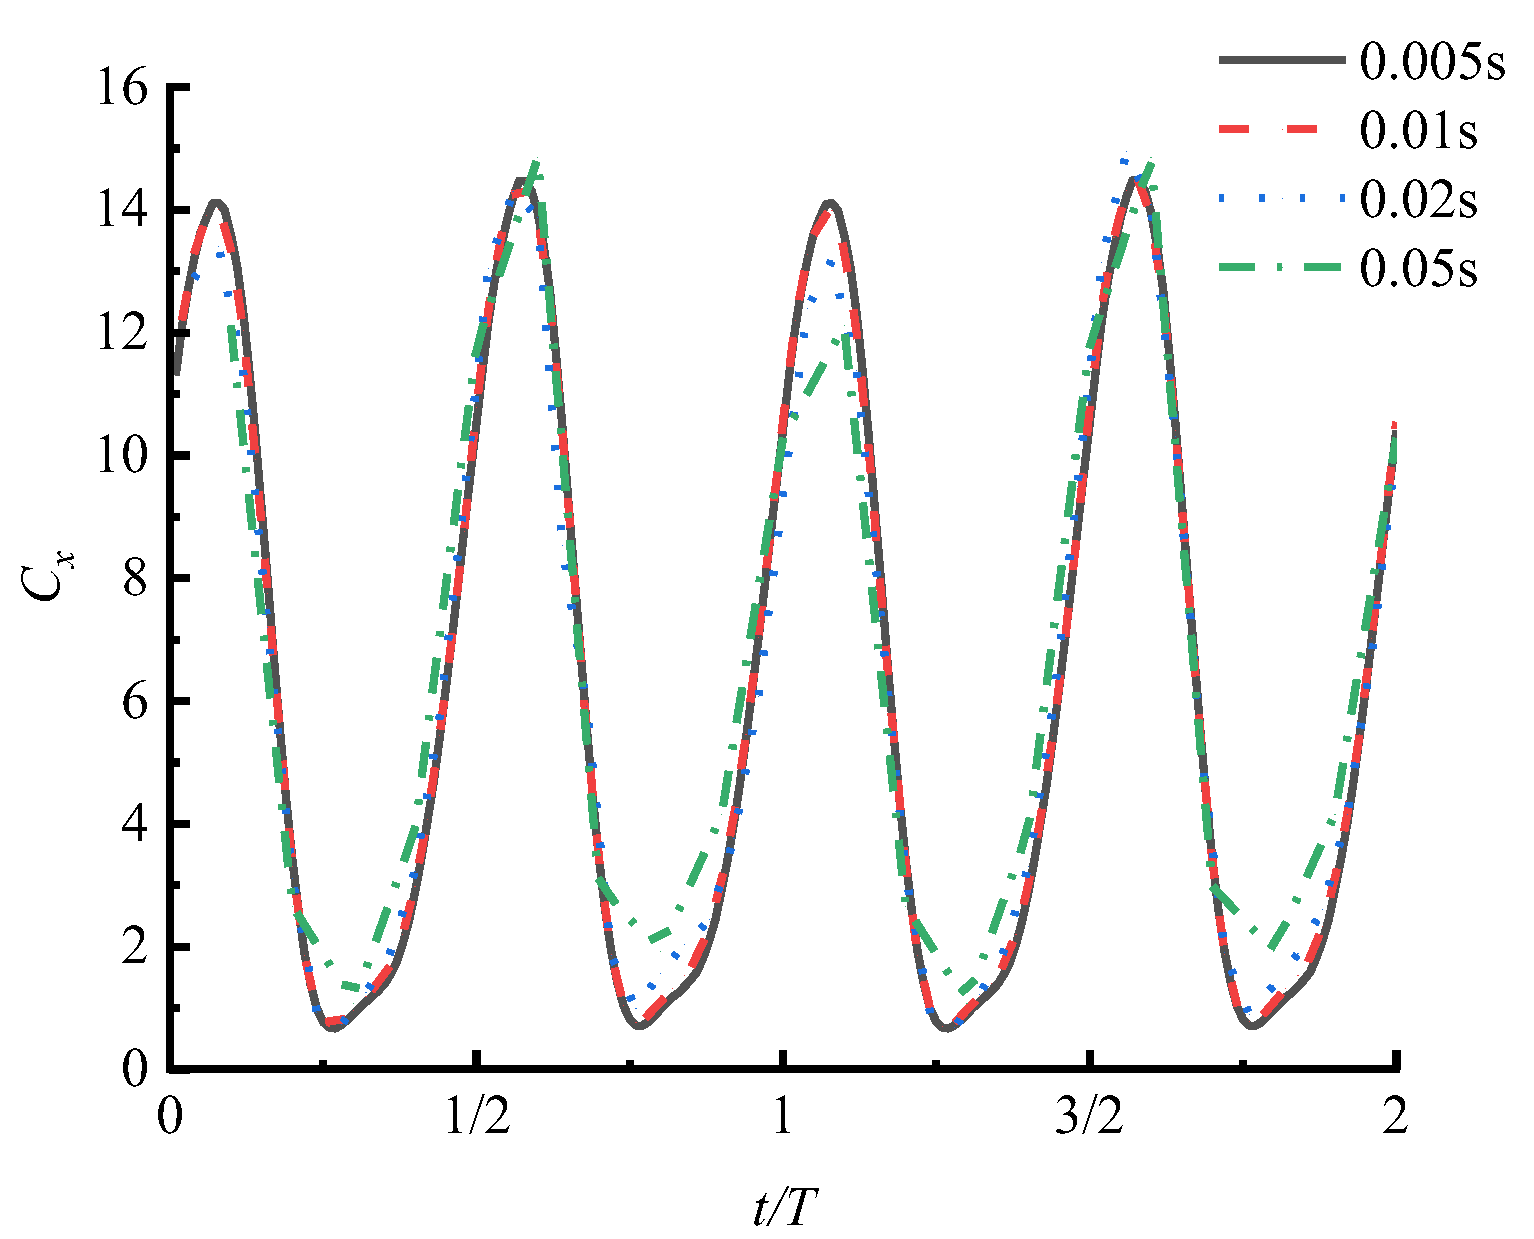
4.2. Mesh Independence and Time Step Insensitivity Verification

To ensure the precision of numerical calculations, it is crucial to verify the independence of the mesh and the independence of the step in the two-dimensional numerical model. The velocity inlet boundary condition is applied to the flow field, while both the foil surface and the interior walls of the channel are assigned the no-slip wall conditions. The outermost boundary of the foreground mesh domain is defined as the overset boundary condition in order to facilitate the transfer of flow layer information. The plunging and pitching motion of the flapping hydrofoil is achieved using a User-Defined Function (UDF), while the Coupled algorithm is selected to integrate the pressure field with the velocity field to solve the Reynolds-averaged Navier–Stokes control equations. To guarantee the precision and consistency of the method, the residual convergence threshold is established at 1 × 10⁻⁵, and the maximum number of iterations is limited to 30.
By setting different global minimum grid sizes, five numerical models are obtained with grid numbers of 88,000, 181,000, 213,000, 271,000, and 324,000, respectively. Subsequent numerical simulations were conducted, and after the flow field stabilized, the instantaneous thrust coefficients of these five numerical models over two cycles were compared. The results are shown in Figure 6. The results indicate that, with different grids, the trough value of the instantaneous thrust coefficient of the flapping hydrofoil bionic pump remains essentially unchanged, while the peak value varies slightly. The grid count is inversely proportional to the instantaneous thrust coefficient, but the differences in peak values among the five sets of numerical results are small. Therefore, the impact of grid count on the calculation results can be essentially neglected. Consequently, to ensure the accuracy of numerical calculations and save computational resources, this study chose a model with a grid count of 213,000 to conduct numerical research on the hydrodynamic performance of the bionic flapping hydrofoil device.
In addition, concerning the verification of independence from the iteration step size, this study selected the numerical model with a grid count of 213,000 mentioned above. Three different time step sizes—0.05 s, 0.02 s, and 0.01 s—were chosen for numerical simulations. The simulation results were extracted for two cycles after the outlet section flow stabilized, as shown in Figure 7. The results show that with a step size of 0.05 s, the curves have more angular corners. This is because a step size of 0.05 s is too large, leading to a significant interval between adjacent data points. However, the curves for iteration step sizes of 0.01 s and 0.005 s almost overlap. It can be observed that after an iteration step size of 0.01 s, computational accuracy is ensured. Therefore, this study chose an iteration step size of 0.01 s for the numerical investigation of the hydrodynamic performance of the flapping hydrofoil bionic pump device.

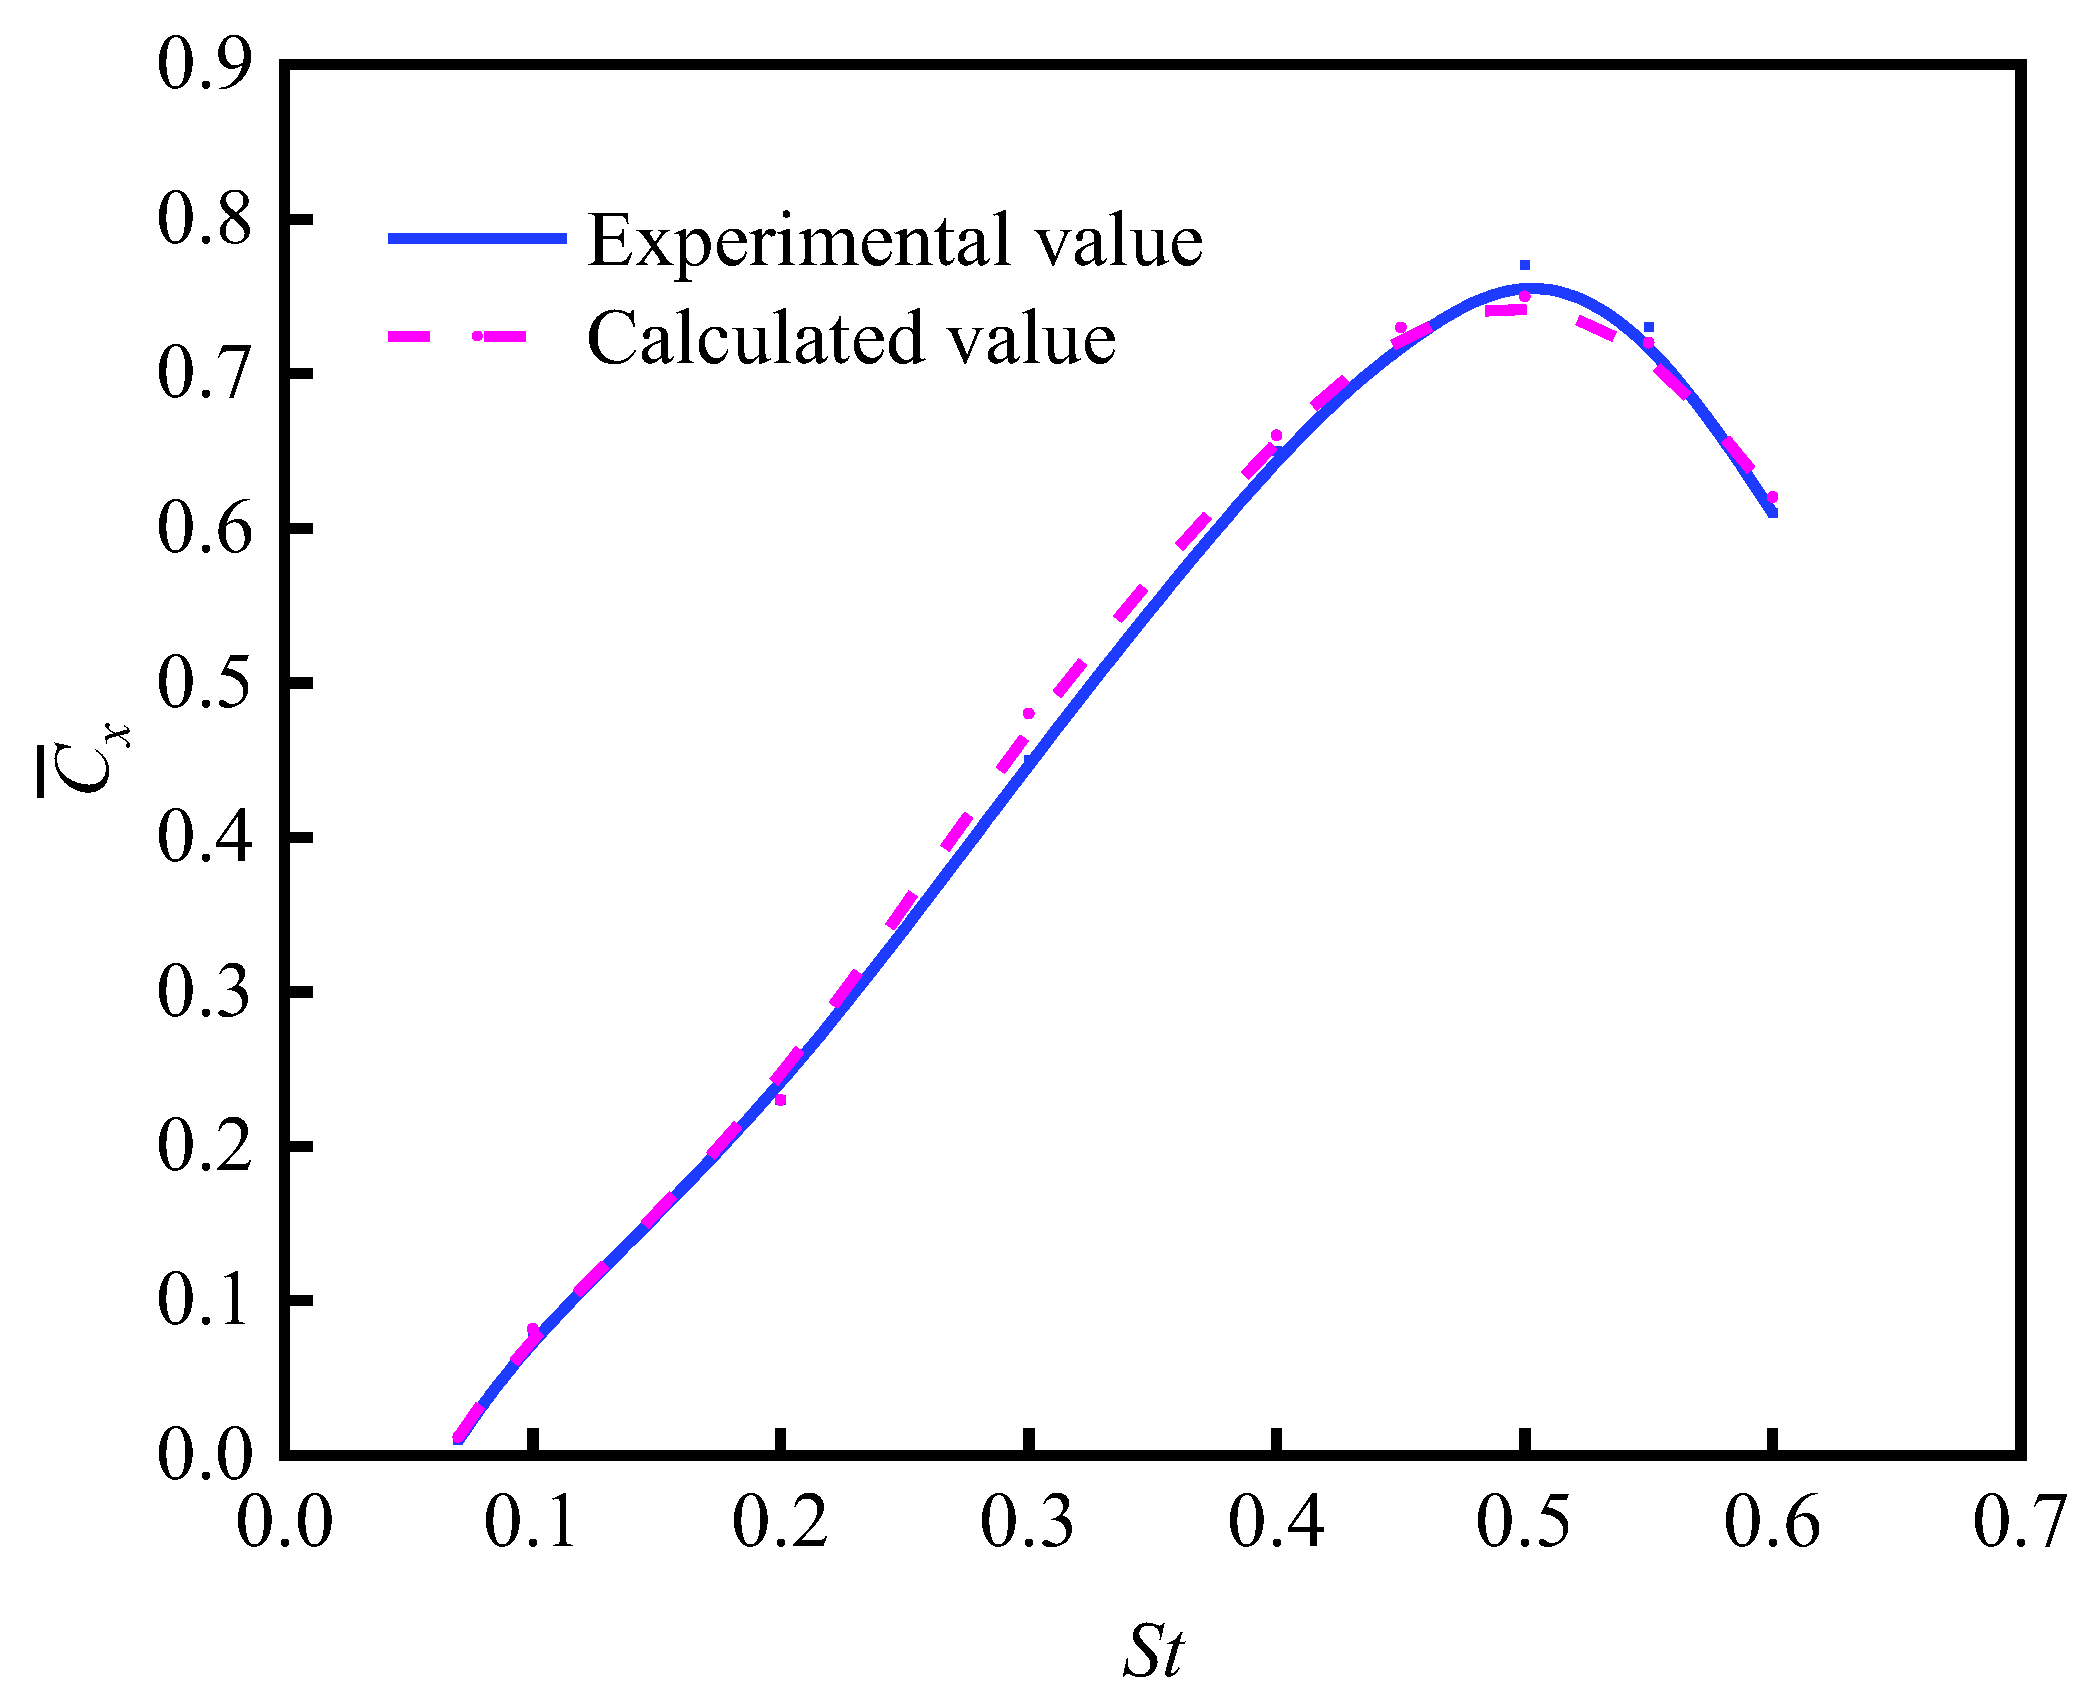
5. Numerical Method Validation

In order to verify the dependability of the numerical model and the computational methods developed in this study, simulations were performed using the relevant numerical model, following the flapping hydrofoil experiment outlined in reference [32].
The numerical simulation findings were subsequently compared to the experimental data. This study utilized data from [32] to build a flapping hydrofoil with a chord length (c) of 0.1 m, designed to resemble NACA0012. The area of computation was set at 20c × 15c. The pitching axis of the flapping hydrofoil was located at a point that is one-third of the chord length, at a distance of 5 times the chord length from the inlet boundary. Furthermore, the initial velocity at the inlet was specified as U = 0.4 m/s, the outlet was designated as a pressure outlet, the maximum amplitude of plunging motion was set at Amax = 0.1 m, the phase difference was ϕ = 90°, and the pitch angle was αm = 15°, with St being a variable. In a comparison of the numerical calculations under various conditions, the obtained thrust was nondimensionalized and averaged to obtain the average thrust coefficient over one cycle. The comparative results are shown in Figure 8.
Figure 8 demonstrates that the simulated calculation data align with the literature’s experimental data, exhibiting a significant level of concurrence. The highest relative error is below 5%, indicating the reliability of the numerical model and method proposed in this study.

6. Results and Analyses

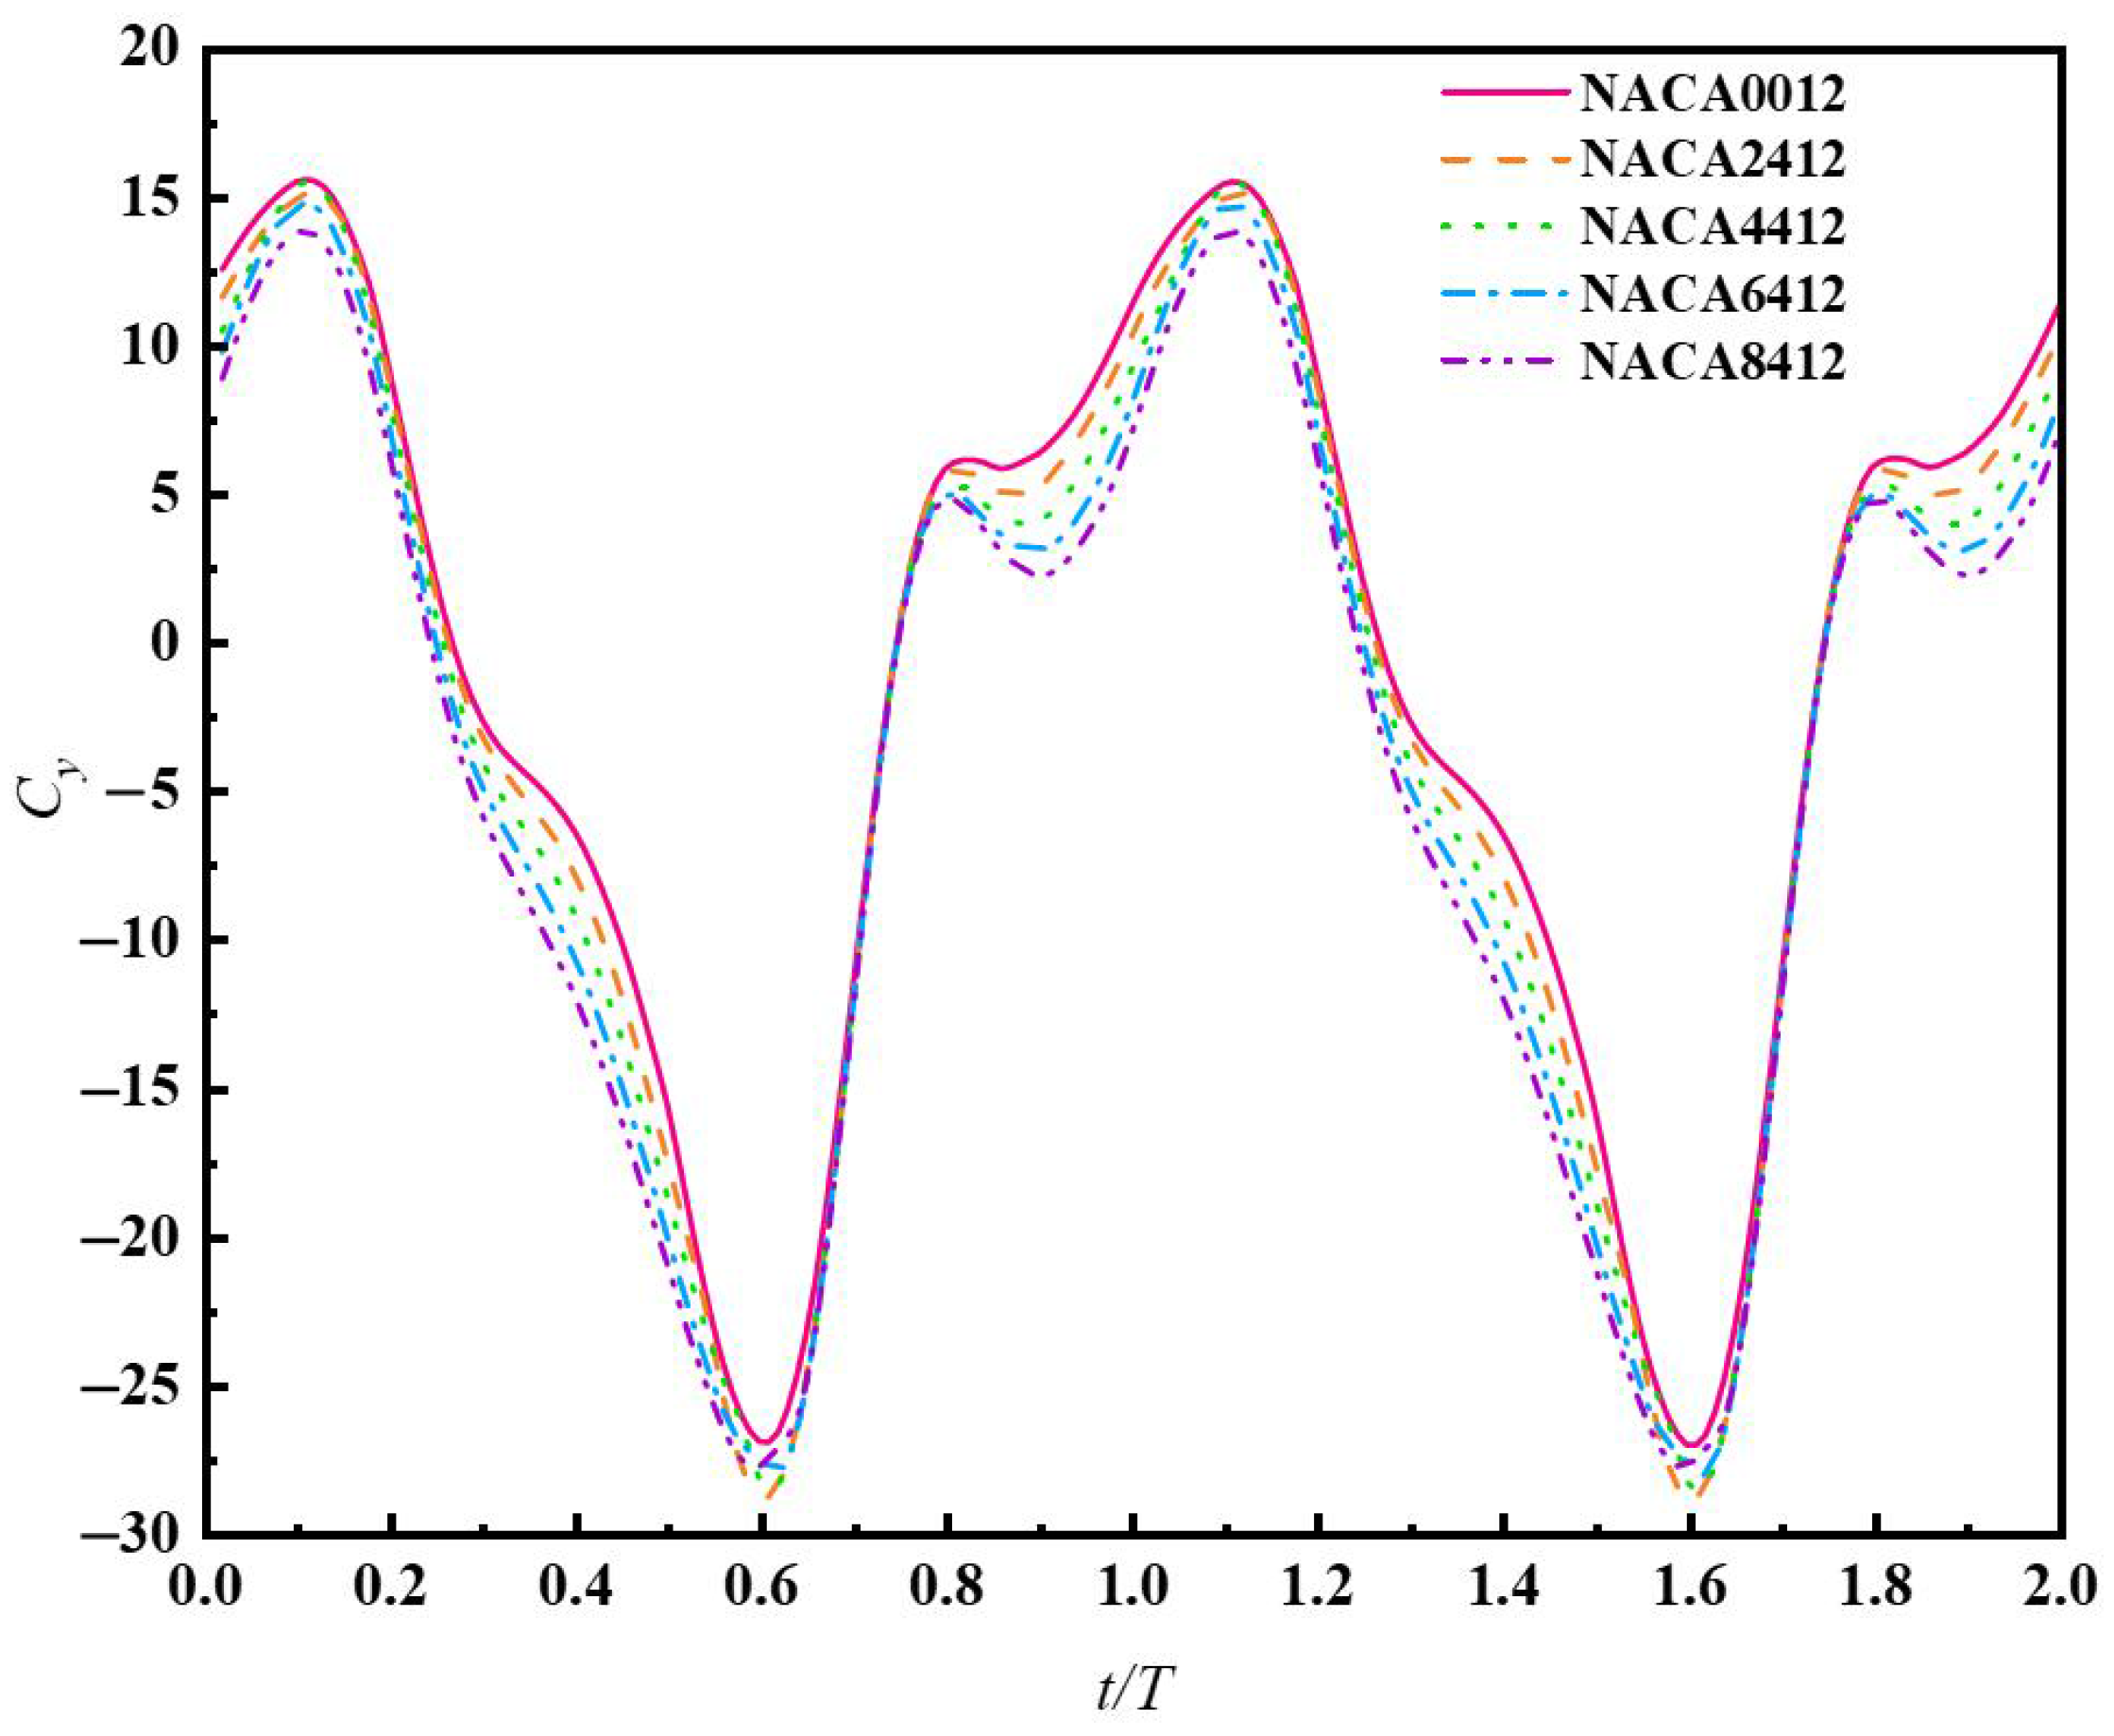
6.1. Analysis of the Influence of the Foil Camber on the Mechanical Performance of Flapping Hydrofoil Bionic Pumps

In order to analyze the influence of foil camber on the mechanical performance of flapping hydrofoil bionic pump devices, five sets of hydrofoil models with curvatures ranging from 0% to 8% were selected for simulation and research. The hydrofoil shapes are shown in Figure 3, and the foil parameters are presented in Table 1. The following motion parameters were set: flapping frequency f = 1 Hz, plunging amplitude Amax = 0.15 m, pitching amplitude θ = 30°, distance from the pitching axis to the leading-edge center of the foil l = 0.2c. The pressure inlet was set to zero. By monitoring the outlet section flow velocity and waiting for the motion to stabilize under its working conditions, two flapping cycles of the motions were selected. The instantaneous thrust and lift coefficients of the flapping hydrofoil bionic pump with respect to the wing profile curvature were plotted, as shown in Figure 9 and Figure 10.
From Figure 9, it can be observed that, within one cycle, the NACA foil’s instantaneous thrust coefficient exhibits two peaks and two valleys. The adjacent peak values of the same foil type differ significantly, but the values of the two adjacent valleys are close. The main reason for this is the asymmetry caused by the relative curvature of the foil. During the flapping hydrofoil motion, the concave surface of the curved foil type concentrates the thrust on the water, while the convex surface disperses the thrust, resulting in a notable disparity between the peak values of the two adjacent instantaneous thrust coefficients. For foils with different curvatures, as the relative curvature of the foil increases, there is a negative correlation between the first peak value of the instantaneous thrust coefficient within the same cycle and the foil curvature, while the second peak value shows a positive correlation with the foil curvature. The reason for this phenomenon is also attributed to the asymmetry in the shape of the foil’s leading edge caused by different curvatures. The difference in thrust concentration between the concave and convex surfaces of the foil is responsible for this behavior. Figure 11 shows that the foils with three different curvatures experience pressure clouds at the moment when the thrust coefficient reaches its maximum value, and the pressure distribution map confirms this observation. Taking the curvature of the NACA6412 foil as the threshold, when the curvature is less than this threshold, the instantaneous thrust coefficient of the flapping hydrofoil is always greater than zero, indicating that the flapping hydrofoil contributes to propulsion throughout the entire process. When the curvature is greater than this threshold, the instantaneous thrust coefficient of the flapping hydrofoil becomes negative, indicating that the hydrofoil experiences resistance from the water flow.
Figure 10 shows that flapping hydrofoils with varying curvatures display a single peak and two troughs in each motion cycle. Notably, the magnitude of the first trough is bigger than that of the peak. Considering the flapping hydrofoil motion, different curved foils exhibit similar cyclic variations in the instantaneous lift coefficient. It gradually increases during the upstroke motion to a maximum and then decreases as it continues the movement to the maximum plunging amplitude (0.25 T), where the lift coefficient is almost zero. Subsequently, during the downward flapping motion, the lift coefficient increases continuously in the opposite direction until reaching the maximum value. Comparing the instantaneous lift coefficients of flapping hydrofoils with different foil curvatures reveals that the main difference lies in the magnitude of the extrema. By comparing Figure 9 and Figure 10, it is evident that at a frequency of 1 Hz, within the range of 0%c to 8%c, an increase in curvature leads to a higher maximum value of the instantaneous thrust coefficient. However, the maximum value of the instantaneous lift coefficient decreases. The curvature of the foil can effectively enhance the maximum value of the instantaneous thrust coefficient, with a maximum enhancement of 31.25%. However, it does not significantly affect the enhancement of the instantaneous lift coefficient.

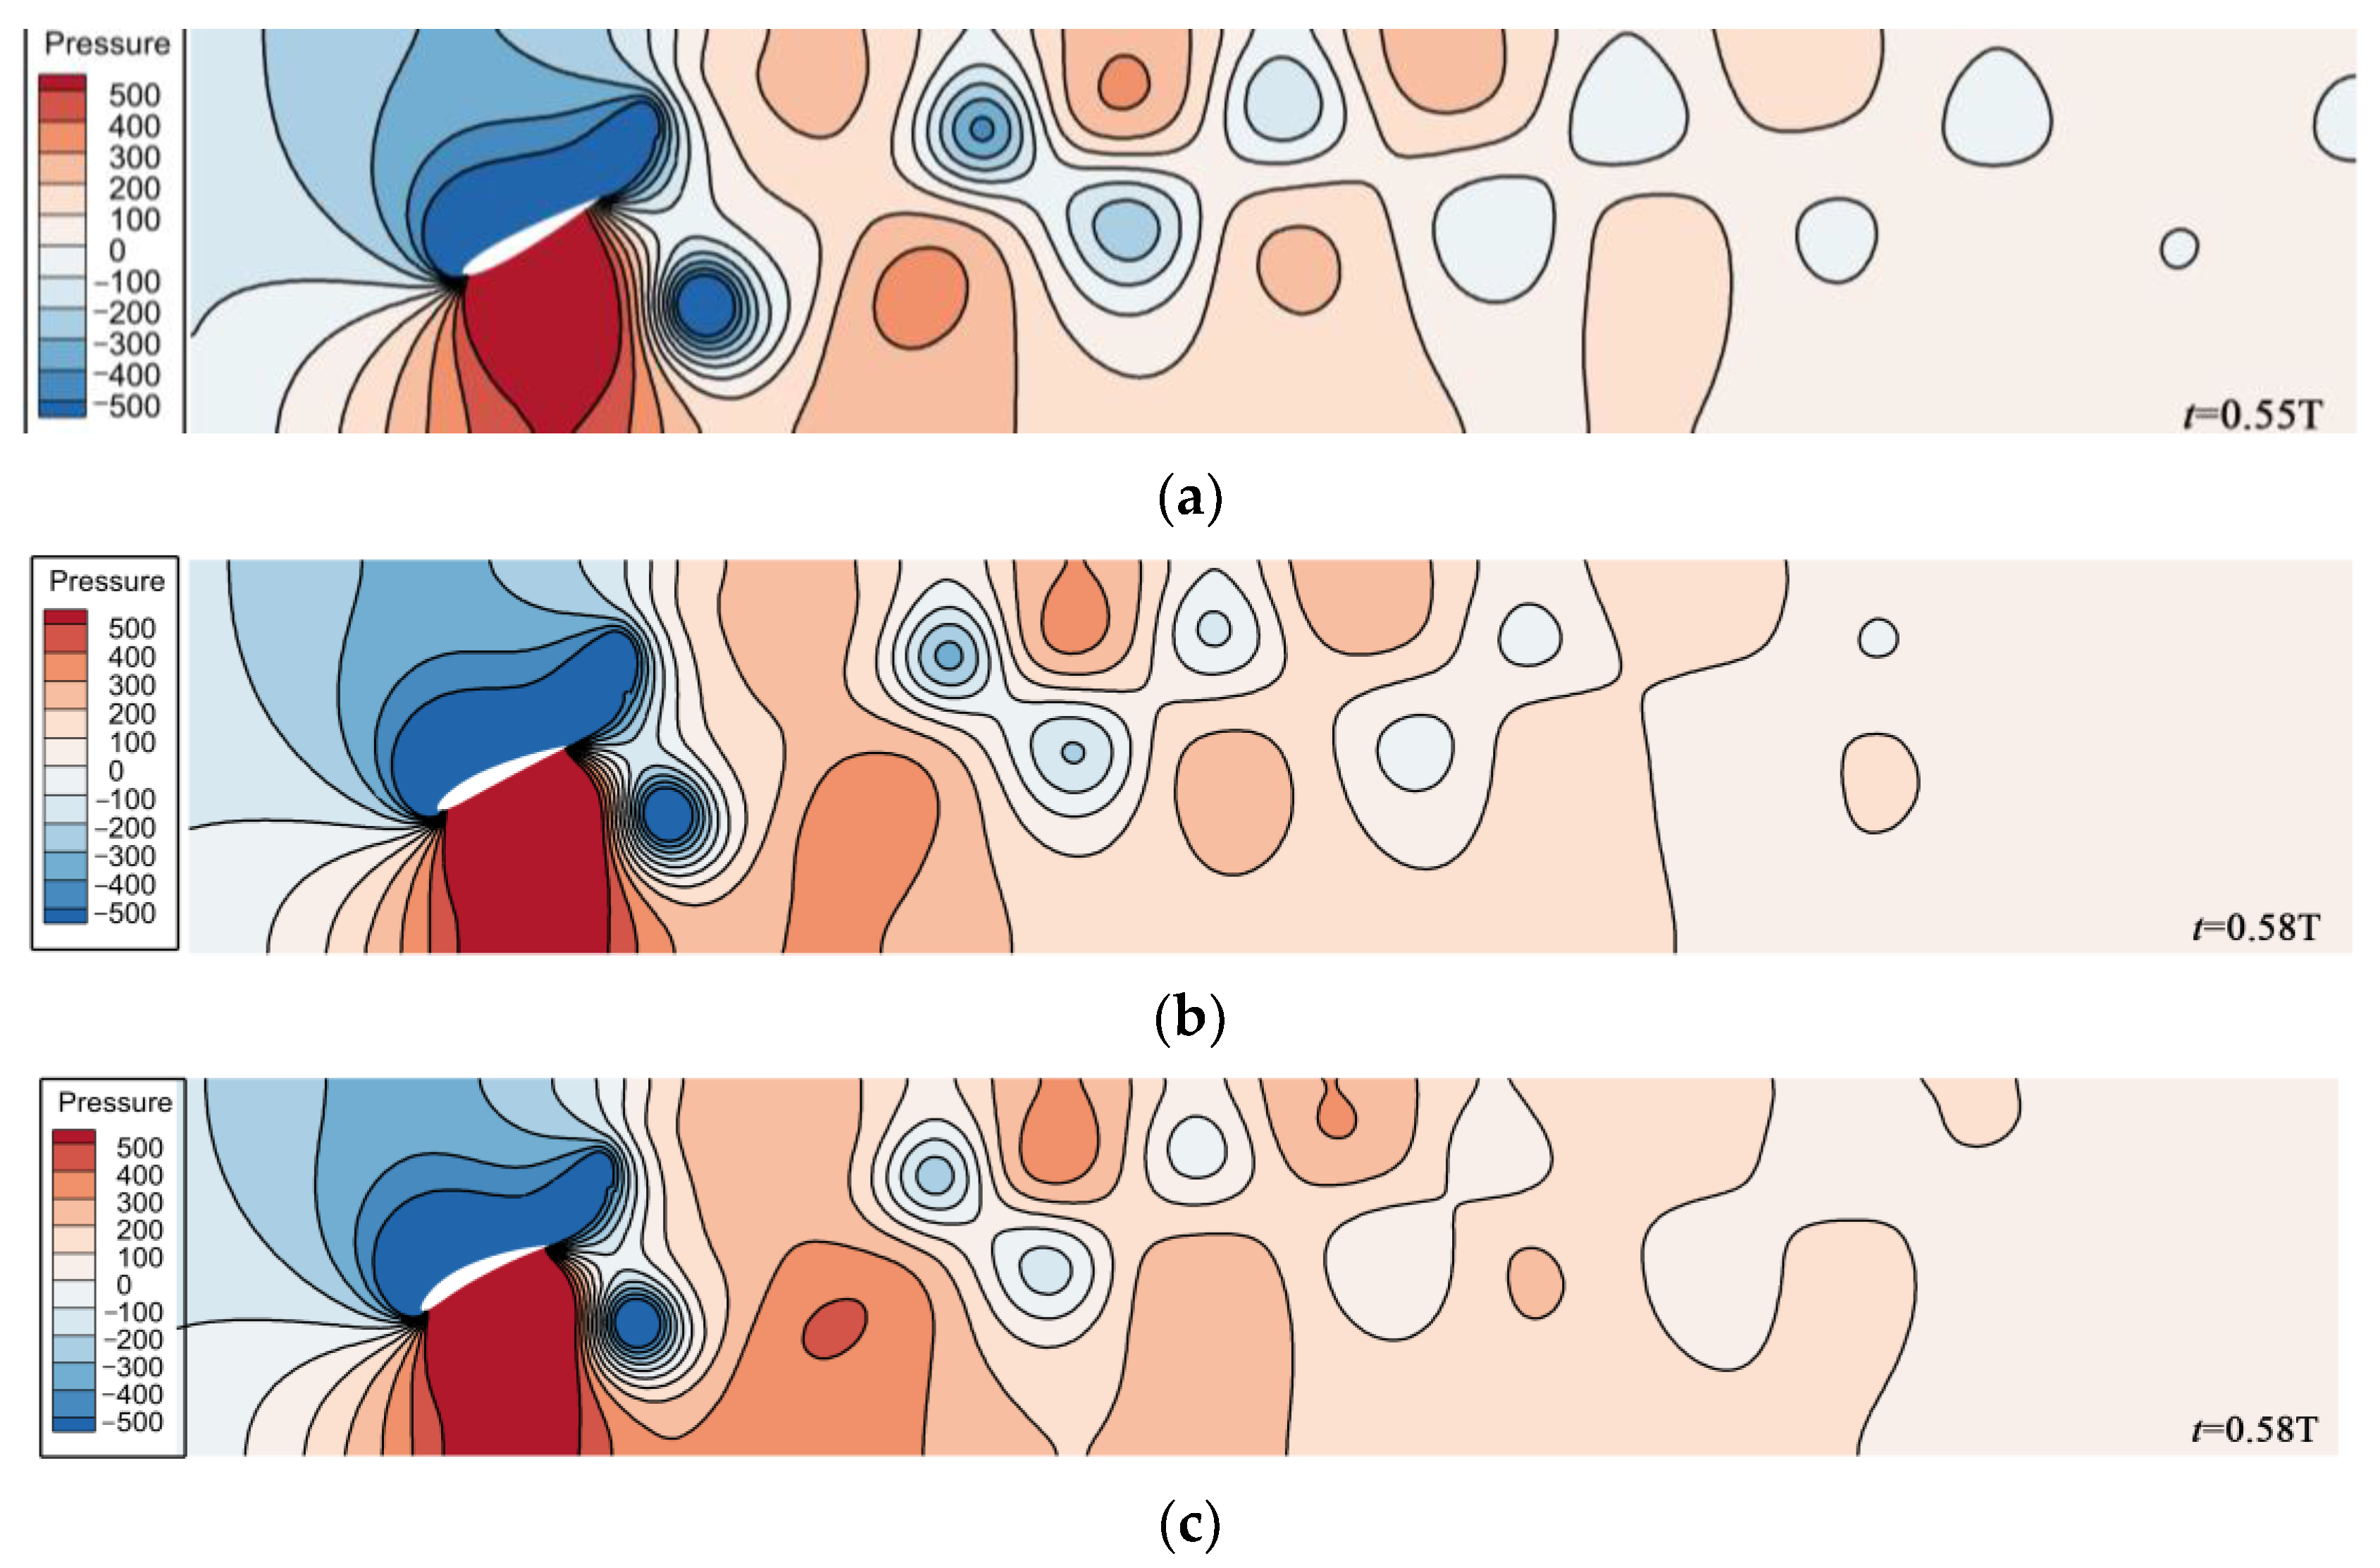
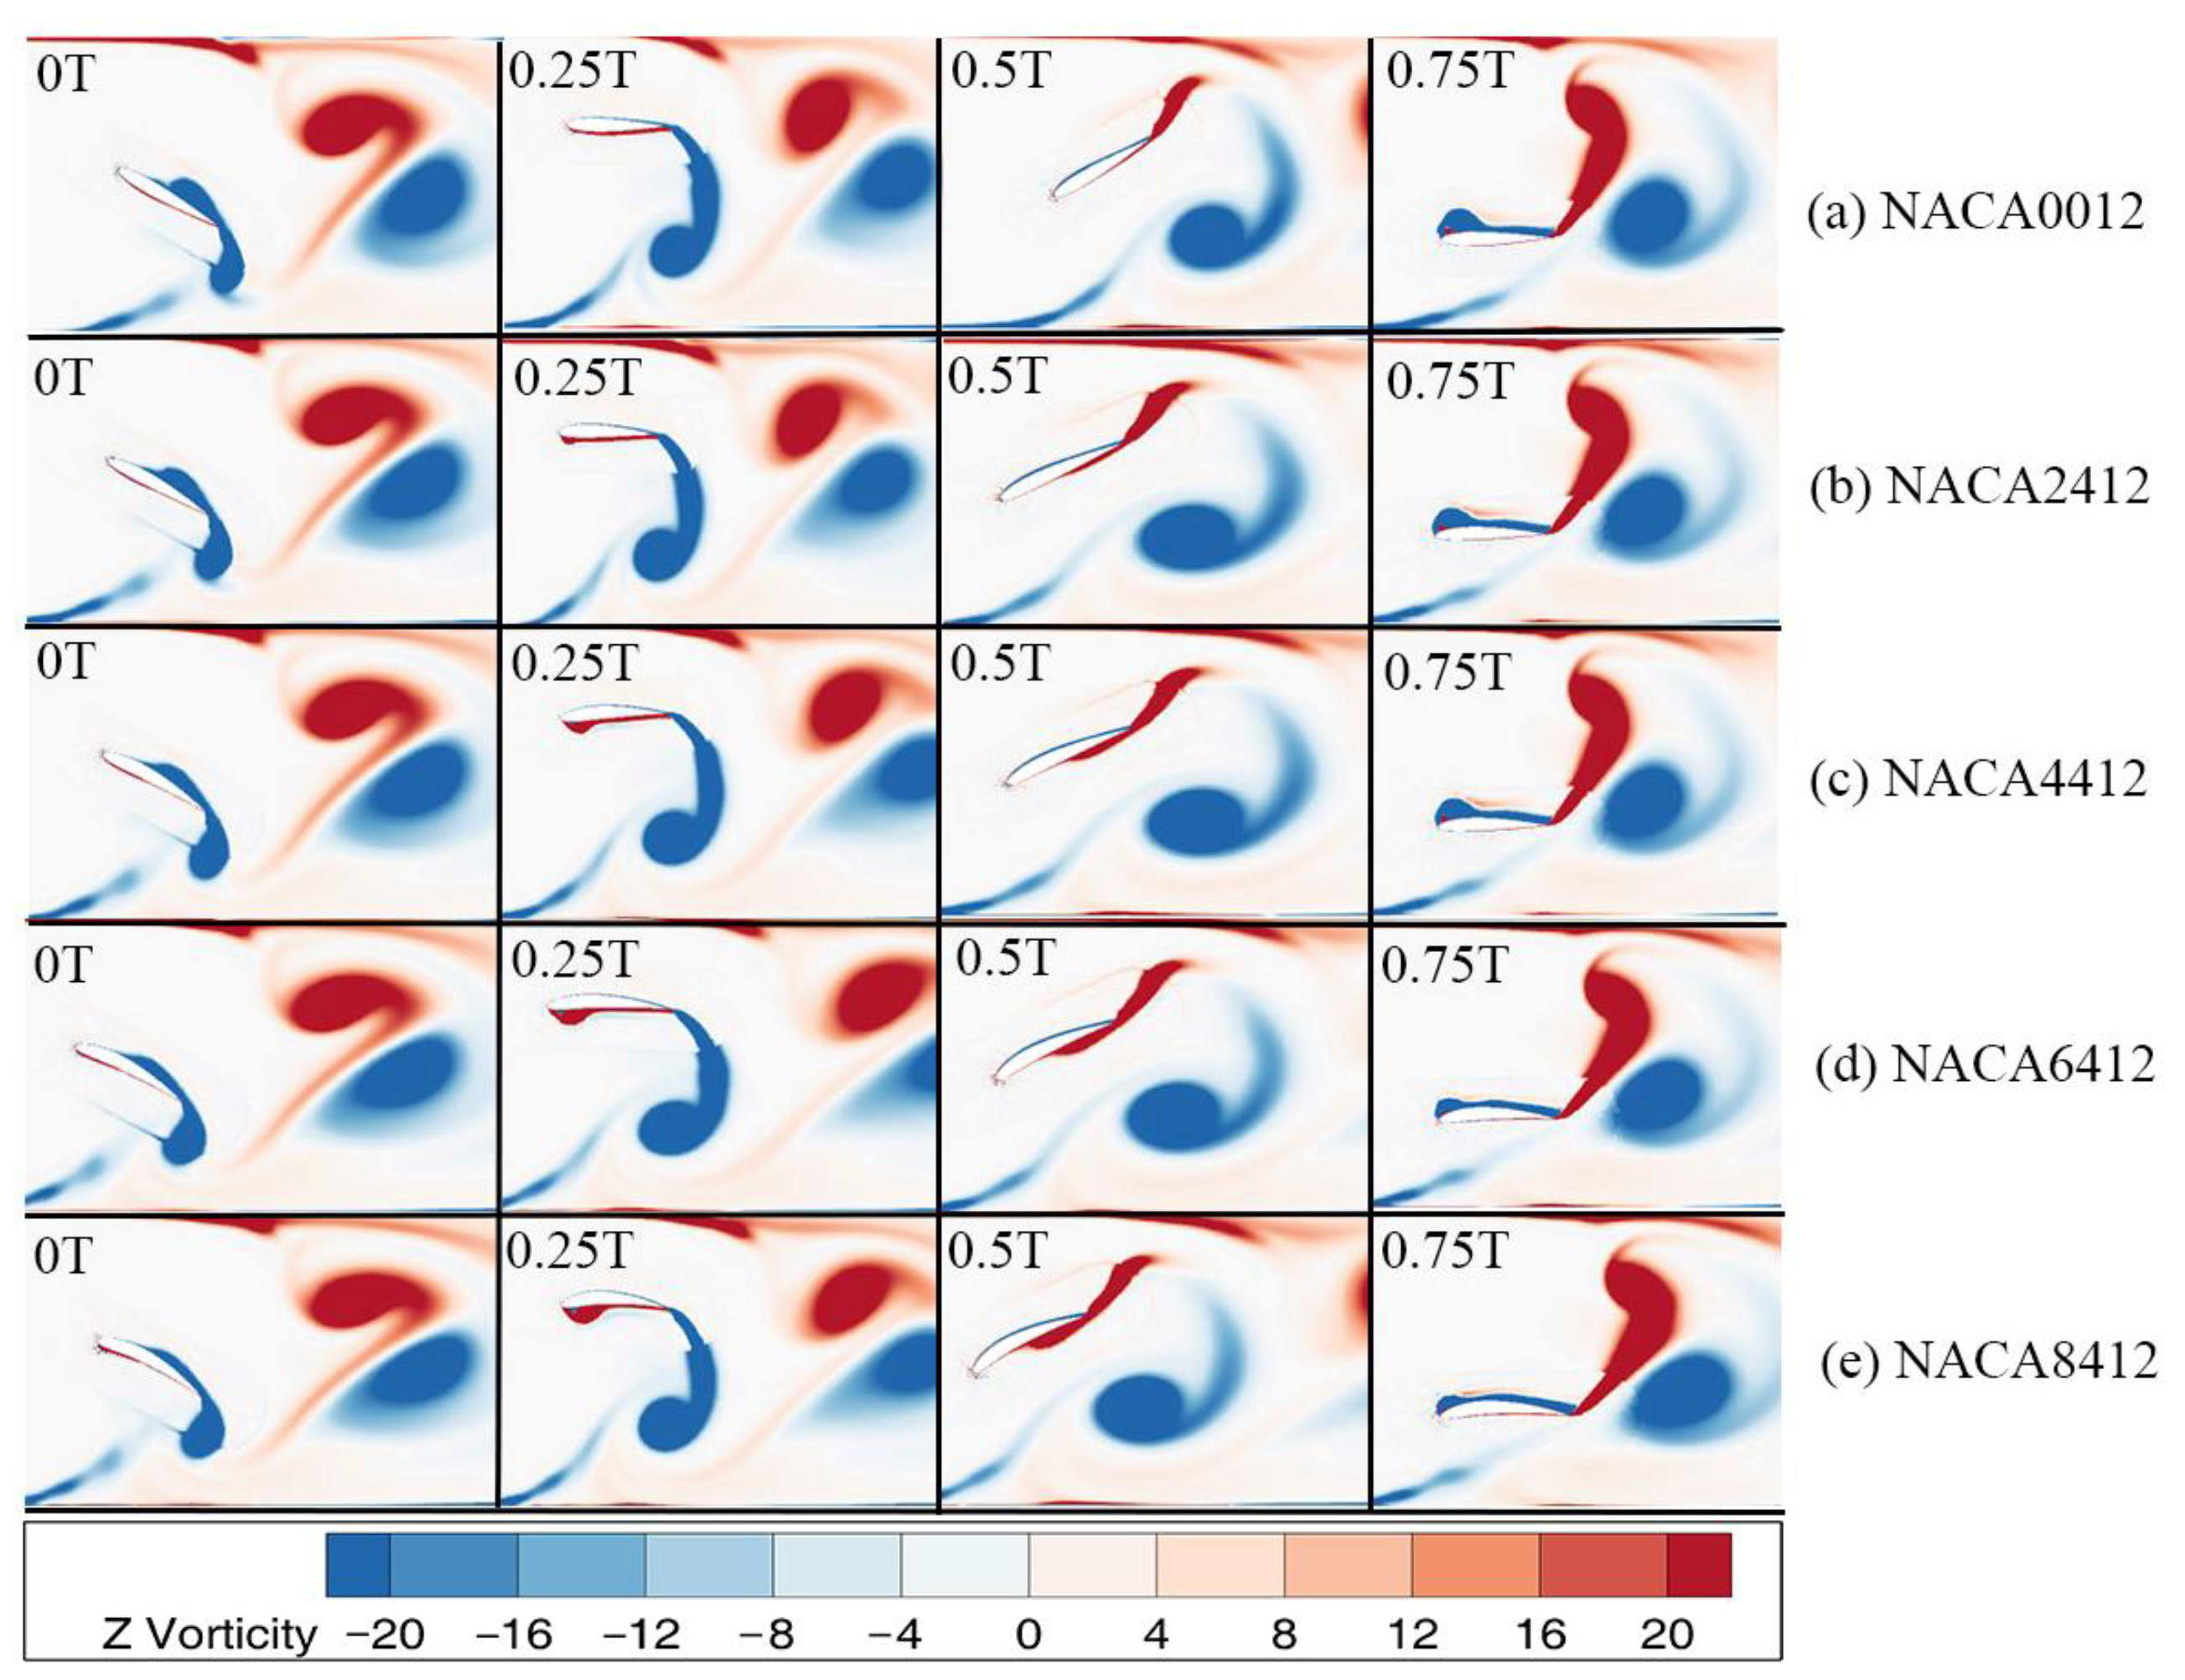
6.2. Analysis of the Influence of Different Foil Curvatures on the Vortex Structure of the Hydrofoil Tail

Figure 12 shows the distribution of vorticity at various key times (0 T, 0.25 T, 0.5 T, 0.75 T) throughout a single flapping cycle. This analysis was conducted on hydrofoils with varying foil curvatures while maintaining a flapping frequency f = 1 Hz. The figure demonstrates that hydrofoils with varying foil curvatures produce a double-row anti-Kamen vortex, resulting in the generation of thrust. The vortex patterns created by hydrofoils with varying foil curvatures are generally similar. However, these vortices tilt upwards and eventually move towards the wall as they propagate downstream, leading to a loss of vortices. When examining the vorticity distribution of hydrofoils with varying foil curvatures, it becomes evident that greater foil curvature results in reduced vorticity on the upper surface (positive vortices) and increased vorticity on the lower surface (reversal vortices) of the hydrofoil. Due to the asymmetry in the strengths of the two vortices, their interaction improves the inclination of vortex motion, thereby reducing vorticity loss during downstream propagation. This observation aligns with the velocity contour distribution in Figure 13.

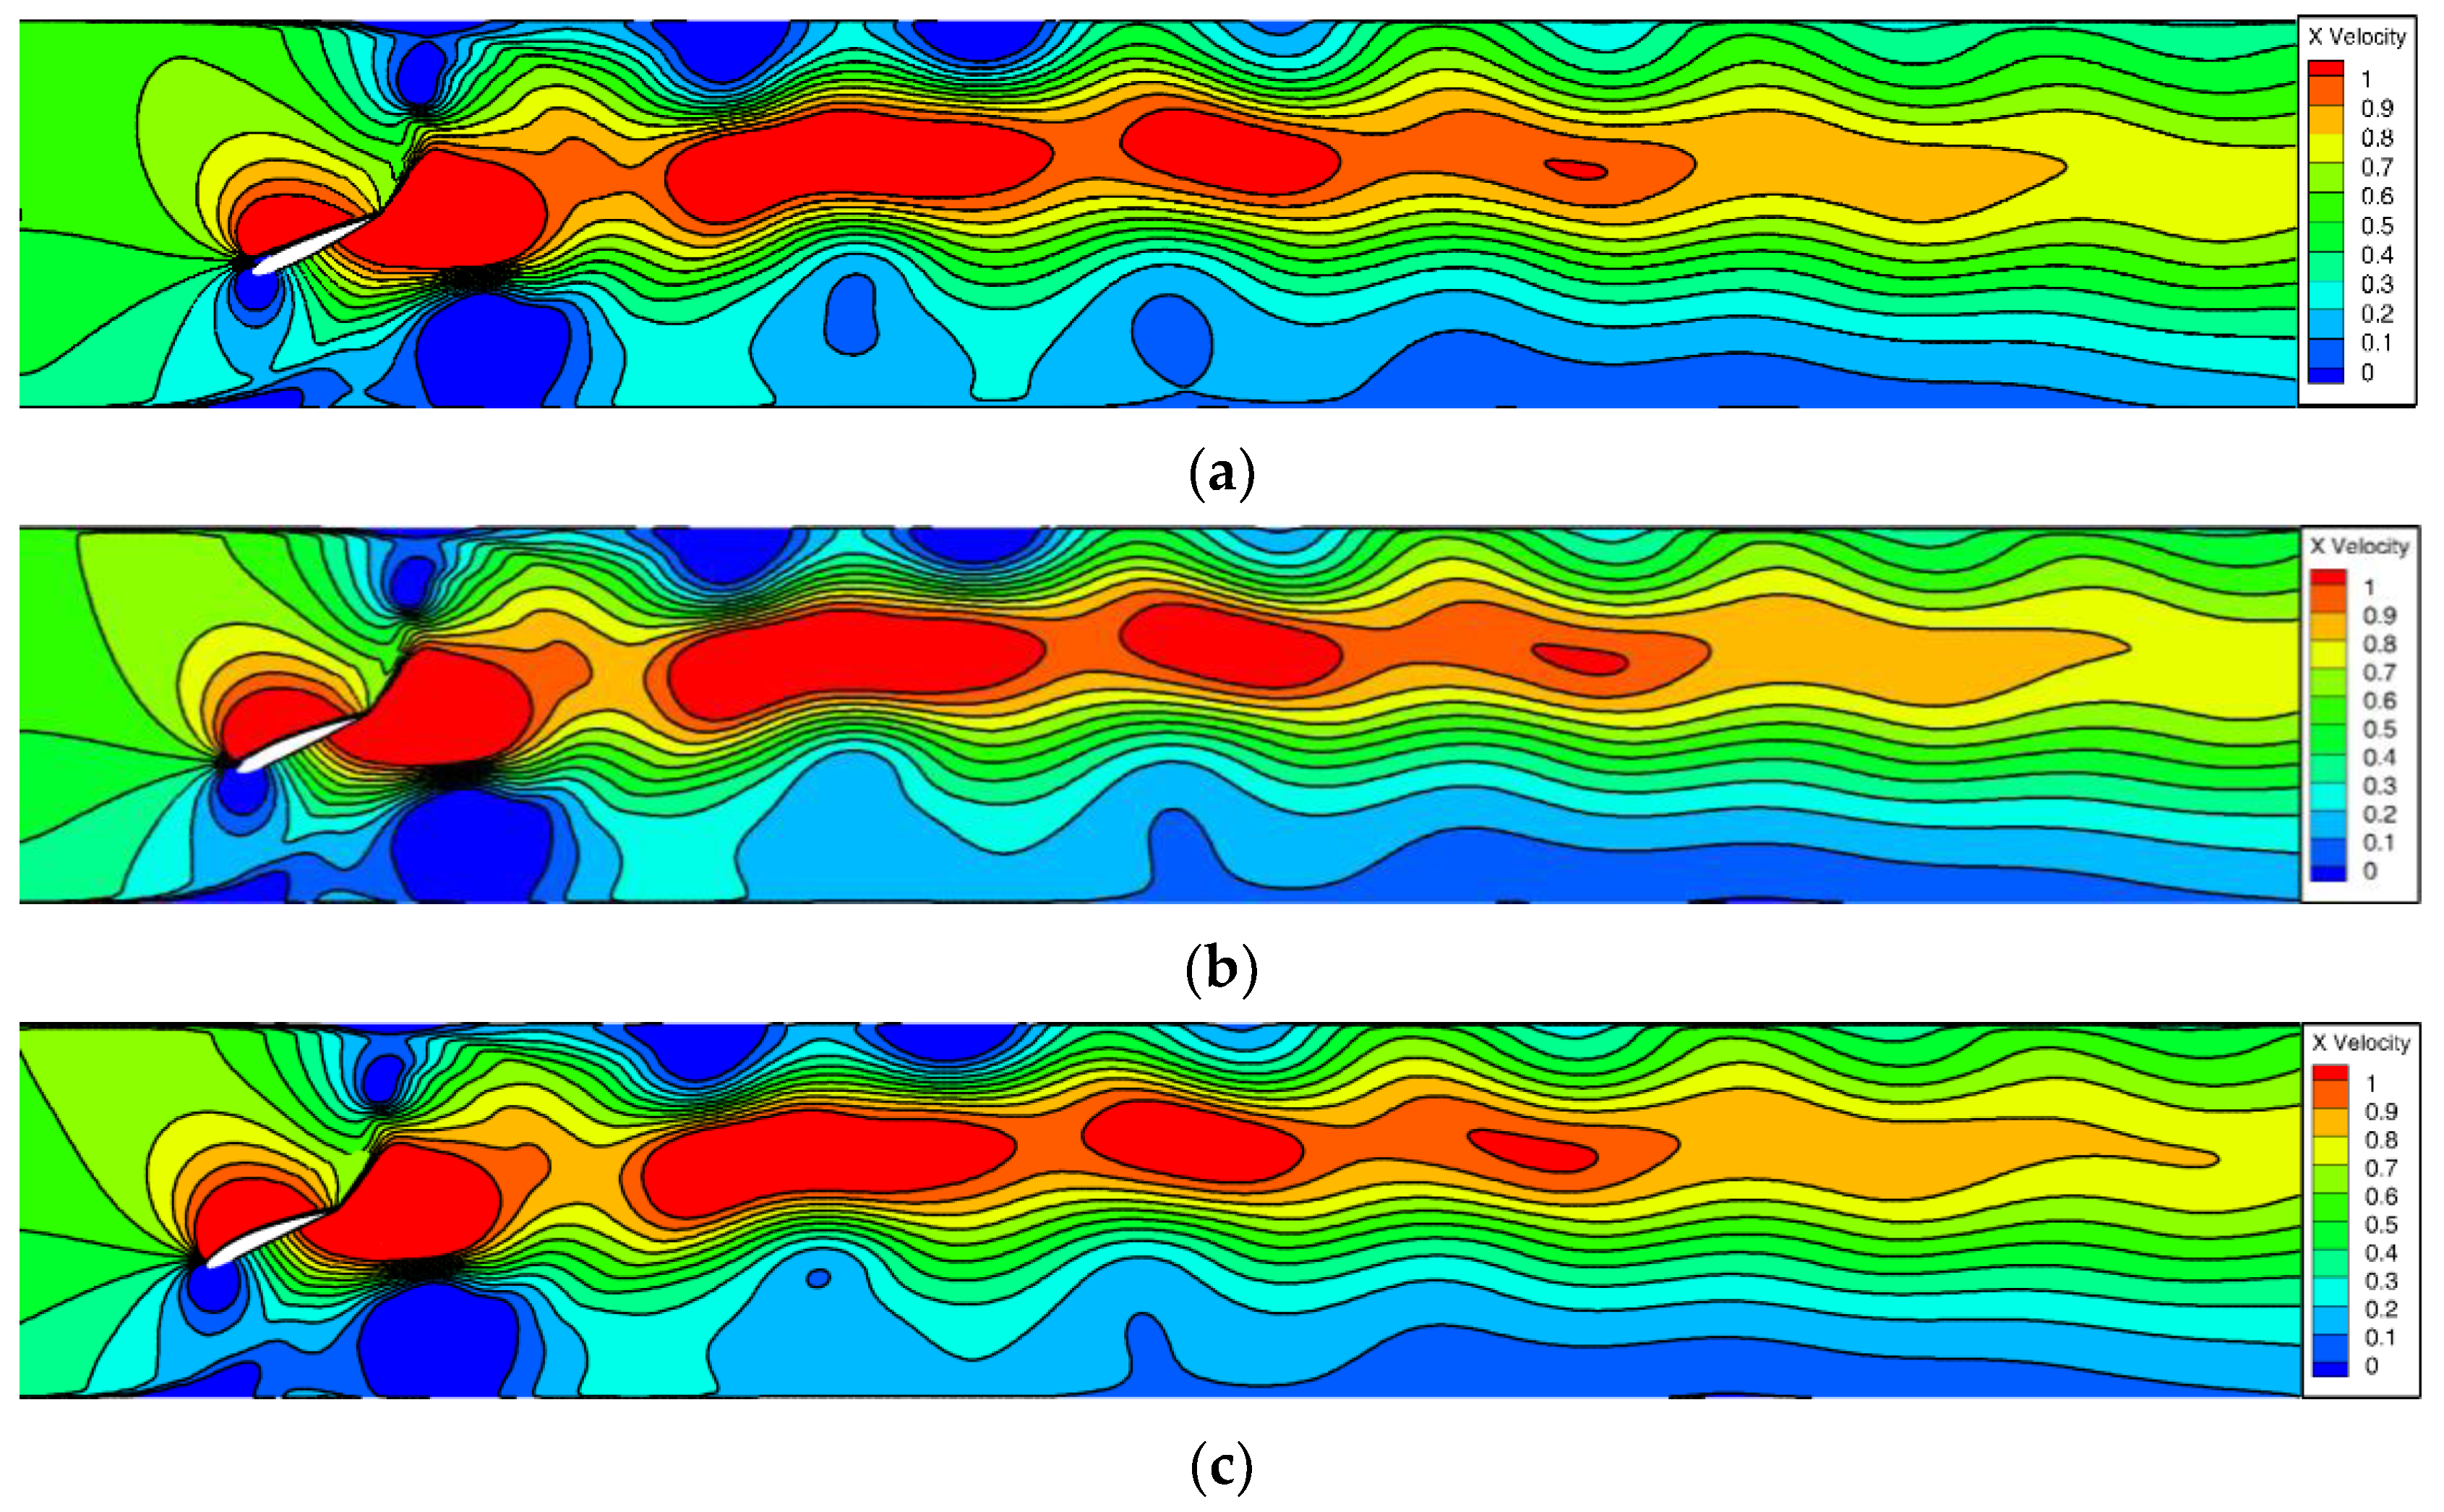
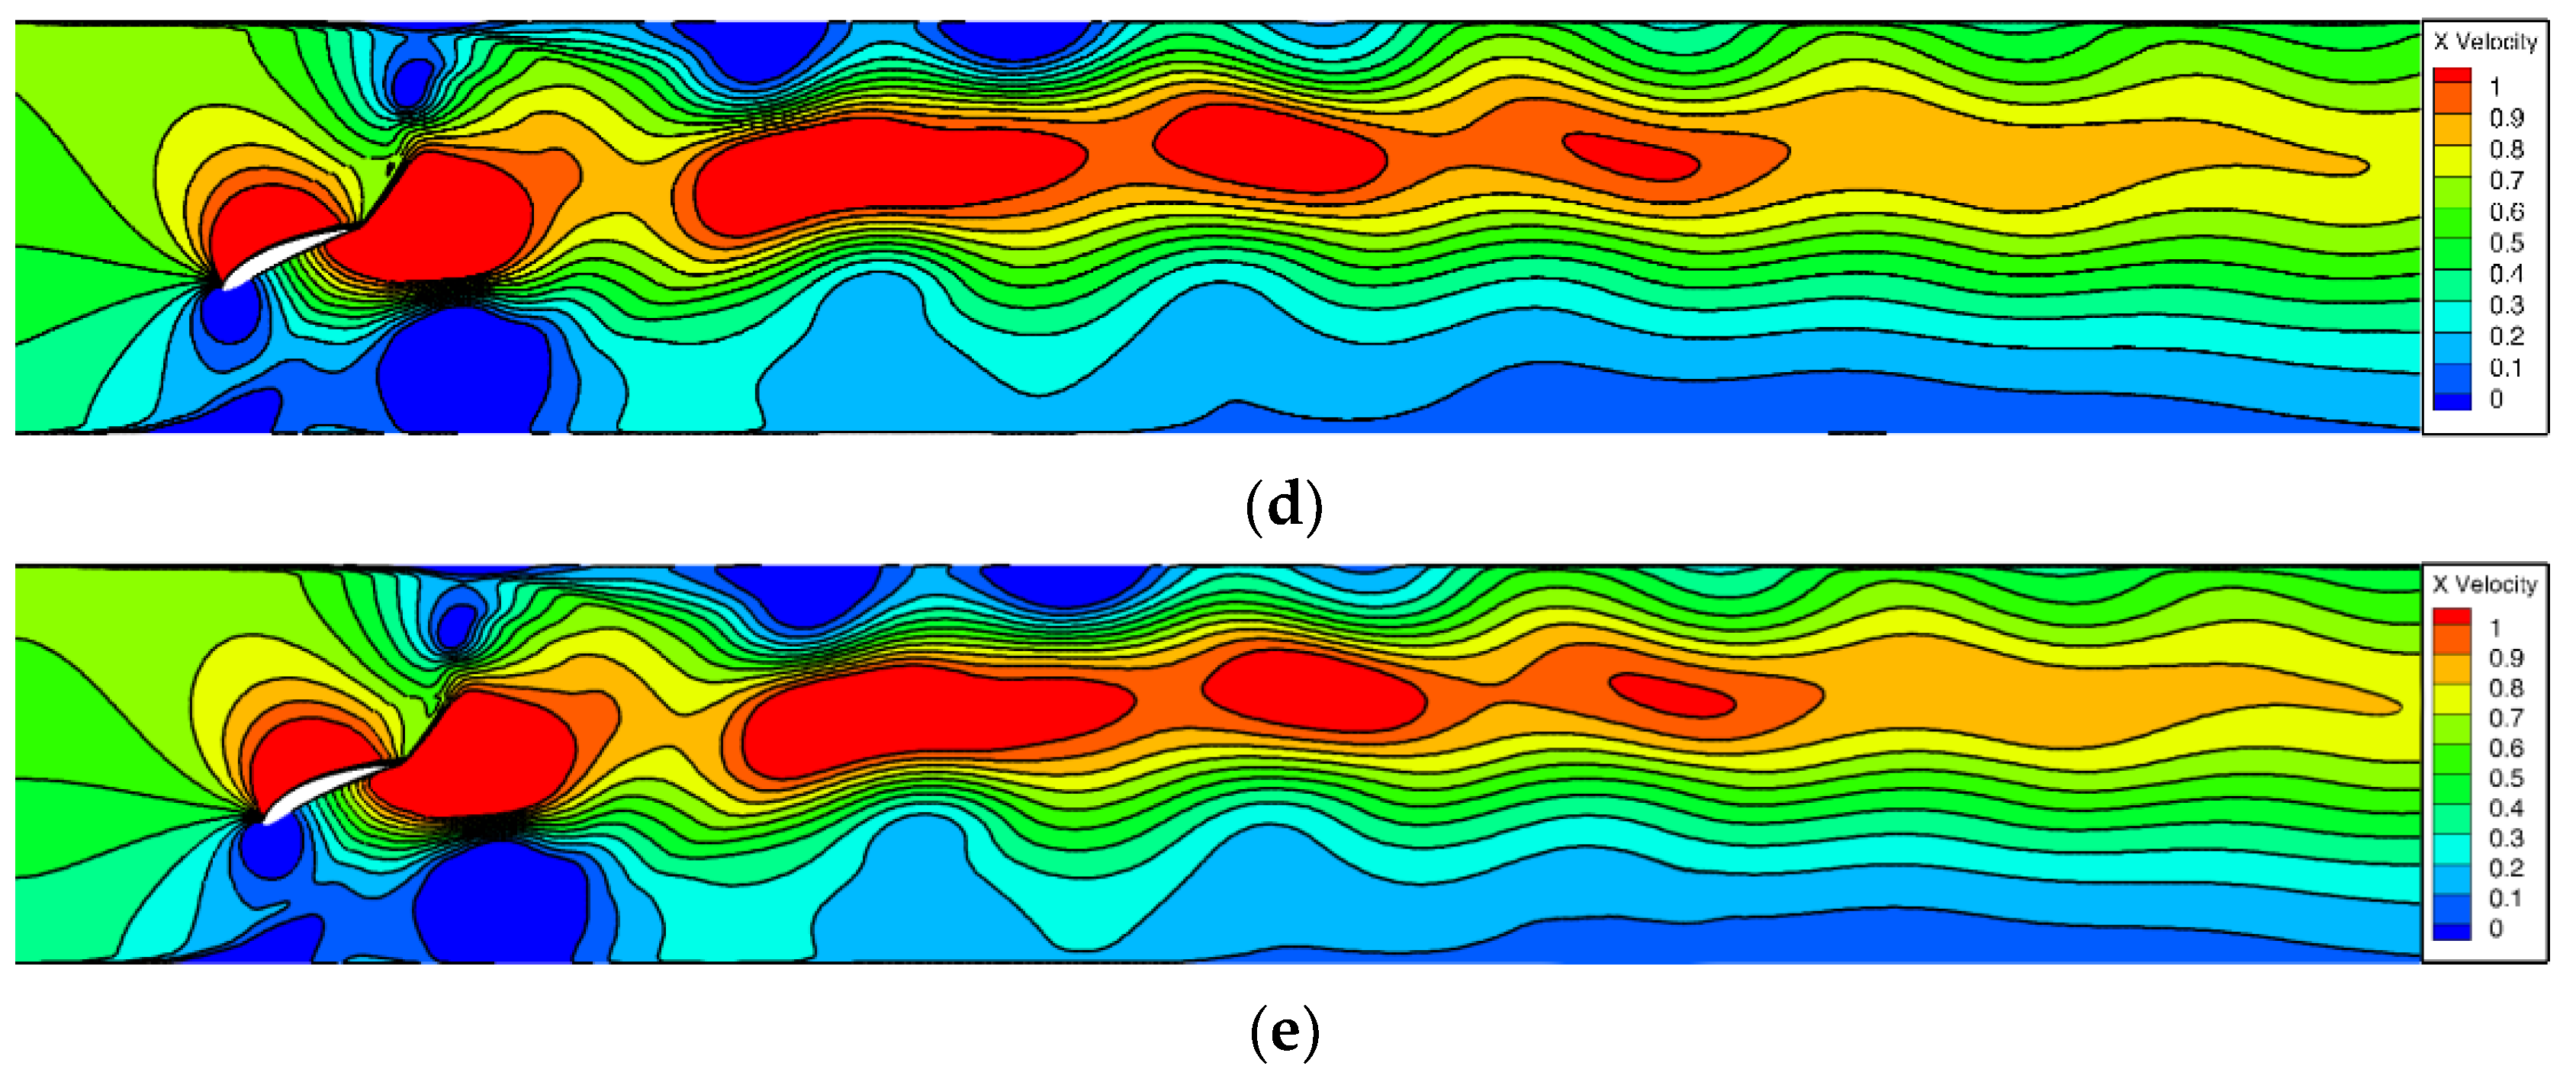
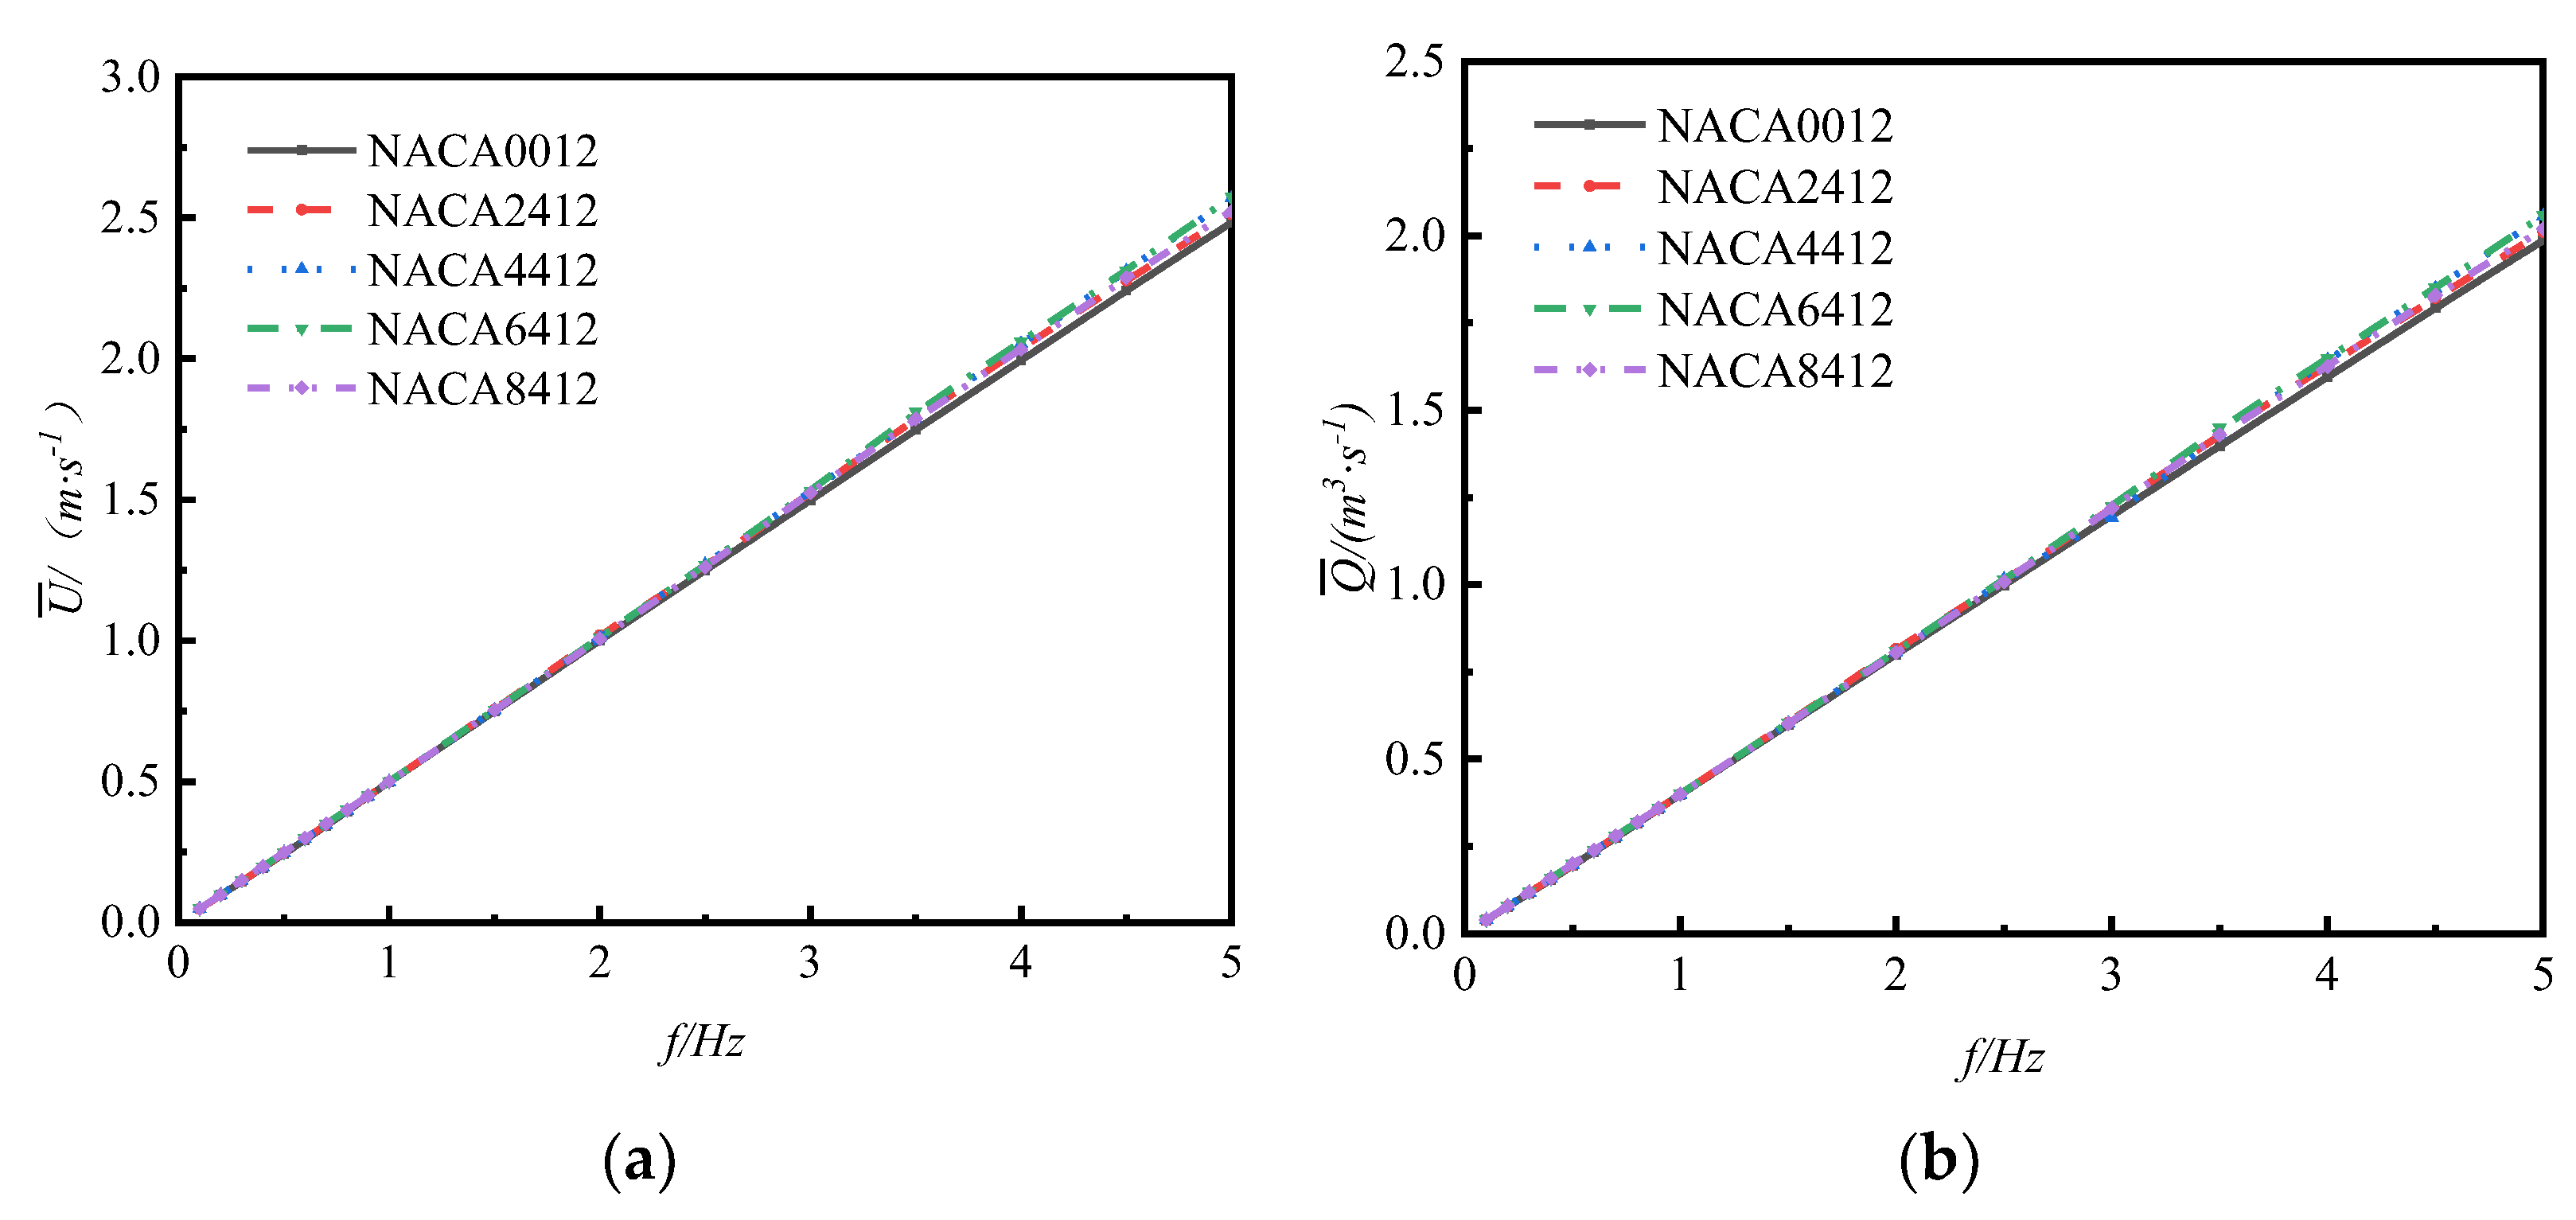
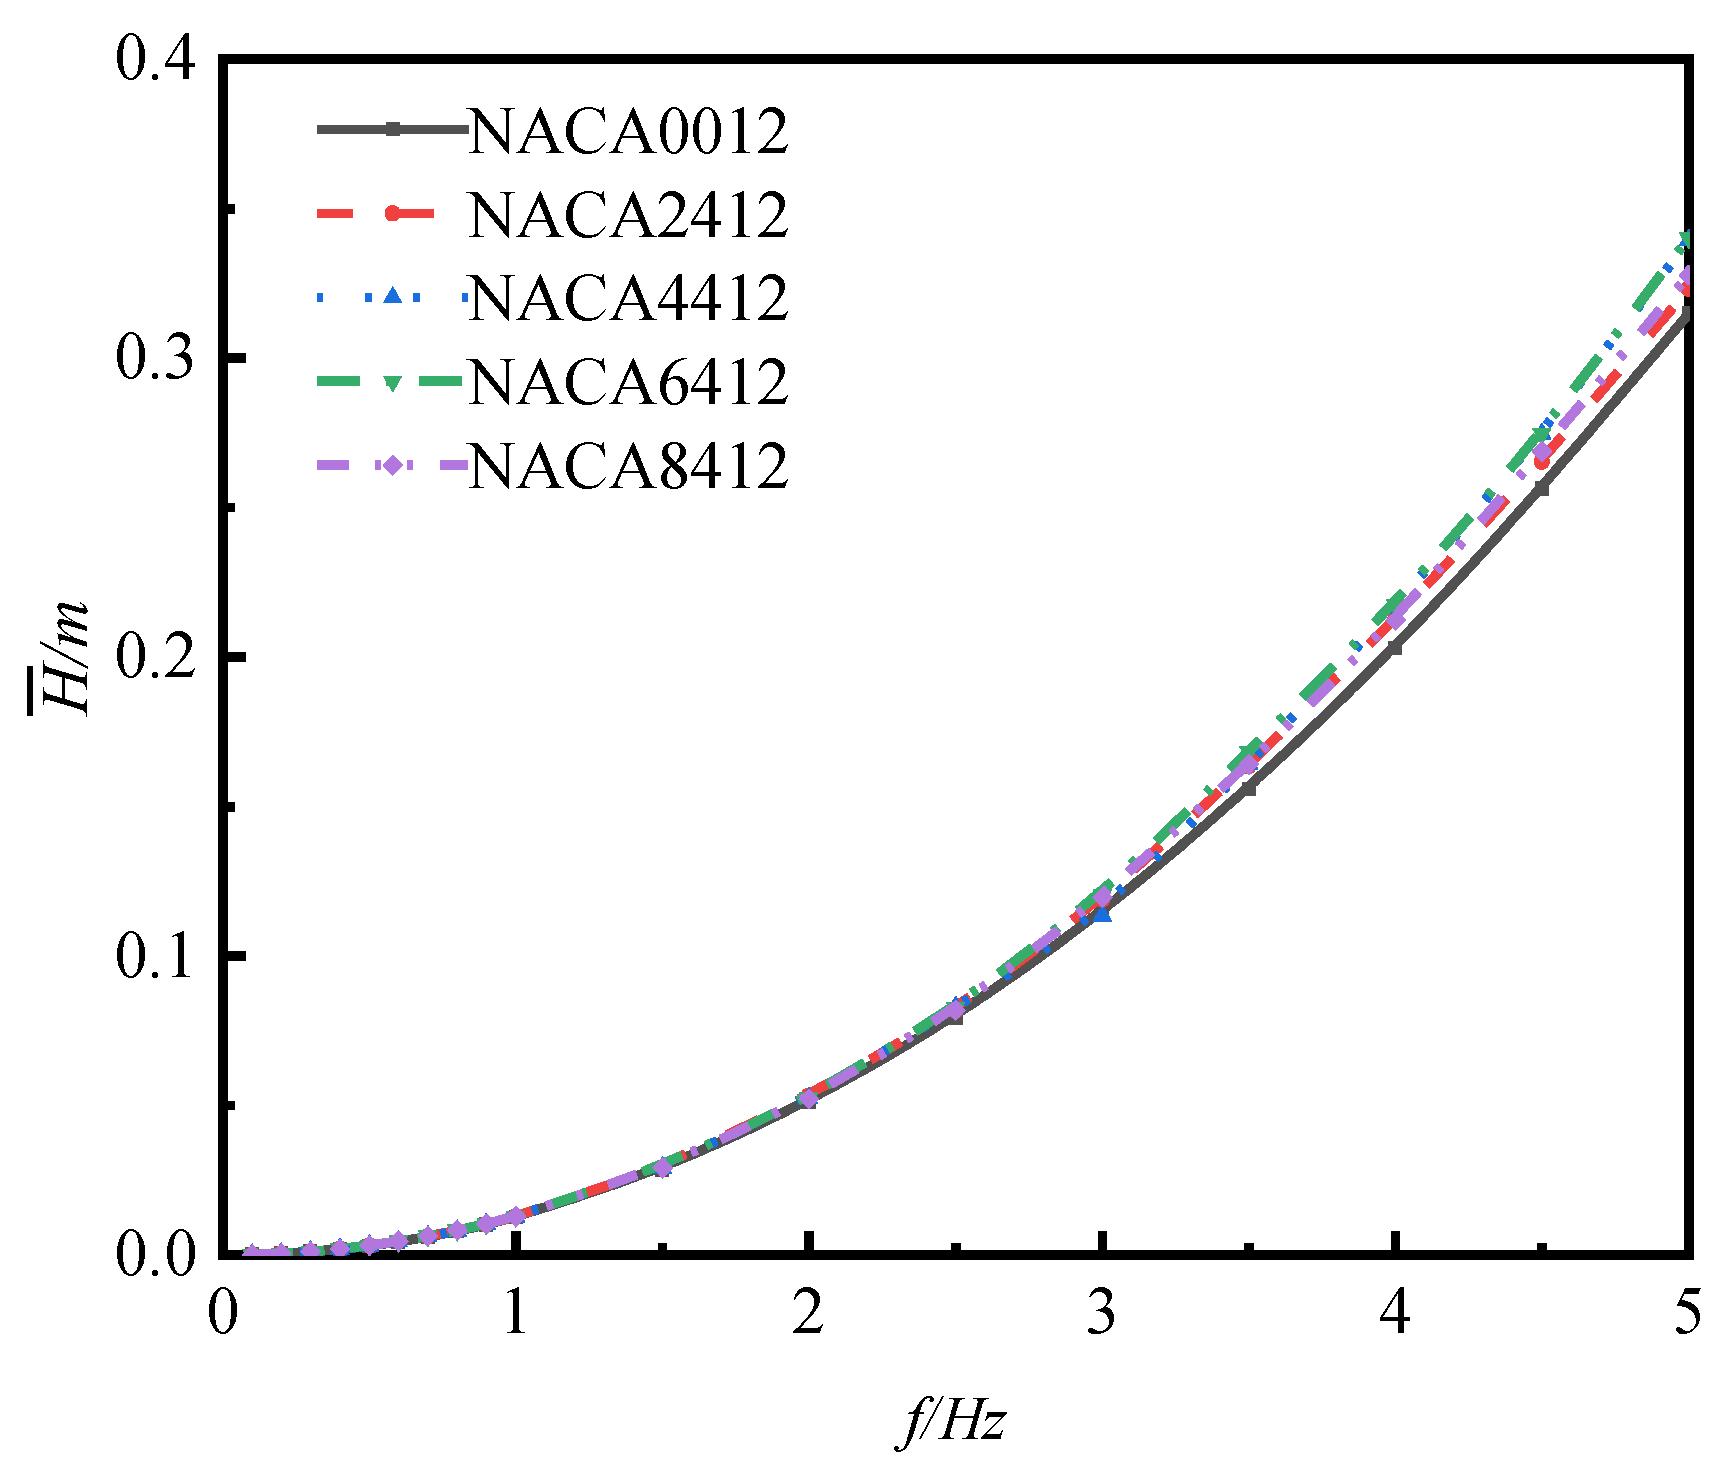
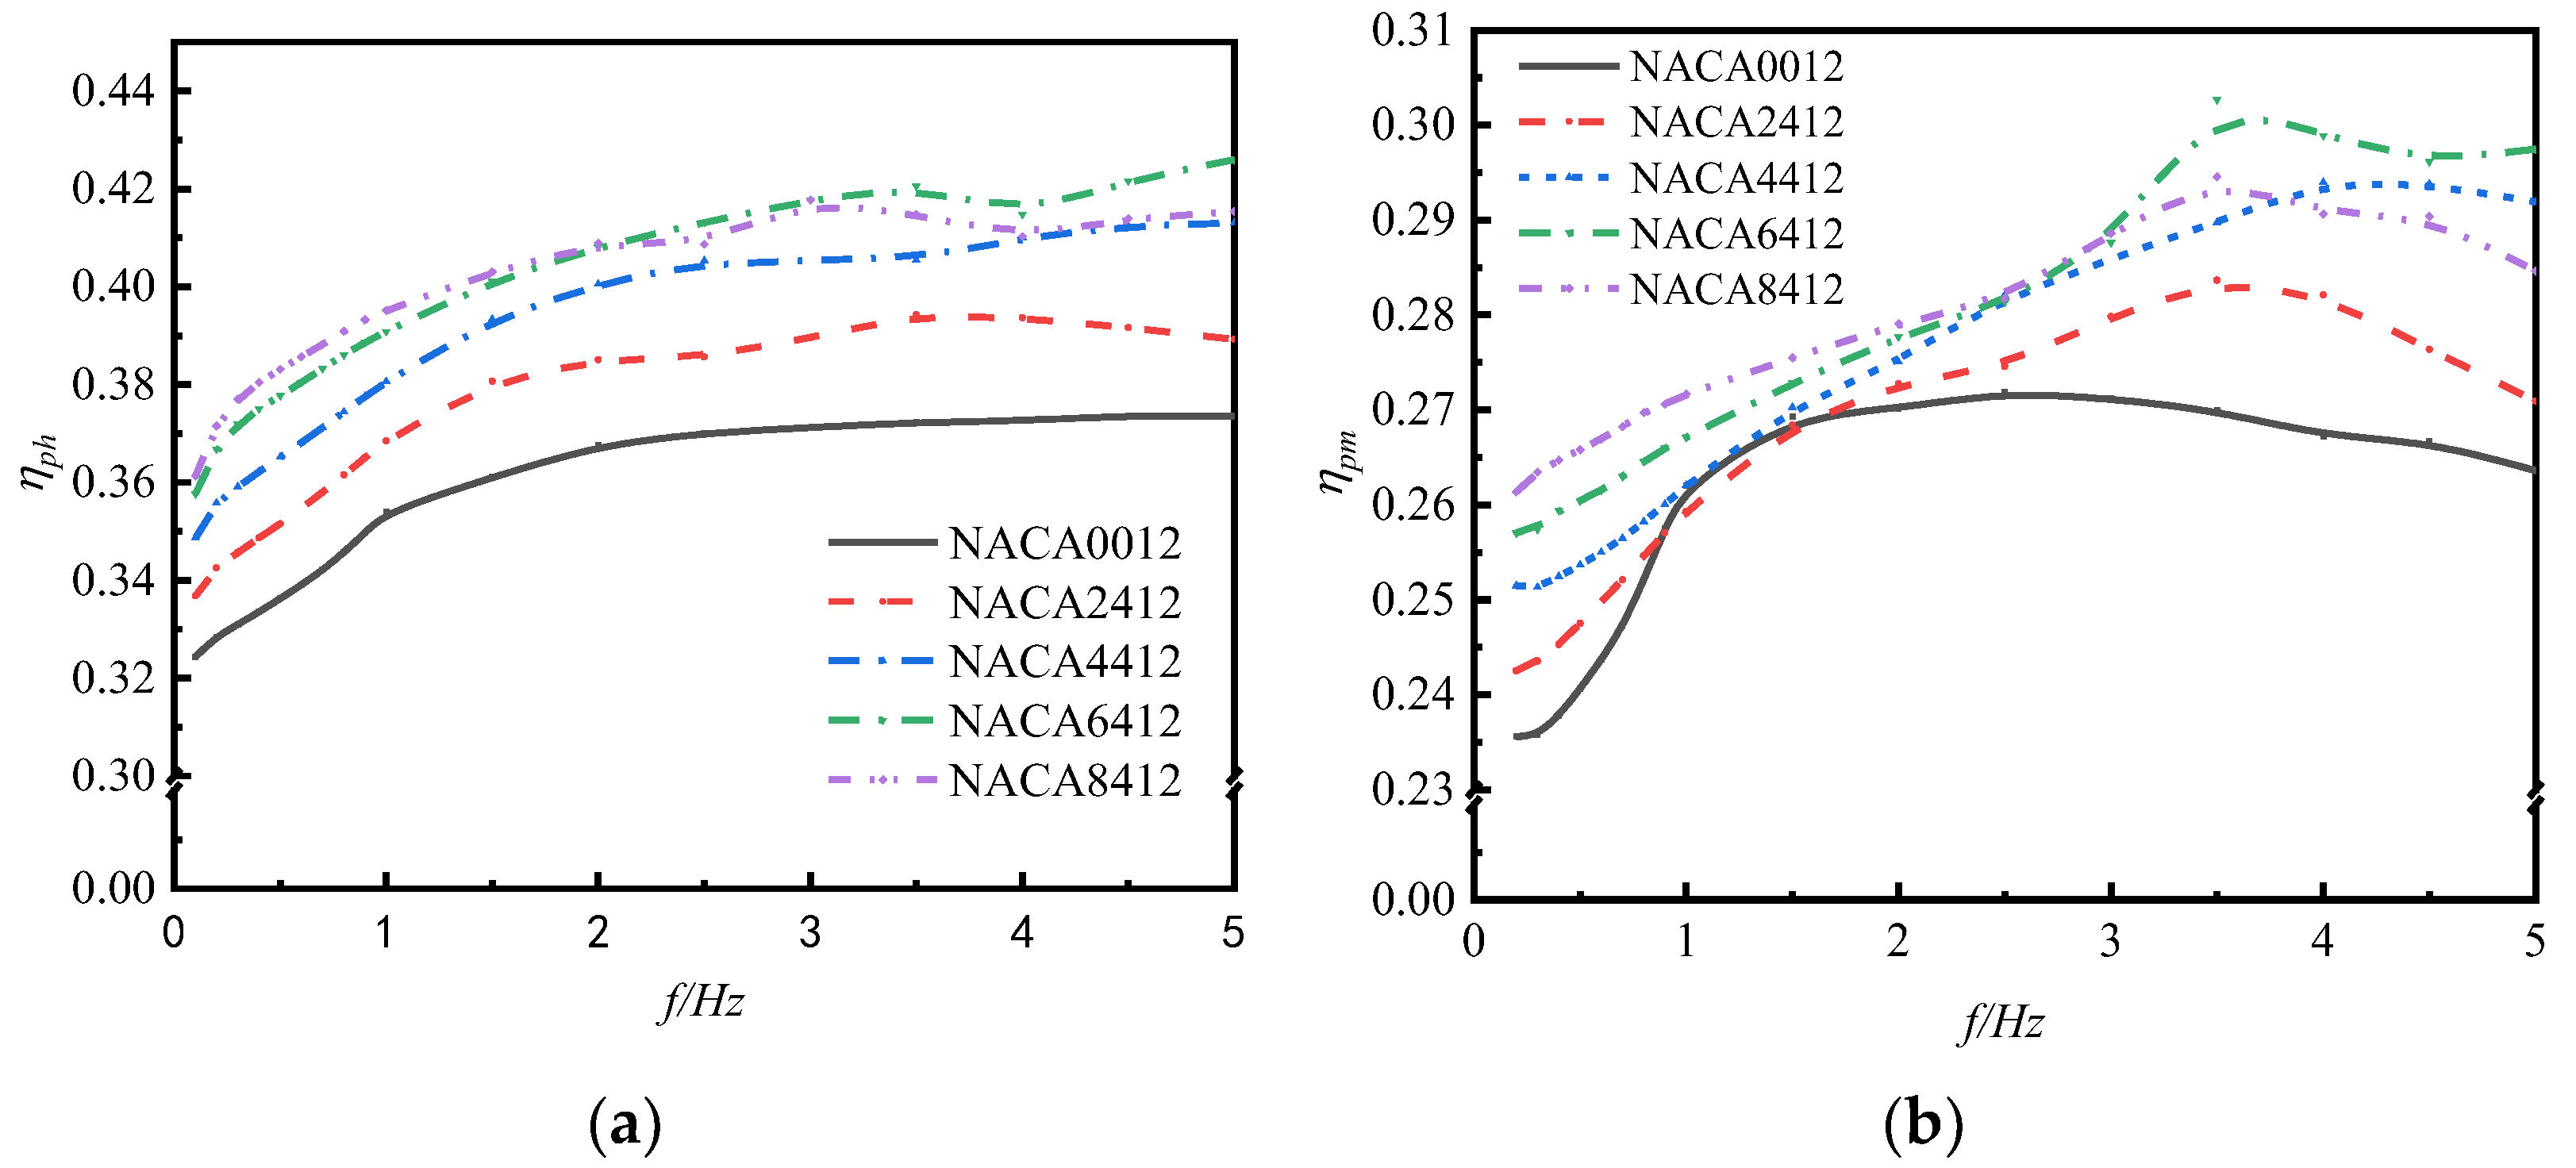
6.3. Impact Analysis of Different Foil Curvatures on the Pumping Performance of the Hydrofoil

To investigate the correlation between foil curvature and the performance of the flapping hydrofoil bionic pump device, we also consider a flapping hydrofoil oscillation frequency f = 1 Hz. Figure 13 illustrates the velocity distribution of five flapping hydrofoils, each with a different foil curvature, all flapping simultaneously. Upon comparison, it is observed that the distribution of the five velocity flow fields is essentially identical. The flapping motion of the hydrofoil causes an increase in the incoming water velocity and generates a jet at the tail of the hydrofoil. The jet velocity exhibits a decreasing gradient distribution from the middle to the sides of the wall. As the jet propagates forward, it tends to be biased towards the side of the flow channel. However, there is a difference between the NACA8412 and NACA0012 foils. The NACA8412 foil, which has a greater curvature, has a smaller low-velocity zone near the lower side of the wall compared to the NACA0012 foil. In other words, the greater the curvature of the foil, the wider the range of water being pushed longitudinally in the direction of the y-axis. Combined with the analysis of Figure 12, the reason may be that the foil curvature of the flapping hydrofoil is changed to produce an asymmetric vortex in the flapping cycle, which makes the velocity direction of the vortex induced by the tail of the flapping hydrofoil change, and this change slows down the loss of vortex in the vortex in the process of downstream propagation, as can be seen in Figure 13; the NACA0012 foil experiences the fastest decrease in water flow velocity, while the NACA8412 foil experiences the slowest decrease. The curvature of the foil ranges from 0%c to 8%c, and as the curvature increases, the rate of velocity decrease in the x-direction slows down. Additionally, the higher the velocity in the high-speed zone of the intermediate basin, the greater the distance it extends.
To investigate the impact of various leading-edge curvatures on the pumping performance of the flapping hydrofoil pumping device, we analyze the changes in average flow rate, average flow velocity, pumping efficiency, and propulsion efficiency. This analysis is based on the assumption that the flapping hydrofoils are rigid. We consider five different curvatures and examine their effects at different oscillation frequencies. To simulate the flapping hydrofoil, the swing frequency is set to range from 0.1 Hz to 5 Hz. The frequency is increased gradually from 0.1 Hz to 1 Hz, with increments of 0.1 Hz. Then, it is increased from 1 Hz to 5 Hz, with increments of 0.5 Hz. Additionally, the pressure inlet is set to zero.
Figure 14 shows the effect of foil curvature on the mean flow velocity ( U ¯ ) and mean flow rate ( Q ¯ ) of the flapping hydrofoil under the swinging frequency of 0.1 Hz–5 Hz. From the figure, it is evident that the mean flow velocity ( U ¯ ) and mean flow rate ( Q ¯ ) of the flapping hydrofoil, with five various curvatures, exhibit a direct proportionality to the swinging frequency. Within the range of f 2.5 , and with the same frequency, the curvature of foil has minimal effect on the average flow velocity ( U ¯ ) and average flow rate ( Q ¯ ). At frequencies greater than 2.5, and with the same frequency, the curvature of the flap has an impact on both the mean flow velocity ( U ¯ ) and mean flow rate ( Q ¯ ). And then the impact becomes more pronounced as the frequency increases. It has been observed that the NACA6412 foil with a curvature of 6%c has the most significant effect in enhancing the mean flow velocity ( U ¯ ) and mean flow rate ( Q ¯ ) as the swinging frequency increases. On the other hand, the symmetrical NACA0012 foil has the least favorable effect in comparison.
Figure 15 displays the average head versus frequency curves of flaps with varying curvatures. It is evident that as the swinging frequency increases, the average head of the flaps with different curvatures also increases. Additionally, Figure 14b indicates that at the maximum average flow rate of the flap Q ¯ = 2.06   m 3 · s 1 , the corresponding average head H ¯ is less than 0.4 m, which aligns with the ultra-low-head working condition environment.
Figure 16a shows the propulsive efficiency versus frequency curves of five different curvatures of flapping hydrofoils under the oscillation frequency from 0.1 Hz to 5 Hz. It can be found from the figure that the propulsive efficiencies of the five different curvatures of the flapping hydrofoils within the range of the oscillation frequency f ≤ 2 Hz are all increased gradually with the increase in the oscillation frequency, but the growth rate decreases gradually, and the propulsive efficiencies of the flapping hydrofoils are positively correlated with the size of the foil curvature at the same frequency. In the oscillation frequency 2 < f < 4 Hz range, the propulsive efficiency of the five different curvatures of the flapping hydrofoil increased insignificantly with the change in oscillation frequency; in the oscillation frequency f ≥ 4 Hz range, the propulsive efficiency of the NACA6412 with a curvature of 6%c tended to continue to increase with the increase in oscillation frequency.
Overall, the propulsive efficiency of the asymmetric foil is significantly higher than that of the symmetric foil at the same frequency. The NACA8412 foil, which has a foil curvature of 8%c, exhibits the highest propulsive efficiency among foils when compared to the symmetric NACA0012 foil. This superiority is observed within the oscillation frequency range of f ≤ 2 Hz, with a remarkable enhancement of 14.06% over the symmetric foil. The NACA6412 foil, which has a foil curvature of 6%c, exhibits the highest propulsive efficiency in the oscillation frequency range of f > 2 Hz. It achieves a remarkable improvement of 14.05% compared to the symmetric foil.
Figure 16b shows the pumping efficiency of five different curvatures of a flapping hydrofoil. The graph displays the change in efficiency with varying oscillation frequencies from 0.1 Hz to 5 Hz. It is evident from the figure that the pumping efficiency of all five foil curvatures follows a pattern of initially increasing and then decreasing with the oscillation frequency. The asymmetric foil type exhibits wave peaks near f = 3.5 Hz or f = 4 Hz. These peaks occur because, during the water propulsion process of the flapping hydrofoil bionic pump, increasing the foil curvature within a certain range of frequency enhances the jet velocity of the tail vortex, thereby improving pumping efficiency. However, excessively large curvatures impede the water flow, and this impediment becomes more pronounced as the oscillation frequency increases. Within the oscillation frequency range of f ≤ 2.5 Hz, increasing the curvature of the foil can significantly enhance the pumping efficiency of the flapping hydrofoil under the same frequency conditions. Specifically, a foil curvature with 8%c exhibits the greatest improvement in pumping efficiency, which is 11.7% higher compared to a symmetric foil curvature with 0%c. Within the frequency range of f > 2.5 Hz, when comparing hydrofoils with the same frequency, the pumping efficiency of the asymmetric foil is higher than that of the symmetric foil. Furthermore, the hydrofoil with a curvature of 6%c has the highest pumping efficiency, which is 12.8% greater than the symmetric foil with a curvature of 0%c.

7. Conclusions

This paper investigates the hydrodynamic performance of swing-type flapping hydrofoil bionic pumps by studying five hydrofoil models with varying curvatures. Simulation experiments were conducted to analyze the propulsion efficiency, pumping efficiency, and flow structure of these hydrofoils. The results demonstrate that, within a specific range, increasing the foil’s curvature can enhance the hydrodynamic performance of the flapping hydrofoil bionic pump, as evidenced by the following results:
(1) When the flap swing frequency is set at 1 Hz, the foil curvature ranges from 0%c to 6%c. Increasing the foil curvature can significantly improve the maximum value of the instantaneous thrust coefficient, with a maximum enhancement of 31.25%. However, it does not have a noticeable effect on enhancing the instantaneous lift coefficient. It is important to note that when the foil curvature exceeds 6%c, there is a case of the instantaneous thrust coefficient becoming negative.
(2) The propulsive efficiency of the flapping hydrofoil increases as the size of the foil curvature increases when both are at the same frequency. Within the frequency range of f ≤ 2 Hz, the propulsive efficiencies of the five different curvatures of the flapping hydrofoils exhibit a gradual increase as the oscillation frequency increases. However, the rate of growth decreases gradually. In this range, the NACA8412 foil with a foil curvature of 8%c has the highest propulsive efficiency, which is 14.06% higher than that of the symmetric foil at its maximum. Within the frequency range of flapping greater than 2 Hz, the NACA6412 foil, which has a foil curvature of 6%c, has the highest propulsive efficiency. It achieves a maximum improvement of 14.05% compared to the symmetric foil.
(3) Within the frequency range of f ≤ 2.5 Hz, increasing the curvature of the foil can significantly enhance the pumping efficiency of the flapping hydrofoil under the same frequency conditions. Specifically, a foil curvature with 8%c exhibits the greatest improvement in pumping efficiency, which is 11.7% higher compared to a symmetric hydrofoil. Within the frequency range of f > 2.5 Hz, the pumping efficiency of an asymmetric foil is greater than that of a symmetric foil at the same frequency. Furthermore, among the different foil curvatures, the foil with a 6%c curvature exhibits the highest increase in pumping efficiency, which is 12.8% higher than that of the symmetric foil.

Author Contributions

Q.S. contributed to the overall composition and writing of the manuscript; E.H. introduced the primary concept of examining the hydrodynamic efficiency of flapping hydrofoil bionic pumps through the analysis of foil camber; L.S. revised the manuscript; L.Q. reviewed the manuscript; Y.S. reviewed and revised the diagrams in the manuscript; M.X. conducted numerical theory research. All authors have read and agreed to the published version of the manuscript.

Funding

This research was funded by the National Natural Science Foundation of China (Grant No. 71373242, 61772469), the Zhejiang Provincial Key Research and Development Project (Grant No. 2021C03019), the Zhejiang Province Visiting Engineer “School-Enterprise Cooperation” Program (Grant No. FG2023172), and Scientific research project on the integration of professional disciplines of Zhejiang Industry Polytechnic College in 2023 (Grant No. XKC202312012, XKZ202312033).

Data Availability Statement

Data can be provided upon request from the corresponding author, for collaboration purposes.

Conflicts of Interest

The authors declare no conflicts of interest.

References

  1. Dai, X.; Xu, G.; Ding, Y.; Zeng, S.; You, L.; Jiang, J.; Zhang, H. Online Storage Technology of the Separate Sewage System: Demonstration Study in a Typical Plain River Network City. Water 2022, 14, 3194. [Google Scholar] [CrossRef]
  2. Phillips, J.; Slattery, M. Downstream trends in discharge, slope, and stream power in a lower coastal plain river. J. Hydrol. 2007, 334, 290–303. [Google Scholar] [CrossRef]
  3. Eui, L.; Joong, K. Convertible Operation Techniques for Pump Stations Sharing Centralized Reservoirs for Improving Resilience in Urban Drainage Systems. Water 2017, 9, 843. [Google Scholar] [CrossRef]
  4. Yan, Y.; Yuan, S.; Lyu, S. Hydrodynamic reconstruction of Wennan river network in Shanghai City. J. Hohai Univ. Nat. Sci. 2021, 49, 329–334+365. [Google Scholar]
  5. Feng, H.; Wan, Y.; Fan, Z. Numerical investigation of turbulent cavitating flow in an axial flow pump using a new transport-based model. J. Mech. Sci. Technol. 2020, 34, 745–756. [Google Scholar] [CrossRef]
  6. Yan, J.; Chao, C.; Ji, P.; Wen, W. Experiment on Pressure Fluctuation of Axial Flow Pump System under Different Cavitation Conditions. Trans. Chin. Soc. Agric. Mach. 2018, 49, 158–164. [Google Scholar]
  7. Zhang, D.; Shi, L.; Shi, W.; Zhao, R.; Wang, H.; Van Esch, B.B. Numerical analysis of unsteady tip leakage vortex cavitation cloud and unstable suction-side-perpendicular cavitating vortices in an axial flow pump. Int. J. Multiph. Flow 2015, 77, 244–259. [Google Scholar] [CrossRef]
  8. Wu, D.; Bai, Y. Numerical Simulation of Flow-Induced Noise in Horizontal Axial Flow Pumps in Forward and Reverse Conditions. Water 2023, 15, 322. [Google Scholar] [CrossRef]
  9. Dai, C.; Zhang, Y.; Pan, Q.; Dong, L.; Liu, H. Study on Vibration Characteristics of Marine Centrifugal Pump Unit Excited by Different Excitation Sources. J. Mar. Sci. Eng. 2021, 9, 274. [Google Scholar] [CrossRef]
  10. Xie, L.; Wang, F.; He, C. Experimental investigation on hydrodynamic characteristics of a 15 degree slanted axial-flow pump system. J. Hydraul. Eng. 2019, 50, 798–805. [Google Scholar]
  11. Hua, E.; Qiu, L.; Xie, R.; Su, Z.; Zhu, W. Comparative Analysis of the Hydrodynamic Performance of Dual Flapping Foils with In-Phase and Out-of-Phase Oscillations. Water 2023, 15, 3275. [Google Scholar] [CrossRef]
  12. Ziemińska-Stolarska, A.; Kempa, M. Modeling and Monitoring of Hydrodynamics and Surface Water Quality in the Sulejów Dam Reservoir, Poland. Water 2021, 13, 296. [Google Scholar] [CrossRef]
  13. Keserwan, G.; Ayog, L.; Bau, D. Discontinuous Galerkin formulation for 2D hydrodynamic modelling: Trade-offs between theoretical complexity and practical convenience. Comput. Methods Appl. Mech. Eng. 2018, 342, 710–741. [Google Scholar] [CrossRef]
  14. Man, X.; Lei, C.; Carey, C.C.; Little, J.C. Relative Performance of 1-D Versus 3-D Hydrodynamic, Water-Quality Models for Predicting Water Temperature and Oxygen in a Shallow, Eutrophic, Managed Reservoir. Water 2021, 13, 88. [Google Scholar] [CrossRef]
  15. Martínez-Aranda, S.; Murillo, J. A 1D numerical model for the simulation of unsteady and highly erosive flows in rivers. Comput. Fluids 2019, 181, 8–34. [Google Scholar] [CrossRef]
  16. Betz, A. Ein Beitrag zur Erklaerung Segelfluges. Z Flugtech Mot. 1912, 3, 269–272. [Google Scholar]
  17. Lu, K.; Xie, Y.H.; Zhang, D. Numerical study of large amplitude, no sinusoidal motion and camber effects on pitching airfoil propulsion. J. Fluids Struct. 2013, 36, 184–194. [Google Scholar] [CrossRef]
  18. Read, D.A.; Hover, F.S.; Triantafyllou, M.S. Forces on oscillating foils for propulsion and maneuvering. J. Fluids Struct. 2003, 17, 163–183. [Google Scholar] [CrossRef]
  19. Schouveiler, L.; Hover, F.S.; Triantafyllou, M.S. Performance of flapping foil propulsion. J. Fluids Struct. 2005, 20, 949–959. [Google Scholar] [CrossRef]
  20. Yang, S.; Liu, C.; Wu, J. Effect of motion trajectory on the aerodynamic performance of a flapping airfoil. J. Fluids Struct. 2017, 75, 213–232. [Google Scholar] [CrossRef]
  21. Hua, E.; Zhu, W.; Xie, R.; Su, Z.; Luo, H.; Qiu, L. Comparative Analysis of the Hydrodynamic Performance of Arc and Linear Flapping Hydrofoils. Processes 2023, 11, 1579. [Google Scholar] [CrossRef]
  22. Lin, X.; Wu, J.; Zhang, T. Performance investigation of a self-propelled foil with combined oscillating motion in stationary fluid. Ocean Eng. 2019, 175, 33–49. [Google Scholar] [CrossRef]
  23. Sun, G.; Wang, Y.; Xie, Y.; Ma, P.; Zhang, Y. Hydrodynamic and energy extraction properties of oscillating hydrofoils with a trailing edge flap. Appl. Ocean Res. 2021, 110, 102530. [Google Scholar] [CrossRef]
  24. Ashraf, M.A.; Young, J.; Lai, C.S. Reynolds number, thickness and camber effects on flapping airfoil propulsion. J. Fluids Struct. 2011, 27, 145–160. [Google Scholar] [CrossRef]
  25. Zhou, J.; Yan, W.; Mei, L.; Shi, W. Performance of Semi-Active Flapping Hydrofoil with Arc Trajectory. Water 2023, 15, 269. [Google Scholar] [CrossRef]
  26. Zhang, S.; Yan, W.; Zhou, J.; Mei, L.; Yu, D. Influence of tip shapes on hydrodynamic performance of low-aspect-ratio oscillating foils. J. Ship Mech. 2022, 26, 629–644. [Google Scholar]
  27. Li, Y.; Zhang, X.; Pan, Z. Side wall effect on the propulsive performance of flapping foils—A numerical investigation. J. Ship Mech. 2020, 24, 570–577. [Google Scholar]
  28. Hua, E.; Luo, H.; Xie, R.; Chen, W. Investigation on the Influence of Flow Passage Structure on the Performance of Bionic Pumps. Processes 2022, 10, 2569. [Google Scholar] [CrossRef]
  29. Lighthill, M.J. Aquatic animal propulsion of high hydromechanical efficiency. J. Fluid Mech. 1970, 44, 265–301. [Google Scholar] [CrossRef]
  30. Hua, E.; Chen, W.; Tang, S. Water Pushing Flow Characteristics of Flapping Hydrofoil Device in Small Rive. Trans. Chin. Soc. Agric. Mach. 2022, 53, 154–162. [Google Scholar]
  31. Wang, F.J. Computational Fluid Dynamics Analysis—Principles and Applications of CFD Software; Tsinghua University Press: Beijing, China, 2004; pp. 124–126. [Google Scholar]
  32. Jit, S.; Kim, L.; Sunil, D. Influence of the Pivot Location on the Thrust and Propulsive Efficiency Performance of a Two-dimensional Flapping Elliptic Airfoil in a Forward Flight. Phys. Fluids 2021, 8, 163–183. [Google Scholar]
Figure 1. Schematic of 2-degree-of-freedom flapping hydrofoil motion.
Water 16 00595 g001
Figure 2. Schematic diagram of two-dimensional rigid biomimetic flapping hydrofoil mechanical model.
Water 16 00595 g002
Figure 3. Profile of foil and its main parameters.
Water 16 00595 g003
Figure 4. Foils with different cambers.
Water 16 00595 g004
Figure 5. Computational domain mesh and grid division.
Water 16 00595 g005
Figure 6. Grid number independence verification.
Water 16 00595 g006
Figure 7. Time step independence verification.
Water 16 00595 g007
Figure 8. Comparison between the numerical simulation outcomes and the experimental data in the previous study [32].
Water 16 00595 g008
Figure 9. The time-varying curves of the instantaneous thrust coefficient for flapping hydrofoils with different foil curvatures.
Water 16 00595 g009
Figure 10. The time-varying curves of the instantaneous lift coefficient for flapping hydrofoils with different foil cambers.
Water 16 00595 g010
Figure 11. Foils with varying curvatures experience pressure clouds at the moment when the thrust coefficient reaches its maximum value: (a) NACA0012; (b) NACA4412; (c) NACA8412.
Water 16 00595 g011
Figure 12. Vorticity maps at different times in one period for hydrofoils with different foil curvatures.
Water 16 00595 g012
Figure 13. Velocity clouds of flapping hydrofoils with different foil curvatures at the same moment of flapping: (a) NACA0012; (b) NACA 2412; (c) NACA 4412; (d) NACA 6412; (e) NACA 8412.
Water 16 00595 g013aWater 16 00595 g013b
Figure 14. Curves of mean flow velocity and mean flow rate with varying frequency for flapping hydrofoils with different foil curvatures: (a) average flow velocity; (b) average flow rate.
Water 16 00595 g014
Figure 15. Curve of mean head versus frequency for flapping hydrofoils with different foil curvatures.
Water 16 00595 g015
Figure 16. Propulsive efficiency and pumping efficiency versus frequency curves for flapping hydrofoils with different curvatures: (a) propulsion efficiency; (b) pumping efficiency.
Water 16 00595 g016
Table 1. Basic parameters of foils with different cambers.
Foil NameChord Length c (m)Maximum Camber eMaximum Camber Position
NACA00120.30%c0%c
NACA24122%c40%c
NACA44124%c40%c
NACA64146%c40%c
NACA84248%c40%c
Disclaimer/Publisher’s Note: The statements, opinions and data contained in all publications are solely those of the individual author(s) and contributor(s) and not of MDPI and/or the editor(s). MDPI and/or the editor(s) disclaim responsibility for any injury to people or property resulting from any ideas, methods, instructions or products referred to in the content.

