Article

Occurrence and Distribution of Fluoride in Groundwater and Drinking Water Vulnerability of a Tropical Dry Region of Andhra Pradesh, India

1
Department of Computer Science and Engineering, SRM University–AP, Amaravati 522240, Andhra Pradesh, India
2
Department of Environmental Science and Engineering, SRM University–AP, Amaravati 522240, Andhra Pradesh, India
3
Centre for Geospatial Technology, SRM University–AP, Amaravati 522240, Andhra Pradesh, India
4
School of Environmental Science and Engineering, Indian Institute of Technology Kharagpur, Kharagpur 721302, West Bengal, India
5
Institute for Global Environmental Strategies, Hayama 240-0115, Kanagawa, Japan
*
Authors to whom correspondence should be addressed.
These authors contributed equally to this work.
Water 2024, 16(4), 577; https://doi.org/10.3390/w16040577
Submission received: 23 January 2024 / Revised: 7 February 2024 / Accepted: 10 February 2024 / Published: 15 February 2024

Abstract

:
There has been a growing concern over the occurrence of fluoride (F) in groundwater and the impact of F exposure on human health issues over the past decades. So, this study conducted a regional–scale assessment of the occurrence and trend of groundwater F distribution [2014–2018] integrated with locally field–based investigations on F exposure to a few selected families (10 households and 35 respondents) and reason behind their consumption of F containing water (n = 18). In the local study, water samples were collected from multiple sources around the selected households by dividing them into consumptive and non–consumptive use. Results revealed that across the state of Andhra Pradesh, the occurrence of F is more than the permissible limit in groundwater, and it has been increasing over the years (2014–2018) (average SD is 0.55), and the local study showed that the groundwater had an average of 1.5 mg/L F, while other sourced water had an average of <1 mg/L F. Most interestingly, nine families are consuming non–F containing water (<0.52 mg F/day) which is commercially available, while only one family is consuming F containing groundwater and being exposed to >3 mg F/day. This disparity in fluoride exposure is dependent on economic stability and health exposure policies.

1. Introduction

Groundwater is a crucial source of drinking water for human populations worldwide, contributing 0.6% of the total freshwater resources [1,2]. However, due to the rapid growth of industries, urban zones, and population sizes, the burden on the environment is affecting groundwater quality and quantity [3]. Alongside anthropogenic groundwater contamination, there are pre–existing geogenic pollutants polluting groundwater which have severe health implications [3,4]. Among them, F is one of the abundant groundwater pollutants across the globe, mostly in tropical and dry climatic regions [5], like African (37–46%) and Asian (51–59%) countries [3]. Among Asian countries, India has severe groundwater F issues in parts of Rajasthan, Gujarat, West Bengal, Hyderabad, and Andhra Pradesh [6]. The occurrence of F in groundwater is dependent on the presence of fluoride–bearing minerals like apatite, hornblende, and pyroxenes [7], geochemical processes at a high pH (alkaline media) like the exchange of hydroxyl ions and carbonate dissolution [8,9], and climate factors [10,11].
Globally, more than 2.5 billion people rely on groundwater for safe drinking water supply, out of which a major percentage of people are suffering from inaccessibility to safe drinking water [12]. The occurrence of F in groundwater of more than 1.5 mg/L (World Health Organization (WHO), 2017) [13] degrades the groundwater quality and is unsuitable for any dietary consumption [5]. The consumption of high F has severe health implications like dental and skeletal fluorosis [4,5,14]. Along with the occurrence of fluoride in groundwater, the prevalence of F containing groundwater for human consumptive use is dependent on the stakeholders, as well as local people’s knowledge and awareness [15]. The removal of F from drinking water or safe water supply is dependent on the public water supply scheme; even so, other measures are possible, such as the installation of tube wells in fresh groundwater aquifers [15], the installation of treatment filters at a community level or in households or using commercially available treated fresh water [15]. However, the installation of treatment tank/filters and commercially available fresh water completely depends on the local governmental policy implementations and recommendations or largely may depend on economic stability [16]. The present study was conducted to illustrate a (1) broader understanding of the trend of groundwater F content in the topical dry region of India (Andhra Pradesh state), which eventually (2) integrated with a local–scale focused study (Neerukonda village, Guntur, Andhra Pradesh) where we investigated the occurrence of F in multiple sources of household water along with the essential micro and macro nutrients and (3) the possible daily intake of F through drinking water and the reason behind the exposure. The novelty of this study is the integration of the long–term variability in and occurrence of F in groundwater and the eventual integration with the level of exposure at the household level and the potential role of other influencing factors like awareness and socioeconomic conditions. In detail, for the regional–scale groundwater F trends, the study considered 2969 groundwater data samples from 2014 to 2018, while for the local–scale focused study, a total of 18 water samples were collected, and a total of 10 families were surveyed with a total of 35 respondents, where we collected data on source–dependent water consumption and daily water intake through which we calculated the daily F exposure rate. More specifically, ultimately, we tried to find the reason behind the consumption of fluoridated water though a detailed qualitative survey.

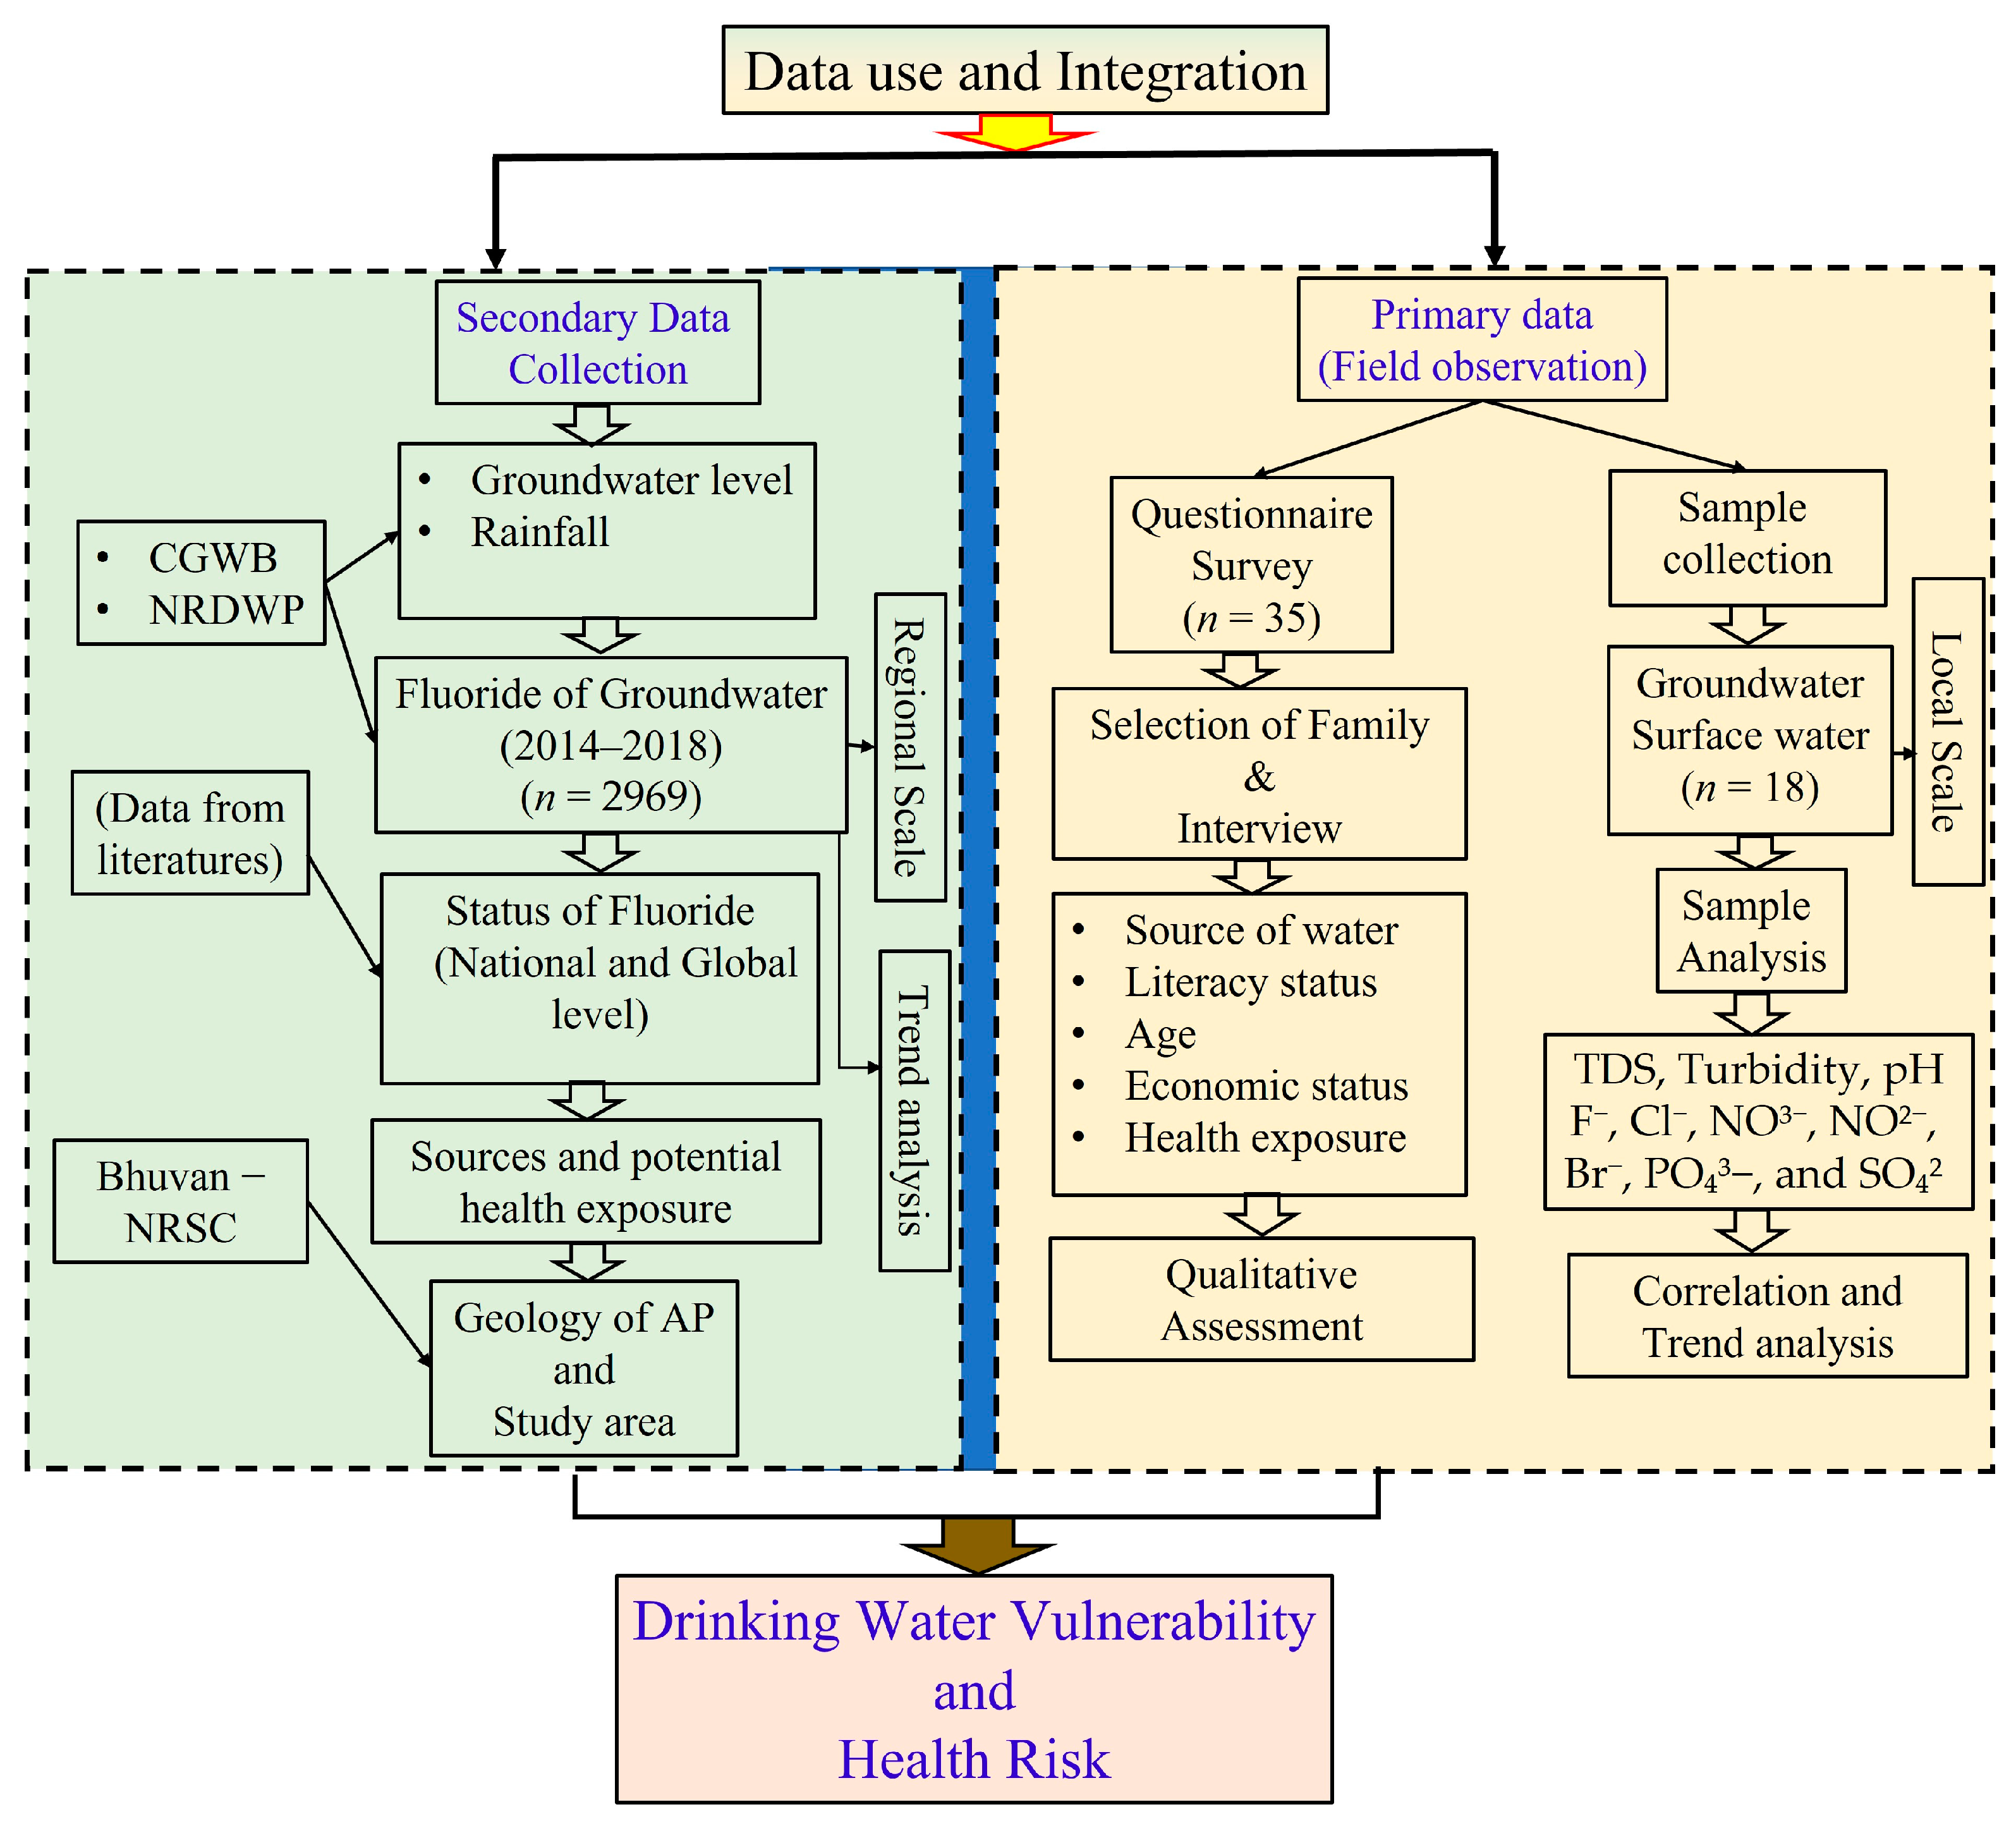
2. Materials and Methods
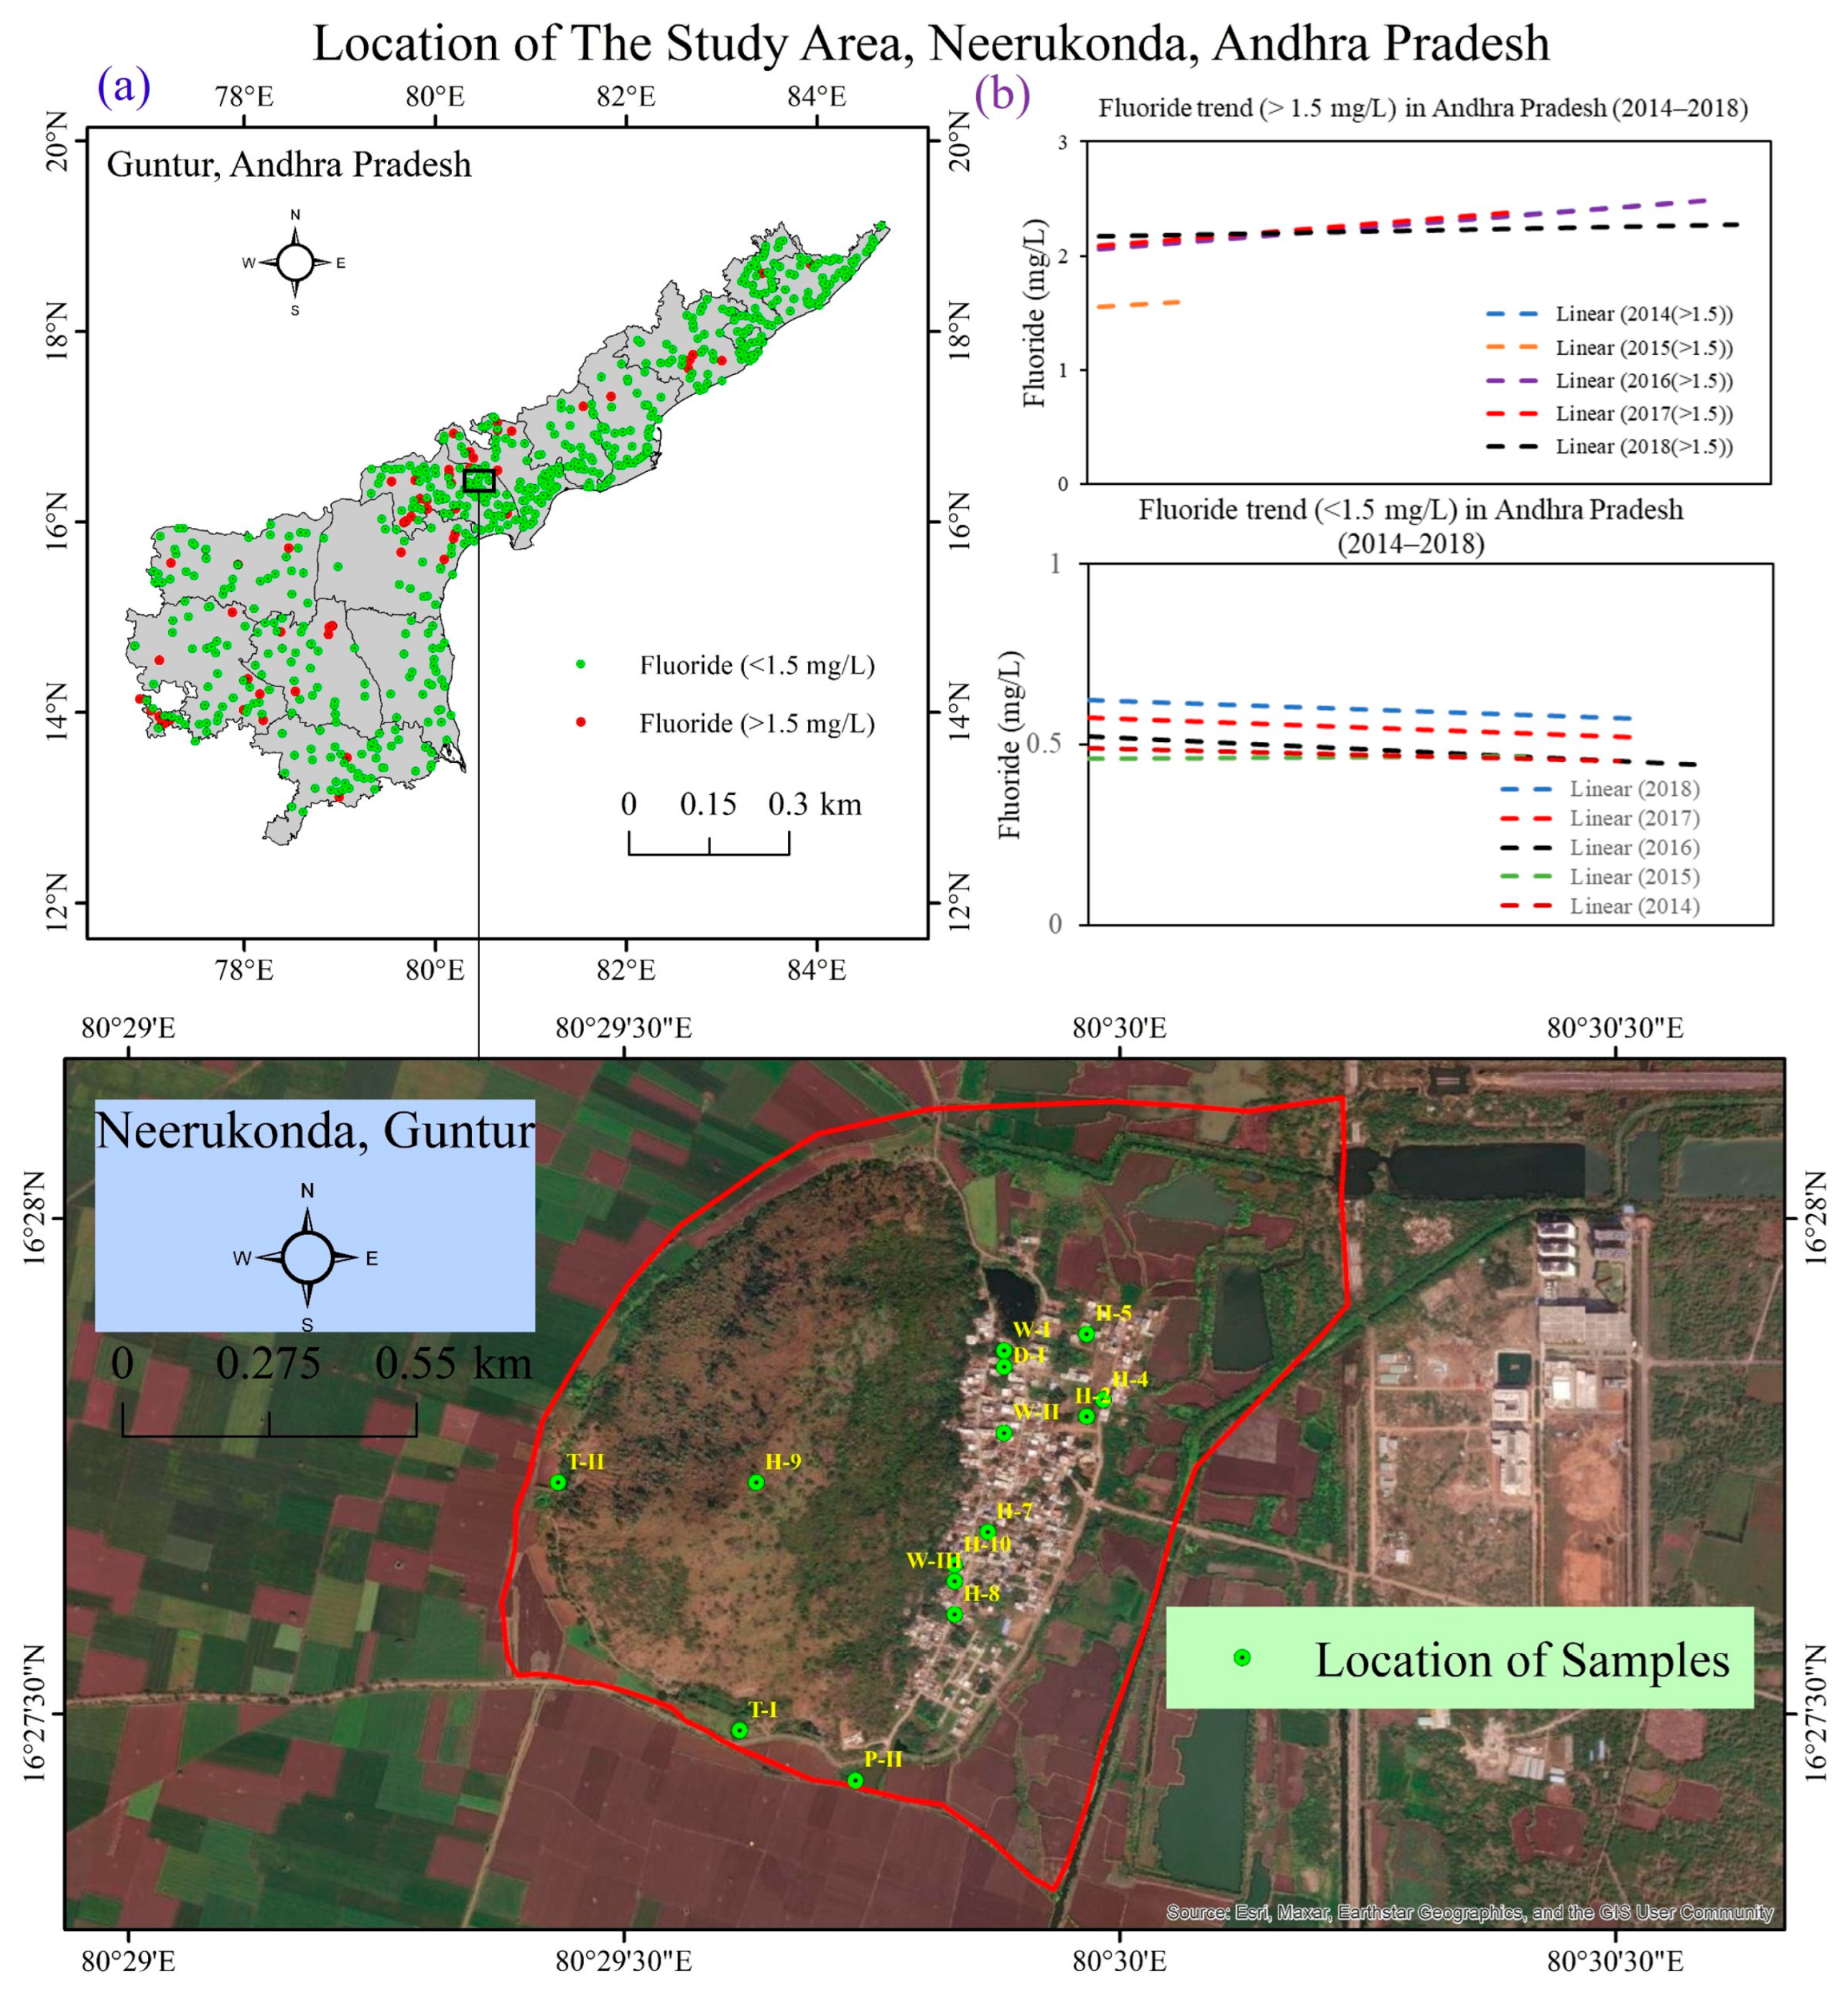
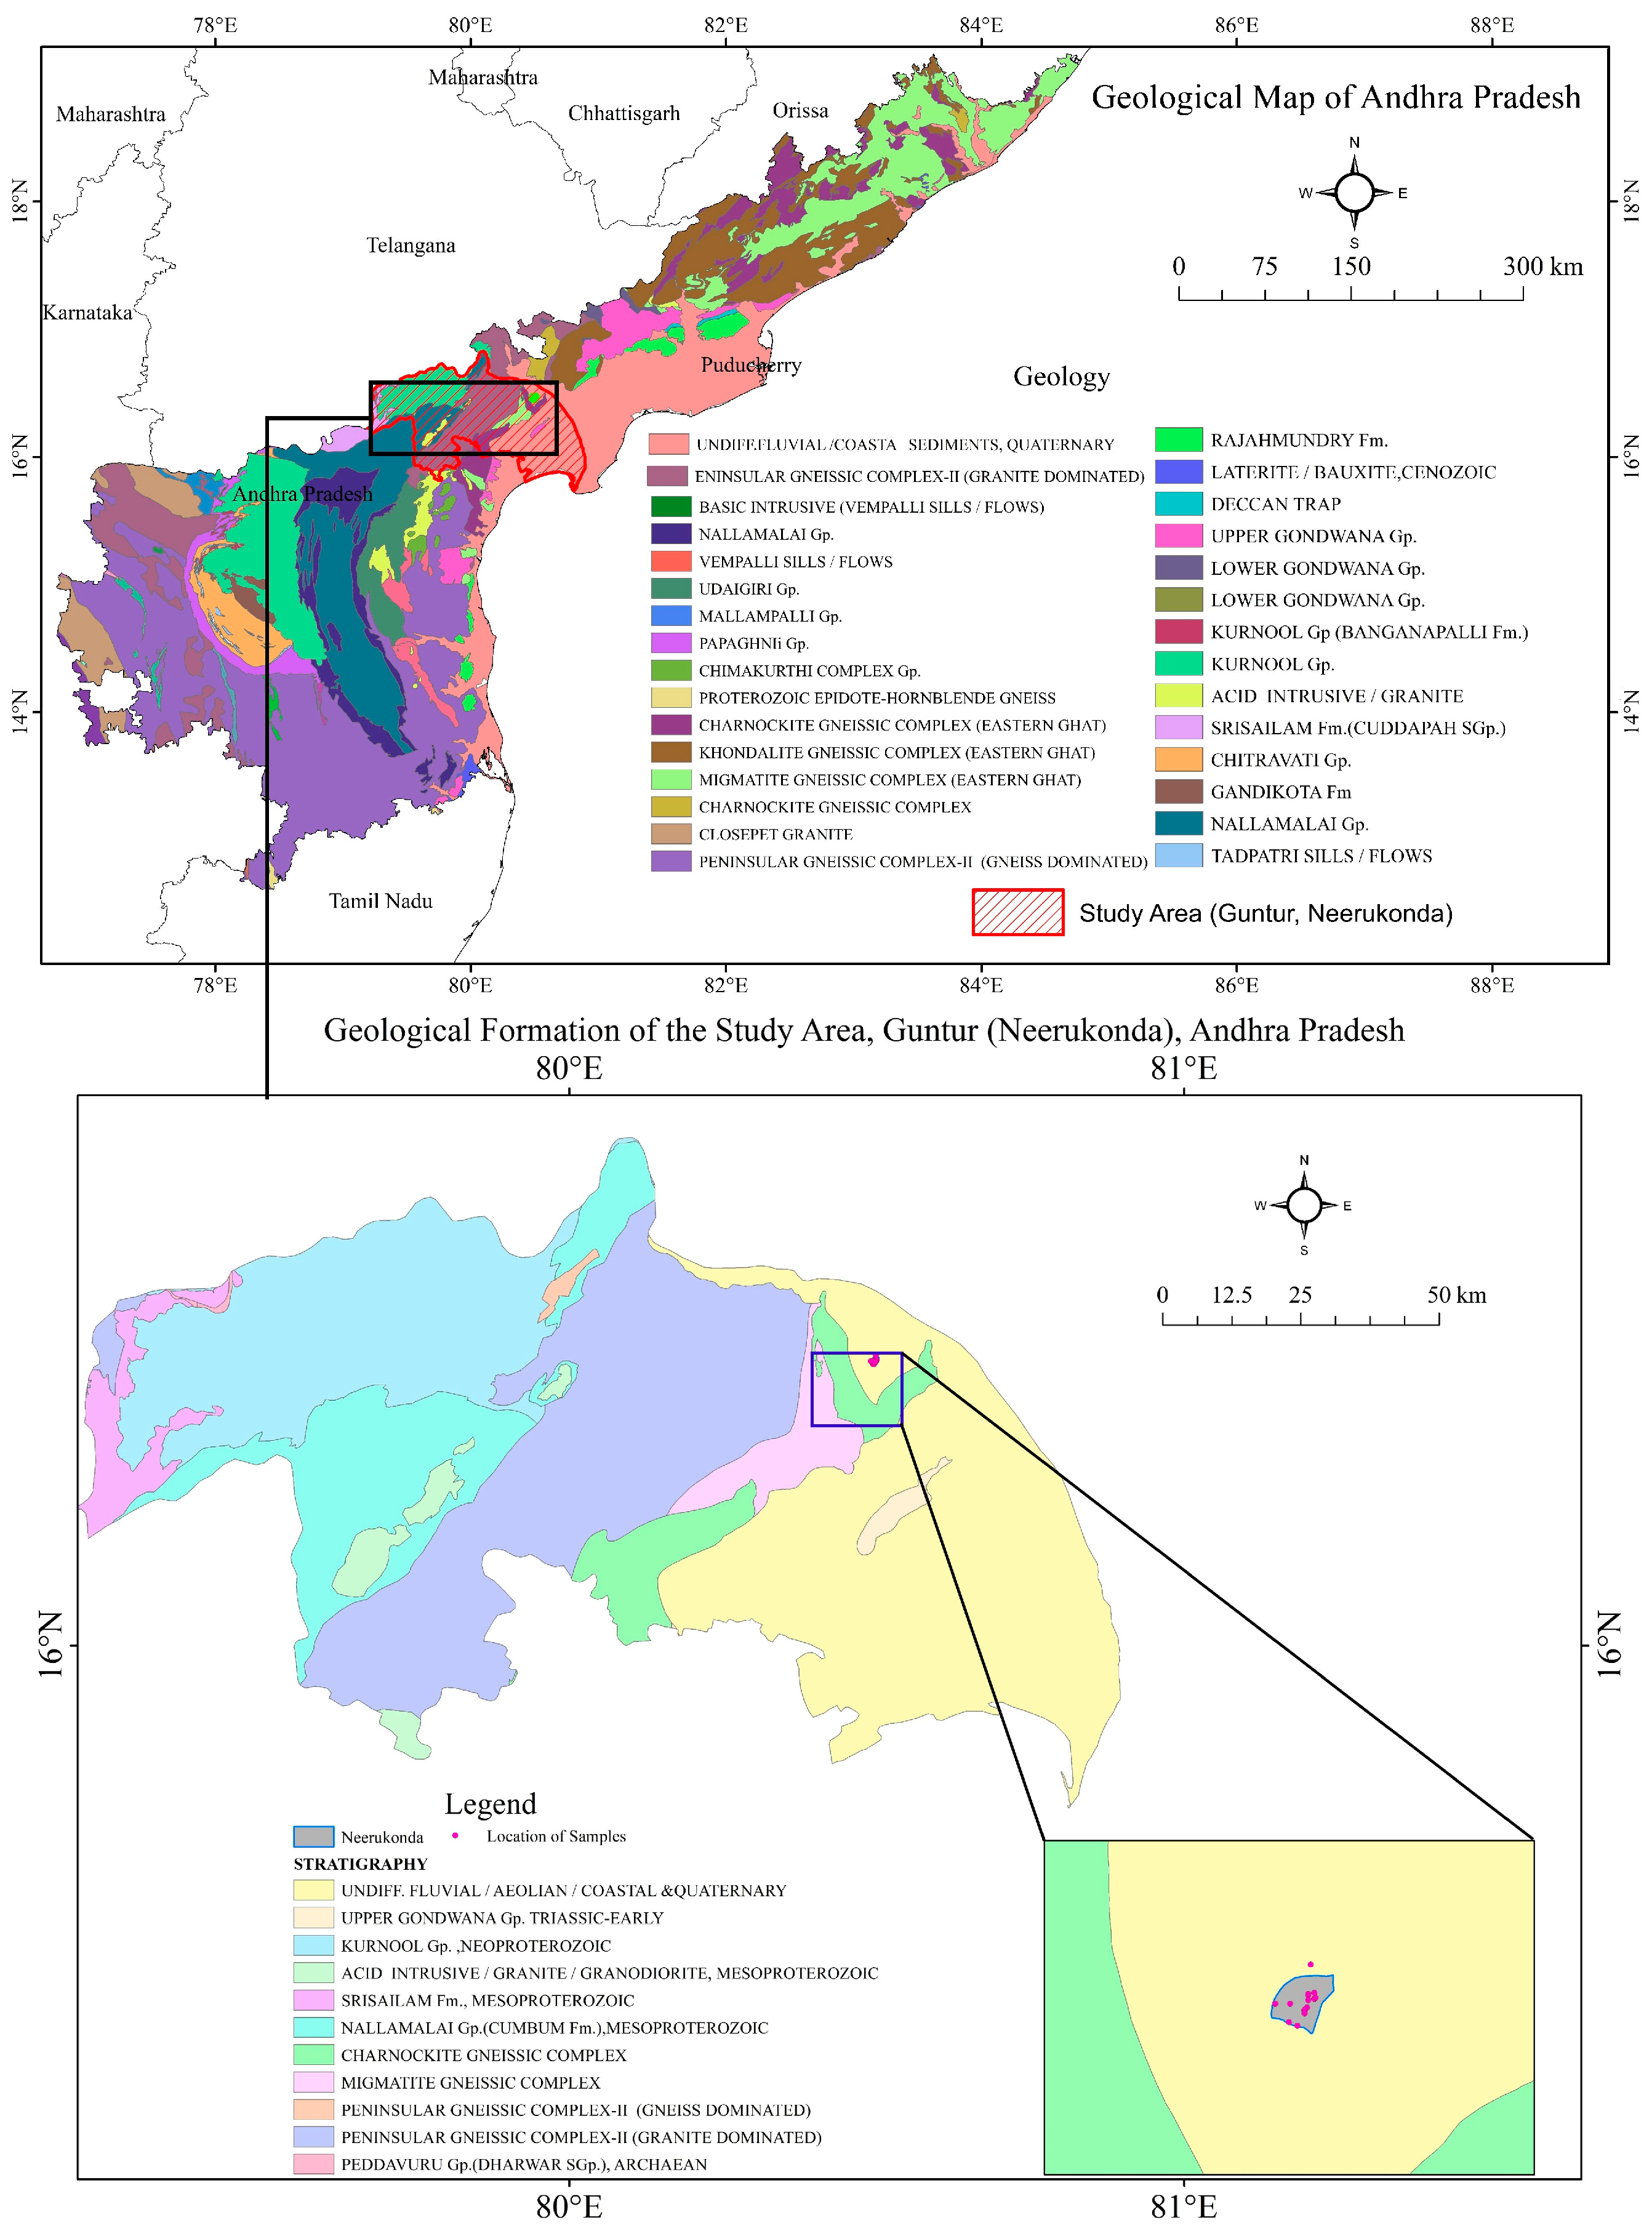
2.1. Study Area

Physiographically, Andhra Pradesh state can be divided into 3 distinct zones, viz., the coastal plains, eastern ghats, and western pediplains. The three major river basins of Andhra Pradesh are Krishna, Godavari, and Pennar. The area of interest lies under the hard rock aquifer zone. The decadal mean rainfall of the selected area is ~1000 mm (2014–2015), which varies across the season with a high in monsoon season and a low in non–monsoon season. The deltas of rivers are very extensive and characterized by considerable thickness of alluvium. The narrow coastal region is formed from deposited alluvium and varies under unconfined to semi–confined to confined structure. The shallow unconfined aquifers usually lie within a depth of <20 m below ground level (m bgl), and deep aquifers are around 100 m bgl [17].
More specifically, the focused field–based study was conducted at Neerukonda village, Guntur, and the location lies between the northern latitudes of 15°18′ to 16°0′ and the eastern longitudes of 79°10 to 80°55′ (Figure 1a). Neerukonda village is known for its abundant water resources. It has been found that the water level is highest during the monsoon season from June to September and lowest during the summer season from March to May. The average water level during the monsoon season was 2.5 m bgl, while the average water level during the summer season was only 1 m bgl. The coefficient of variation (CV) for water levels was 1.23 m, indicating moderate variability in water levels.
The Krishna River and the Prakasam Barrage play crucial roles in meeting the needs of the villagers. Groundwater in the village is obtained through bore wells and hand pumps. The villagers depend on groundwater for their domestic purposes also. The depth of the bore wells varies from place to place, with some bore wells reaching a depth of up to 60 m. The quality and quantity of groundwater varies depending on the location of the wells and the geological formation of the area. The main source of groundwater recharge is monsoonal rainfall. The village receives most of its rainfall during the monsoon season, which usually lasts from June to September with an average rainfall of 1000 mm, mostly during July and August.

2.2. Sample Collection and Analysis

For the regional–scale study, the groundwater F content data were collected from the National Rural Drinking Water Program (NRDWP), Department of Drinking Water and Sanitation, Ministry of Jal Shakti, Government of India. We collected a total number of datapoints of 2969, which are evenly distributed across the years from 2014 to 2018. The data were refined by Tukey’s method where we removed outliers from the data set by dividing the data into 3 interquartile ranges [18]. For the focused study at Neerukonda village, a total of 18 water samples were collected with classifications based on the source and usability. We divided them as follows: sample nos. H2 to H10 are groundwater but not used by the villagers for drinking; GW1 is groundwater from a well which is used as drinking water; W1, W2, and W3 are dug wells not in use; P1 and P2 are pond water which are not used for drinking but for other household purposes; T1 and T2 are the panchayet water tank for supply drinking water to the local people; and D1 is an outside supply source. The total number of groundwater sources is 13 (W1, W2, W3, H2, H3, H4, H5, H6, H7, H8, H9, H10, GW1), while GW1 is the only one that is being used by the respective owner as a drinking water source.
The water samples were collected (November 2022) by following the standard protocol of Woods (1981) into 15 mL sterilized polypropylene centrifuge tubes. Total dissolved solids (TDS), pH, and turbidity were eventually measured immediately after collection in the field. The P200–02 pH meter (model no–200–02) was used to measure the pH, while the TDS–3 m was used for the TDS measurement. The samples were preserved and stored in a freezer at a −4 °C temperature for further assessment. The essential macro– and micro–nutrients (F, Cl, NO3−, NO2−, Br, PO₄3−, and SO₄2−) all of the samples were analyzed in a High–Performance Ion Chromatography HPIC (Dionex Integrion, Thermo Scientific, Waltham, MA, United States of America (USA)). The instrument was first calibrated using an anion standard (Dionex Seven Anion Standard, Thermo Scientific, USA), directly traceable to NIST SRM. The samples were analyzed thereafter with check standards (Dionex Seven Anion Standard, Thermo Scientific, USA) as quality checks at the laboratory of the School of Environmental Science and Engineering, Indian Institute of Technology, Kharagpur. The precision of the analysis was better than 10% (5.4% to be precise) (March 2023). The methodological steps followed in this study are outlined in Figure 2.

3. Results

3.1. Regional Scale Study on Occurrence of Fluoride in Groundwater

Regionally, we have divided the groundwater samples (n = 2969) into two categories based on classification as safe (F < 1.5 mg/L) and unsafe (F > 1.5 mg/L) for drinking. Based on the linear trend analysis, we found a trend that safe drinking water sources decreased in number, while unsafe groundwater samples increased over the years from 2014 to 2018 (Figure 1b). The overall trend has also shown a positive and increasing trend (Figure S1). The average F content of unsafe groundwater was more than 2.5 mg/L (except 2015 because of less data points) across the mentioned years with maximum range 3.8 to 5.4 mg/L from 2014 to 2018 (excluding 2015). The existing groundwater fluoride concentration lies within the range of 0.3 to 12.9 mg/L based on reported studies [19,20,21,22,23]. As it is closely related to the geological formation of granite/gneiss, conglomerate, and quartz, our area of interest is more vulnerable to groundwater fluoride contamination (geological map, Figure 3). Our respective study location in Guntur district is surrounded by the groundwater fluoride–contaminated areas and districts of Andhra Pradesh and Telangana from the north or west to the south, of which the eastern part is surrounded by the Bay of Bengal. In the southwest of Guntur District, Vinukonda Mandal and the Macherla–Karempudi area is located near Krishna River where the fluoride contamination is 3.28 to 4.27 mg/L [24]. In the south–central part of Andhra Pradesh, the Guntur district is located near the seacoast, where the fluoride content varies from 1.3 mg/L to 12.9 mg/L. Here, soil–water–rock interactions together with dissolution, ion exchange, and evaporation are the major processes which help in the mobilization of F in groundwater [25].

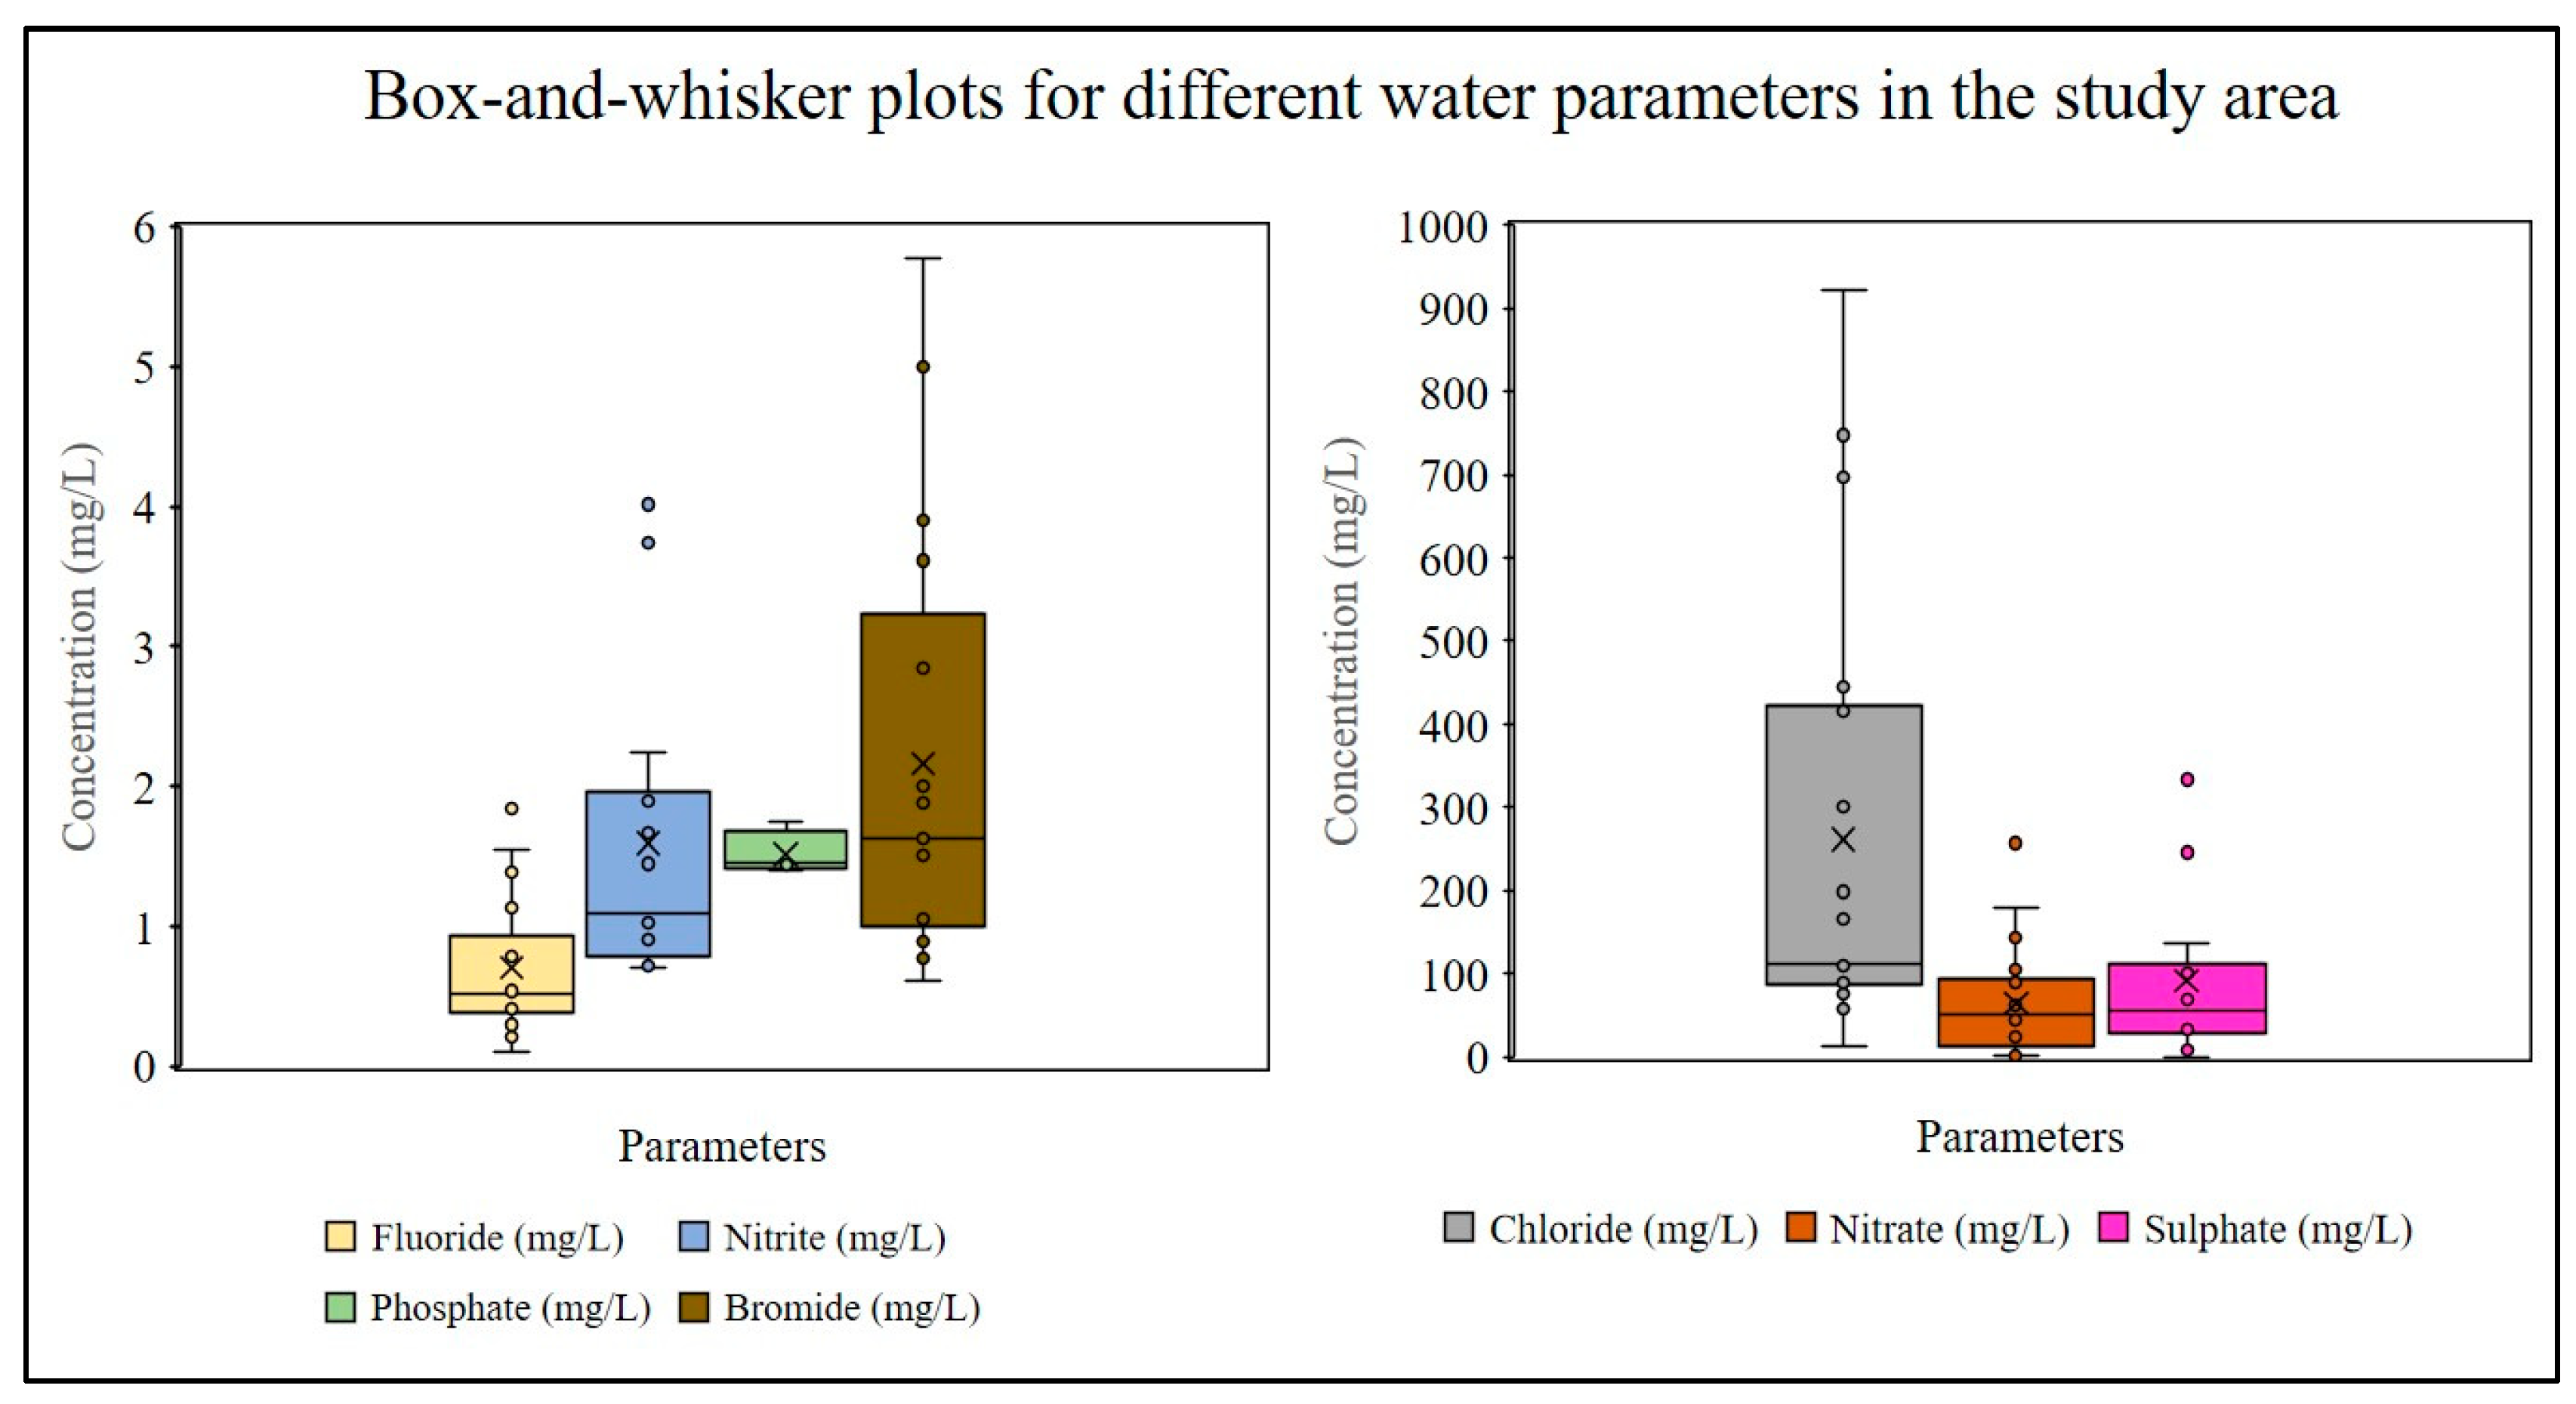
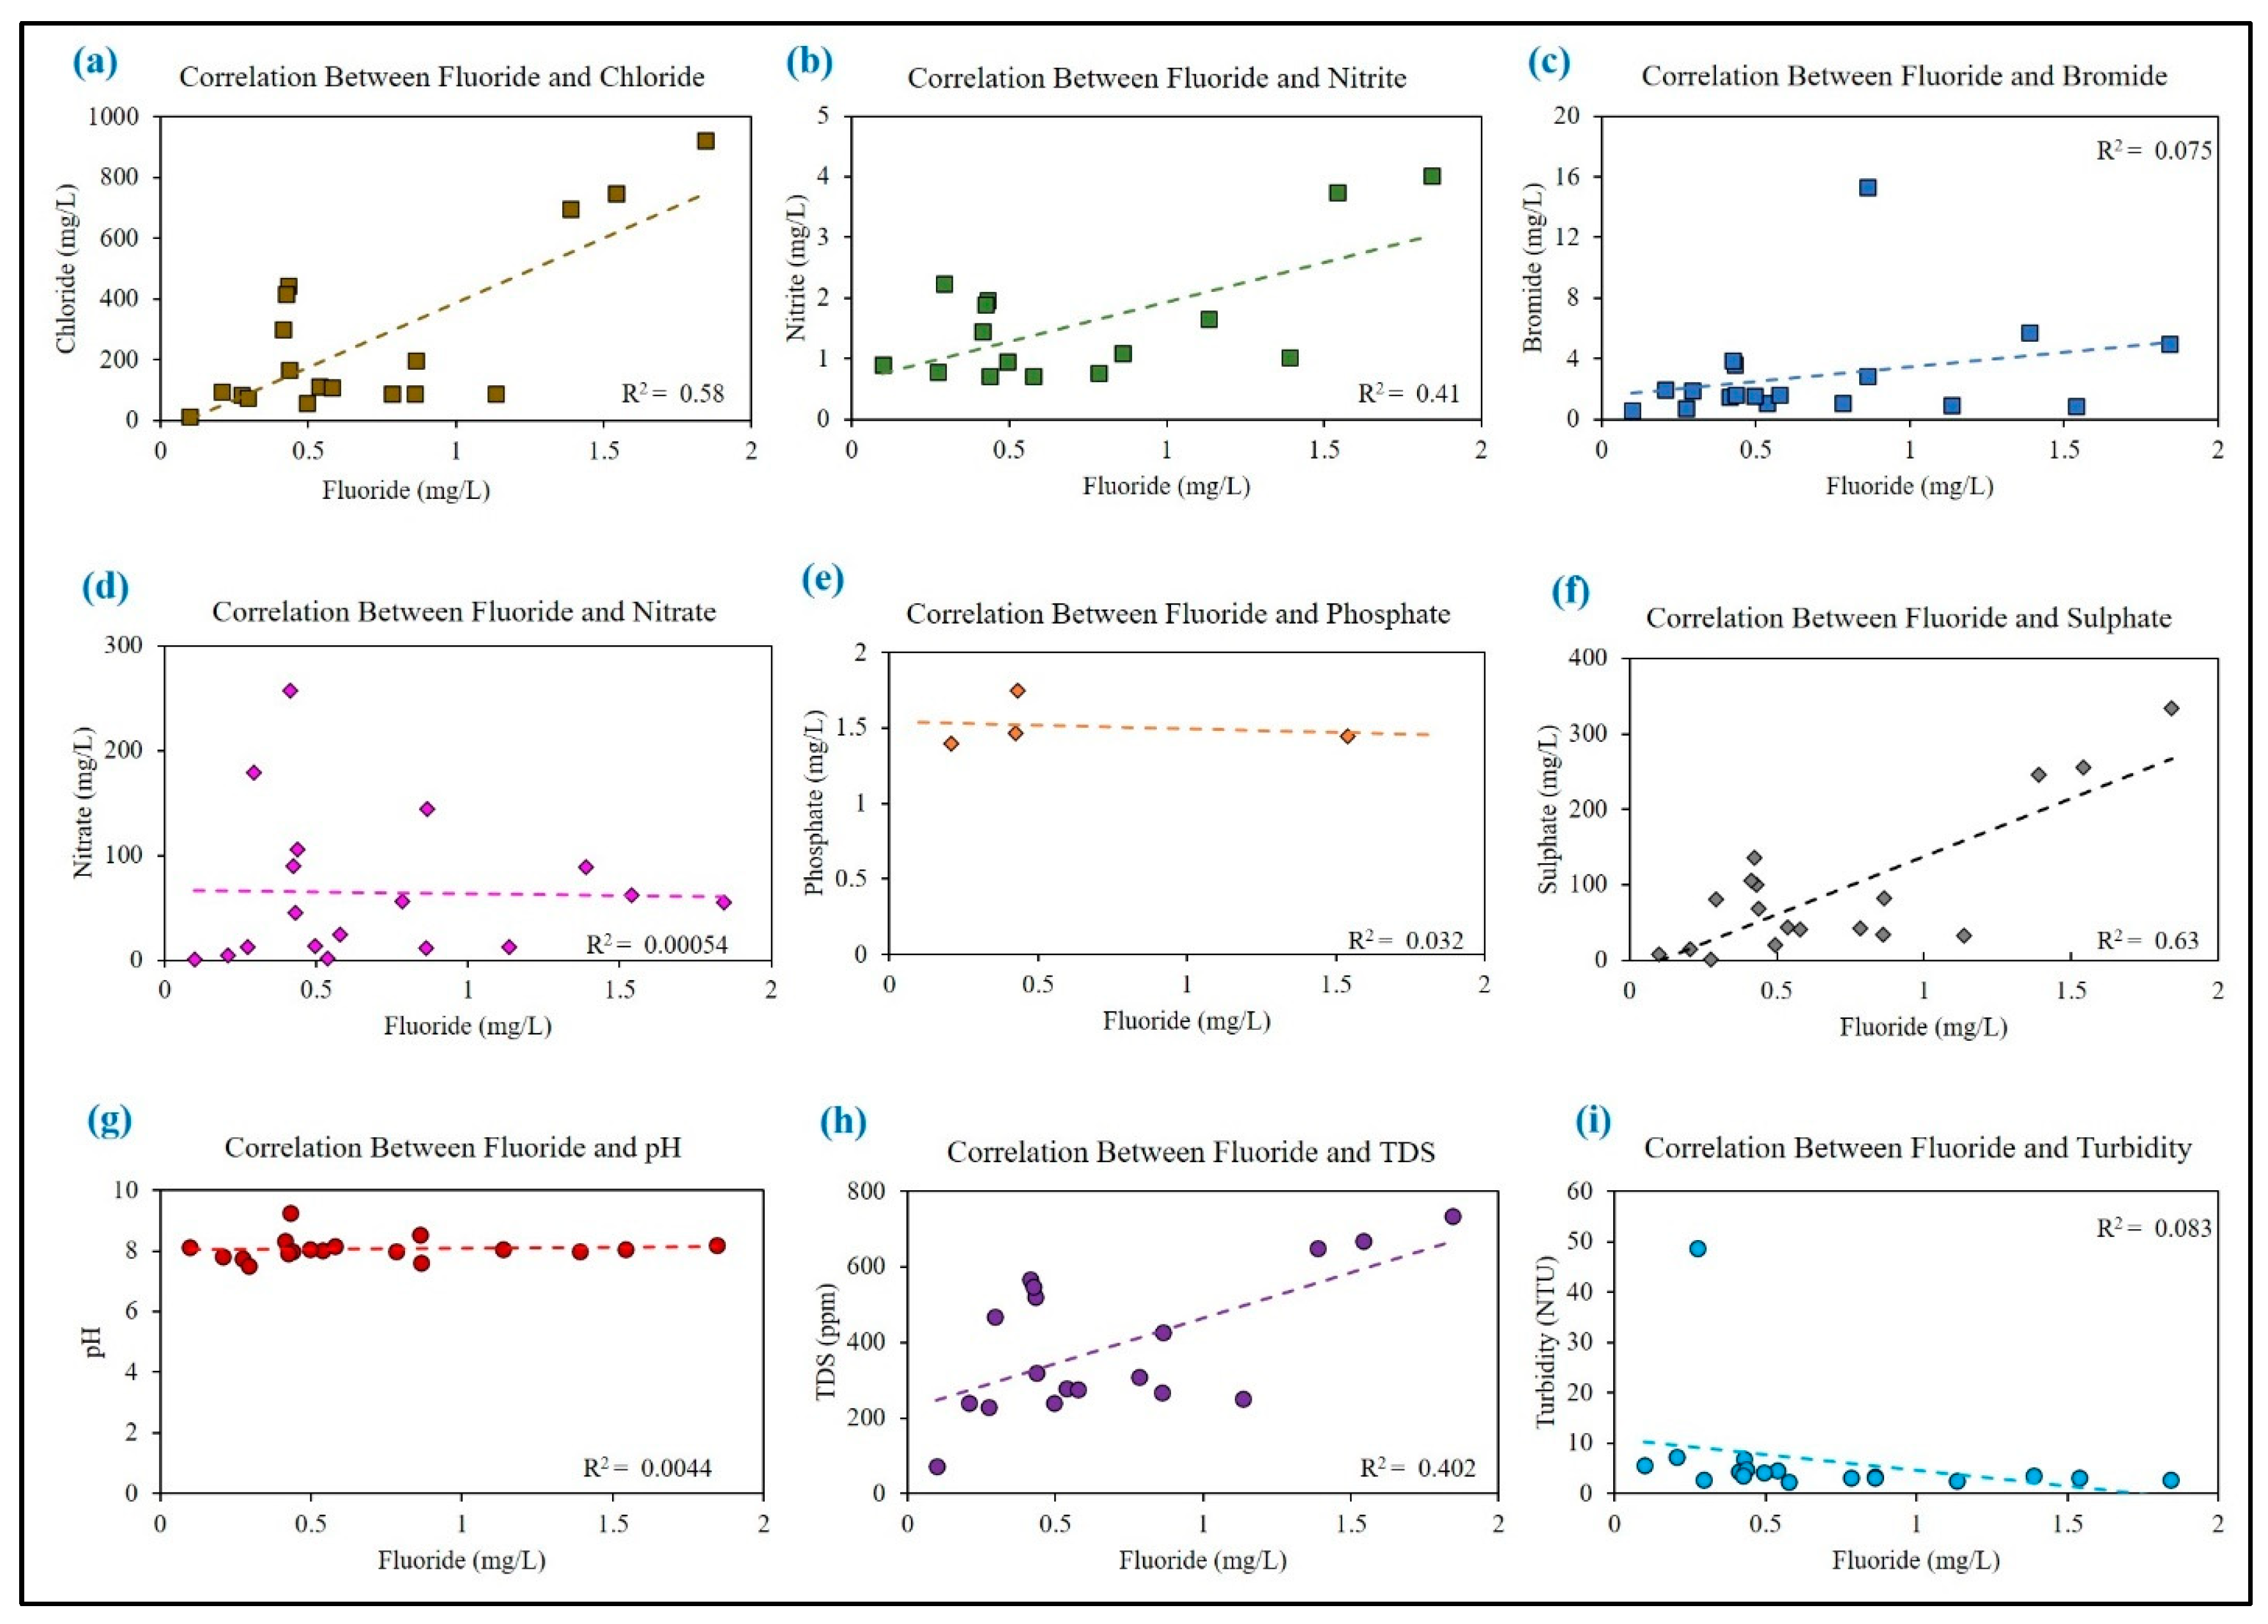
3.2. Assessment of Physicochemical Parameters of Water in the Study Area

The physicochemical parameters are described to relate whether the water samples are suitable for drinking or only for other household uses in relation to the permissible limit recommended by WHO (2017) (Table 1 and Table 2) [13]. The F contents of the only two household samples (H2, H3) are higher than the permissible limit, and these sources are not recommended for drinking purposes. The average concentration of F in groundwater is 0.7 mg/L with a range of 1.84 to 0.10 (SD ± 0.7) mg/L. The descriptive statistics of different water parameters are shown (Table 1), and box–and–whisker plots for medians and interquartile ranges are also presented in Figure 4. According to the guidelines set forth by the WHO (2017) [25], the optimal pH range for potable water falls between 6.5 and 8.5, with a preference for values between 7.0 and 8.0. However, the groundwater of Neerukonda village demonstrates an alkaline pH ranging from 7.50 to 9.25, with an average of 8.07 (SD ± 0.37). The TDS varies within a range of 2.3 to 48.6 (mg/L), with an average of 6.5 (mg/L) (SD ± 1.6). Furthermore, turbidity levels in the groundwater samples across the area range from 72 to 734 nephelometric turbidity units (NTU), culminating in an average value of 392 NTU (SD ± 0.5). The average Cl content of water samples is higher than the permissible limit (avg. 261.4 mg/L) with a recorded high of 922 mg/L and low of 12.1 mg/L (Table 1). The correlation among all physicochemical parameters of the water was measured to understand their relations and the trends across different sources of water in the study area. The study found a positive correlation between fluoride and chloride levels (R2 = 0.58) (Figure 5a), and also a positive trend was observed with the nitrite (R2 = 0.41) (Figure 5b). A positive trend but weak correlation between fluoride and bromide (R2 = 0.08) was found (Figure 5c). A fragile relationship between fluoride and nitrate levels was observed (R2 = 0.001) with a negative trend (Figure 5d). Fluoride and phosphate levels showed a weak negative correlation (R2 = 0.03) and a decreasing trend (Figure 5e). The correlation between fluoride and sulphate levels (R2 = 0.63) indicates a strong positive relationship with an increasing trend (Figure 5f). The correlation reveals a very weak positive relationship between fluoride and pH, and the trend is static and minimally increasing (Figure 5g). Further, the correlation value (R2 = 0.40) indicates a high positive relationship between fluoride and TDS with a sharp increasing trend (Figure 5h). Finally, the study reported a negative correlation between fluoride and turbidity (R2 = 0.08), which is also showing a decreasing trend. (Figure 5i). The outcomes of water quality tests carried out on diverse sources of water in Neerukonda are summarized. The data provide measurements of F, Cl, NO3−, NO2−, Br, PO₄3−, and SO₄2− levels found in samples taken from drinking water, tanks, ponds, wells, and household water (Table 2). The results obtained from the testing play a crucial role in assessing the safety of these water sources and help in identifying potential health hazards associated with the consumption of the water.

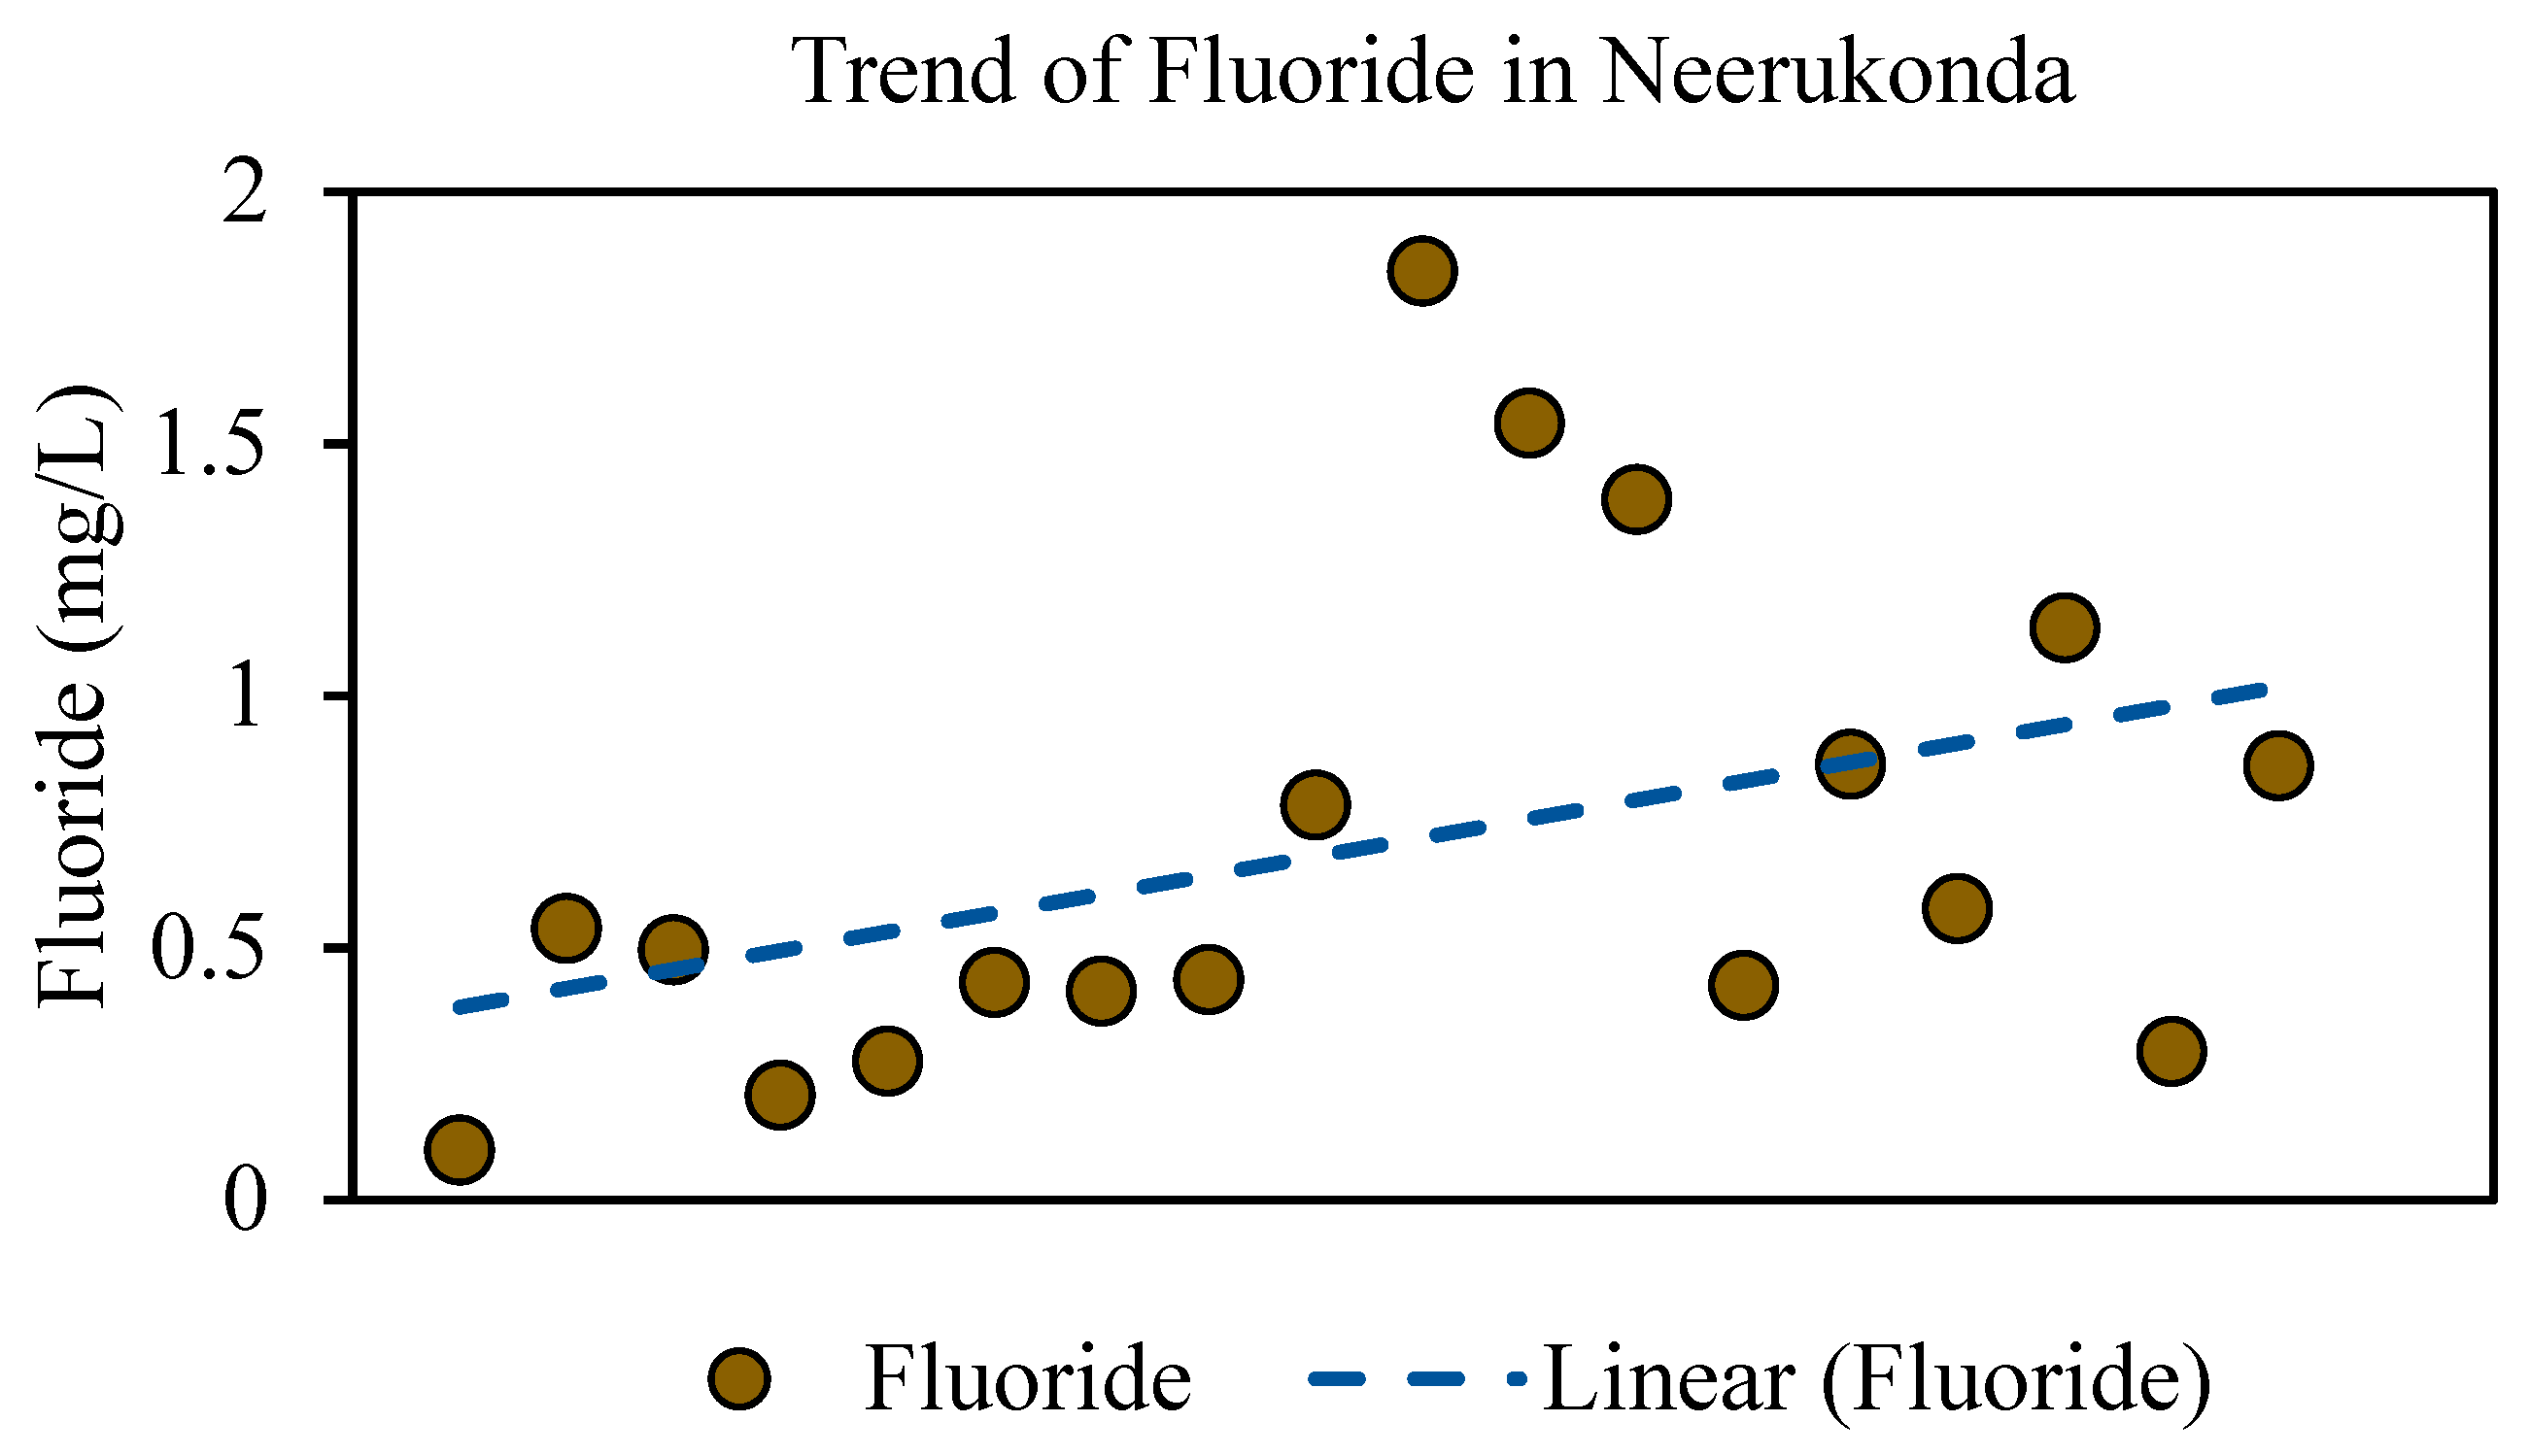
3.3. Assessment of Local Scale Occurrence of Fluoride in Water

The water samples from the study area were collected from different water sources including a deep well, surface water bodies (pond), and household tanks. Fluoride concentration was detected, and the descriptive statistics of the fluoride concentrations along with other physicochemical parameters of water are provided in Table 1. The average F concentration of the study area across all sources is 0.7 mg/L. The fluoride concentration ranged from 0.10 to 1.84 (SD ± 0.7) (Table 1). However, the variation in fluoride concentration depending on the sources was observed in different sampling locations of the study area. The highest fluoride concentrations were observed (>1.5 mg/L) in two locations out of all the samples (H2 and H3) in Neerukonda. The fluoride concentrations in two other samples ranged between 1.5 and 1.0 mg/L, whereas the remaining 14 samples showed a concentration of below 1 mg/L (Table 3) (Figure 6a). Sector–wise, the trend in fluoride concentration showed a different pattern for different water sources (Figure 6b). The trend of fluoride in household and tubewell water samples showed a decreasing trend, while an increasing trend was observed for surface water bodies and well water (Figure 6b). But as an aggregate of all water sources, a positive trend in fluoride concentration was observed in the study area (Figure 7). It is important to note that the WHO (2017) recommendation states that fluoride concentration in drinking water should be maintained between 0.5 and 1.5 mg/L [13]. Therefore, the samples with fluoride concentrations greater than 1.5 mg/L could be of high concern, and appropriate measures should be taken to ensure the safety of drinking water.

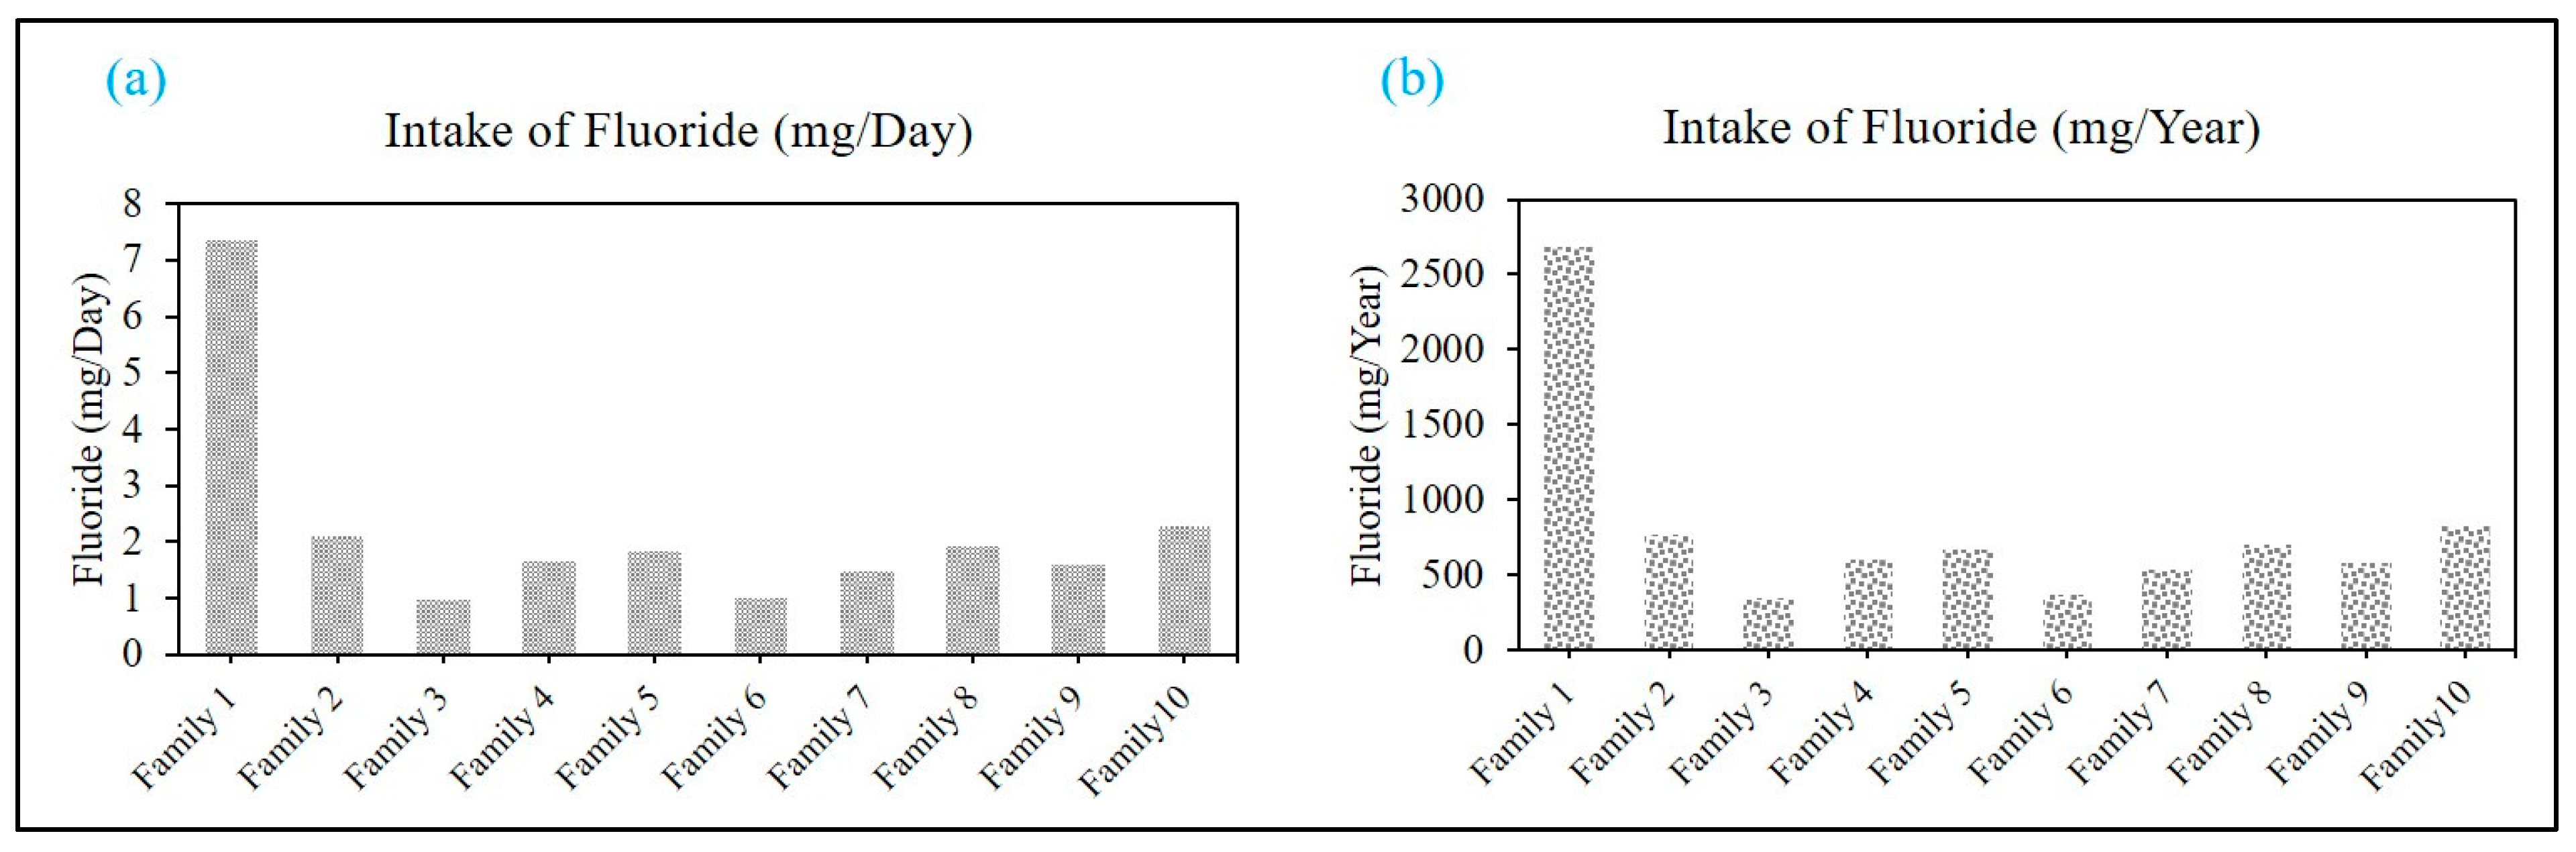
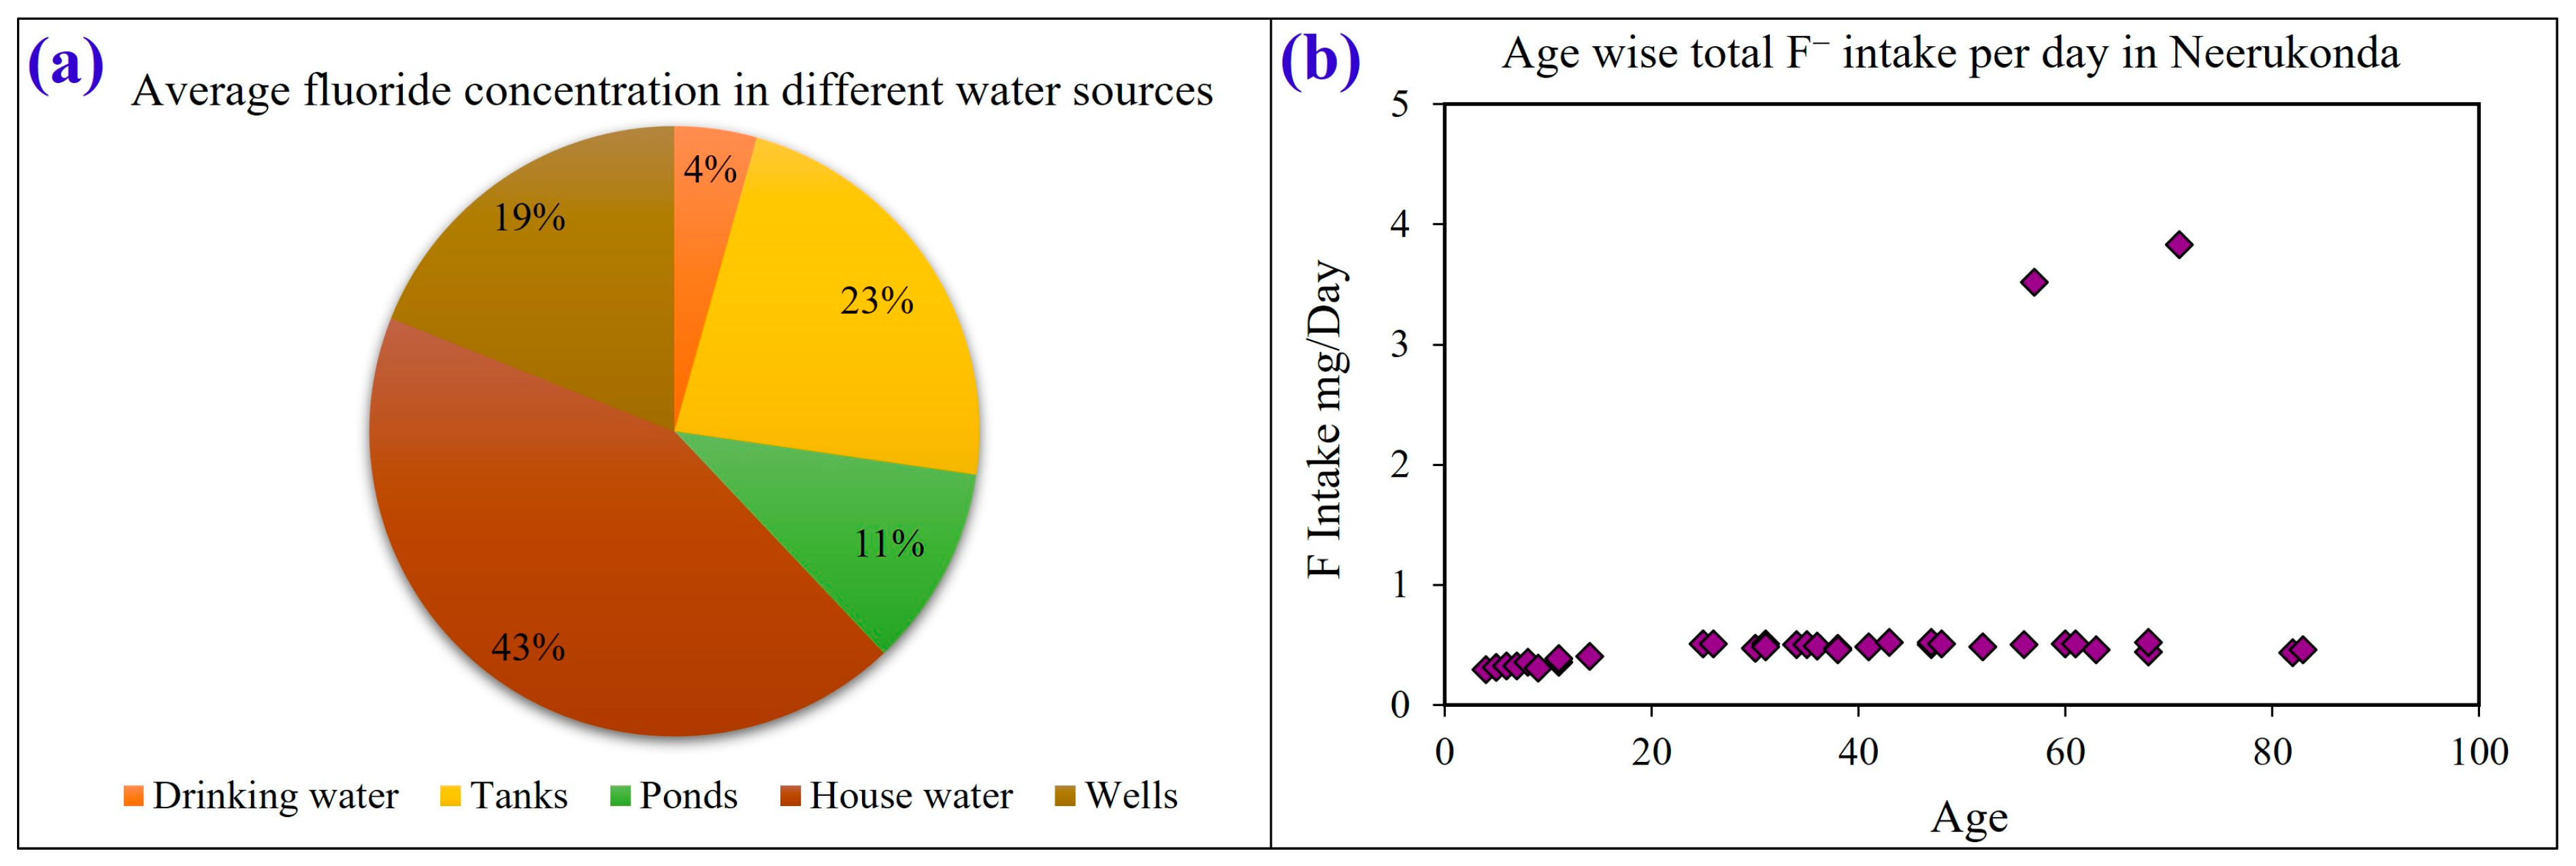
3.4. Intake of Fluoride and Its Future Status

Freshwater is one of the main basic needs for human consumption, but this valuable resource is under threat due to natural and anthropogenic drivers. This study revealed the consumption pattern of drinking water by surveying ten families from Neerukonda and exposed their fluoride consumption pattern. In addition, the study also revealed the future intake capacity of fluoride, which will further shed light on major health cautions. It has been observed from all families that family-1, which relies on underground tap water (D1) as their primary source of drinking water, has the highest consumption of F (~7.5 mg/day, 2684 mg/year) (Table 4) (Figure 8a,b). On closer examination of family-1′s data, it can be inferred that the use of underground tap water as a source of drinking water indirectly results in a high level of fluoride intake. Family-10 is the second highest (~828 mg/year) fluoride consumer in drinking water, whereas family-2 (767 mg/year), family-4 (606 mg/year), family-5 (~667 mg/year), and family-8 (706 mg/year) have a consumption rate between 600–770 mg/year (Table 4, Figure 8b), and the remaining families have a lower consumption pattern (300–550 mg/L) (Table 4, Figure 8b). Upon a closer examination of Table 5 summarizing characteristics regarding family-1, it was reported that their water consumption amounts to a minimum of 3–4 L, resulting in a fluorine uptake of 3.8–3.5 mg/L, exceeding the permissible limit by two–fold. Over time, this accumulation of fluoride can result in severe health complications. It is worth noting that these individuals lack formal education, emphasizing the critical need to raise awareness regarding the risks associated with their water consumption habits.

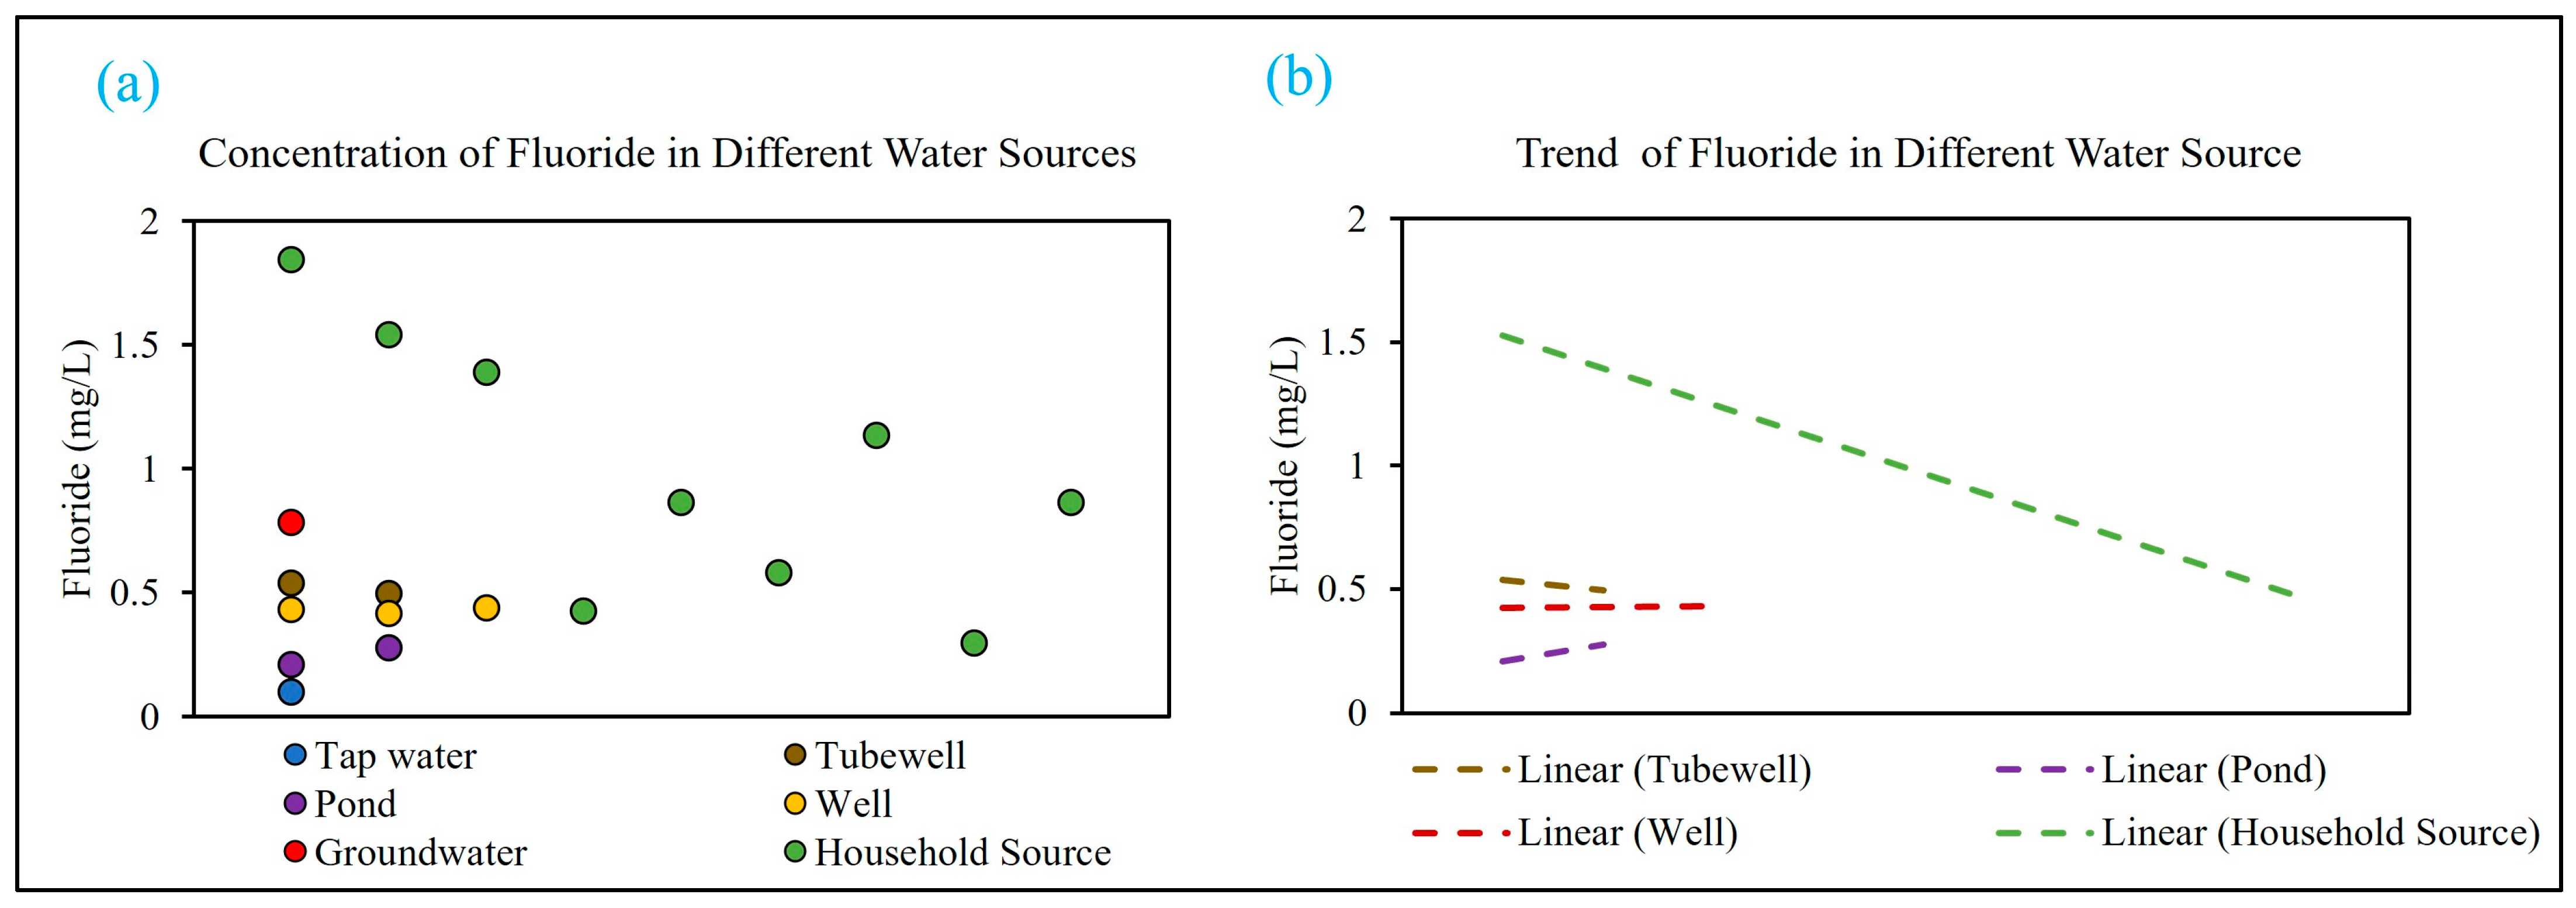
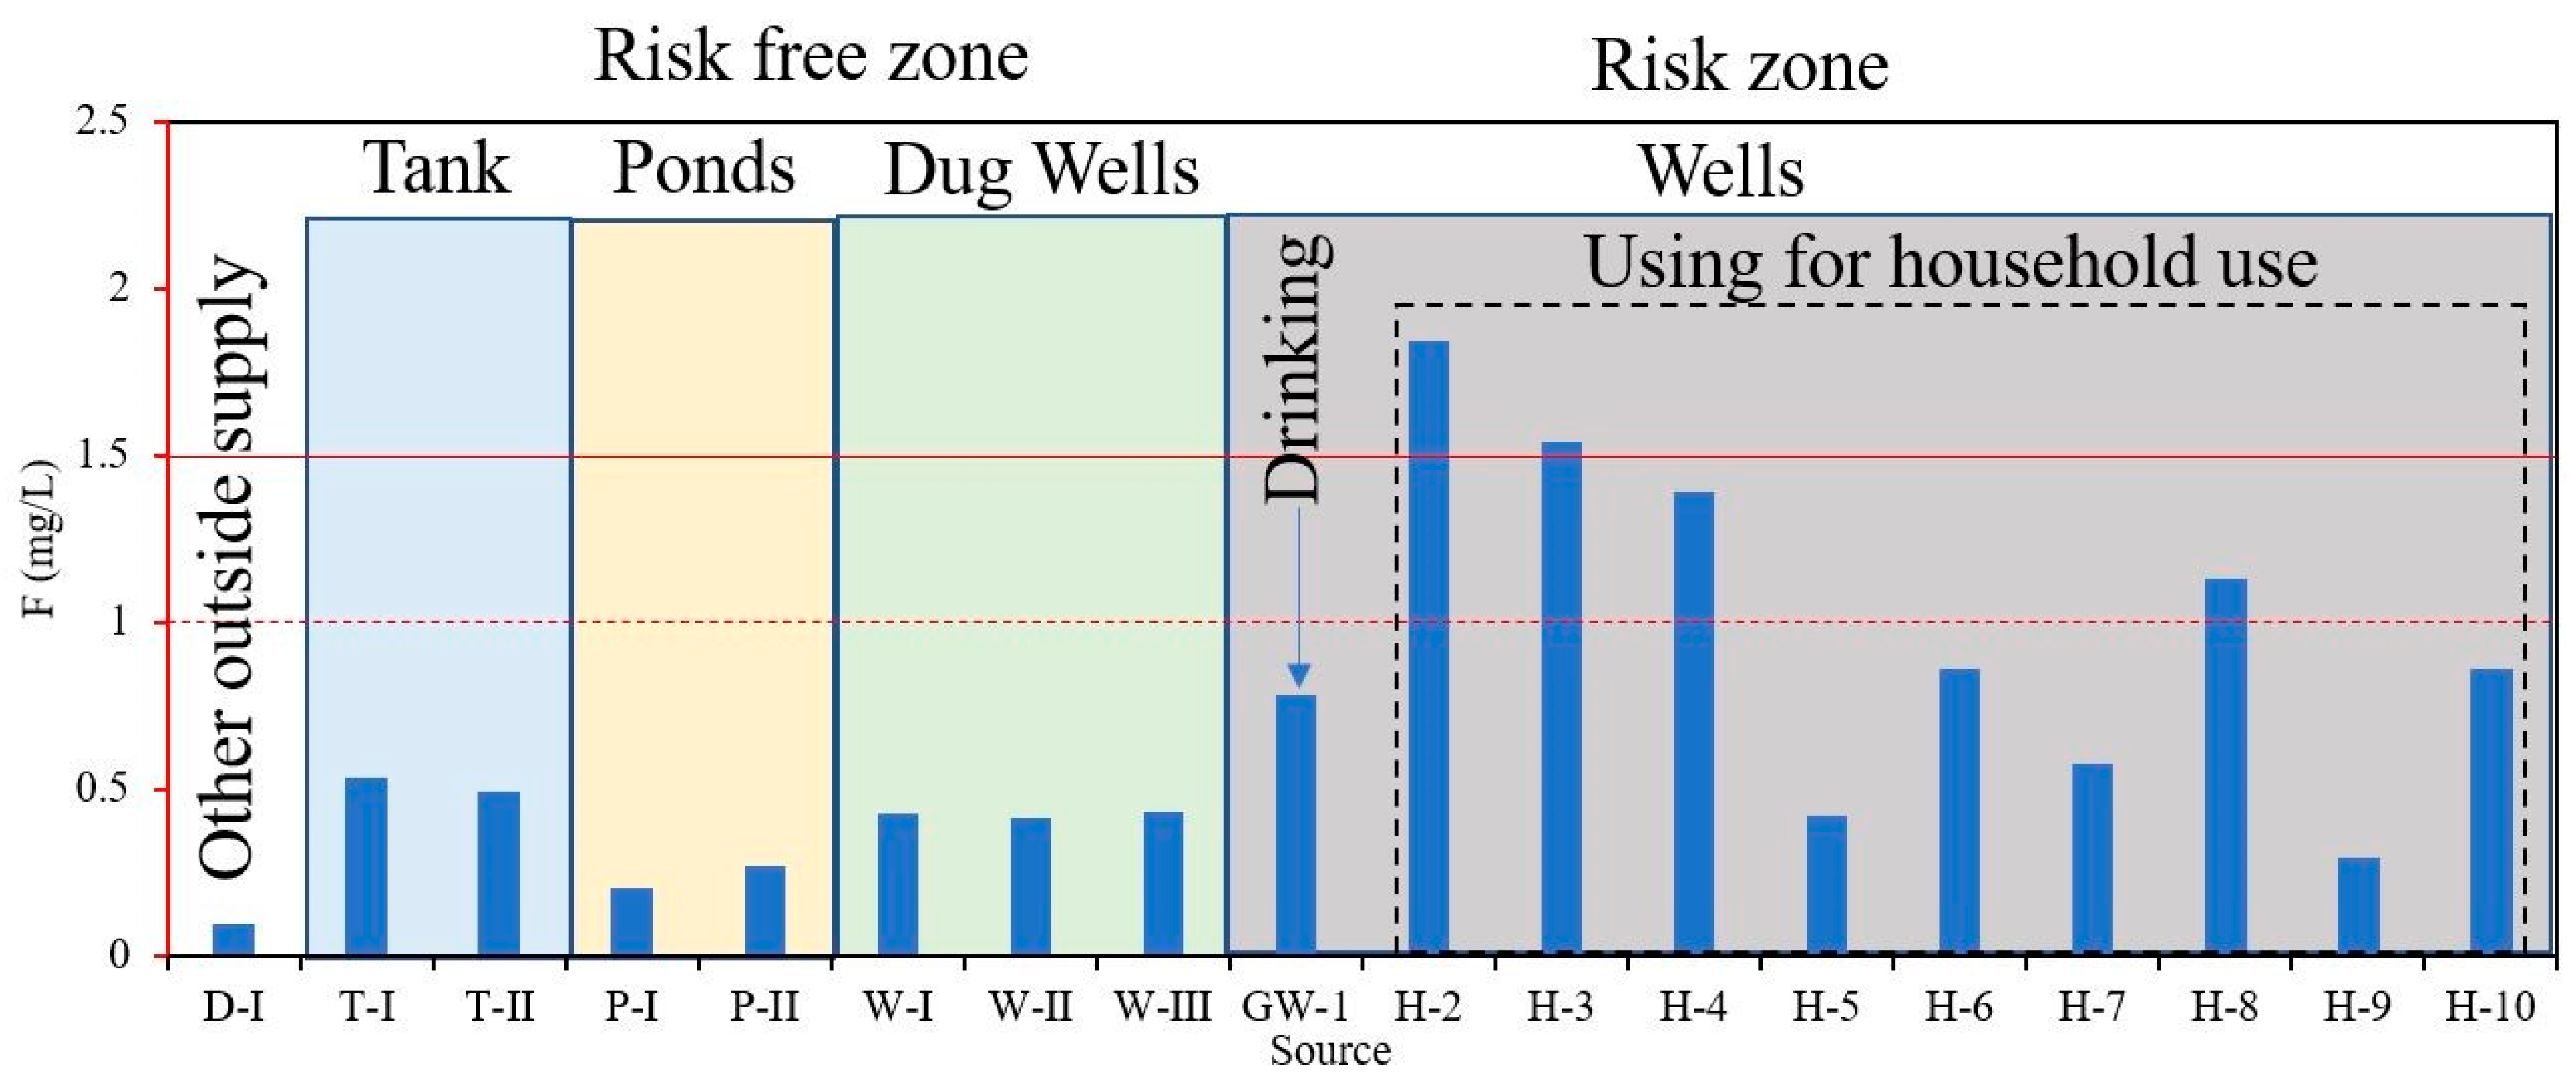
3.5. Source–Based Fluoride Concentration and Their Zonation

The fluoride concentration in different water sources was reported. It was found that the water which is used by most of the families (‘Household Water’ H1, H2, H3, H4, H5, H6, H7, H8, H9, and H10) has a remarkable concentration of fluoride and the average is about 0.98 mg/L and maximum is 1.84 mg/L, which constitutes 43% of the total fluoride across all water sources (Table 6, Figure 9a). Tank water shows the second highest fluoride rate (~0.5 mg/L), and it covers 23% of all sources (Figure 9a). Well water also shows an average fluoride concentration of 0.43 mg/L, and it covers 19% of the total (Figure 9a). Surface water bodies and drinking water source show relatively low F concentration, and they constitute 11% and 4% of all sources respectively (Table 6, Figure 9a).
A household survey was conducted to record the water intake of different age groups. A subsequent analysis of age–based intake of fluoride was conducted (Figure 9b). The highest consumption was found in the 50–80 age group (Figure 9b). The survey revealed a common misconception that boiling drinking water can solve the problem of excessive fluoride content. However, the reality is that boiling can increase the fluoride concentration as the water evaporates and the fluoride ions remain behind. As a result, the remaining water becomes more concentrated with fluoride. To estimate the minimum and maximum exposure doses of fluoride, the mean, minimum, and maximum range of water fluoride levels was calculated (Table 6, Figure 9a). The study revealed the fluoride content in different water sources of Neerukonda (Figure 9). It identified the risk–free zones and risk zones for varying water sources and suggested what purpose the water can be used for at different fluoride concentration levels (Figure 10). Well water falls under high–risk zone which can be used only for household or domestic purposes and should be avoided for drinking needs (Figure 10). Water from other sources like deep groundwater and tanks can be used for drinking purposes as mentioned (Figure 10). The red dashed line shows the F of 1 mg/L and red solid line shows the F concentration is more than 1.5 mg/L (Figure 10).

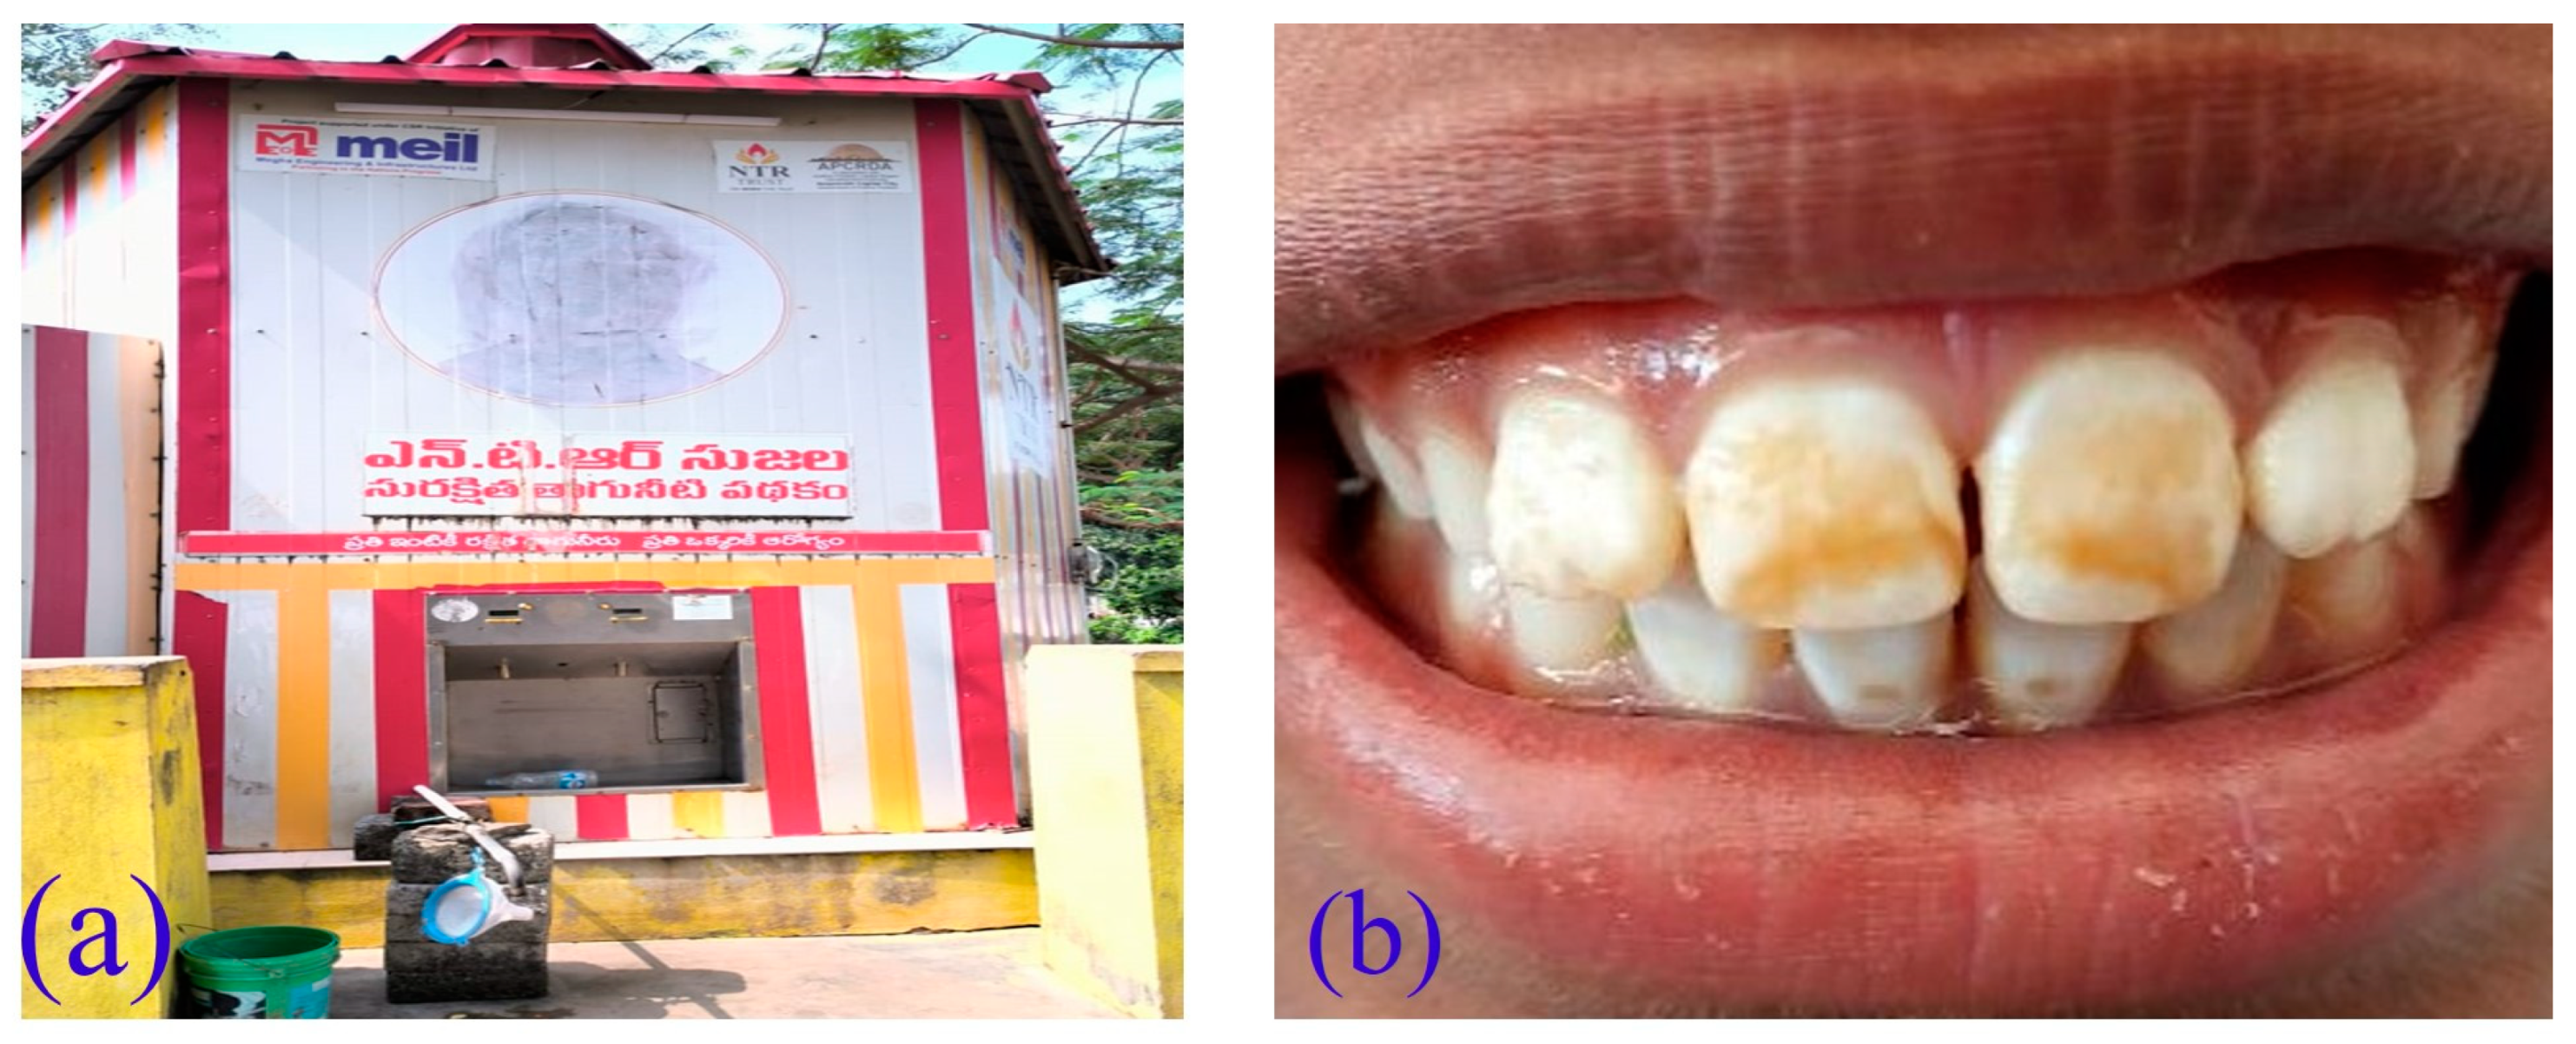
3.6. The Main Source of Water in the Study Area

The water supply in Neerukonda village predominantly relies on water tankers sourced from the nearby village of Rayapudi, which, in turn, draws its water from the Krishna River. This water source is recognized for its reliability and accessibility, with some individuals opting to directly purchase water from this facility. To ensure quality, the water transported by tankers undergoes filtration through advanced state–of–the–art systems within the NTR Sujala (Nandamuri Taraka Rama Rao (NTR)) water system (Figure 11a). Each tanker has a capacity of 4 KL and is made available on a daily basis. While certain households in Neerukonda have the means to afford the supplied drinking water from NTR Sujala, priced at INR 7 for a 20 L container, others, particularly those with an unstable income, rely on groundwater for their drinking water requirements.

4. Discussion

4.1. Present Status of Groundwater in Comparison with the Existing Study

Fresh groundwater has now become the sole source of drinking water across most parts of the world, especially water–scarce regions. The water is degrading in terms of quality and quantity, and the natural or geogenic and anthropogenic drivers are the major forces to do so. The source of water in Neerukonda is primarily groundwater, which is contaminated with fluoride due to the geological composition of the region [6]. The excess fluoride content in drinking water is a result of the leaching of fluoride–rich minerals from the surrounding rocks and soil [27,28,29]. The positive relationship of pH with fluoride represents an important determining factor for F availability in groundwater [30,31]. The correlation suggests that a positive correlation of F with relatively high pH tends to mobilize F from mineral surfaces (Figure 5g). The fluoride contamination of groundwater is a pervasive issue across India, and a similar situation has been observed in Neerukonda. For instance, Nalgonda in Telangana grappled with excessive fluoride in its water sources, leading to health adversities mirroring those in Neerukonda [28]. In Jhabua, Madhya Pradesh, and Agra, Uttar Pradesh, similar challenges arose as families with limited means faced difficulties in accessing safe drinking water due to fluoride contamination [32,33,34].
Studies across different regions of Andhra Pradesh have revealed varying levels of fluoride in different hydrogeological conditions. The results revealed in this study show substantial variations in fluoride concentrations across the varying water sources which are in line with other parts of the Andhra Pradesh [19,21,22,35]. These findings hold significance not only at a local level but also within the broader regional context of water quality and public health. One of the focus areas was the Vamsadhara River Basin, where groundwater displayed fluoride levels ranging from 1.0 to 3.4 mg/L [35]. Notably, disparities were observed between clayey and sandy soils, suggesting that geological composition plays a crucial role in fluoride concentration [36]. The Anantapur district of Andhra Pradesh, which exhibited groundwater with less than 4 mg/L of fluoride, originated from diverse geological formations [36]. To address this issue, a sustainable approach was proposed, involving the construction of upstream check dams. This method aims to recharge and dilute fluoride levels, presenting a potential solution for similar areas facing similar challenges. Significant seasonal fluctuations in fluoride levels were noted in the southeastern part in Ranga Reddy District [37]. These fluctuations were linked to the presence of specific ions, namely Ca2+ and HCO3 [37]. However, the study did not offer specific sustainable solutions for managing fluoride levels in this region. In Nalgonda District, while groundwater contained less than 5 mg/L of fluoride, the potential for fluorosis remained a concern [7]. A sustainable solution has been proposed involving water harvesting through small dams [7]. Additionally, they recommended concentrating recharge at the dam site and employing local gypsum treatment to mitigate fluoride–related issues [7]. Furthermore, the findings in Prakasam’s Marripudi village indicated fluoride levels of less than 11 mg/L, leading to dental and musculoskeletal fluorosis [38]. The proposed sustainable measure centered around increasing awareness among the local population about water quality issues and their connection to fluorosis and arsenicosis [38]. These research outcomes extend beyond Andhra Pradesh, offering insights into the broader global challenge of managing groundwater quality. The strategies proposed in this study provide a blueprint for regions facing similar issues across Andhra Pradesh. Moreover, this study underscores the pressing need to enhance the awareness and knowledge of local communities concerning fluoride content and its impact on health. It is crucial to recognize that this issue extends beyond human populations, affecting mouthless animals as well. This emphasis on education emerges as a vital component in addressing the multifaceted dimensions of fluoride contamination. In essence, this research not only contributes to a deeper understanding of groundwater quality dynamics but also offers practical guidance for effective involvement, emphasizing the significance of community education in mitigating the widespread effects of fluoride contamination. This research in Neerukonda highlights the importance of adhering to global guidelines, such as WHO standards (2017), to ensure safe water, a principle also embraced in Agra [39,40]. These examples underscore the urgent need for a coordinated, nationwide effort to combat fluoride contamination, utilizing research insights from Neerukonda as a valuable reference for addressing this critical issue affecting communities throughout India.

4.2. Global Overview of Fluoride Occurrence and Associated Health Impacts

The comprehensive table (Table S1) presents a global overview of regions facing elevated F levels in water, thereby posing significant health risks such as dental and skeletal fluorosis. The correlation between F concentrations and adverse health effects, including a potential reduction in intelligence in children, is a prominent focus. The data underscore the urgency for implementing water treatment techniques to mitigate the health hazards associated with excessive F content.
Examining specific case studies across the world has revealed different challenges. In Karonga, Malawi, groundwater with F concentrations spanning from 0.30 to 2.0 mg/L poses threats to dental health, impacting vital sectors like international trade, fishing, and agriculture [41]. The main source of F in groundwater is dissolution of fluorite (CaF2−) [41]. South Iran highlights heightened F levels (0.8–3 mg/L) in groundwater where the source of F has been attributed to limestone layers [42]. Vyeboom, South Africa, witnessed F levels of 0.44–0.9 mg/L, resulting in skeletal fluorosis, particularly linked to agricultural and industrial activities [43]. A high level of F (max. 13 mg/L) has been determined in water in Ethiopia that caused dental and skeletal fluorosis [44]. One study recommends the implementation of treated surface water for extensive populations [45]. In Riyadh, Saudi Arabia, the local water authority recommends fluoridation in water treatment plants [46], while Serbia delves into correlations between F levels in hair, well water, and tap water, emphasizing dental fluorosis prevalence [47]. In Sihong County and Jiangsu Province, China, a F range of 0.6–4.5 mg/L has been observed which had an adverse effect on intelligence on children and caused high dental fluorosis [48]. In Texas, the Woodbine aquifer has high F levels above 4 mg/L, affecting farming and industry [49]. Further, in Sonora, Mexico, groundwater F has been found between 0.5 and 7.6 mg/L, causing fluorosis among the local people [50]. This highlights how both nature and human activities contribute to F issues in water. It stresses the importance of customized, long–term solutions for managing water and keeping public health in mind.

4.3. Study Unveiled the Possible Reasons and Factors behind the Fluoride Exposure

We have conducted a thorough survey where we have checked the availability of groundwater resources and secondary water resources for drinking and other household usage. During the survey we have checked with 10 families in detail regarding their water consumption pattern and reason behind the selection of drinking sources, as all of the groundwater has a reasonable amount of F. An economic imbalance regarding exposure to fluoride in drinking water can exacerbate existing health disparities and widen the gap between those with access to safe drinking water and those without. A review by WHO has recommended that at least 8 L water per capita/day is a minimum need for maintaining daily life [51]. But the economic burden associated with accessing safe drinking water can disproportionately affect economically unstable populations, leading to potentially harmful exposures to fluoride and other contaminants [52]. Addressing these disparities in access to safe drinking water is critical for promoting equitable health outcomes and reducing health inequalities within communities [53]. Individuals with higher economic stability and awareness have access to safer drinking water while those who are economically unstable and unaware are at higher risk [25,54,55]. The study findings indicate that family-1 is economically unstable, while families 2 to 10 are economically stable, and this economic imbalance has significant implications for the community’s health and well–being. Families (2 to 10) having higher annual income are using externally sourced groundwater with low fluoride content. Annually, as per the Government of India, the gross annual per capita income is INR 219,518 (Ministry of Statistics and Program Implementation; https://www.pib.gov.in/PressReleasePage.aspx?PRID=1942055 (accessed on 14 January 2024)). Family-1 does not have any regular income and is surviving on a government pension plan, i.e., “YSR Pension Kanuka”, which is a Social Security Scheme by the Panchayat Raj and Rural Development Department, Government of Andhra Pradesh (The benefit under each pension for Old Age Pension (OAP), Single Women, Weavers, Widow, Fisherman, Toddy Tappers, PLHIV (ART Pensions), Traditional Cobblers is INR 2250 per month and for Disabled, Transgender, Dappu Artists pensions is INR 3000 per month), with an annual remuneration of INR 27,000, which is barely the minimum amount to meet all their needs. The families 2 to 10 are spending an average of INR 176 per month and INR 2142 per year on water. This amount may be considered high for some families, and it highlights the economic burden associated with accessing safe drinking water. Due to their economic instability, family-1 is unable to access safe drinking water, and they are exposed to higher levels of F.

4.4. Exposure to Fluoride Contamination and Associated Health Impacts

Exposure to excessive amounts of fluoride ions in drinking water can lead to a variety of health problems, including dental fluorosis, skeletal fluorosis, arthritis, bone damage, osteoporosis, muscular damage, fatigue, joint–related problems, and chronic health issues [56,57,58]. To mitigate these risks, WHO (2017) has regulated the upper limit for fluoride in drinking water to be 1.5 mg/L [13]. However, different countries may set their own standards based on their unique circumstances. As per the BIS (2012), the permissible limit of fluoride in groundwater is 1 mg/L, whereas up to 1.5 mg/L is the acceptable limit [26] where an alternative source is unavailable, which leads to neural disorders, dental and skeletal fluorosis, and even high chances of myopathy [58]. Therefore, it is possible that some people in Neerukonda village are experiencing health problems due to the high fluoride levels in the groundwater. The survey in Neerukonda found that some people, due to excess fluoride intake, may experience several health problems including dental fluorosis (Figure 11b), skeletal fluorosis, which causes back pain and knee pain, and gastrointestinal effects. The Government of Andhra Pradesh has taken several measures to mitigate the issue, including setting up community–based water treatment plants and providing alternative sources of safe drinking water [59,60,61]. However, the problem persists, and more efforts are needed to ensure that the people of Neerukonda have access to clean and safe drinking water.

4.5. Limitations of the Study

The area selected for the study has a F concentration of 1.1 to 1.5 mg/L in house 4 and house 8 and more than 1.5 mg/L in house 3 and house 2. The study focused only on fluoride concentration in groundwater and did not consider other sources of exposure such as food, air, and dental products that could affect human health. The range of F concentration in houses 4, 8, 3, and 2 show the prevalence of health effects such as dental fluorosis and skeletal damage. In addition to the F contamination of drinking water, other food sources were not considered, which may also have some contribution to dental fluorosis (DF), urinary fluoride (UF) concentration, body mass index (BMI) loss, and intellectual quotient (IQ) in children. In addition, the 24 h monitoring of UF concentration could provide better results. The rate of water consumption was collected through a household survey, which may lead to some degree of inaccuracy.

5. Conclusions

The present study was conducted to understand the trends of groundwater F concentration in the topical dry region of India on a regional scale (State Andhra Pradesh) integrated with a local–scale focused study (Neerukonda village, Guntur, Andhra Pradesh). The study investigated the occurrence of F in multiple sources of household water along with the potential daily consumption of fluoride via drinking water and the rationale for this exposure. The regional–level study has unveiled the high level of fluoride (maximum range: 3.8 to 5.4 mg/L) across the state on the temporal scale from 2014 to 2018. Similarly, the study conducted in Neerukonda village of Guntur district highlights the significance of monitoring the levels of fluoride in drinking water sources to ensure community safety and well–being. The survey conducted in the village has provided a comprehensive analysis of the water quality and identified potential risks to public health. The findings of the study reveal that F exposure is higher in economically unstable families (average is 0.98 mg/L and maximum rate is 1.84 mg/L) who rely on F containing groundwater for drinking and household use, while those who consume water from an external source on a paid basis experience less F exposure. Family-1 is economically unstable, while families 2 to 10 are economically stable, and this economic imbalance has significant implications for the community’s health and well–being. The potential source of fluoride has been identified as geogenic in nature as the area is located near the geological formation of granite/gneiss, conglomerate, and quartz, which is more vulnerable to groundwater fluoride contamination. The study focused only on fluoride concentration in groundwater and did not consider other sources of exposure such as food, air, and dental products that could affect human health. In addition, the rate of water consumption was collected through a household survey, which may lead to some degree of inaccuracy. So, this study suggests that proper management practices and public awareness programs are crucial to promote the use of safe and clean drinking water sources, particularly among economically unstable families. Despite the limitations of the study, it provides valuable insights into the water quality situation in Neerukonda village and can serve as a reference for future research and policy–making decisions in the field of water management and public health. Further research is needed to provide a more comprehensive understanding of the issue, especially in other communities and across different sources of exposure.

Supplementary Materials

The following supporting information can be downloaded at: https://www.mdpi.com/article/10.3390/w16040577/s1, Figure S1: Average fluoride trend in Andhra Pradesh (AP) (2014–2018); Table S1: Global occurrence of fluoride contamination in water and associated health effects.

Author Contributions

Conceptualization, G.Y., S.K., G.S.V.S., M.T.K.N. and K.D.; methodology, G.Y., S.K., G.S.V.S., M.T.K.N. and K.D.; formal analysis, G.Y., S.K., G.S.V.S., M.T.K.N., M.M., S.S. and K.D.; investigation, M.M., U.D., K.D. and P.K.; data curation, G.Y., S.K., G.S.V.S., M.T.K.N., M.M., S.S. and K.D.; writing—original draft preparation, G.Y., S.K., G.S.V.S., M.T.K.N., M.M., U.D. and K.D.; writing—review and editing, M.M., U.D., S.S., K.D., and P.K.; visualization, G.Y., S.K., G.S.V.S., M.T.K.N., M.M. and K.D.; supervision, K.D. and P.K. All authors have read and agreed to the published version of the manuscript.

Funding

This research received no external funding.

Data Availability Statement

Data will be made available upon request.

Acknowledgments

We are thankful to SRM University AP, Amaravati, for providing necessary administrative and technical support and lab facilities (Multiparameter Probe (PO: COM–SRM/UNIV/AP/Dec/22–23/PUR–00592, DATE–26 December 2022 [Make: HANNA, Model: H198194]) and the Department of Environmental Science and Engineering, Indian Institute of Technology Kharagpur, for sample analysis. We also thank the Central Ground Water Board of India and the Ministry of Jal Shakti, Government of India, for their assistance with data. We extend sincere gratitude to the SRM University AP for providing the university fellowship to PhD student Mijanur Mondal and a post–doctoral fellowship to Uttiya Dey.

Conflicts of Interest

The authors declare no conflicts of interest.

References

  1. Karthikeyan, K.; Nanthakumar, K.; Velmurugan, P.; Tamilarasi, S.; Lakshmanaperumalsamy, P. Prevalence of certain inorganic constituents in groundwater samples of Erode district, Tamilnadu, India, with special emphasis on fluoride, fluorosis and its remedial measures. Environ. Monit. Assess. 2010, 160, 141–155. [Google Scholar] [CrossRef] [PubMed]
  2. Maheshwari, R.C. Fluoride in drinking water and its removal. J. Hazard. Mater. 2006, 137, 456–463. [Google Scholar]
  3. Podgorski, J.; Berg, M. Global analysis and prediction of fluoride in groundwater. Nat. Commun. 2022, 13.1, 4232. [Google Scholar] [CrossRef]
  4. Das, K.; Mondal, N.K. Dental fluorosis and urinary fluoride concentration as a reflection of fluoride exposure and its impact on IQ level and BMI of children of Laxmisagar, Simlapal Block of Bankura District, WB, India. Environ. Monit. Assess. 2016, 188, 218. [Google Scholar] [CrossRef] [PubMed]
  5. Araya, D.; Podgorski, J.; Kumi, M.; Mainoo, P.A.; Berg, M. Fluoride contamination of groundwater resources in Ghana: Country–wide hazard modeling and estimated population at risk. Water Res. 2022, 212, 118083. [Google Scholar] [CrossRef]
  6. Mukherjee, I.; Singh, U.K. Groundwater fluoride contamination, probable release, and containment mechanisms: A review on Indian context. Environ. Geochem. Health 2018, 40, 2259–2301. [Google Scholar] [CrossRef]
  7. Jacks, G.; Bhattacharya, P.; Chaudhary, V.; Singh, K.P. Controls on the genesis of some high fluoride groundwaters in India. Appl. Geochem. 2005, 20, 221–228. [Google Scholar] [CrossRef]
  8. Guo, Q.; Wang, Y.; Ma, T.; Ma, R. Geochemical processes controlling the elevated fluoride concentrations in groundwaters of the Taiyuan Basin, Northern China. J. Geochem. Explor. 2007, 93, 1–12. [Google Scholar] [CrossRef]
  9. He, J.; Yang, Y.; Wu, Z.; Xie, C.; Zhang, K.; Kong, L.; Liu, J. Review of fluoride removal from water environment by adsorption. J. Environ. Chem. Eng. 2020, 8, 104516. [Google Scholar] [CrossRef]
  10. Jha, S.K.; Nayak, A.K.; Sharma, Y.K. Fluoride occurrence and assessment of exposure dose of fluoride in shallow aquifers of Makur, Unnao district Uttar Pradesh, India. Environ. Monit. Assess. 2009, 156, 561–566. [Google Scholar] [CrossRef]
  11. Kumar, S.; Singh, R.; Venkatesh, A.S.; Udayabhanu, G.; Sahoo, P.R. Medical Geological assessment of fluoride contaminated groundwater in parts of Indo–Gangetic Alluvial plains. Sci. Rep. 2019, 9, 16243. [Google Scholar] [CrossRef]
  12. Shaji, E.; Santosh, M.; Sarath, K.V.; Prakash, P.; Deepchand, V.; Divya, B.V. Arsenic contamination of groundwater: A global synopsis with focus on the Indian Peninsula. Geosci. Front. 2021, 12, 101079. [Google Scholar] [CrossRef]
  13. WHO. Guidelines for Drinking-Water Quality. 2017. Available online: https://iris.who.int/bitstream/handle/10665/254637/9789241549950–eng.pdf?sequence=1 (accessed on 18 January 2024).
  14. Xiao, Y.; Liu, K.; Hao, Q.; Li, Y.; Xiao, D.; Zhang, Y. Occurrence, controlling factors and health hazards of fluoride–enriched groundwater in the lower flood plain of Yellow River, Northern China. Expo. Health 2022, 14, 345–358. [Google Scholar] [CrossRef]
  15. Ahmad, S.; Singh, R.; Arfin, T.; Neeti, K. Fluoride contamination, consequences and removal techniques in water: A review. Environ. Sci.: Adv. 2022, 1, 620–661. [Google Scholar] [CrossRef]
  16. Molina–Frechero, N.; Nevarez–Rascón, M.; Nevarez–Rascón, A.; González–González, R.; Irigoyen–Camacho, M.E.; Sánchez–Pérez, L.; López–Verdin, S.; Bologna–Molina, R. Impact of dental fluorosis, socioeconomic status and self–perception in adolescents exposed to a high level of fluoride in water. Int. J. Environ. Res. Public Health 2017, 14, 73. [Google Scholar] [CrossRef] [PubMed]
  17. Central Groundwater Board (CGWB) Yearbook. 2015. Available online: https://www.cgwb.gov.in/cgwbpnm/public/uploads/documents/16859490001103678817file.pdf (accessed on 18 January 2024).
  18. Tukey, J.W. Exploratory Data Analysis; THETA, Statistical Genetics Group: Wrocław, Poland, 1977; Volume 2, pp. 131–160. [Google Scholar]
  19. Sujatha, D. Fluoride levels in the groundwater of the south–eastern part of Ranga Reddy district, Andhra Pradesh, India. Environ. Geol. 2003, 44, 587–591. [Google Scholar] [CrossRef]
  20. Rao, N.S. High–fluoride groundwater. Environ. Monit. Assess. 2011, 176, 637–645. [Google Scholar] [PubMed]
  21. Reddy AG, S.; Reddy, D.V.; Rao, P.N.; Prasad, K.M. Hydrogeochemical characterization of fluoride rich groundwater of Wailpalli watershed, Nalgonda District, Andhra Pradesh, India. Environ. Monit. Assess. 2010, 171, 561–577. [Google Scholar] [CrossRef]
  22. Reddy, B.; Sunitha, V.; Reddy, M. Fluoride and nitrate geochemistry of groundwater from kadiri, mudigubba and nallamada mandals of anantapur district, Andhra Pradesh, India. J. Agric. Eng. Biotechnol. 2013, 1, 37. [Google Scholar] [CrossRef]
  23. Adimalla, N.; Venkatayogi, S.; Das, S.V.G. Assessment of fluoride contamination and distribution: A case study from a rural part of Andhra Pradesh, India. Appl. Water Sci. 2019, 9, 94. [Google Scholar] [CrossRef]
  24. Suneetha, M.; Sundar, B.S.; Ravindhranath, K. Ground water quality status with respect to fluoride contamination in Vinukonda Mandal, Guntur District, Andhra Pradesh, India and defluoridation with activated carbons. Int. J. ChemTech Res. 2015, 7, 93–107. [Google Scholar]
  25. Rao, N.S.; Ravindra, B.; Wu, J. Geochemical and health risk evaluation of fluoride rich groundwater in Sattenapalle Region, Guntur district, Andhra Pradesh, India. Hum. Ecol. Risk Assess. Int. J. 2020, 26, 2316–2348. [Google Scholar]
  26. IS 10500:2012; Specification for Drinking Water. BIS (Bureau of Indian Standards): New Delhi, India, 2012. Available online: https://law.resource.org/pub/in/bis/S06/is.10500.2012.pdf (accessed on 18 December 2023).
  27. Jagtap, S.; Yenkie, M.K.; Labhsetwar, N.; Rayalu, S. Fluoride in drinking water and defluoridation of water. Chem. Rev. 2012, 112, 2454–2466. [Google Scholar] [CrossRef] [PubMed]
  28. Brindha, K.; Rajesh, R.; Murugan, R.; Elango, L. Fluoride contamination in groundwater in parts of Nalgonda District, Andhra Pradesh, India. Environ. Monit. Assess. 2011, 172, 481–492. [Google Scholar] [CrossRef] [PubMed]
  29. Solanki, Y.S.; Agarwal, M.; Gupta, A.B.; Gupta, S.; Shukla, P. Fluoride occurrences, health problems, detection, and remediation methods for drinking water: A comprehensive review. Sci. Total Environ. 2022, 807, 150601. [Google Scholar] [CrossRef] [PubMed]
  30. Gupta, S.C.; Doshi, C.S.; Paliwal, B.L. Occurrence and Chemistry of High Fluoride Groundwaters in Jalore District of Western Rajasthan. Ann. Arid. Zone ANA 2 BX 1986, 25, 225–264. [Google Scholar]
  31. Gupta, S.; Banerjee, S.; Saha, R.; Datta, J.K.; Mondal, N. Fluoride geochemistry of groundwater in Nalhati–1 block of the Birbhum district, West Bengal, India. Fluoride 2006, 39, 318. [Google Scholar]
  32. Sharma, S.K. Water Resources of Madhya Pradesh: Contemporary Issues and Challenges. Water Sci. Sustain. 2021, 2021, 109–125. [Google Scholar]
  33. Ali, S.; Kumari, M.; Gupta, S.K.; Sinha, A.; Mishra, B.K. Investigation and mapping of fluoride–endemic areas and associated health risk—A case study of Agra, Uttar Pradesh, India. Hum. Ecol. Risk Assess. Int. J. 2017, 23, 590–604. [Google Scholar] [CrossRef]
  34. Jacks, G. Fluoride in groundwater: Mobilization, trends, and remediation. In Groundwater Assessment, Modeling, and Management; CRC Press: Boca Raton, FL, USA, 2016; pp. 339–349. [Google Scholar]
  35. Rao, N.S. The occurrence and behaviour of fluoride in the groundwater of the Lower Vamsadhara River basin, India. Hydrol. Sci. J. 1997, 42, 877–892. [Google Scholar] [CrossRef]
  36. Bhagavan, S.V.B.K.; Raghu, V. Utility of check dams in dilution of fluoride concentration in ground water and the resultant analysis of blood serum and urine of villagers, Anantapur District, Andhra Pradesh, India. Environ. Geochem. Health 2005, 27, 97–108. [Google Scholar] [CrossRef] [PubMed]
  37. Rani, K.U.; Sharma, K.L.; Ramachandran, K.; Bindu, V.H. Assessment of Ground Water Quality in Different Villages Situated near Musi River Basin in Ghatkesar Mandal of Ranga Reddy District in Andhra Pradesh. Indian J. Dryland Agric. Res. Dev. 2007, 22, 89–94. [Google Scholar]
  38. Indu, R.; Krishnan, S.; Shah, T. Impacts of groundwater contamination with fluoride and arsenic: Affliction severity, medical cost and wage loss in some villages of India. Int. J. Rural Manag. 2007, 3, 69–93. [Google Scholar] [CrossRef]
  39. Yadav, K.K.; Kumar, V.; Gupta, N.; Kumar, S.; Rezania, S.; Singh, N. Human health risk assessment: Study of a population exposed to fluoride through groundwater of Agra city, India. Regul. Toxicol. Pharmacol. 2019, 106, 68–80. [Google Scholar] [CrossRef] [PubMed]
  40. Howard, G.; Bartam, J.; Williams, A.; Overbo, A.; Fuente, D.; Geere, J.A. Domestic Water Quantity, Service Level and Health, 2nd ed.; World Health Organization: Geneva, Switzerland, 2020; Licence: CC BY-NC-SA 3.0 IGO; Available online: https://iris.who.int/bitstream/handle/10665/338044/9789240015241-eng.pdf?sequence=1 (accessed on 2 February 2024).
  41. Mapoma HW, T.; Xie, X.; Liu, Y.; Zhu, Y.; Kawaye, F.P.; Kayira, T.M. Hydrochemistry and quality of groundwater in alluvial aquifer of Karonga, Malawi. Environ. Earth Sci. 2017, 76, 335. [Google Scholar] [CrossRef]
  42. Battaleb–Looie, S.; Moore, F.; Jacks, G.; Ketabdari, M.R. Geological sources of fluoride and acceptable intake of fluoride in an endemic fluorosis area, southern Iran. Environ. Geochem. Health 2012, 34, 641–650. [Google Scholar] [CrossRef] [PubMed]
  43. Mutileni, N.; Mudau, M.; Edokpayi, J.N. Water quality, geochemistry and human health risk of groundwater in the Vyeboom region, Limpopo province, South Africa. Sci. Rep. 2023, 13, 19071. [Google Scholar] [CrossRef]
  44. Demelash, H.; Beyene, A.; Abebe, Z.; Melese, A. Fluoride concentration in ground water and prevalence of dental fluorosis in Ethiopian Rift Valley: Systematic review and meta–analysis. BMC Public Health 2019, 19, 1298. [Google Scholar] [CrossRef]
  45. Tekle–Haimanot, R.; Melaku, Z.; Kloos, H.; Reimann, C.; Fantaye, W.; Zerihun, L.; Bjorvatn, K. The geographic distribution of fluoride in surface and groundwater in Ethiopia with an emphasis on the Rift Valley. Sci. Total Environ. 2006, 367, 182–190. [Google Scholar] [CrossRef]
  46. Alabdula’aly, A.I. Fluoride content in drinking water supplies of Riyadh, Saudi Arabia. Environ. Monit. Assess. 1997, 48, 261–272. [Google Scholar] [CrossRef]
  47. Zoran, M.; Curcic, M.; Antonijevic, B.; Carevic, M.; Mandic, J.; Djukic–Cosic, D.; Lekic, C.P. Fluoride in drinking water and dental fluorosis. Sci. Total Environ. 2010, 408, 3507–3512. [Google Scholar]
  48. Xiang, Q.; Liang, Y.; Chen, L.; Wang, C.; Chen, B.; Chen, X.; Zhou, M.; Shanghai, P.R. Effect of fluoride in drinking water on children’s intelligence. Fluoride 2003, 36, 84–94. [Google Scholar]
  49. Hudak, P.F.; Sanmanee, S. Spatial patterns of nitrate, chloride, sulfate, and fluoride concentrations in the woodbine aquifer of North–Central Texas. Environ. Monit. Assess. 2003, 82, 311–320. [Google Scholar] [CrossRef]
  50. Valenzuela–Vasquez, L.; Ramirez–Hernandez, J.; Reyes–Lopez, J.; Sol–Uribe, A.; Lazaro–Mancilla, O. The origin of fluoride in groundwater supply to Hermosillo City, Sonora, Mexico. Environ. Geol. 2006, 51, 17–27. [Google Scholar] [CrossRef]
  51. Moe, C.L.; Rheingans, R.D. Global challenges in water, sanitation, and health. J. Water Health 2006, 4, 41–57. [Google Scholar] [CrossRef] [PubMed]
  52. Aleixo, B.; Pena, J.L.; Heller, L.; Rezende, S. Infrastructure is a necessary but insufficient condition to eliminate inequalities in access to water: Research of a rural community intervention in Northeast Brazil. Sci. Total Environ. 2019, 652, 1445–1455. [Google Scholar] [CrossRef]
  53. Mustafa, S.; Jamil, K.; Zhang, L.; Girmay, M.B. Does Public Awareness Matter to Achieve the UN’s Sustainable Development Goal 6: Clean Water for Everyone? J. Environ. Public Health 2022, 2022, 8445890. [Google Scholar] [CrossRef] [PubMed]
  54. Massoud, M.A.; Al–Abady, A.; Jurdi, M.; Nuwayhid, I. The challenges of sustainable access to safe drinking water in rural areas of developing countries: Case of Zawtar El–Charkieh, Southern Lebanon. J. Environ. Health 2010, 72, 24–30. [Google Scholar]
  55. Pink, R.M. Water Rights in Southeast Asia and India; Palgrave Macmillan: New York, NY, USA, 2016; pp. 1–14. [Google Scholar]
  56. Ghosh, A.; Mukherjee, K.; Ghosh, S.K.; Saha, B. Sources and toxicity of fluoride in the environment. Res. Chem. Intermed. 2013, 39, 2881–2915. [Google Scholar] [CrossRef]
  57. Sakshi, S.; Flora, S.J.S. Fluoride in drinking water and skeletal fluorosis: A review of the global impact. Curr. Environ. Health Rep. 2020, 7, 140–146. [Google Scholar]
  58. Ayoob, S.; Gupta, A.K. Fluoride in drinking water: A review on the status and stress effects. Crit. Rev. Environ. Sci. Technol. 2006, 36, 433–487. [Google Scholar] [CrossRef]
  59. Garduño, H.; Foster, S.; Raj, P.; van Steenbergen, F. Addressing groundwater depletion through community–based management actions in the weathered granitic basement aquifer of drought–prone Andhra Pradesh–India. GW–MATE Case Profile Collect. 2009, 19, 51824. [Google Scholar]
  60. Hamilton, S. Community–Based Groundwater Management in Andhra Pradesh, India. Doctoral Dissertation, University of Otago, Dunedin, New Zealand, 2012. [Google Scholar]
  61. Kumar, P.; Singh, C.K.; Saraswat, C.; Mishra, B.; Sharma, T. Evaluation of aqueous geochemistry of fluoride enriched groundwater: A case study of Patan district, Gujarat, Western India. Water Sci. 2017, 31, 215–229. [Google Scholar] [CrossRef]
Figure 1. (a) Location of the study area showing Neerukonda village in Andhra Pradesh and sampling points. (b) Trend of fluoride levels (>1.5 mg/L and <1.5 mg/L) in Andhra Pradesh.
Water 16 00577 g001
Figure 2. Methodological flowchart representing systematic steps of data integration, collection, and data analysis [AP: Andhra Pradesh; NRSC: National Remote Sensing Centre; CGWB: Central Groundwater Board; NRDWP: National Rural Drinking Water Program].
Water 16 00577 g002
Figure 3. Map showing different geological formations of Andhra Pradesh and Guntur district with locations of the sample points in the study area.
Water 16 00577 g003
Figure 4. Box–and–whisker plot showing descriptive statistics of water parameters.
Water 16 00577 g004
Figure 5. Correlation and trends between (a) fluoride and chloride, (b)fluoride and nitrite, (c) fluoride and bromide, (d) fluoride and nitrate, (e) fluoride and phosphate, (f) fluoride and sulphate, (g) fluoride and pH, (h) fluoride and TDS, and (i) fluoride and turbidity.
Water 16 00577 g005
Figure 6. (a) Fluoride concentration in the study area. (b) Trend of fluoride concentration in different water sources.
Water 16 00577 g006
Figure 7. Overall fluoride concentration in the study area showed a positive trend.
Water 16 00577 g007
Figure 8. Family wise intake of fluoride in the time scale of (a) days and (b) years.
Water 16 00577 g008
Figure 9. (a) Average fluoride concentration in different water sources. (b) Total intake of fluoride per day in Neerukonda.
Water 16 00577 g009
Figure 10. Risk–free zones and risk zones of different water sources in Neerukonda.
Water 16 00577 g010
Figure 11. (a) NTR Sujala (drinking water plant), Neerukonda. (b) Dental fluorosis observed in the study area.
Water 16 00577 g011
Table 1. Distribution of chemical constituents of groundwater along with descriptive statistics.
pHTurbidity (NTU)TDS (mg/L)F (mg/L)Cl (mg/L)NO2− (mg/L)Br (mg/L)NO3− (mg/L)PO43− (mg/L)SO42− (mg/L)
Minimum7.52.3720.1012.10.710.600.981.390.39
Maximum9.2548.67341.84922.84.0115.31256.871.75333.54
Mean8.076.53920.70261.41.592.8964.591.5191.40
Coefficient of Variation (CV) 0.3810.61860.49273.01.053.4470.330.1694.74
Standard Deviation (±SD) 0.051.60.50.701.00.661.191.090.101.04
Standard Error (±SE) 0.092.543.80.1164.30.250.8116.580.0422.33
Permissible Limit6.5 to 8.515001250––––45 200
Maximum Permissible Limit
(BIS, 2012) * [26]
No
relaxation
(NR)
520001.51000––––NR 400
Maximum
Permissible Limit
WHO (2017) [13]
6.5–8.5510001.52503––500.01250
Note: * Bureau of Indian Standard (BIS, 2012) [26].
Table 2. Distribution of ions in consumptive and non–consumptive water sources.
SourceWater Sample IDFluoride
(mg/L)
Chloride
(mg/L)
Nitrite
(mg/L)
Bromide
(mg/L)
Nitrate
(mg/L)
Phosphate
(mg/L)
Sulphate
(mg/L)
Outside SupplyD10.1012.160.900.600.98NA7.74
TanksT10.54112.53NA1.061.62NA43.00
T20.5057.680.951.5713.37NA20.59
PondsP10.2193.89NA2.004.501.4015.42
P20.2786.240.780.7711.96NA0.39
WellsW10.43444.761.963.6145.081.75100.33
W20.41301.411.451.51256.87NA105.04
W30.44166.640.711.66105.63NA68.54
Household
Water
H10.7887.560.771.0655.95NA42.09
H21.84922.774.025.0054.87NA333.54
H31.54747.453.740.8962.391.44255.64
H41.39696.491.035.7788.69NA245.67
H50.42415.421.903.9089.631.47136.39
H60.86198.30NA15.31144.10NA82.42
H70.58109.280.721.6324.75NA41.50
H81.1389.441.660.9312.17NA32.29
H90.2974.992.241.88179.15NA81.00
H100.8688.521.092.8511.00NA33.62
Note: NA = Not Available.
Table 3. Distribution of F concentration of groundwater in Neerukonda, Guntur District.
Serial No.F (mg/L)No. of Water SamplesWater Sample IDRemarks
1>1.52H2, H3Unacceptable for
drinking purpose
21.5–1.02H4, H8Fairly acceptable
3<1.014D1, T1, T2, P1, P2, W1, W2, W3, GW1, H5, H6, H7, H9, H10Acceptable for drinking
Table 4. Fluoride intake of each family in Neerukonda, Guntur District.

Family
ID
Number of MembersTotal Water Consumed by Family
(L/Day)
SourceSample NameAmount of Fluoride (mg/L)Total Intake of F/Family/Day
(L)
Intake of Family/Year
(L)
Family-129.4Underground Tap waterH10.787.42684.4
Family-2521Drinking water H20.102.1752.7
Family-3210Drinking waterH30.100.98358.4
Family-4417Drinking waterH40.101.7609.3
Family-5419Drinking waterH50.101.9681
Family-6210Drinking waterH60.100.98358.4
Family-7315Drinking waterH70.101.5537.7
Family-8420Drinking waterH80.101.96716.9
Family-9416Drinking waterH90.101.6573.5
Family-10523Drinking waterH100.102.3824.4
Table 5. Intake of fluoride by the individuals of family-1.
Family
ID
Family MembersAgeTotal Water ConsumedSourceAmount of Fluorine
(mg/L)
Total Intake per Day
(mg/L)
Total Intake per Year
(mg/L)
Family-1Member 1714.9 LUnderground tap water0.783.841399.32
Member 2574.5 L0.783.531285.1
Table 6. The maximum, minimum, and average value of fluoride in different samples in Neerukonda.
SourceSample NameAverageMaximumMinimum
Outside supplyD10.0980.0980.098
TanksT1, T20.520.540.5
PondsP1, P20.240.30.2
Household waterH1, H2, H3, H4, H5, H6, H7, H8, H9, H100.981.840.3
WellsW1, W2, W30.430.440.40
Disclaimer/Publisher’s Note: The statements, opinions and data contained in all publications are solely those of the individual author(s) and contributor(s) and not of MDPI and/or the editor(s). MDPI and/or the editor(s) disclaim responsibility for any injury to people or property resulting from any ideas, methods, instructions or products referred to in the content.

