Abstract
In multi-energy complementary power generation systems, the complete consumption of wind and photovoltaic resources often requires more costs, and tolerable energy abandonment can bring about the more reasonable optimization of operation schemes. This paper presents a scheduling model for a combined power generation system that incorporates pumped storage, wind, solar, and fire energy sources. Through a comparison of schemes, the energy regulation function of the pumped storage power station was verified and analyzed. The CPLEX solver and MOPSO algorithm were employed to solve the daily output of a pumped storage power station in the Gansu region under various scenarios. The incorporation of pumped storage power plants has the potential to provide many benefits, including a reduction in operating expenses by about CNY 1.1163 million, a decrease in carbon emissions by 491.24 t, an enhancement in the stability of thermal power by 2.39%, and an improvement in the combined system capability to absorb additional energy. The correlation between the indicators of the combined system and the penetration rate of renewable energy is non-linearly influenced by changes in the power capacity configuration. Ultimately, the multi-objective optimization computation yields the ideal operational scheme for each power source, taking into account a tolerable energy abandonment mode.
1. Introduction
Global issues such as resource scarcity, environmental degradation, and climate change have sped up the development of new energy sources worldwide [,,]. The problem of new energy consumption has been very prominent, especially with the rapid expansion of the scale of new grid-connected energy, the risk of curtailment brought on by huge flexibility demand, and the safe and stable operation of high proportions of clean energy systems. These problems, among others, are becoming more and more pronounced [,]. This is due to the inherent intermittent and uncontrollable power generation characteristics of wind power and photovoltaics, as well as other comprehensive factors [,,,].
In order to increase the quality and dependability of power grid operation, increase the utilization rate of existing channels, and successfully address the operational issues of large-scale centralized grid of wind power and photovoltaics, the key is to suppress the intermittency and randomness of associated with the generation of new energy power, such as wind and light energy, through flexible power sources such as water, fire, and storage [,,,,]. Many academics have conducted extensive studies in this field and reported positive outcomes. For example, Zhang et al. [] studied a novel bi-level multi-timescale scheduling approach for accommodating for wind power uncertainty via a robust optimization formulation and applied it to real wind farms to verify its feasibility. Xie et al. [] proposed a short-term hydropower dispatching model suitable for large-scale regional hydropower systems. Preemptive planning was achieved by prioritizing multiple objectives and constraints to satisfy weights of significantly different sizes. Zhou et al. [] proposed a multi-objective scheduling model based on grid-connected hydropower, wind energy, and solar cell energy combined with flexible reserves. The proposed multi-objective model was transformed into a single-objective model by the ε-constraint method, and the effectiveness of the model was verified by simulation experiments. Zhang et al. [] proposed a framework for the capacity configuration and economic evaluation of a hydro–solar/photovoltaic–wind power system. The framework was tested via a practical project in China and has important guiding value for the economic development of hydropower, solar power, and wind power systems. Fan et al. [] developed a multi-objective optimization model based on a non-dominated sorting genetic algorithm (NSGA-II) to evaluate the potential of wind–solar complementary power generation in 31 provinces in China. Wang et al. [] proposed a multi-scale nested joint operation model that considered both long-term and short-term operation strategies, and evaluated the economic benefits and energy efficiency of the system using the Wujiang River in China as an example. Canales et al. [] presented a mathematical model for estimating the optimal size of a standalone hybrid power system and assessing its performance entirely based on variable renewable energy sources coupled with a hybrid energy storage system. Huang et al. [] proposed three risk indicators to quantify the output shortage, power curtailment, and spilled water risks of wind–solar–hydro complementary systems and verified them using examples, providing technical support for the safe and economic operation of renewable energy. Liu et al. [] established a day-ahead peak shaving model aiming to minimize residual load difference, introduced chance constraints for prediction errors, and coordinated the operation of hydropower with wind and solar power. Wang et al. [] proposed the definition of pumped storage units by focusing on source–grid coordination and recommended a new evaluation model which was validated by using Jilin Province as an example.
In a power system that uses a large number of new energy sources, in order to absorb relatively little new energy peak power, a large amount of peak shaving resources must be used, which reduces the safety, stability, and economy of the system []. In addition, fluctuations in solar and wind output are difficult to predict accurately, especially over timescales. Therefore, in the process of true multi-energy complementary operation, it is often not advisable to pursue the complete absorption of new energy [,,].
At present, there is little research on the reasonable abandonment and compromise operation of pumped storage wind–solar–thermal combined power generation systems. This paper attempts to study the optimal operation of pumped storage wind–solar–thermal combined power generation systems from this perspective. First, an optimal operation model of a pumped storage wind–solar–thermal combined power generation system was established with the lowest system operating cost, the largest new energy consumption, and the smallest source–load deviation as the optimization objective functions. This was carried out by considering pumped storage and thermal power as controllable power sources and the operating constraints of each power source and the characteristics of source–load data. Secondly, using typical day scenarios in summer and winter, the function and value of energy control of the pumped storage power station were objectively analyzed by solving the model. The proportion of wind power and photovoltaic installed capacity was then gradually increased to construct a high-proportion new energy scenario, and the change trends for parameters such as system operating cost, carbon emissions, and thermal power output fluctuation were analyzed through numerical simulation. The reliability of the model was verified by using the PSO algorithm and CPLEX to solve single-objective optimization. This was carried out under the assumption that the load, thermal power, and pumped storage capacity remain unchanged. The pumped storage wind–solar–thermal combined power generation system compromise operation scheme was given by the MOPSO algorithm by using the reasonable energy abandonment method, which is more in line with the actual operation needs of the project and can effectively reduce the operating cost.
This paper proposes a pumped storage wind-solar-Thermal combined power generation system considering multiple energy sources and quantitatively evaluates the impact of pumped storage power station systems from the aspects of economy, environmental protection, and new energy consumption. In response to the issue of new energy consumption, this paper proposes an operational scheme for a pumped storage wind–solar–thermal combined power generation system based on tolerable energy abandonment and displays simulation results that are more suitable for engineering applications. Additionally, the effectiveness and accuracy of the model were initially verified using the PSO and MOPSO algorithms and further confirmed by carrying out a comparison with CPLEX solution outcomes.
2. Optimal Operation Model of a Pumped Storage Wind–Solar–Thermal Combined Power Generation System
2.1. The Determination of Running Costs for the Integrated Generating System
Taking into account the time-of-use electricity price mechanism and thermal power generation pollution control, the goal is to have the lowest operating cost regarding the joint operation system (assuming that the operating costs of the pumped storage power station, wind farm, and photovoltaic power station are zero and only the pumped storage power station pumping cost, thermal power plant operating cost, and thermal power plant pollutant control cost are considered). The objective function is
where , , and are pumping costs for pumped storage power stations, operating costs for thermal power plants, and the cost of pollution control in thermal power plants, respectively.
In order to encourage users to reasonably allocate their electricity time, time-of-use electricity pricing refers to the system operation status. One day is divided into multiple periods, each of which carries a different charge. The time-of-use electricity price used in this study is displayed in Table 1 (below) and in accordance with the pertinent electricity price policy of Gansu Province.

Table 1.
Time-of-use electricity price.
The cost of pumped storage power stations is a complex issue, and the investment cost during the construction phase needs to be systematically evaluated. This paper focuses on the operating costs of a combined system, considering only the pumping costs during the operation phase of the pumped storage power station.
The pumping cost of pumped storage power stations is related to pumped storage, pumped power, and pumped electricity price. It can be expressed as follows:
where is the pumping power of the pumped storage power station in the i period, and is the price of pumping electricity for the i period.
According to the regulations on the pumping tariffs for pumped storage power stations in the Gansu area, the price of pumped hydroelectricity is based on 75% of the baseline price of the feed-in tariff for coal-fired units.
The primary component of the operating expenses for thermal power plants is the cost associated with coal consumption in thermal power units. Furthermore, the connection between the coal consumption cost of units and the load of units follows a quadratic pattern.
where a, b, c are coal consumption coefficients. and are coal price and thermal power unit power, respectively.
In order to facilitate the solution and accelerate its convergence, the non-linear energy dissipation characteristic curve of thermal power units is often linearized, as shown in Figure 1.

Figure 1.
Piecewise linearization of operating cost curve for thermal power units.
The segmented linearization of the non-linear fuel cost function of thermal power units in the model can be expressed by the following definition constraints:
where is a slight increase in the cost of unit i in the L segment in the segmented linearization curve, and . is the output of unit i in the L segment of the cost function in the t period, and is the upper limit of unit i in segment L.
In the traditional energy structure, which mainly relies on coal for power generation, thermal power accounts for a relatively large proportion of the overall power. Under the existing technical conditions, 1t of coal emits about 3000 kW·h of electricity, but a large amount of coal burning will bring serious air pollution and, consequently, seriously endanger the natural environment. In order to solve the pollution problem caused by thermal power, a lot of money needs to be spent on treatment. The main pollutants emitted by burning 1 t coal in thermal power plants and the costs of different treatment strategies are shown in Table 2.

Table 2.
The main pollutants emitted by burning 1t coal in thermal power plants, as well as the costs of treatment.
The formula for calculating the cost of pollutant treatment in thermal power plants is as follows:
where m is the type of pollutants in thermal power plants.
2.2. Calculation of New Energy Consumption
When large-scale wind power is connected to the power grid, it will have a severe impact on the power grid, resulting in joint wind and light abandonment, and aiming at the maximum absorption of new energy, it can improve the stability of the power grid and reduce the occurrence of wind and light curtailment.
where is the wind farm power at time t, and is the maximum allowable output of the wind farm at time t. is the power of the photovoltaic power station at time t. is the maximum allowable output of the photovoltaic power plant at time t.
2.3. The Calculation of Output and Load Deviation
The fluctuation in grid load is time-varying, and the difference between load and output is minimal to reduce the impact on the grid when pumped storage power stations are connected to the grid.
where is the projected grid load for the combined generating system during the t-period, and is the total power generated by the combined system.
2.4. Constraints on Model Operation
Since electric energy does not have the characteristics of large storage, the total power generation of the joint operation system should be equal to the total power consumption. Without considering grid losses, the system power balance equation is as follows:
is the power of thermal power plant in the i period. is the power of the pumped storage power plant. is the system load in the i period.
Limitations on the output of thermal power units can be expressed as follows:
The constrictions on unit rising rate are
where and are the upper and lower limits of the output of thermal power units. and are the maximum increasing and decreasing output rates of thermal power units, respectively.
The constraints on wind power output can be expressed as follows:
where is the maximum allowable output of the wind farm at time t.
The constraints on photovoltaic output can be expressed as follows:
where is the maximum allowable output of the photovoltaic electric field at time t.
The constraints on pumped storage power stations can be expressed as follows:
Since the two working conditions of power generation and pumped storage cannot occur at the same time,
where and are the maximum power generation power and pumped power of the pumped storage power station, respectively. is the amount of reservoir energy storage on the pumped storage power station in the i period. and are the pumped storage efficiency and power generation efficiency of the pumped storage power stations, respectively.
The constraints on reservoir capacity can be obtained as follows:
where is the initial amount of water in the reservoir on the pumped storage power station. and are the maximum and minimum water volume of the upper reservoir of the pumped storage power station, namely the normal storage capacity and dead storage capacity.
The above equation represents the constraint on the capacity of the upper reservoir of the pumped storage power station within one day. Since the sum of the upper and lower reservoirs remains unchanged during the pumping process, the constraint on the capacity of the lower reservoir is also considered.
The constraints on daily water pumping and power generation balance can be obtained as follows:
2.5. Operating Rules for Combined Power Generation Systems
During the day-ahead dispatching operation, the total predicted output of new energy is taken into account, and each part of the output is set up with the goal of minimizing the total operating cost of the combined power generation system. Constraints are met by adjusting the combined power generation system internally, so that the combined power generation system can meet the output plan as much as possible.
Photovoltaic power stations mostly produce power during the day and stop at night. During different seasons, the trend of photovoltaic power generation is the same. Wind power, on the other hand, has strong randomness and seasonality, so the amount of power produced during different seasons is different. Based on these facts, it is clear that combining wind power and photovoltaic power generation into a single system can make the power grid more stable. Here is how one can use the model for a wind power solar power station: forecast how much wind power will be made the next day, send that information to the dispatching center, and evaluate the next day’s grid electricity based on the forecast. If the difference between the forecast and the actual situation is more than a certain value, there will be penalties.
Based on the output state, the peak shaving process of thermal power units can be split into two stages: basic peak shaving and deep peak shaving. For the basic peak shaving stage, the thermal power unit’s output range is between its rated output and its minimum technical output, which is usually between 45% and 50% of its rated output. In terms of thermal power units’ ability to climb, the climbing speed of coal-fired generator sets in the United States is usually 3% rated load/min.
In the original system, when the pumped storage power station is set up, if the predicted output of renewable energy plus the lower limit of thermal power output is more than the load prediction value, the pumped storage is in the pumped state, and the joint system stores the extra energy. When the power demand of the joint operation system is high, the pumped storage is in the unpumped state.
3. Simulation Schemes of the Combined Power Generation System
3.1. Power Structures and Data Characteristics
This paper focuses on the Gansu Jiuquan Energy Base, known for its wind power base and photovoltaic power stations with a total capacity of tens of millions of kilowatts and abundant new energy resources. However, the fluctuation in new energy creates significant disparities between peak and off-peak periods in the power grid, leading to pronounced load imbalance and challenges in peak load regulation. Relying solely on conventional hydroelectric and thermal power is inadequate for addressing these issues. As one of China’s largest new energy production bases, there is a pressing need to expand the development of pumped storage power stations to ensure the effective absorption and transmission of new energy. Currently, a 1200-megawatt capacity pumped storage power station is being constructed in the area. It will feature four reversible pump turbines, each with a rated power of 300 megawatts. The station aims to generate 11.14 billion kilowatt-hours annually, with a pumping power of 14.8 billion kilowatt-hours and an efficiency of 75%. The upper reservoir’s water level is 2807 m, and the lower reservoir’s water level is 2375 m, with a rated head of 421 m and a total reservoir capacity of 7.3 million cubic meters. Despite the increasing proportion of renewable energy, China’s energy structure still mainly relies on thermal power as the base load. Therefore, the specific configuration of the combined operation system includes thermal power plants with a total capacity of 3000 MW, including the Gandong First, Second, and Third Thermal Power Plants; wind farms with a total capacity of 1800 MW, including the Gandong First and Second Wind Farm Groups and the Changma First and Second Wind Farms; and solar power plants with a total capacity of 1200 MW, including the Gandong and Gandong West Photovoltaic Power Plants. The thermal power units can adjust their output by up to 900 MW/h, with the maximum and minimum outputs of the thermal power plants set at 3000 MW and 1500 MW, respectively.
For the joint power generation system constructed above, representative typical days were selected for a scenario analysis based on historical data pertaining to regional wind, along with photovoltaic and load power. The selection of typical days is mainly based on the following principles. First, in the energy base region, wind and solar power exhibit different generation patterns in different seasons, with both having distinct seasonal characteristics. Solar power output shows a trend of being stronger in summer and weaker in winter, while overall, wind power output exhibits a stronger trend in winter and a weaker trend in summer. This study focused on seasons with pronounced seasonal features, namely, summer and winter. In this study, the daily load curves of the day with the maximum load in summer and winter were chosen as the typical daily load curves. Ultimately, based on historical data regarding wind power, solar power, and load in the energy base region, 31st July and 18th December were selected as typical days for this study, representing the days with maximum load during the summer and winter periods. The specific output conditions are illustrated in Figure 2. The system load was greater between 08:00 and 23:00, suggesting that this is the time period when power consumption is at its highest. Between 01:00 and 07:00, the load was lower and steadier, with the winter load value being higher than the summer one. The major time that solar power plants contribute is during the day. The trend regarding photovoltaic power generation is consistent with the direction of load fluctuations throughout the year, and it has a good peak regulation impact. With anti-peak control, wind power generation exhibits high seasonality and unpredictability. Figure 2 also shows that while summer wind power output is generally constant, winter oscillations are more pronounced and also depend on the local climate.
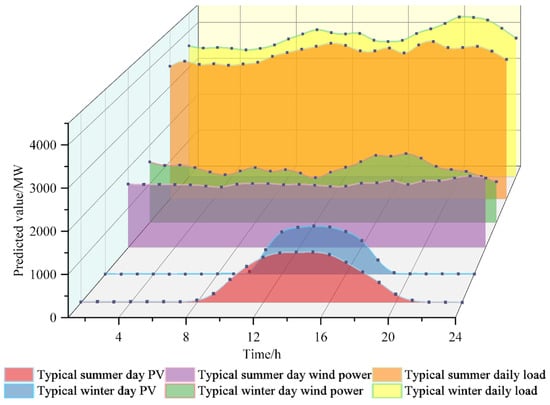
Figure 2.
Forecast curves of combined power generation system load, wind power, and photovoltaic power.
3.2. Scene Parameters and Scheme Settings
3.2.1. Research Contents of Scheme 1
In order to study the impact of the participation of pumped storage power stations on the joint system, a scenario to determine whether the joint system involves pumping and storage participation on typical summer days and typical winter days was set in Scheme 1. Based on four-day-ahead scheduling scenarios, a comparative analysis was carried out to explore the economy and environmental protection of the joint operation system under different scenarios. Option 1 selected the minimum operating cost of the joint system as the objective function and used the CPLEX solver to solve it. The four-day-ahead scheduling scenarios used are shown in Table 3 below:

Table 3.
Scheme 1 settings.
In order to comprehensively compare and analyze the operation of the co-generation system under different scenarios, we introduced indicators for measuring the environmental benefits of the co-generation system, CO2 emissions, and the grid operation stability, and the thermal power output stability using the following formulas: Environmental benefits (CO2 emissions from the combined system):
where is the amount of CO2 emitted by burning 1t of coal for thermal power plants.
Stability index: thermal power output stability
where is the lower limit of thermal power unit output, and n is the total time.
3.2.2. Research Contents of Scheme 2
Similarly, the goal of minimizing the operating cost of the joint system was chosen for evaluation in this study. In order to study the regulatory capacity of pumped storage power stations in the joint system and respond to the development trend of China’s high proportion of renewable energy derived from grid connection, we considered scenario 2 in scenario 1 as the initial scenario, along with the typical summer days and participation in pumped storage. By setting different types of energy capacity ratios (renewable energy penetration rate) for wind and solar combinations, we analyzed the impact of different capacity ratios (renewable energy penetration rate) on the operating costs, CO2 emissions, fluctuation in the thermal power unit output, and wind and light abandonment of the joint operation system and explored the relationship between the ability of the pumped storage power stations in the system to cope with high proportions of renewable energy derived from grid connection and the economic operation benefits of the system and different capacity ratios/renewable energy penetration rates.
Assuming that the installed capacity of load, thermal power, and pumping storage in the system remains unchanged and the installed capacity of wind power/photovoltaic power maintains a 3:2 ratio, different scenarios were constructed by changing the renewable energy capacity. The installed proportion of each power is shown in Table 4. The second scheme also selected the lowest operating cost of the joint system as the objective function, and used the CPLEX solver to solve it.

Table 4.
The installed proportion of each power in the different scenarios in Scheme 2.
3.2.3. Research Contents of Scheme 3
In order to verify the correctness of the CPLEX solution (12.10.0), scenario 2 in Scheme 1 was used as the comparison scenario, and the particle swarm optimization algorithm was used to solve the solution, and the results obtained by CPLEX were compared. In order to study the optimal scheduling of the pumped storage wind–solar–thermal combined system in a multi-objective environment, the minimum operating cost of the combined system, the smallest deviation between output and load, and the maximum absorption of new energy were selected as the objective functions; a multi-objective optimization model of the pumped storage wind–solar–thermal combined system was constructed; and CPLEX and MOPSO were used to solve, compare, and analyze them. Scenario 3 set up four scenarios: Scenarios 1 and 2 selected the lowest running cost as the objective function, and used CPLEX and PSO to solve the single objective, respectively. Scenarios 3 and 4 selected the above three objective functions and solved them with CPLEX and MOPSO, respectively. It should be noted that CPLEX cannot directly optimize the three objective functions, so the overall optimization was carried out by weighting. The solution method for Scheme 3 is shown in Table 5.

Table 5.
Scenario setting and solution method for Scheme 3.
4. Analysis of Simulation Results
4.1. Analysis of Scheme 1
Figure 3 displays the output power of the day-ahead optimized scheduling for the combined power generation system in four situations. Figure 3a,c show the day-ahead dispatching results for wind, photovoltaic, and thermal power when there are no pumped storage power stations in the system; Figure 3b,d show the day-ahead dispatching results for pumped storage, wind, photovoltaic, and thermal power when there are pumped storage power stations in the system. The operating expenses, CO2 emissions, thermal power production volatility, and wind and light emissions of the combined power generation system were determined by solving the day-ahead optimization scheduling model of the combined power generation system, as shown in Table 6.
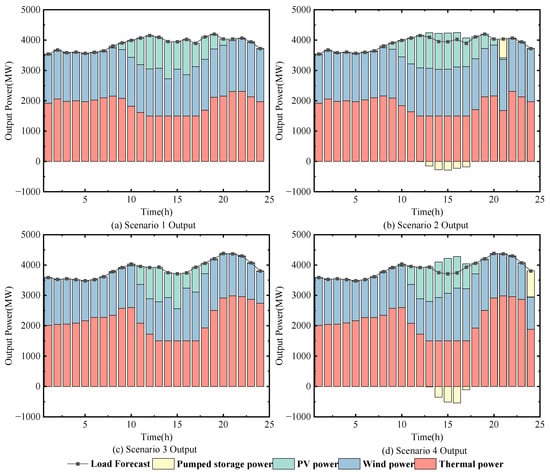
Figure 3.
Day-ahead optimal scheduling results of Scheme 1 for the combined power generation system.

Table 6.
Optimal dispatch results of the combined power generation system.
The comparison of scenarios 1, 2, 3, and 4, based on Figure 4 and Table 6, reveals that the typical daily thermal power output in winter is higher than that in summer. In all four scenarios, the combined power generation system’s overall output is sufficient, meeting the daily output demand. However, without an additional energy storage facility, there is a high demand for the thermal power plants’ regulating capacity due to the significant seasonal variations in renewable energy output. The production of thermal power plants is high right now, as are their running costs and CO2 emissions. The thermal power units regularly start, stop, and climb slopes because pumped storage power plants are not regulated, which causes significant swings in thermal power and poor stability. When pumped storage power plants are in operation, the grid’s ability to absorb new energy is improved, the pressure on thermal power unit regulation is reduced, thermal power stability is increased, thermal power output is decreased, and wind and light are no longer wasted. At the same time, the consumption of new energy is insufficient, leading to the abandonment of wind and solar energy. The combined power generation system’s operating costs decrease by CNY 776,300, carbon emissions decrease by 298.08 tonnes, the thermal power output volatility decreases by 1.45%, the wind abandonment rate decreases by 1.78%, and the solar abandonment rate decreases by 9.44% when compared to scenarios 1 and 2. The operating cost of the joint system decreases by CNY 1.1163 million compared to scenarios 3 and 4, while carbon emissions decrease by 491.24 tonnes, the volatility of thermal power output decreases by 2.39%, the abandonment rate of wind energy decreases by 1.63%, and the abandonment rate of light energy decreases by 8.91%.
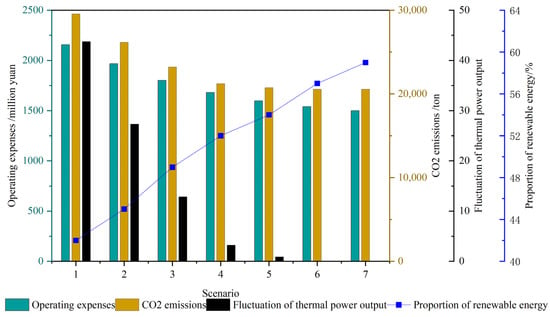
Figure 4.
Changes in co-generation system metrics for each scenario of Scheme 2.
4.2. Analysis of Scheme 2
Figure 4 and Table 7 show that the combined system’s operating costs continue to decline as the proportion of new energy in the system rises. The carbon emission and volatility of thermal power plants both exhibit a pattern of first dropping and then remaining unchanged.

Table 7.
Optimized scheduling results for the different scenarios in Scheme 2.
They each experience a reduction in carbon emissions of 3379.39t, 2975.47t, 1976.07t, and 479.01 t, respectively. The thermal power volatility reduces by 16.45%, 14.48%, 9.62%, 2.33%, and 0.87%, respectively, at 179.29 t. Due to the fact that thermal power units no longer frequently start and stop climbing, the output of thermal power decreases until it is maintained at the lower limit of output, at which point the proportion of new energy rises once more. This is because as the penetration rate of new energy in the combined system continues to increase, thermal power units no longer start and stop climbing frequently. Costs are slightly decreased, but thermal power fluctuation and carbon emissions are barely noticeable. Operating costs, CO2 emissions, and thermal power volatility are all lower than in scenarios 1, 2, and 3, but there is an insufficient use of new energy, leading to the abandonment of wind and lighting. The variability of carbon emissions and thermal power output diminishes in comparison to scenarios 2, 3, and 4, while the pace of wind and light abandonment increases. This is due to the fact that the amount of fresh energy is too great, thermal power units’ and pumped storage power stations’ adjustment capacity is constrained, and the load absorption limit has been reached, forcing the power system to generate wind and light abandonment. When compared to scenario 5, 6, it is clear that neither the volatility of carbon emissions nor that of thermal power has changed. This suggests that thermal power remains at its lowest possible production level, and that operating costs are continuously falling. This is due to the fact that as the output of pumped storage power stations declines, so do the pumping costs and operational costs of the combined system. Overall, the best-case scenario is when the combined system has 2100 MW wind turbines and 1400 MW photovoltaic power stations, or when the new energy penetration rate is 45%. Different energy sources can currently satisfy output requirements more effectively, while system operating costs, carbon emissions, and indicators of thermal power instability are more appropriate. New energy consumption is also better, and there are no signs of wind or light desertion.
4.3. Analysis of Scheme 3
Scenarios 1 and 2 are single-objective optimization problems with linearly decreasing weights to adjust the inertia weights in PSO. The inertia weights are treated in the algorithm as follows:
where is the inertia weight, is the maximum value of the inertia weight, is the minimum value of the inertia weight, is the number of iterations, and is the maximum number of iterations.
The parameters of the PSO algorithm are shown below: inertia weights minimum , inertia weights maximum , learning factor , learning factor , population size 200, maximum number of iterations 1200. The variation in the objective function value during the optimization process using the PSO algorithm is illustrated in Figure 5. The descending trend of the fitness curve reflects the process of the particle swarm algorithm searching for the global optimum. The decrease in the curve indicates that the particle swarm is gradually approaching the optimal solution within the search space. It can be observed that the fitness curve tends to stabilize after 800 iterations, indicating that the algorithm has converged to the global optimum, and subsequent iterations do not significantly improve the objective function value. The indicators of the co−generation system in scenarios 1 and 2 are shown in Table 8.
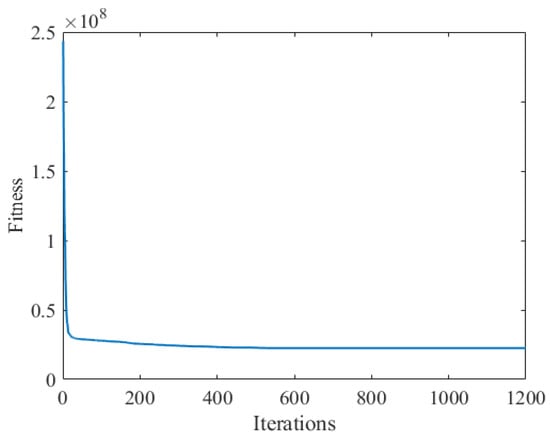
Figure 5.
PSO iteration results for the co-generation system.

Table 8.
Comparison of the CPLEX and PSO optimization results.
The output power values of each power supply in scenario 1 and scenario 2 in Scheme 3 are shown in Figure 6. Based on the optimization results, CPLEX obtains lower operating costs, lower carbon emissions, and a slightly larger fluctuation in thermal power output than the PSO algorithm, and there is no wind and light abandonment in both scenarios; based on the day−ahead optimal scheduling results, the two results are basically the same, and there are some differences in the time of pumped storage power generation conditions, which verifies the correctness of the CPLEX solution.
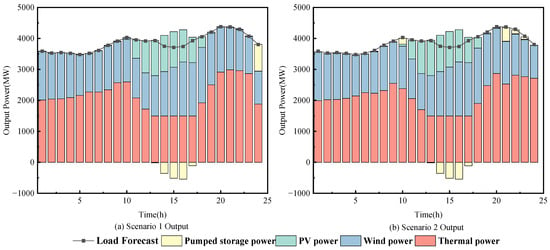
Figure 6.
Day-ahead optimal scheduling results relating to the combined power generation system and scenarios 1 and 2 in Scheme 3.
Scenarios 3 and 4 are both multi-objective models which can be solved directly by using the MOPSO algorithm, while the CPLEX solver needs to transform the multi-objective problem into a single-objective problem by weighting before solving. The parameters of MOSPO are as follows: , , , , population size 200, number of non-dominated solutions 100, maximum number of iterations 500. The set of Pareto optimal solutions for the three objective functions of scenarios 3 and 4 is shown in Figure 7, and the values of each objective function for the co-generation system are shown in Table 9.
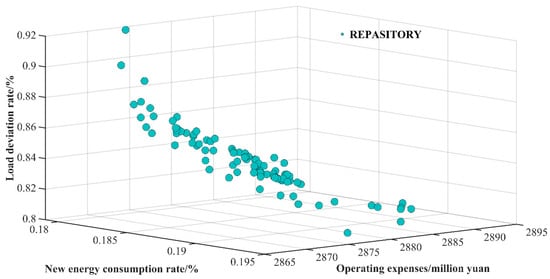
Figure 7.
Pareto optimal solution set of three objective functions.

Table 9.
Results of each objective function for scenarios 3 and 4 of Scheme 3 and the co-generation system.
In Table 9, scenarios 3 and 4 represent the best run results for CPLEX and MOPSO, respectively. Among them, scenario 4 selects the best solution representing each objective function from the Pareto front generated by MOPSO. Figure 8 shows the power output of each power supply in scenario 3. In the multi-objective environment, combined with Table 9 and Figure 8, among the three objectives solved by CPLEX, the load deviation rate and the new energy consumption rate reach the optimal state; the output of each power source matches with the power generation plan; and the new energy is fully consumed, with no wind and solar energy abandonment. However, the operating cost is higher than the outcome attained by MOPSO. The relatively minor differences between each target result in MOPSO results showing that the algorithm has only searched a limited range and has found the best solution. The minimal load variation rate in the MOPSO results is 1.27%, and there is a slight divergence between output and load. The incomplete absorption of new energy results in little wind and light abandonment. Wind energy is absorbed at an average rate of 89.69%; it is abandoned at an average rate of 10.31%. Photovoltaic energy is absorbed at an average rate of 92.40%, and light is abandoned at an average rate of 7.60%. The lowest running cost is CNY 1,143,500 less than CPLEX, and all of the operating costs are lower than the CPLEX results, indicating that the MOPSO algorithm sacrifices some of the new energy consumption in return for cheaper running costs which are more in line with the project’s actual requirements. In conclusion, MOPSO offers a balanced scheduling operation outcome that is more suited for engineering applications through reasonable energy abandonment, whereas CPLEX tends to the limit’s ideal case.
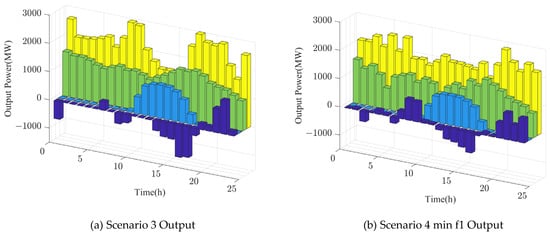
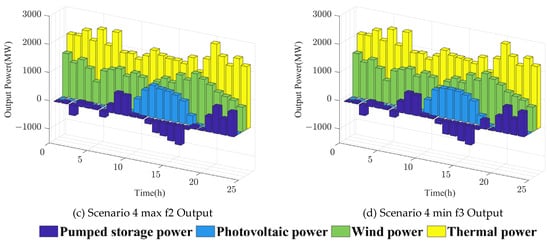
Figure 8.
Day-ahead optimal scheduling results for scenario 3 and 4 and the combined power generation system in Scheme 3.
5. Conclusions
This study builds an optimal scheduling model for a combined pumped storage wind–solar–thermal generation system. A variety of optimal operation schemes were studied for the multi-energy complementary system by taking pumped storage and thermal power as controllable power sources and considering the operating constraints of each power source and the characteristics of source–load data. The main conclusions are as follows:
- (1)
- When excluding the pumped storage power station, the operating cost of the combined system is relatively high, resulting from wind and solar abandonment. The addition of the pumped storage power station can reduce the operating costs of the combined system, improve system economy, reduce the output of thermal power units, and frequently climb slopes, resulting in a reduction in CO2 emissions and an improvement in thermal stability. At the same time, the ability of the power grid to absorb new energy is improved, and abandoning wind and solar power no longer occurs.
- (2)
- As the penetration rate of renewable energy increases, the volatility indicators of carbon emissions and thermal power continue to decline until they remain unchanged, with the same trend. When the penetration rate of new energy reaches 49%, the regulating capacity of thermal power units and pumped storage power stations is limited, and the load reaches its limit. The joint system begins to abandon wind and light sources. Both trends are non-linearly related to capacity ratio. The proportion of wind energy to wind energy will continue to increase with the quantity of new energy. In terms of economic and environmental protection, the best-case scenario is for the penetration rate of new energy to reach 45%. When the combined system has 2100 MW of wind turbines and 1400 MW of solar power plants, the model can more effectively meet output needs, and the scenarios regarding system operating costs, carbon emissions, and new energy consumption are optimal.
- (3)
- The CPLEX solver and PSO method yielded similar results when dealing with a single-objective function, proving the effectiveness of the model. Both CPLEX and MOPSO can find perfect solutions in multi-objective environments. CPLEX tends towards the ideal case of limit, while MOPSO tends towards equilibrium. The MOPSO algorithm is more in line with the actual requirements of the project, as it reduces operational costs by reasonably discarding energy.
Author Contributions
Conceptualization, H.Z. (Hao Zhang) and J.Z.; methodology, S.W.; software, H.L.; validation, C.Z., H.Z. (Hekuan Zhou) and Y.J.; formal analysis, S.W.; investigation, H.L.; writing—original draft preparation, H.Z. (Hao Zhang); writing—review and editing, H.L.; project administration, H.Z. (Hao Zhang); funding acquisition, H.L. All authors have read and agreed to the published version of the manuscript.
Funding
This work was supported by the Science and Technology Plan Project of Shaanxi Province Department of water resources (2023slkj-3).
Data Availability Statement
Data are contained within the article.
Conflicts of Interest
Author Hekuan Zhou and Yaofei Jia were employed by the company Henan Province Highway Engineering Bureau Group Co., Ltd. The remaining authors declare that the research was conducted in the absence of any commercial or financial relationships that could be construed as a potential conflict of interest.
References
- Zhu, F.; Zhong, P.; Xu, B.; Liu, W.; Wang, W.; Sun, Y.; Chen, J.; Li, J. Short-term stochastic optimization of a hydro-wind-photovoltaic hybrid system under multiple uncertainties. Energy Convers. Manag. 2020, 214, 112902. [Google Scholar] [CrossRef]
- Tian, Y.; Chang, J.; Wang, Y.; Wang, X.; Zhao, M.; Meng, X.; Guo, A. A method of short-term risk and economic dispatch of the hydro-thermal-wind-PV hybrid system considering spinning reserve requirements. Appl. Energy 2022, 328, 120161. [Google Scholar] [CrossRef]
- Mao, Q.; Guo, M.; Lv, J.; Chen, J.; Xu, L.; Ma, H.; Li, J. An investment decision framework for offshore wind-solar-seawater pumped storage power project under interval-valued Pythagorean fuzzy environment. J. Energy Storage 2023, 68, 107845. [Google Scholar] [CrossRef]
- Ma, C.; Liu, L. Optimal capacity configuration of hydro-wind-PV hybrid system and its coordinative operation rules considering the UHV transmission and reservoir operation requirements. Renew. Energy 2022, 198, 637–653. [Google Scholar] [CrossRef]
- Liu, B.; Lund, J.R.; Liao, S.; Jin, X.; Liu, L.; Cheng, C. Optimal power peak shaving using hydropower to complement wind and solar power uncertainty. Energy Convers. Manag. 2020, 209, 112628. [Google Scholar] [CrossRef]
- Zhang, Y.; Ma, C.; Yang, Y.; Pang, X.; Lian, J.; Wang, X. Capacity configuration and economic evaluation of a power system integrating hydropower, solar, and wind. Energy 2022, 259, 125012. [Google Scholar] [CrossRef]
- Wu, G.; Li, T.; Xu, W.; Xiang, Y.; Su, Y.; Liu, J.; Liu, F. Chance-constrained energy-reserve co-optimization scheduling of wind-photovoltaic-hydrogen integrated energy systems. Int. J. Hydrogen Energy 2023, 48, 6892–6905. [Google Scholar] [CrossRef]
- Fan, J.-L.; Huang, X.; Shi, J.; Li, K.; Cai, J.; Zhang, X. Complementary potential of wind-solar-hydro power in Chinese provinces: Based on a high temporal resolution multi-objective optimization model. Renew. Sustain. Energy Rev. 2023, 184, 113566. [Google Scholar] [CrossRef]
- Li, J.; Luo, G.; Li, T.; Gao, L.; Liang, X.; Hu, J.; Cao, Y.; Qi, L.; Liu, X.; Huo, M. Impact on traditional hydropower under a multi-energy complementary operation scheme: An illustrative case of a ‘wind–photovoltaic–cascaded hydropower plants’ system. Energy Strategy Rev. 2023, 49, 101181. [Google Scholar] [CrossRef]
- Huang, K.; Liu, P.; Ming, B.; Kim, J.-S.; Gong, Y. Economic operation of a wind-solar-hydro complementary system considering risks of output shortage, power curtailment and spilled water. Appl. Energy 2021, 290, 116805. [Google Scholar] [CrossRef]
- Li, X.; Yang, W.; Zhao, Z.; Wang, R.; Yin, X. Advantage of priority regulation of pumped storage for carbon-emission-oriented co-scheduling of hybrid energy system. J. Energy Storage 2023, 58, 106400. [Google Scholar] [CrossRef]
- Al-Ghussain, L.; Ahmad, A.D.; Abubaker, A.M.; Mohamed, M.A. An integrated photovoltaic/wind/biomass and hybrid energy storage systems towards 100% renewable energy microgrids in university campuses. Sustain. Energy Technol. Assess. 2021, 46, 101273. [Google Scholar] [CrossRef]
- Sun, K.; Li, K.-J.; Pan, J.; Liu, Y.; Liu, Y. An optimal combined operation scheme for pumped storage and hybrid wind-photovoltaic complementary power generation system. Appl. Energy 2019, 242, 1155–1163. [Google Scholar] [CrossRef]
- Das, B.K.; Hasan, M.; Rashid, F. Optimal sizing of a grid-independent PV/diesel/pump-hydro hybrid system: A case study in Bangladesh. Sustain. Energy Technol. Assess. 2021, 44, 100997. [Google Scholar] [CrossRef]
- Zhang, B.; Xu, G.; Zhang, Z. A holistic robust method for optimizing multi-timescale operations of a wind farm with energy storages. J. Clean. Prod. 2022, 356, 131793. [Google Scholar] [CrossRef]
- Xie, M.; Cheng, X.; Cai, H.; Wang, J.; Liu, S.; Chen, Q.; Liu, X. A hydropower scheduling model to analyze the impacts from integrated wind and solar powers. Sustain. Energy Grids Netw. 2021, 27, 100499. [Google Scholar] [CrossRef]
- Zhou, S.; Han, Y.; Zalhaf, A.S.; Chen, S.; Zhou, T.; Yang, P.; Elboshy, B. A novel multi-objective scheduling model for grid-connected hydro-wind-PV-battery complementary system under extreme weather: A case study of Sichuan. China, Renew. Energy 2023, 212, 818–833. [Google Scholar] [CrossRef]
- Wang, Z.; Fang, G.; Wen, X.; Tan, Q.; Zhang, P.; Liu, Z. Coordinated operation of conventional hydropower plants as hybrid pumped storage hydropower with wind and photovoltaic plants. Energy Convers. Manag. 2023, 277, 116654. [Google Scholar] [CrossRef]
- Canales, F.A.; Jurasz, J.K.; Guezgouz, M.; Beluco, A. Cost-reliability analysis of hybrid pumped-battery storage for solar and wind energy integration in an island community. Sustain. Energy Technol. Assess. 2021, 44, 101062. [Google Scholar] [CrossRef]
- Wang, R.; Yang, W.; Ji, L.; Li, X.; Zhang, S.; Jing, X. Regulation intensity assessment of pumped storage units in daily scheduling for renewable energy consumption. Sustain. Energy Technol. Assess. 2023, 56, 103027. [Google Scholar] [CrossRef]
- Ma, Y.; Zhang, M.; Yang, H.; Wang, X.; Xu, J.; Hu, X. Decentralized and coordinated scheduling model of interconnected multi-microgrid based on virtual energy storage. Int. J. Electr. Power Energy Syst. 2023, 148, 108990. [Google Scholar] [CrossRef]
- Xu, W.; Liu, P.; Cheng, L.; Zhou, Y.; Xia, Q.; Gong, Y.; Liu, Y. Multi-step wind speed prediction by combining a WRF simulation and an error correction strategy. Renew. Energy 2021, 163, 772–782. [Google Scholar] [CrossRef]
- Han, S.; Zhang, L.; Liu, Y.; Zhang, H.; Yan, J.; Li, L.; Lei, X.; Wang, X. Quantitative evaluation method for the complementarity of wind–solar–hydro power and optimization of wind–solar ratio. Appl. Energy 2019, 236, 973–984. [Google Scholar] [CrossRef]
- Ren, G.; Wang, W.; Wan, J.; Hong, F.; Yang, K. A novel metric for assessing wind and solar power complementarity based on three different fluctuation states and corresponding fluctuation amplitudes. Energy Convers. Manag. 2023, 278, 116721. [Google Scholar] [CrossRef]
Disclaimer/Publisher’s Note: The statements, opinions and data contained in all publications are solely those of the individual author(s) and contributor(s) and not of MDPI and/or the editor(s). MDPI and/or the editor(s) disclaim responsibility for any injury to people or property resulting from any ideas, methods, instructions or products referred to in the content. |
© 2024 by the authors. Licensee MDPI, Basel, Switzerland. This article is an open access article distributed under the terms and conditions of the Creative Commons Attribution (CC BY) license (https://creativecommons.org/licenses/by/4.0/).