Article

Assessment of Fish Habitats and Suitable Ecological Flow under Hydropower Operation

1
School of Water Conservancy and Transportation, Zhengzhou University, Zhengzhou 450001, China
2
State Key Lab Simulat & Regulat Water Cycle River, China Institute of Water Resources & Hydropower Research, Beijing 100038, China
3
College of Water Conservancy and Civil Engineering, Shandong Agricultural University, Tai’an 271018, China
*
Author to whom correspondence should be addressed.
Water 2024, 16(4), 569; https://doi.org/10.3390/w16040569
Submission received: 12 December 2023 / Revised: 30 January 2024 / Accepted: 2 February 2024 / Published: 14 February 2024
(This article belongs to the Special Issue Effects of Stream Restoration on Ecohydrology System)

Abstract

:
Hydropower operations significantly alter the natural hydrological conditions of rivers, exerting adverse effects on riverine ecosystems. Accurate identification of fish habitats under hydropower operation and maintaining suitable ecological flow are crucial for riverine ecological conservation and water resource management. Coreius guichenoti was selected as the target species and the Yibin reach of the downstream Jinsha River was selected as the studied river reach. Subsequently, Weighted Usable Area (WUA) and Habitat Connectivity Index (HCI) were employed to comparatively analyze the habitat quantity and quality before and after the construction and operation of the Xiangjiaba hydropower station, namely the natural period (1991–2005), construction period (2006–2014), and operation period (2015–2020). Finally, correlations between WUA, HCI, and flow were established to determine the optimal ecological flow corresponding to optimal fish habitats. The results indicate that the average WUA and HCI during the construction period are similar to the natural period. In comparison to the natural period, the average WUA decreases by 9.2%, and the average HCI decreases by 0.05 during the operation period. It is determined that the habitat conditions are optimal when the flow is between 3000 and 5000 m3/s. After further refining the flow scenarios, the suitable ecological flow is determined to be 3500 m3/s. This study can provide a scientific basis for the water resources management in the Jinsha River and contribute to the field of riverine ecological conservation and restoration.

1. Introduction

Water conservancy projects are of great significance in flood control, irrigation, power generation and so on [1]. They ensure the rational utilization of water resources and prevent large-scale droughts and floods [2]. With the growth of the population and the development of socioeconomics, the number of water conservancy projects continues to increase. However, despite the social and economic benefits, water conservancy projects like reservoirs inevitably disrupt river connectivity, modifying hydrological conditions, including water level, flow, temperature, turbidity, and more [3,4,5]. These changes result in a decrease in the habitat suitability for fish, notably impacting the existing fish community structure and distribution within the watershed [6,7]. Preserving appropriate ecological flow and habitat conditions is a prerequisite for ensuring the reproduction of fish [8,9]. Therefore, determining the suitable ecological flow in rivers and understanding the impact of water conservancy projects on the suitability of fish habitats has become increasingly urgent and necessary for the restoration and protection of fish habitats.
The protection of fish habitats has gradually become a hot point for the study of river ecosystems in recent years [10,11,12]. Through ecological operation and the construction of ecological engineering, suitable hydrodynamic conditions can be provided for the growth of fish [13,14]. A prerequisite for this research is the accurate identification of fish habitats and their susceptibility to the impacts of water conservancy projects [15,16,17]. To achieve this, scholars have developed habitat models to assess the effects of water resource development and water conservancy projects on habitats [18,19,20]. To establish habitat models, a plethora of numerical models, such as HEC-RAS, MIKE11, River2D, PHABSIM, and MIKE3, have been widely applied. Previous habitat models primarily utilized Weighted Usable Area (WUA) to assess habitat conditions. However, this indicator can only evaluate the quantity of suitable habitats and cannot describe habitat quality, such as habitat connectivity. The habitat connectivity index (HCI) allows the determination of habitat connectivity ensuring there is a range of fish activities, promotion of their spawning and reproduction (Yang, S. et al., 2023) [18]. The fragmentation of habitats caused by dam barriers hinders the dispersion and migration pathways of fish, leading to a reduction in fish species and resource abundance [21]. Therefore, precise identification of habitat connectivity and the implementation of restoration measures are crucial for the conservation of fish resources and the stability of river ecosystems.
Ecological flow refers to the water flow required to maintain the natural functioning of riverine ecosystems while meeting the demands of human societies for water resources [22,23]. The fundamental principle underlying the calculation of ecological flow involves scrutinizing the hydrological, aquatic biological and geomorphological features of river ecosystems to determine a water flow condition that not only satisfies societal needs but also supports inherent ecological functions [24,25]. The methods for calculating ecological flow can be categorized into four classes: hydrological, hydraulic, habitat, and holistic methods [26]. The hydrological method is the most extensively employed due to its simplicity and broad applicability; however, it lacks explicit ecological significance [27]. The hydraulic method builds upon the hydrological method by incorporating river and biological information, though it falls short in considering the holistic aspects of ecosystems [28,29]. The holistic method integrates multiple disciplines and is currently the most reasonable method for ecological flow assessment, albeit with high data requirements and operational complexity [3]. Habitat methods, by quantifying the relationship between flow and the quality of indicator species habitats, provides ecological flow for different life stages with a clear physical mechanism, making it widely applied [30]. Previous studies for the habitat method predominantly established correlations between WUA and flow to determine the ecological flow corresponding to the maximum suitable habitat area [31,32]. However, this method neglects the consideration of habitat quality, rendering the outcomes less conducive to fulfilling the habitat requirements of fish species.
Therefore, considering the suitable habitat area and habitat connectivity, this study employs WUA and HCI to assess both the quantity and quality of fish habitats. Subsequently, correlations between WUA, HCI, and flow are established to determine the optimal ecological flow corresponding to the most suitable fish habitats. The outcomes of this research can serve as a scientific foundation for water resource management and riverine ecological restoration.

2. Materials and Methods

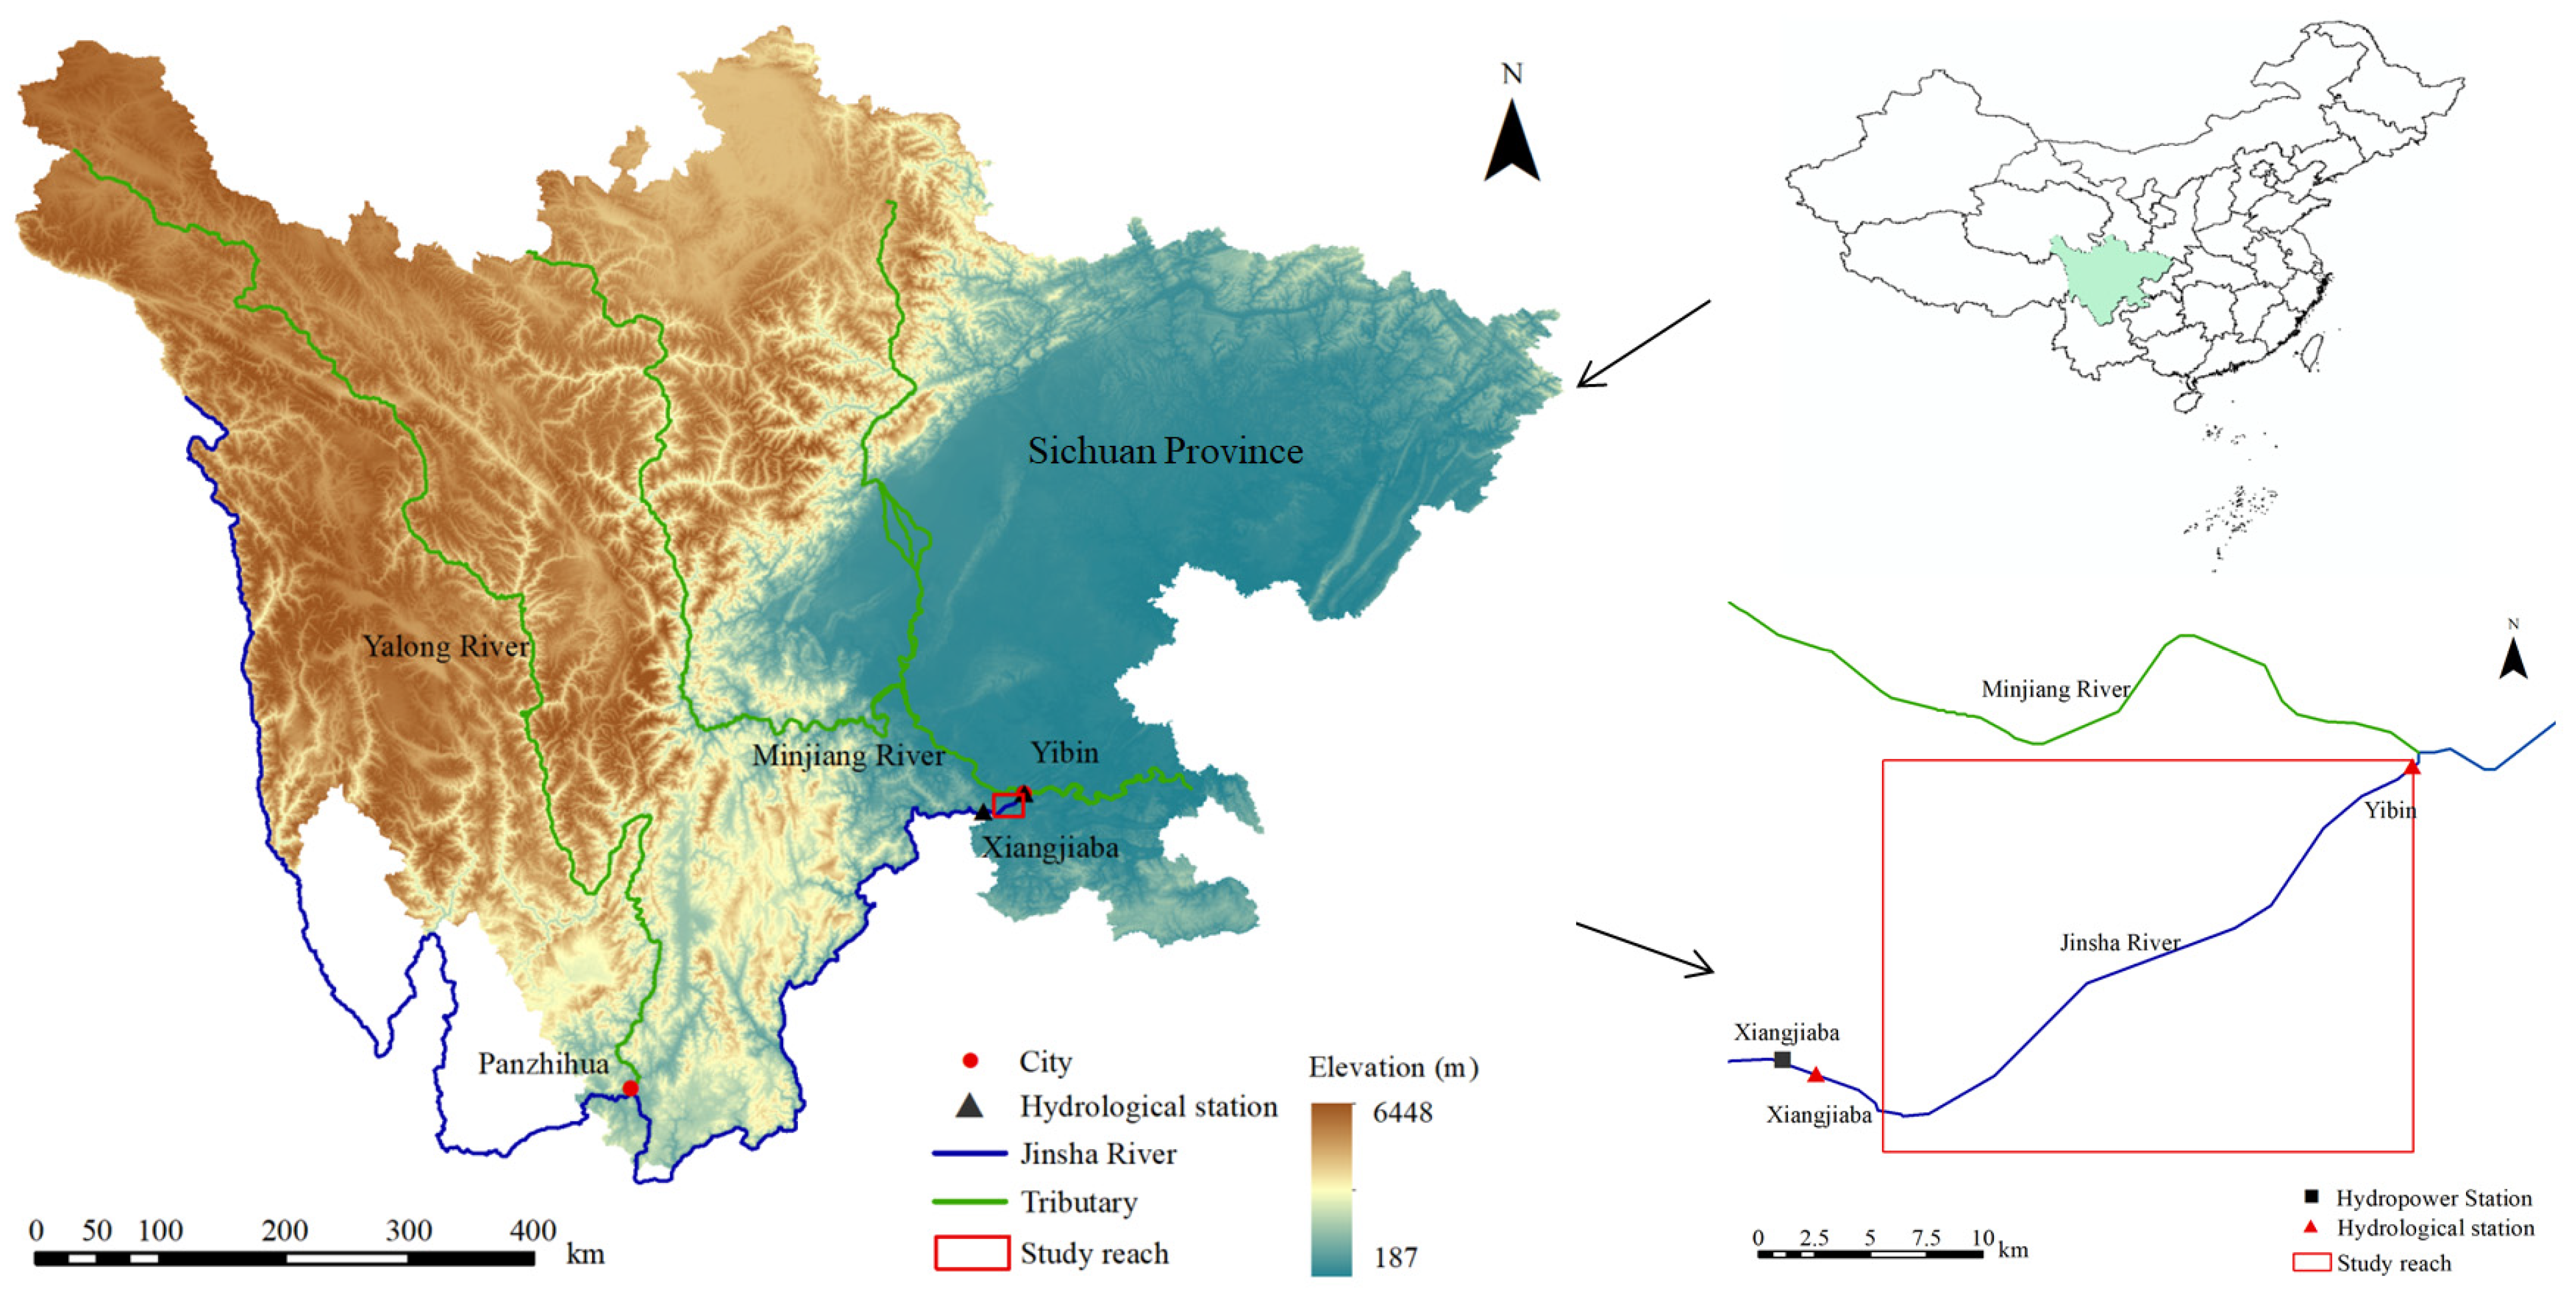
2.1. Study Area and Data Sources

The Jinsha River, situated in the upper reaches of the Yangtze (Figure 1), boasts abundant hydroelectric and fish resources. Currently, a sophisticated cascade reservoir system has been established, with the capacity for power generation reaching 37 million kw. Among these, the construction of the Xiangjiaba Hydropower Station commenced in November 2006, and it commenced operations in July 2014, exhibiting a maximum reservoir capacity of 5.16 billion m3. With the operation of the Xiangjiaba Hydropower Station, there has been a discernible transformation in the hydrological conditions downstream, exerting a certain influence on the spawning, reproduction, and foraging of fish. This study designates the downstream reach of the Jinsha River, proximal to the Xiangjiaba Hydropower Station, as the study area, spanning approximately 30 km from the station’s downstream point, 5 km beyond Xiangjiaba, to the Yibin hydrological station. This river reach represents a crucial sanctuary for fish in the upper reaches of the Yangtze, harboring a diverse array of rare species unique to the upper Yangtze, as well as economically significant fish species. The study employs daily runoff data from the Xiangjiaba hydrological station (2 km downstream of Xiangjiaba Hydropower Station) spanning from 1990 to 2020 and water level data from the Yibin hydrological station for 2020. These data sources are derived from the Changjiang Water Resources Commission of the Ministry of Water Resources.

2.2. Methods

The procedural framework of this study is illustrated in Figure 2. (1) Hydrodynamic model is employed to calculate water depths and velocities under varying flow conditions. (2) Habitat model is utilized to establish suitability curves for water depth and velocity of the target fish species. (3) Assessment of habitat quantity and quality for distinct periods using WUA and HCI. (4) Relationships between WUA, HCI and flow are constructed, facilitating the derivation of suitable ecological flow of various flow scenarios.

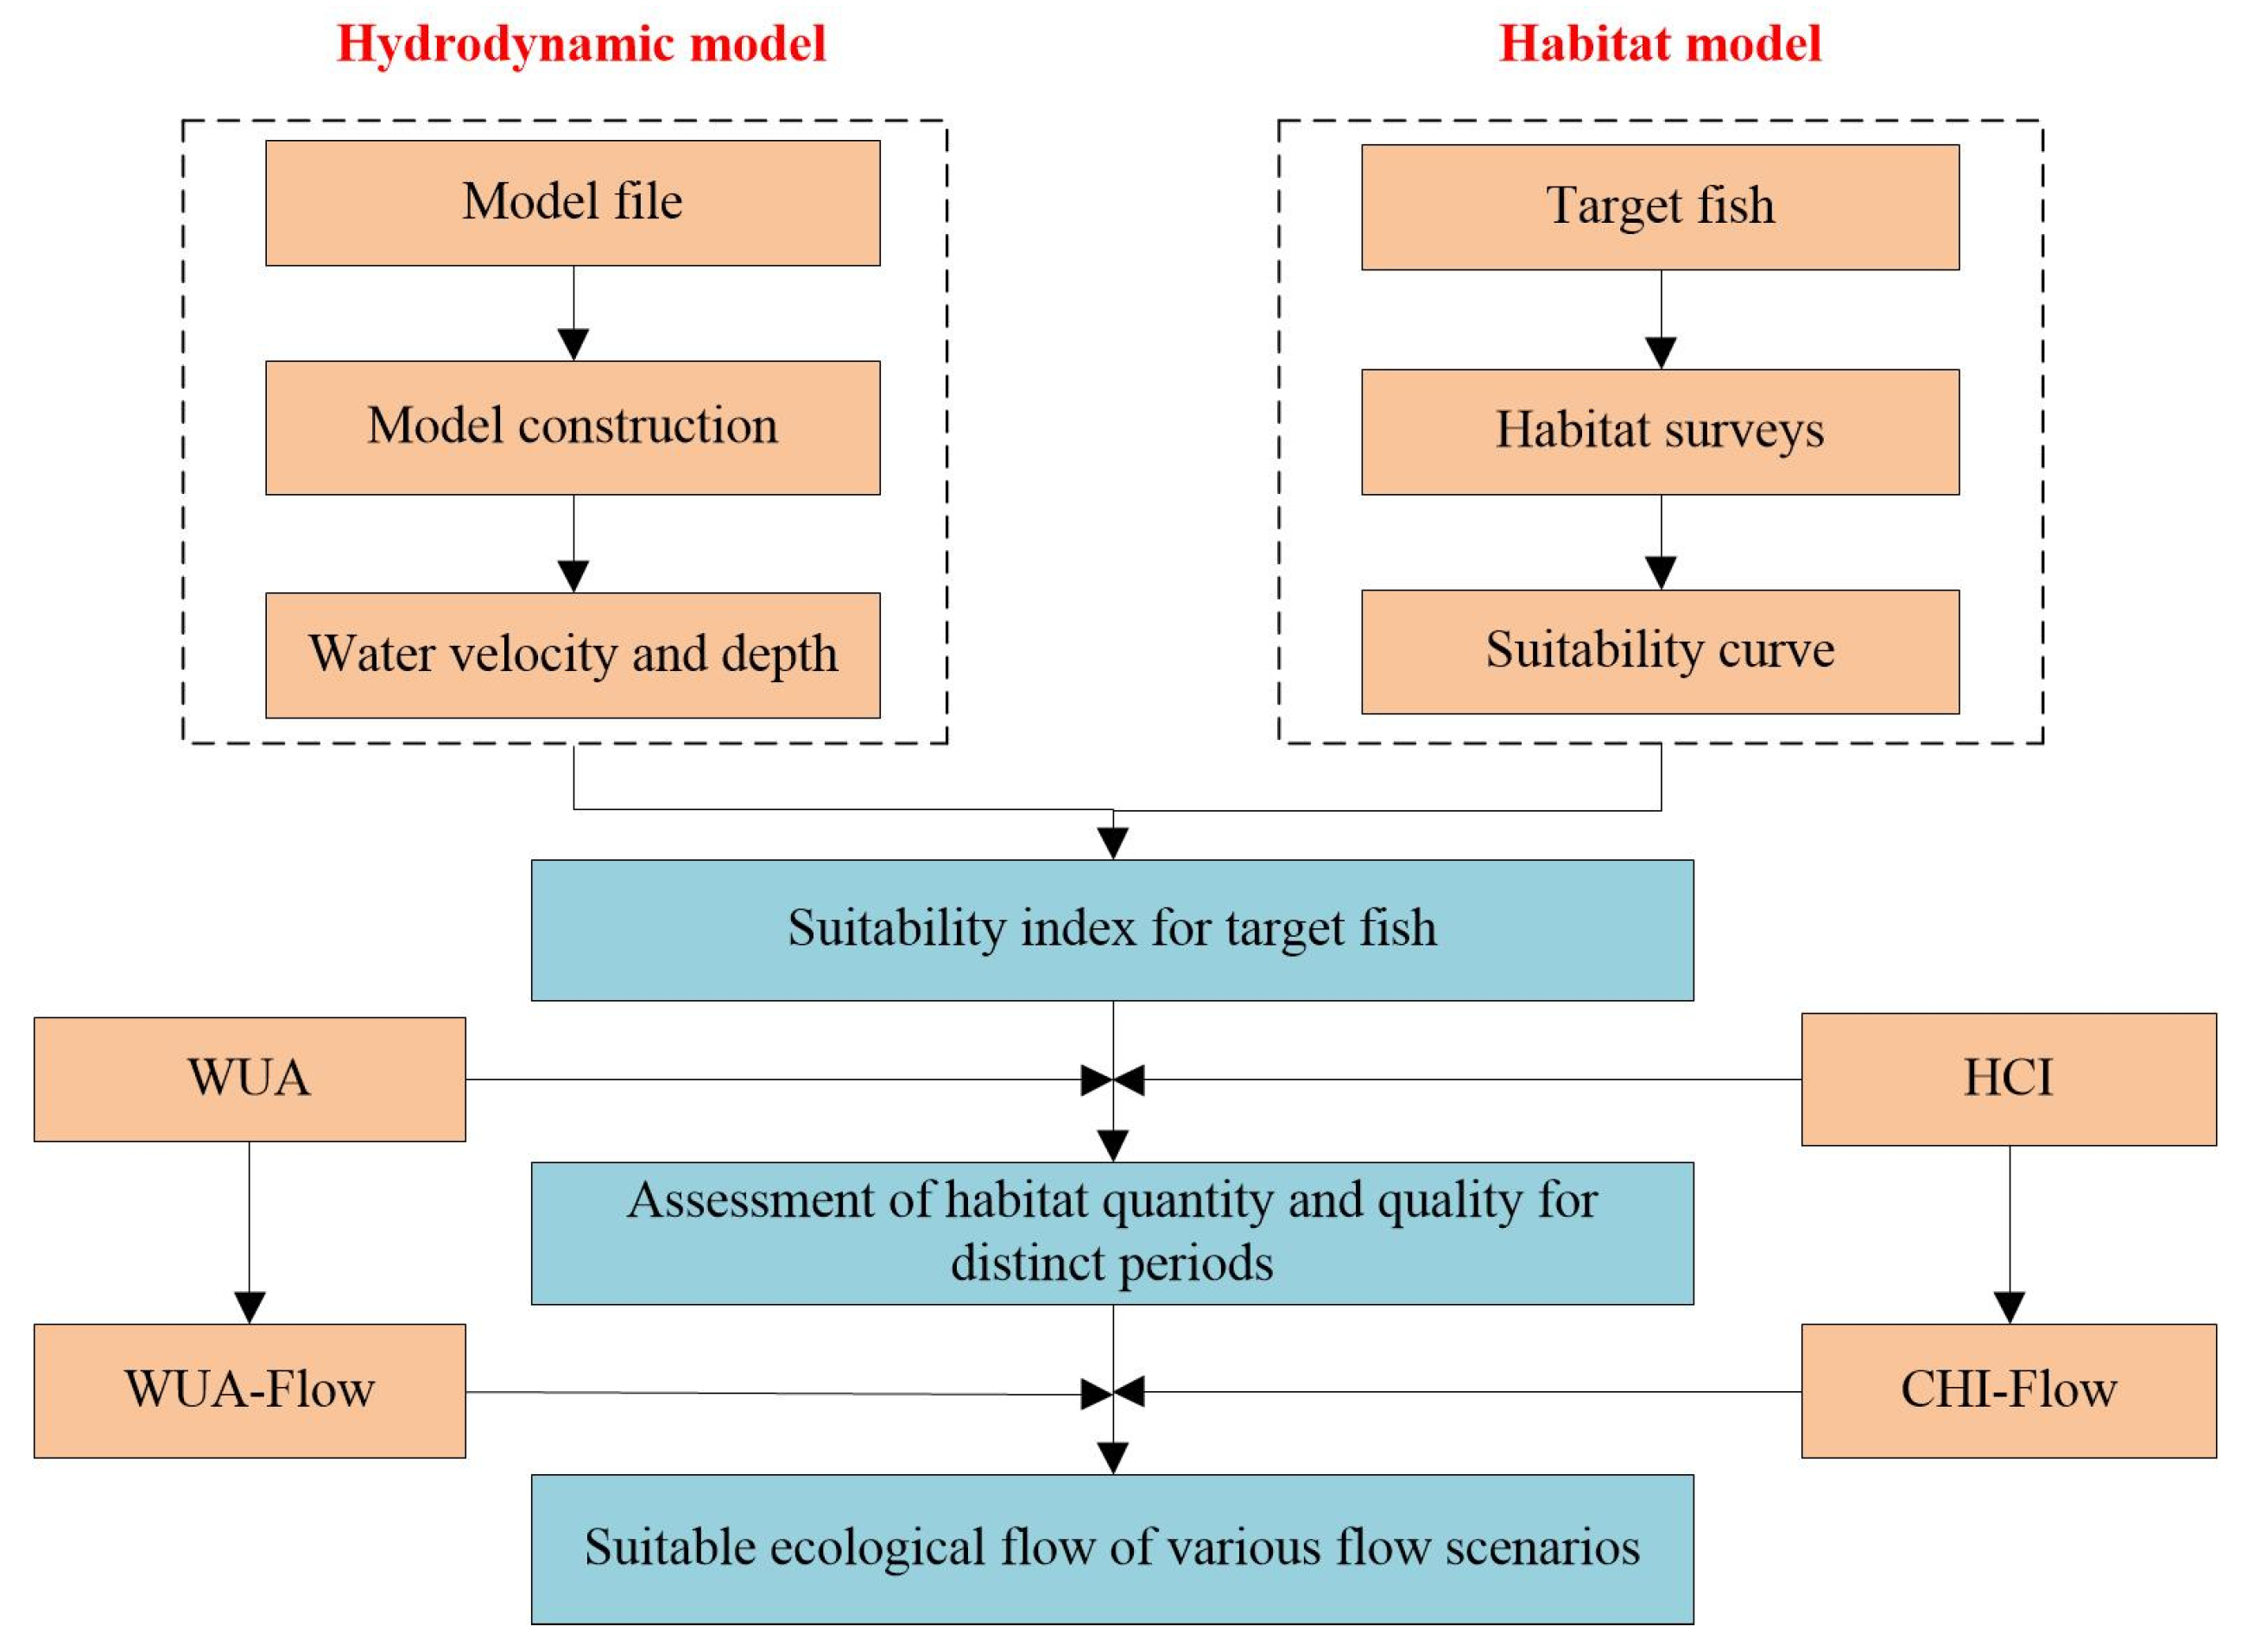
2.2.1. Hydrodynamic Model

The Hydrodynamic Model was employed to compute water velocity and depth distribution under different flow scenarios. The hydrodynamic distribution characteristics of the habitat were analyzed using the MIKE 21 FM two-dimensional hydrodynamic model. This software, crafted by the Danish Hydraulic Institute (DHI), represents a numerical model. The hydrodynamic model adeptly captures the undulations in river water levels and the dynamic shifts in flow velocity and water elevation induced by diverse forces. Employing an unstructured irregular triangular mesh, this model could delineate the shoreline conditions of the simulated region. In accordance with the hydrodynamic characteristics of the studied river reach, this investigation forged a grid encompassing 7503 nodes and 13,165 elements. The total area of the river reach is 8,405,062 m2.
This study necessitates the calibration of riverbed roughness, specifically the Manning coefficient within the model. Following meticulous calibration, a Manning coefficient of 32 m1/3/s is ascertained to meet the precision requisites of this investigation. Validation is subsequently carried out using water level measurements from the Xiangjiaba hydrological station for the period of 1 November to 30 November 2020. The results manifest a high qualification rate for simulated water levels with an average error magnitude below 0.1 m and an accuracy of more than 90%. The model stands in accordance with the simulation criteria. The results of the model validation are shown in Figure 3.

2.2.2. Habitat Model

The Habitat Model, on the other hand, establishes suitability curves for the target species’ habitat, determining habitat suitability indexes based on the water velocities and depths distribution at different flow scenarios. Then, WUA and HCI were used to evaluate the quantity and quality of fish habitat. The calculation process is as follows:
W U A = i = 1 n C S F i ( V i , H i ) × A i
n represents the number of elements; CSFi denotes the Combined Suitability Factor (CSF) for the i-th element; Vi signifies the water velocity of the i-th element, m/s; Hi indicates the water depth of the i-th element, m; and Ai corresponds to the area of the i-th element, m2.
Concerning the CSF there are primarily four commonly employed computational methods: the product method, geometric mean method, minimum value method, and weighted mean method [11]. This study intends to employ the geometric mean method to compute the combined suitability value, expressed by the following formula:
C S F i ( V i , H i ) = f ( V i ) × f ( H i )
f(Vi) and f(Hi) denote the suitability index of water velocity and depth for the i-th element, respectively, as derived from the suitability curves corresponding to the water velocity and depth.
HCI is a quantitative indicator used in ecology to assess the degree of connectivity between different habitats. It provides a numerical representation of how well organisms can move and disperse across various habitats. Higher HCI leads to better habitat connectivity and more living space for fish. HCI can usually be expressed as Equation (3).
H C I = j = 1 N P j A / M S T
where Pj is the area of the jth habitat patch, m2; and N is the number of habitat patches. A is the total area of the river reach. A habitat patch is defined as a patch with a CSF greater than 0.6 [18]. Minimum spanning tree (MST) is a concept of graph theory to solve optimization problems. Detailed calculations of MST are described in S. Yang et al. (2023) [18].

2.2.3. Target Fish and the Suitability Curves

Prior research has indicated that various factors, such as alterations in hydrological conditions and habitat fragmentation induced by hydropower development in the middle and lower reaches of the Jinsha River, have significantly impacted the fishery resources in numerous sections of the river. This impact is notably observed in certain species, including the Coreius guichenoti, Rhinogobio ventralis, and Schizothorax prenanti, all of which held a dominant position in the pre-reservoir fish community structure of the Jinsha River [33]. Coreius guichenoti was selected as the target fish in this study due to its high sensitivity to flow and important economic value. Coreius guichenoti serves as a vital catch in numerous tributaries of the middle and lower reaches of the Jinsha River, with its spawning grounds currently confined to the main stem of the Jinsha River and certain reaches of the Yalong River above the city of Yibin.
The determination of the habitat suitability curves for fish is a pivotal step in the habitat simulation method. The establishment of these curves is grounded in the suitability index (SI), which quantitatively analyzes the relationship between the preferences of fish for their habitat and the environmental factors. The suitability index curves, with habitat factors on the abscissa and the suitability of the fish on the ordinate, construct continuous curves depicting the preferences and relationships between habitat factors. This approach quantitatively characterizes the water dynamic features of the habitat and the survival quality of the fish under such conditions. Values ranging from 0 to 1 define the preferences of the fish for habitat factors, where 0 signifies complete unsuitability, and 1 denotes complete suitability. Through on-site investigations [34] and the relevant literature [35], the suitability curves for water velocity and depth during the spawning phase (from Late April to Early July) of Coreius guichenoti have been acquired, as depicted in Figure 4. The optimal water velocity during the spawning phase ranges from 0.3 to 1.3 m/s, while the ideal water depth varies from 1.2 to 11.5 m.

2.2.4. Assessment of Fish Habitat and Suitable Ecological Flow

Considering the construction and operation timeline of the Xiangjiaba Hydropower Station, along with the available runoff data, this study categorizes the runoff sequence into three periods: the natural period (1991–2005), the construction period (2006–2014), and the operation period (2015–2020). Through comparative analysis of habitat quantity and quality during different periods, we seek to unravel the impact of hydropower operations on the spawning habitat of fish. For each period, the annual mean runoffs from late April to early July were selected as input conditions for the hydrodynamic model. Employing the ten-day flow as the computational unit, the water velocity and depth for scenarios in late April, early May, mid-May, late May, early June, mid-June, late June, and early July were calculated. Subsequently, WUA and HCI of the eight scenarios were used for the assessment of habitat quantity and quality.
Based on the runoff sequence from 1991 to 2020, the measured maximum flow at the Xiangjiaba station during late April to early July ranges from 1591 m3/s to 10,500 m3/s. Consequently, considering a range of upstream boundary flow set from 1000 to 13,000 m3/s in the hydrodynamic model, this spectrum sufficiently encompasses the actual flow conditions in the study reach. Within this flow range, thirteen simulated flow conditions are selected, ranging from 1000 to 13,000 m3/s at intervals of 1000 m3/s. Subsequently, we establish the relationship between WUA and flow, as well as HCI and flow, thereby determining the suitable ecological flow. The flow is considered the ecological flow when, at a given flow, both the quantity and quality of fish habitats are optimal (maximized).

3. Results

3.1. Assessment of Habitat Quantity and Quality

3.1.1. Runoff Pattern

The runoff during the spawning phase across the three periods is illustrated in Figure 5. It is distinctly observable that the runoff during the construction period is lower than that in the natural period. During the operation period, the runoff from late April to late May (dry season) surpasses the natural period, while the runoff from early June to early July (wet season) is lower than the natural period. This phenomenon is closely associated with the operation of the hydropower station.

3.1.2. Assessment of Habitat

WUA and HCI during the spawning phase across the three periods are depicted in Figure 6. From late April to early June, the trends of WUA and HCI remain relatively stable, but after mid-June, both indicators exhibit a rapid decline. Regarding WUA, the proportion of the total area covered by the average WUA in the study reach during the three periods are 64.1%, 63.2%, and 54.9%, respectively. From late April to early June, WUA during the natural period exceeds that of the construction and operation periods. In mid- and late June, WUA during the construction period exceeds that of the natural and operation periods. With increasing flow, in early July, WUA during the operation period is 2.58 million m2, surpassing the construction period which measures 2.29 million m2, while the natural period records the minimum at 1.98 million m2. HCI exhibits a similar trend to WUA. The average HCI during the three periods are 0.47, 0.47, and 0.41, respectively. From late April to early June, HCI during the natural period exceeds that of the construction and operation periods. In mid- and late June, HCI during the construction period surpasses that of the natural and operation periods. In early July, HCI attains its pinnacle during the operational period at 0.18, followed by the construction period at 0.16, with the natural period registering the nadir at 0.13.
These eight phases are deemed equally significant since the peak spawning phase cannot be accurately determined. The results indicate that average WUA and HCI during the construction period are comparable to those during the natural period. Under hydropower operation, the suitable habitat area for Coreius guichenoti decreases by 9.2%, and HCI decreases by 0.05. Moreover, larger flow volumes do not necessarily translate into better habitat conditions for fish.
To further explore the impact of habitat changes on fish after hydropower operation, we have generated spatial distribution maps for the combined suitability factor (CSF) of fish spawning habitats in the study reach. Take late June as an example; the CSF in late June for the three periods was illustrated in Figure 7. The CSF of the construction period is markedly superior to the operation period and surpasses that of the natural period. In the natural period, the average flow in late June is 6635 m3/s. According to the results obtained from the two-dimensional hydrodynamic model, the average water velocity is 1.21 m/s; with an average depth of 11.11 m. The CSF in different regions is relatively small, averaging 0.47. This suggests that, during this period, the CSF does not sufficiently meet the hydrodynamic conditions required for the spawning of Coreius guichenoti. In the construction period, the average flow in late June decreases to 4901 m/s, leading to an increase in the CSF in different regions, with an average value of 0.65. In the operation period, the average flow in late June decreases to 6028 m/s, and the average CSF is 0.62.

3.2. Assessment of Suitable Ecological Flow

The relationships between WUA, HCI and flow across the distinct flows of 1000–13,000 m3/s are illustrated in Figure 8. When the flow is at 1000 m3/s, WUA is minimal, merely at 2,053,431 m2, constituting a mere 24.4% of the river reach’s total area. As the flow increases, WUA exhibits an initial rising trend, achieving its peak when the flow ranges between 3000 and 5000 m3/s. Subsequently, with further increase in flow, WUA begins to decline, reaching 2,313,177 m2 at a flow of 13,000 m3/s, accounting for 27.5% of the river reach’s total area. The relationship between HCI and flow mirrors that of WUA and flow. Notably, the HCI attains its peak at a flow of 3000 to 5000 m3/s. This indicates that during the spawning phase of Coreius guichenoti, both the habitat suitability area and habitat connectivity index are minimized at either low or high flow, while they are more suitable at moderate flow.
To further delineate the suitable ecological flow, eleven simulated flow conditions are selected, ranging from 3000 to 5000 m3/s at an interval of 200 m3/s. The relationships between WUA, HCI and flow across the distinct flows of 3000–5000 m3/s are illustrated in Figure 9. It is evident that when the flows are 3400 and 3600 m3/s, both WUA and HCI reach their peak, respectively. Consequently, the derived ecological flow values for these two indicators are 3400 and 3600 m3/s, respectively. Ultimately, the average of the two values is selected as the suitable ecological flow for the spawning phase of Coreius guichenoti, namely 3500 m3/s.

4. Discussion

4.1. Impacts of Habitat Changes on Fish after Hydropower Operation

The construction and operation of hydropower stations lead to an increasingly shrinking habitat for fish, causing fragmentation and weakening of the continuity and integrity of the environment [21]. Although previous studies have explored the impact of hydropower operation on fish habitats, most of these studies focused on the assessment of the quantity of fish habitats, namely WUA [36,37]. Our study aims to comprehensively reflect the changes in fish habitats before and after hydropower operation, providing targeted information for researchers and managers. In light of this, our research utilizes both WUA and HCI to assess the quantity and quality of the fish habitat, respectively. The operation of the Xiangjiaba hydropower station has altered the natural flow regime, with an increase in flow during the dry season and a decrease during the flood season. However, fish exhibit varying suitability to different hydraulic conditions. For instance, during the spawning period, the optimal water depth for these fish is in the range of 1.2–11.5 m, and the optimal water velocity is between 0.3 and 1.3 m/s. Therefore, excessively high or low flows are unfavorable for fish habitats. Our outcomes indicate that, after the hydropower operation, there is a significant decrease in both WUA and HCI for fish.

4.2. Comprehensive Analysis of the Suitable Ecological Flow and Habitat Assessment Approach

Since 2017, the Xiangjiaba Hydropower Station has conducted ecological operation experiments for the natural reproduction of fish every May to June. For pelagic-spawning fish species, such as Coreius guichenoti and Four Famous Domestic Fishes, ecological operation prioritizes ensuring the suitable ecological flow required for fish spawning [38]. Subsequently, it achieves a sustained rising water process by progressively increasing discharge, fostering favorable conditions for fish reproduction. Ecological scheduling data from 2020 indicates that during periods with an average flow of 3200 m3/s, the spawning peak of Coreius guichenoti occurred in the Yibin reach. This suggests that the calculated ecological flow in the paper is reasonable, providing valuable insights for the protection of Coreius guichenoti in the downstream Jinsha River.
However, due to limited temperature data, the habitat model calculations simplified the parameters, omitting considerations for the impact of temperature parameters on habitat area. Therefore, it is necessary to develop more accurate suitability curves based on additional observed data, considering the influence of temperature and other key factors in further in-depth research. Additionally, we solely calculated the average WUA and HCI for each phase. While this can reflect the overall trends in the quantity and quality of fish habitats, it cannot capture their variation characteristics. In future research, a more detailed exploration of the impact of hydropower operations on fish habitats, specifically their detailed variations, should be undertaken. Beyond addressing the natural spawning phase of the Coreius guichenoti, efforts should be directed towards safeguarding other critical life history stages of fish, such as juvenile growth and fish migration. This entails enhancing the ecological scheduling strategy in the Xiangjiaba Hydropower Station, utilizing research findings more effectively in the comprehensive protection of Coreius guichenoti throughout their entire life cycle.

5. Conclusions

In addressing the limitation of a single indicator for habitat assessment, this study employs WUA and HCI to evaluate the quantity and quality of fish habitats, providing a comparative analysis of the impact of hydropower operations on habitat conditions. Subsequently, by configuring various flow scenarios, we establish the relationships between WUA, HCI, and flow to derive the suitable ecological flow for the target fish species. The conclusions are presented below:
(1)
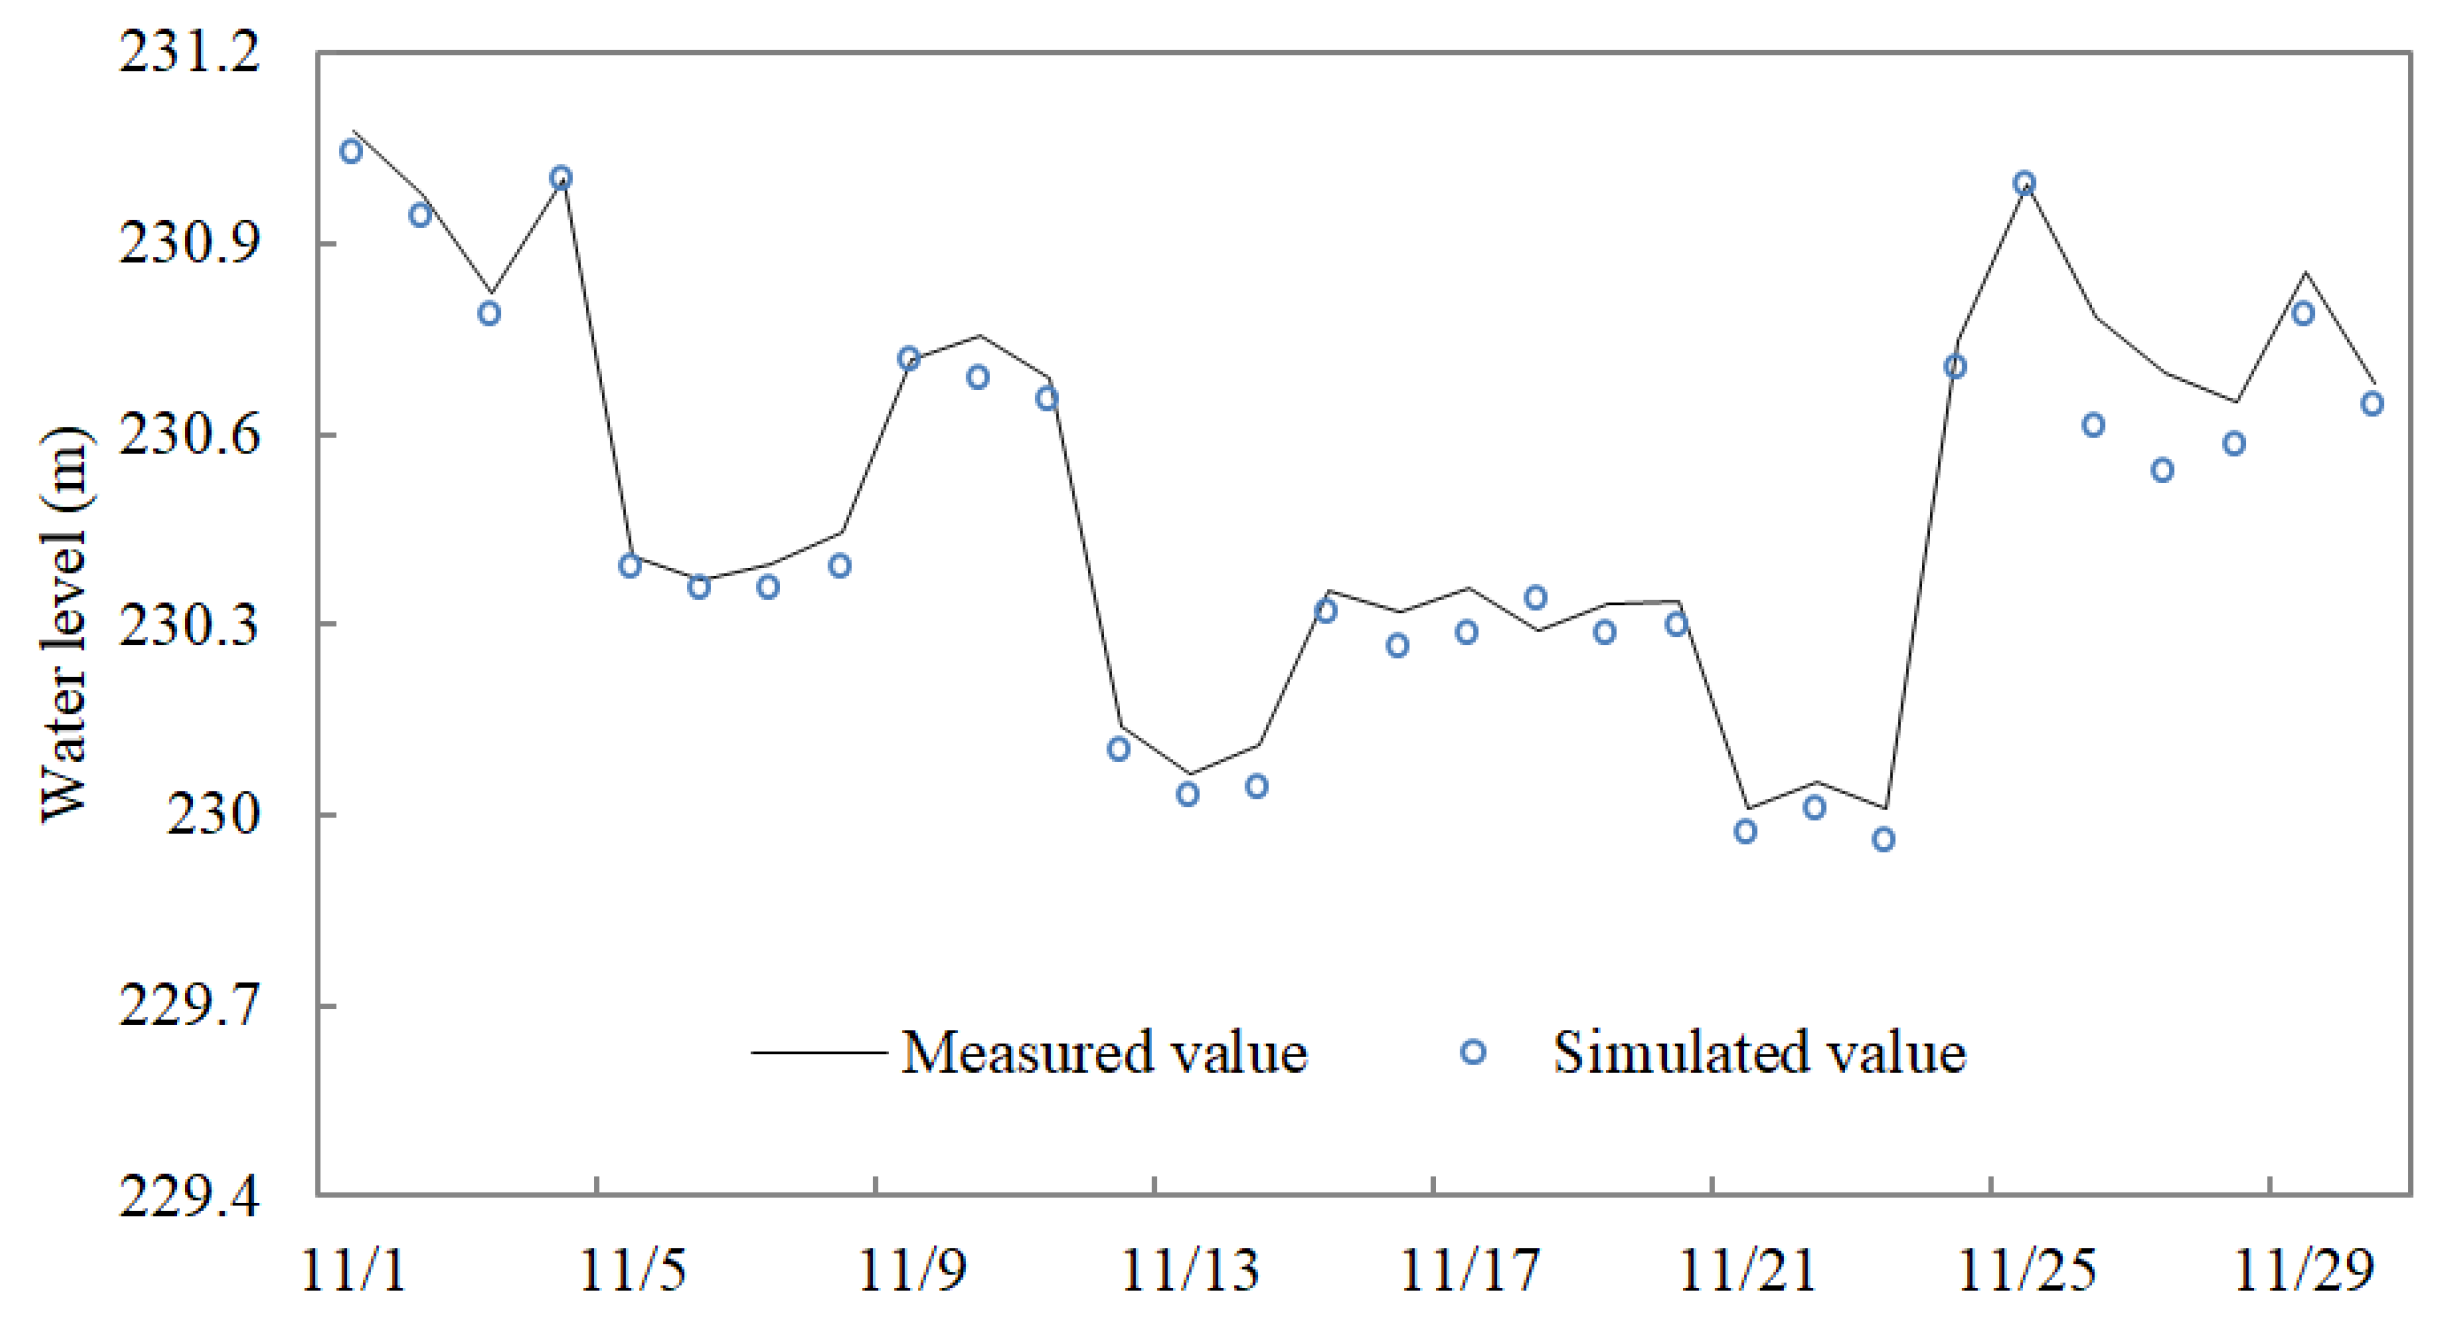
In this study, Coreius guichenoti was selected as the target fish. The accuracy of Mike21 meets the required standards, allowing for precise simulations of the hydrodynamic characteristics of Coreius guichenoti habitats under varying flow conditions. A habitat model for Coreius guichenoti was established based on the relevant literature. The optimal depth for the fish ranges 1.2–11.5 m, and the optimal flow velocity ranges 0.3–1.3 m/s during the spawning period.
(2)
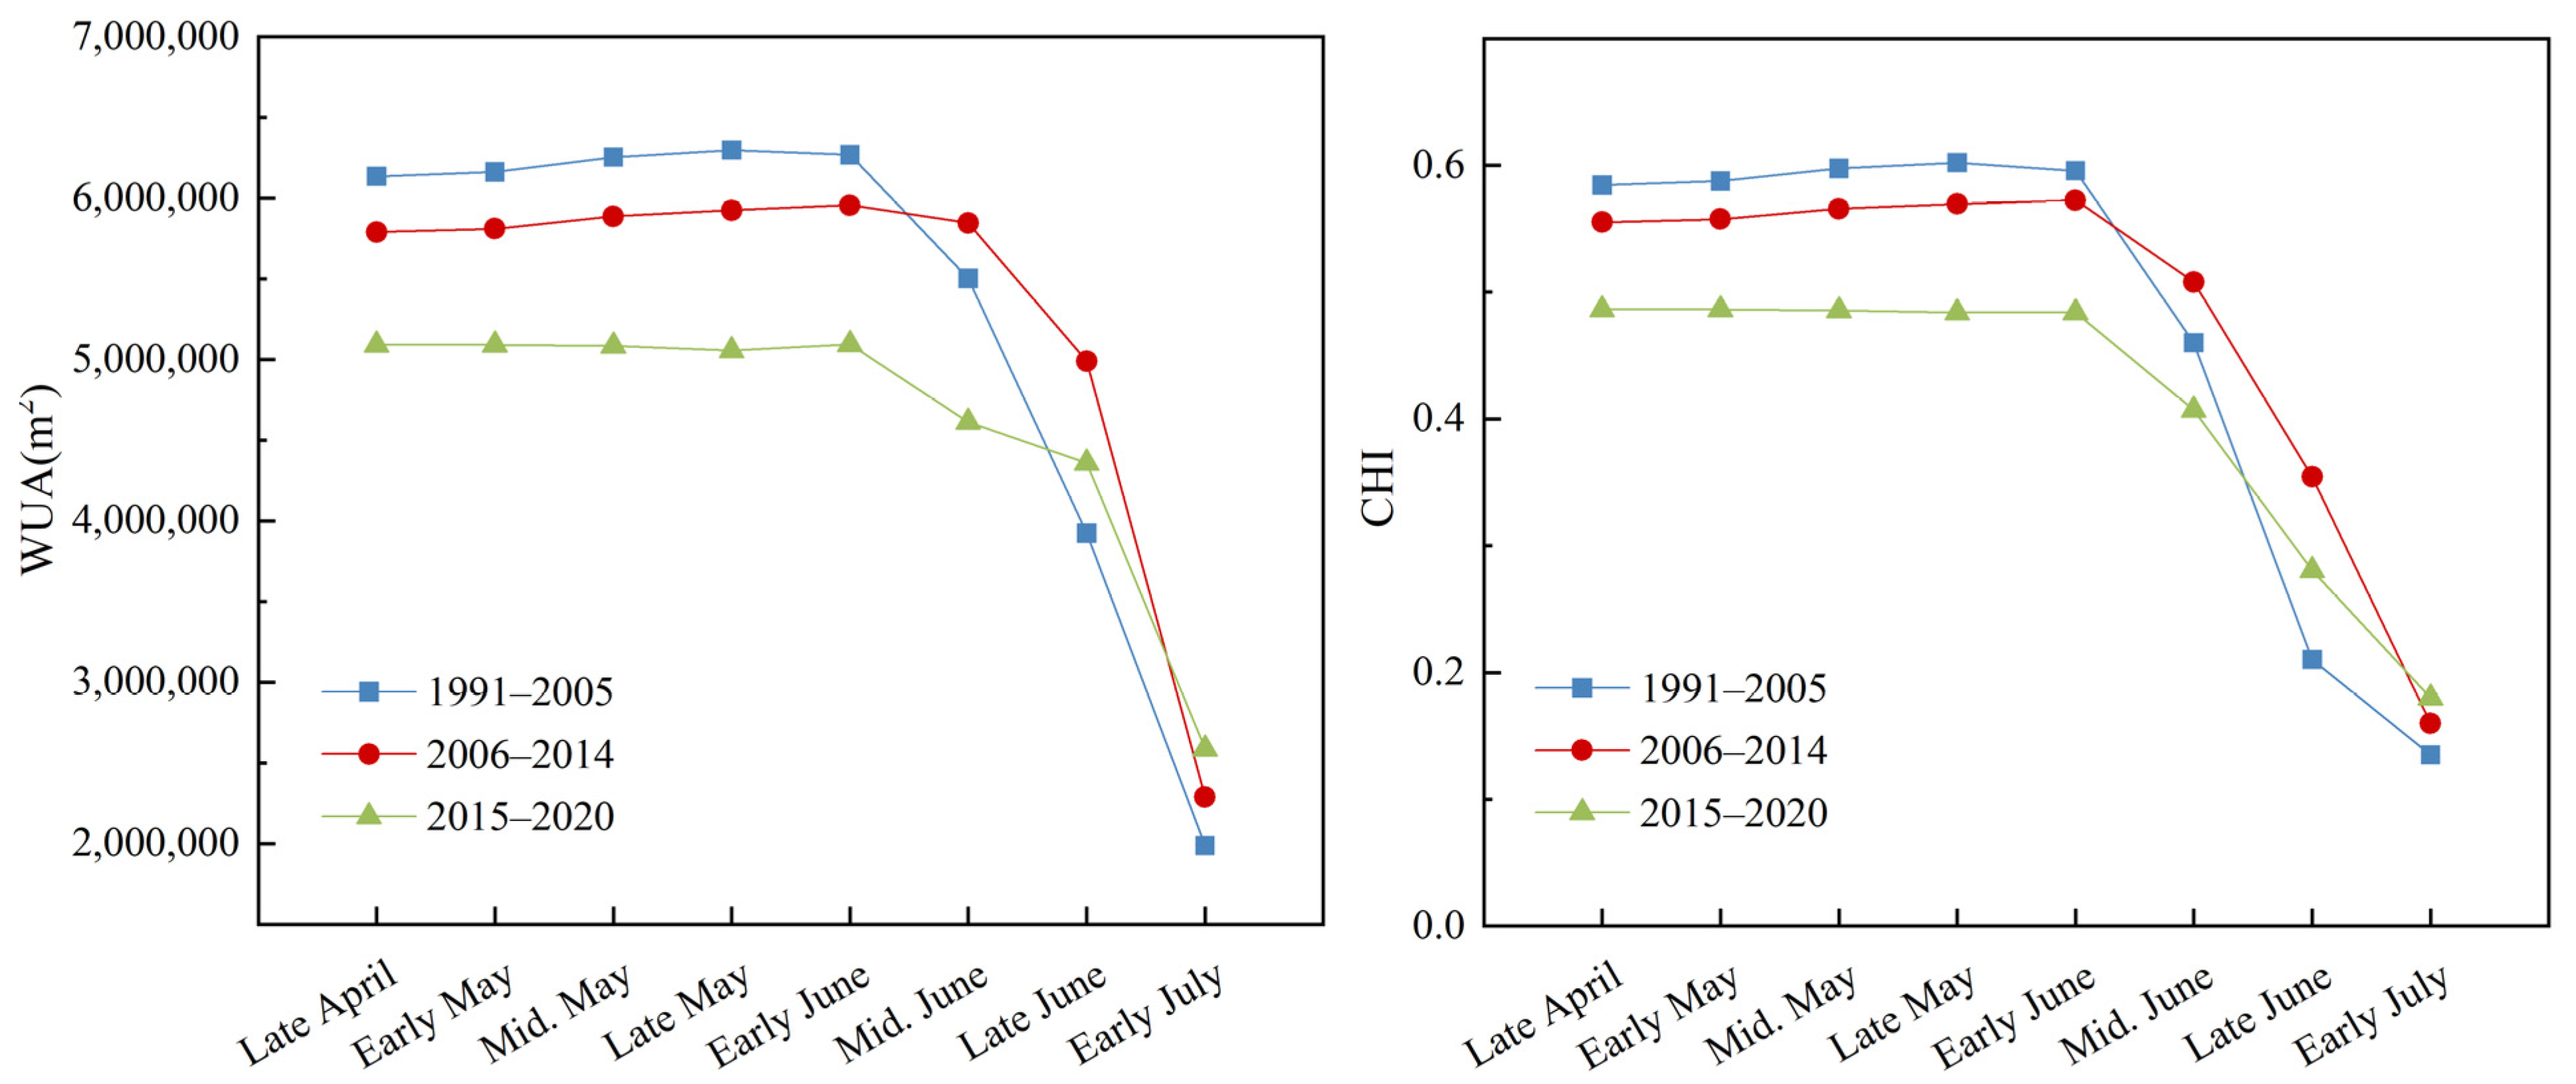
The spawning phase of Coreius guichenoti was divided into eight phases, and the habitat conditions for the eight phases during different periods were assessed. The results indicate that the average WUA and HCI during the construction period are close to those of the natural period. In comparison to the natural period, the average WUA during the operation period decreased by 9.2%, and the average HCI decreased by 0.05 [38]. However, with an increase in flow, in late June and early July, both the construction and operation periods exhibit higher WUA and HCI compared to the natural period.
(3)
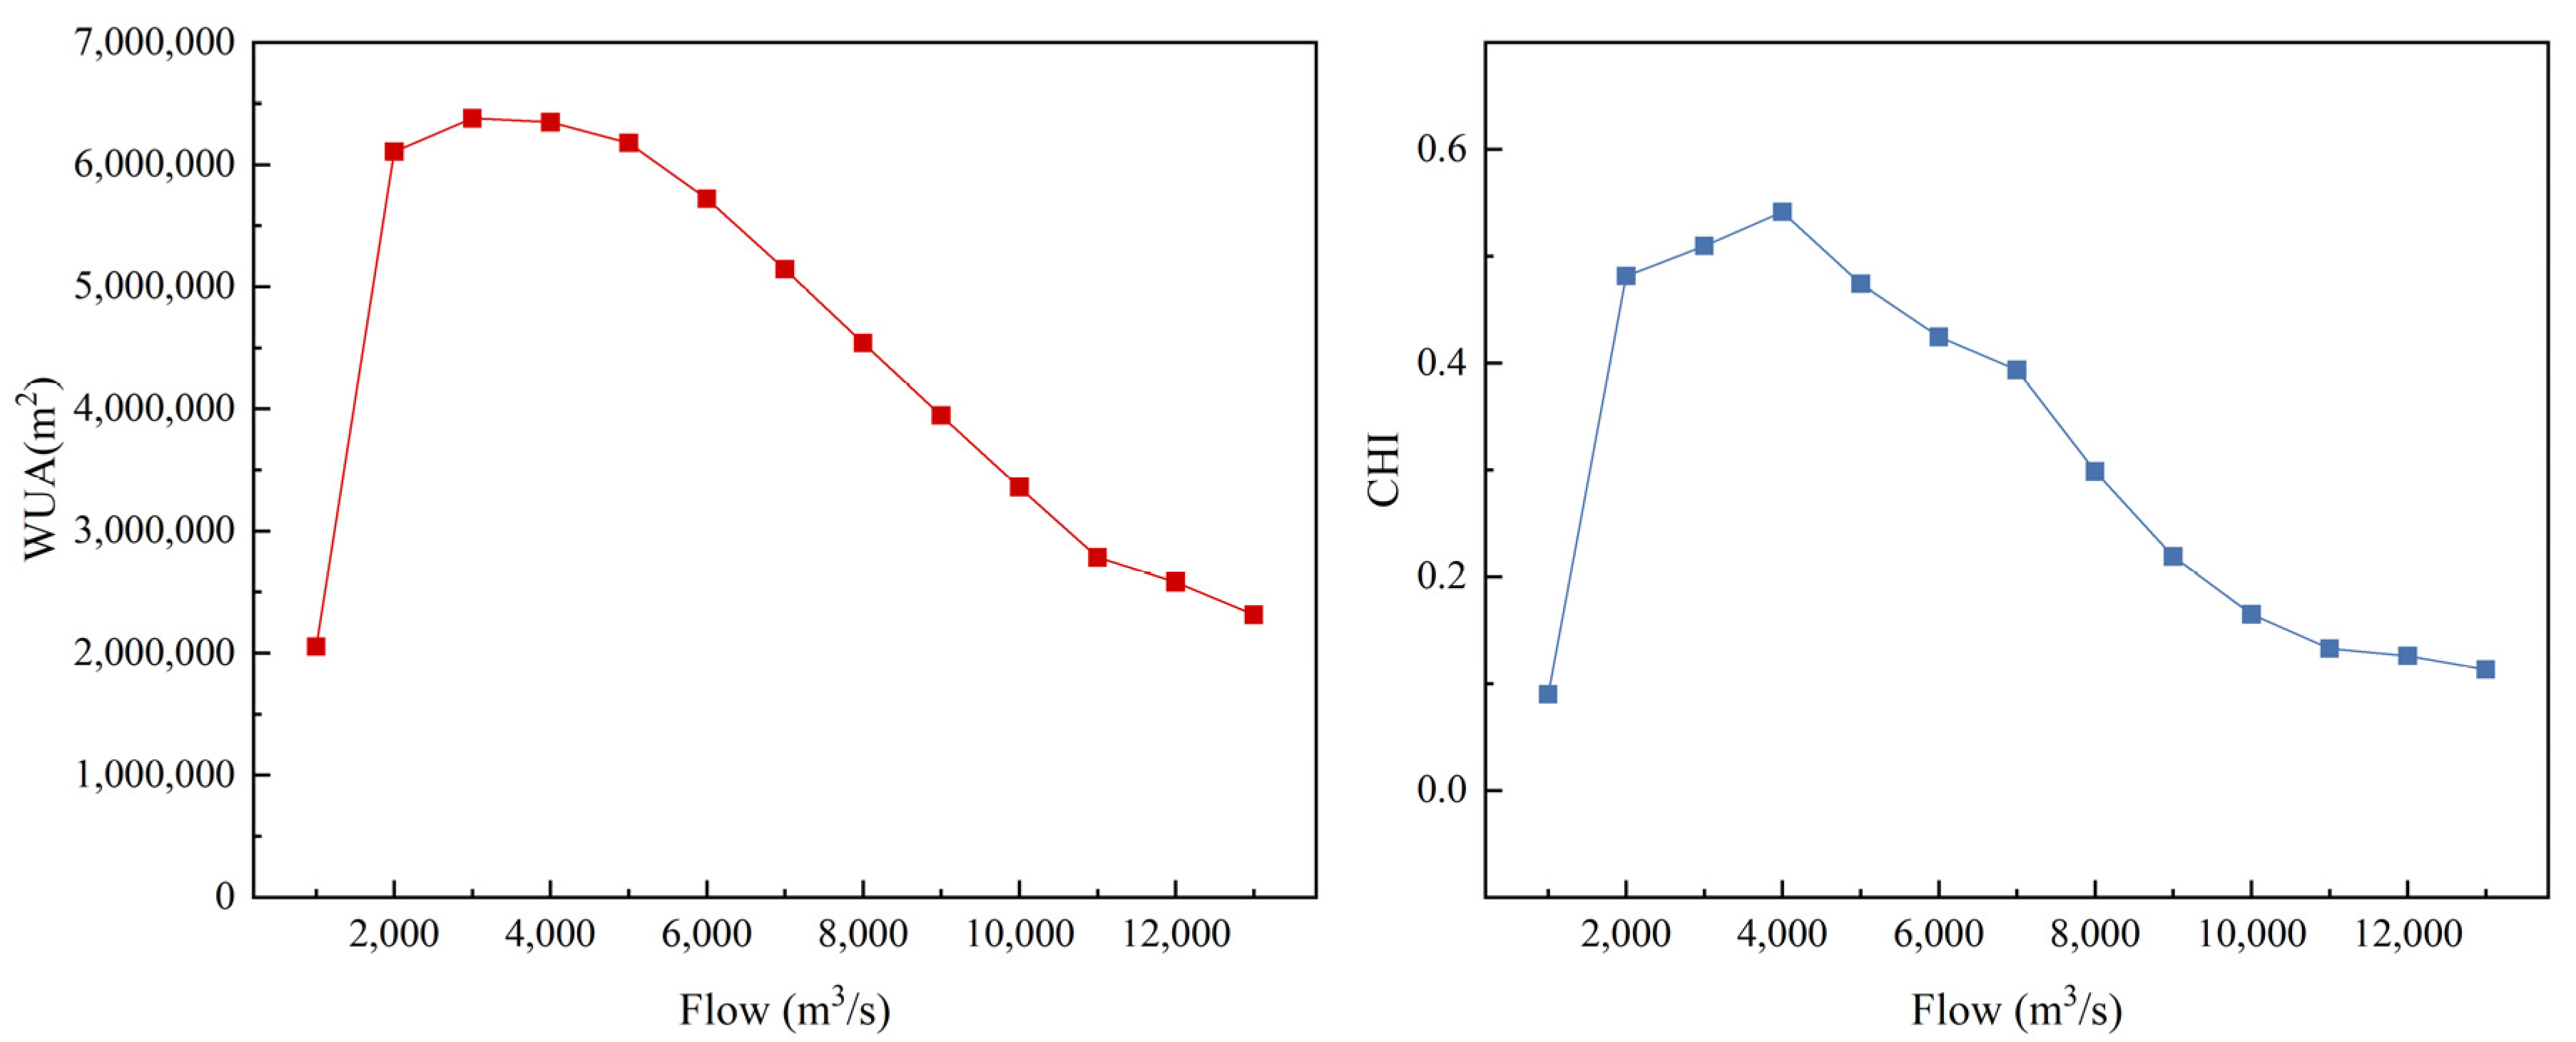
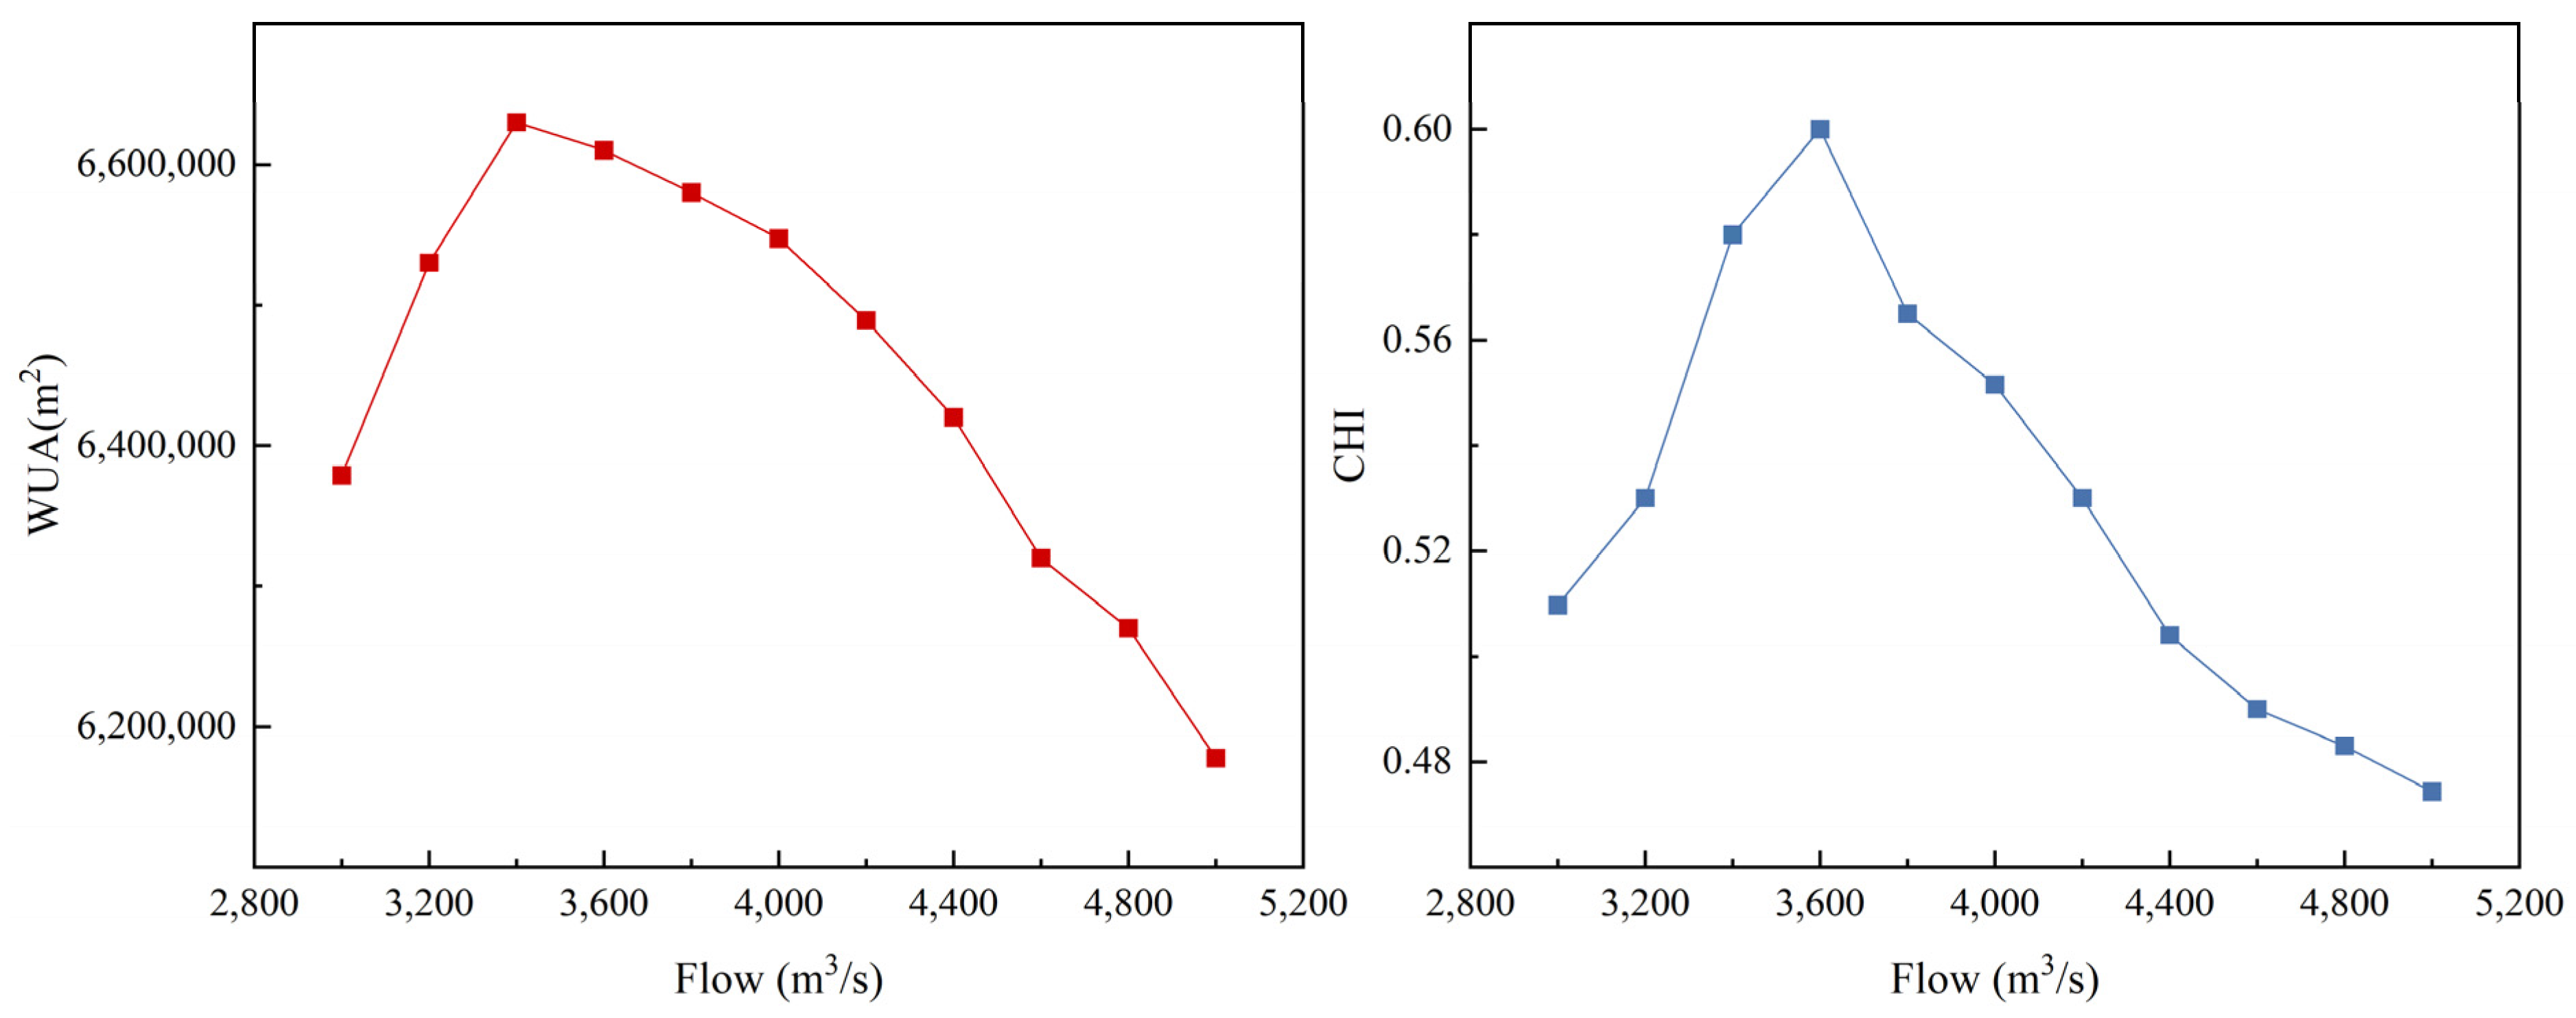
Based on the historical flow records from the Xiangjiaba Hydrological Station, a range of 13 flow scenarios was established, spanning from 1000 to 13,000 m3/s with intervals of 1000 m3/s. Utilizing the curves depicting the relationships between WUA, HCI, and flow, it was identified that the simulated habitat conditions are optimal when the flow is between 3000 and 5000 m3/s. Further refining the flow scenarios led to the determination of the suitable ecological flow as 3500 m3/s.

Author Contributions

Conceptualization, T.Q. and S.Y.; methodology, T.Q.; software, S.Y.; validation, S.Y. and X.Z.; formal analysis, S.Y.; investigation, S.Y.; resources, S.Y.; data curation, S.Y.; writing—original draft preparation, S.Y.; writing—review and editing, S.Y.; visualization, S.Y.; supervision, L.H.; project administration, T.Q.; funding acquisition, T.Q. All authors have read and agreed to the published version of the manuscript.

Funding

This research was funded by [the Major Science and Technology Project of the Ministry of Water Resources of the People’s Republic of China] grant number [SKS-2022033].

Data Availability Statement

No new data were created or analyzed in this study. Data sharing is not applicable to this article.

Acknowledgments

All authors agreed to publish. Special thanks are owed to editors and anonymous reviewers whose comments helped to improve the paper.

Conflicts of Interest

The authors declare no conflict of interest.

References

  1. Peng, F.; Li, K.; Liang, R.; Yang, S.; Wei, Q.; Zhao, G. Positive effect of a canal system and reservoir group on the spatial-temporal redistribution of water resources in a pinnate drainage pattern. Sci. Total Environ. 2020, 744, 140855. [Google Scholar] [CrossRef]
  2. Wu, Y.; Guo, L.; Xia, Z.; Jing, P.; Chunyu, X. Reviewing the Poyang Lake Hydraulic Project Based on Humans’ Changing Cognition of Water Conservancy Projects. Sustainability 2019, 11, 2605. [Google Scholar] [CrossRef]
  3. Smith, J.M.; Mather, M.E. Beaver dams maintain fish biodiversity by increasing habitat heterogeneity throughout a low-gradient stream network. Freshw. Biol. 2013, 58, 1523–1538. [Google Scholar] [CrossRef]
  4. Guo, C.; Chen, Y.; Gozlan, R.E.; Li, Z.; Mehner, T.; Lek, S.; Paukert, C.P. Biogeographic freshwater fish pattern legacy revealed despite rapid socio-economic changes in China. Fish Fish. 2019, 20, 857–869. [Google Scholar] [CrossRef]
  5. Yao, W.; An, R.; Yu, G.; Li, J.; Ma, X. Identifying fish ecological risk patterns based on the effects of long-term dam operation schemes. Ecol. Eng. 2021, 159, 106102. [Google Scholar] [CrossRef]
  6. Yang, G.; Bao, M.; Cong, N.; Kattel, G.; Li, Y.; Xi, Y.; Wang, Y.; Wang, Q.; Yao, W. Application of a fish habitat model to assess habitat fragmentation using high flow and sediment transport in the Rumei Dam in Lancang River (China). Ecohydrology 2023, e2583. [Google Scholar] [CrossRef]
  7. Yao, W. Stocking to offset negative effects of dam construction and balance the ecosystem. Fish. Manag. Ecol. 2023, 30, 627–647. [Google Scholar] [CrossRef]
  8. Guan, X.; Zhang, Y.; Meng, Y.; Liu, Y.; Yan, D. Study on the theories and methods of ecological flow guarantee rate index under different time scales. Sci. Total Environ. 2021, 771, 145378. [Google Scholar] [CrossRef] [PubMed]
  9. Meng, Y.; Xu, W.; Guan, X.; Guo, M.; Wang, X.; Yan, D. Ecology-habitat-flow modular simulation model for the recommendation of river ecological flow combination. Environ. Model. Softw. 2023, 169, 105823. [Google Scholar] [CrossRef]
  10. Jacobson, P.C.; Cross, T.K.; Dustin, D.L.; Duval, M. A Fish Habitat Conservation Framework for Minnesota Lakes. Fisheries 2016, 41, 302–317. [Google Scholar] [CrossRef]
  11. Spurgeon, J.; Pegg, M.; Parasiewicz, P.; Rogers, J. River-Wide Habitat Availability for Fish Habitat Guilds: Implications for In-Stream Flow Protection. Water 2019, 11, 1132. [Google Scholar] [CrossRef]
  12. Dey, C.J.; Rego, A.I.; Bradford, M.J.; Clarke, K.D.; McKercher, K.; Mochnacz, N.J.; de Paiva, A.; Ponader, K.; Robichaud, L.; Winegardner, A.K.; et al. Research priorities for the management of freshwater fish habitat in Canada. Can. J. Fish. Aquat. Sci. 2021, 78, 1744–1754. [Google Scholar] [CrossRef]
  13. Mao, X. Review of fishway research in China. Ecol. Eng. 2018, 115, 91–95. [Google Scholar] [CrossRef]
  14. Yang, X.; Zhang, S.; Wu, C.; Zhang, R.; Zhou, Y. Ecological and navigational impact of the construction and operation of the Qingyuan dam. Ecol. Indic. 2023, 154, 110563. [Google Scholar] [CrossRef]
  15. Quan, Q.; Gao, S.; Shang, Y.; Wang, B. Assessment of the sustainability of Gymnocypris eckloni habitat under river damming in the source region of the Yellow River. Sci. Total Environ. 2021, 778, 146312. [Google Scholar] [CrossRef] [PubMed]
  16. Wang, P.; Shen, Y.; Wang, C.; Hou, J.; Qian, J.; Yu, Y.; Kong, N. An improved habitat model to evaluate the impact of water conservancy projects on Chinese sturgeon (Acipenser sinensis) spawning sites in the Yangtze River, China. Ecol. Eng. 2017, 104, 165–176. [Google Scholar] [CrossRef]
  17. Liu, S.; Luo, W.; Ge, L.; Wang, Y. An evaluation method for the priority protection of fishes based on multiple ecological dimensions. J. Freshw. Ecol. 2023, 38, 2144956. [Google Scholar] [CrossRef]
  18. Yang, S.; Zhang, Z.; Wang, Y.; Liang, R.; Wan, Y.; Li, K. An improved 3D fish habitat assessment model based on the graph theory algorithm. Ecol. Indic. 2023, 148, 110022. [Google Scholar] [CrossRef]
  19. Valavanis, V.D.; Pierce, G.J.; Zuur, A.F.; Palialexis, A.; Saveliev, A.; Katara, I.; Wang, J. Modelling of essential fish habitat based on remote sensing, spatial analysis and GIS. Hydrobiologia 2008, 612, 5–20. [Google Scholar] [CrossRef]
  20. Baranya, S.; Fleit, G.; Jozsa, J.; Szaloky, Z.; Toth, B.; Czegledi, I.; Eros, T. Habitat mapping of riverine fish by means of hydromorphological tools. Ecohydrology 2018, 11, e2009. [Google Scholar] [CrossRef]
  21. Petesse, M.L.; Petrere, M., Jr. Tendency towards homogenization in fish assemblages in the cascade reservoir system of the Tiete river basin, Brazil. Ecol. Eng. 2012, 48, 109–116. [Google Scholar] [CrossRef]
  22. Poff, N.L.; Matthews, J.H. Environmental flows in the Anthropocence: Past progress and future prospects. Curr. Opin. Environ. Sustain. 2013, 5, 667–675. [Google Scholar] [CrossRef]
  23. Fu, Y.; Leng, J.; Zhao, J.; Na, Y.; Zou, Y.; Yu, B.; Fu, G.; Wu, W. Quantitative calculation and optimized applications of ecological flow based on nature-based solutions. J. Hydrol. 2021, 598, 126216. [Google Scholar] [CrossRef]
  24. Liu, C.; Men, B. An ecological hydraulic radius approach to estimate the instream ecological water requirement. Prog. Nat. Sci.-Mater. Int. 2007, 17, 320–327. [Google Scholar]
  25. Wang, H.; Wang, H.; Hao, Z.; Wang, X.; Liu, M.; Wang, Y. Multi-Objective Assessment of the Ecological Flow Requirement in the Upper Yangtze National Nature Reserve in China Using PHABSIM. Water 2018, 10, 326. [Google Scholar] [CrossRef]
  26. Tharme, R.E. A global perspective on environmental flow assessment: Emerging trends in the development and application of environmental flow methodologies for rivers. River Res. Appl. 2003, 19, 397–441. [Google Scholar] [CrossRef]
  27. Hu, W.; Gu, W.; Miao, D.; Shao, D. Research on the Ecological Flow and Water Replenishment Thresholds for Diversion Rivers Based on the MC-LOR Algorithm. Water Resour. Manag. 2022, 36, 5353–5369. [Google Scholar] [CrossRef]
  28. Mao, Y.; Huang, J.; Li, R.; Huang, W.; Wang, Q.; Feng, J. Optimal reservoir operation based on hydrological and hydraulic methods incorporating the multiple water replenishment process. J. Clean. Prod. 2020, 276, 124154. [Google Scholar] [CrossRef]
  29. Kumar, A.U.; Jayakumar, K.V. Modelling of environmental flow requirements using hydraulic and habitation models. Ecol. Indic. 2021, 121, 107046. [Google Scholar] [CrossRef]
  30. Hough, I.M.; Warren, P.H.; Shucksmith, J.D. Designing an environmental flow framework for impounded river systems through modelling of invertebrate habitat quality. Ecol. Indic. 2019, 106, 105445. [Google Scholar] [CrossRef]
  31. Nagaya, T.; Shiraishi, Y.; Onitsuka, K.; Higashino, M.; Takami, T.; Otsuka, N.; Akiyama, J.; Ozeki, H. Evaluation of suitable hydraulic conditions for spawning of ayu with horizontal 2D numerical simulation and PHABSIM. Ecol. Model. 2008, 215, 133–143. [Google Scholar] [CrossRef]
  32. Johnson, J.A.; Sivakumar, K.; Rosenfeld, J. Ecological flow requirement for fishes of Godavari river: Flow estimation using the PHABSIM method. Curr. Sci. 2017, 113, 2187–2193. [Google Scholar] [CrossRef]
  33. Liu, Q.; Zhang, P.; Cheng, B.; Li, Y.; Li, J.; Zhou, H.; Sun, G.; Qing, J.; Zhu, Z.; Lu, Y.; et al. Incorporating the life stages of fish into habitat assessment frameworks: A case study in the Baihetan Reservoir. J. Environ. Manag. 2021, 299, 113663. [Google Scholar] [CrossRef]
  34. Yang, Z.; Zhang, P.; Tang, H.; Gong, Y.; Dong, C.; Chen, X.; Zhao, N. The formation of habitat suitability curves for Coreius guichenoti (Sauvage & Dabry de Thiersant, 1874) of the lower Jinsha River. Ecol. Sci. 2017, 36, 129–137. [Google Scholar]
  35. Zhang, P.; Qiao, Y.; Schineider, M.; Chang, J.; Mutzner, R.; Fluixa-Sanmartin, J.; Yang, Z.; Fu, R.; Chen, X.; Cai, L.; et al. Using a hierarchical model framework to assess climate change and hydropower operation impacts on the habitat of an imperiled fish in the Jinsha River, China. Sci. Total Environ. 2019, 646, 1624–1638. [Google Scholar] [CrossRef]
  36. Vilizzi, L.; Copp, G.H.; Roussel, J.M. Assessing variation in suitability curves and electivity profiles in temporal studies of fish habitat use. River Res. Appl. 2004, 20, 605–618. [Google Scholar] [CrossRef]
  37. Stefunkova, Z.; Macura, V.; Skrinar, A.; Majorosova, M.; Dolakova, G.; Halaj, P.; Petrova, T. Evaluation of the Methodology to Assess the Influence of Hydraulic Characteristics on Habitat Quality. Water 2020, 12, 1131. [Google Scholar] [CrossRef]
  38. Zhang, P.; Li, K.-F.; Wu, Y.-L.; Liu, Q.-Y.; Zhao, P.-X.; Li, Y. Analysis and restoration of an ecological flow regime during the Coreius guichenoti spawning period. Ecol. Eng. 2018, 123, 74–85. [Google Scholar] [CrossRef]
Figure 1. Location of the Jinsha River and study reach.
Water 16 00569 g001
Figure 2. The diagram elucidating the procedural framework in this study.
Water 16 00569 g002
Figure 3. The results of the model validation at Xiangjiaba hydrological station.
Water 16 00569 g003
Figure 4. Suitability index curve of water velocity and depth for Coreius guichenoti in the lower Jinsha River.
Water 16 00569 g004
Figure 5. Runoff during the spawning phase across the three periods.
Water 16 00569 g005
Figure 6. WUA and HCI during the spawning phase across the three phases.
Water 16 00569 g006
Figure 7. Combined suitability factor (CSF) of Coreius guichenoti for natural (a), construction (b), and operation (c) periods in late June.
Water 16 00569 g007
Figure 8. Relationships between WUA, HCI and flow across the distinct flows of 1000–13000 m3/s.
Water 16 00569 g008
Figure 9. Relationships between WUA, HCI and flow across the distinct flows of 3000–5000 m3/s.
Water 16 00569 g009
Disclaimer/Publisher’s Note: The statements, opinions and data contained in all publications are solely those of the individual author(s) and contributor(s) and not of MDPI and/or the editor(s). MDPI and/or the editor(s) disclaim responsibility for any injury to people or property resulting from any ideas, methods, instructions or products referred to in the content.

