Article

Optimizing Multi-Scenario Water Resource Allocation in Reservoirs Considering Trade-Offs between Water Demand and Ecosystem Services

1
School of Business, Hohai University, Nanjing 210098, China
2
School of Business, Jiangsu Open University, Nanjing 214257, China
3
School of Atmospheric Sciences, Nanjing University, Nanjing 210023, China
*
Author to whom correspondence should be addressed.
Water 2024, 16(4), 563; https://doi.org/10.3390/w16040563
Submission received: 23 January 2024 / Revised: 5 February 2024 / Accepted: 9 February 2024 / Published: 13 February 2024
(This article belongs to the Special Issue Water Sustainability and High-Quality Economic Development)

Abstract

:
Reservoir engineering plays a critical role in achieving rational water resource allocation, providing ecological services, and promoting regional development. However, in the formulation of water allocation plans, there is often a tendency to prioritize meeting regional water demand while overlooking ecological benefits. This study develops a multi-objective water allocation model based on evaluating ecosystem services value supply and demand, integrating indicators such as ecosystem service fulfillment ability, water resources fulfillment ability, and equilibrium operation degree. Different development scenarios are also established using a forecasting model to formulate water allocation plans and apply a case study of the Datun Reservoir, a key hub on the eastern route of the South-to-North Water Diversion Project in China. This study demonstrates that (1) by optimizing the allocation of domestic and industrial water supply and reservoir storage, the overall ecosystem service value of the Datun Reservoir can be enhanced by 5.15% to 11.36% and (2) in scenarios of high economic growth, there is potential to achieve coordination between water supply and ecosystem service value. (3) However, lower-than-expected economic growth may lead to a trade-off between ecosystem services and water supply capacity in the reservoir, which could be maintained at a lower level. The methods proposed in this paper are of significant practical importance for guiding rational reservoir water allocation and achieving coordination between ecological services and water supply capacity.

1. Introduction

Water resources are an integral part of natural ecology and essential resources for the sustainable development of human society. Humans need an adequate supply of water to meet basic needs such as drinking, sanitation, and washing [1,2]. Agricultural irrigation is crucial for ensuring food production and the supply of agricultural products [3]. Water resources are also part of the material supply of natural ecosystem services, thus influencing human well-being [4]. Ecosystem services (ESs) encompass a range of resources and environmental processes that nature offers to human society, such as water supply, solid recycling, etc. [5,6,7]. Water resources (WRs) comprise an essential component supporting ecosystem services. For instance, the creation and preservation of wetlands and the propagation and stability of aquatic organisms are linked to water resources [8]. Wetlands have important functions such as water purification, flood prevention, and maintaining hydrological balance [9]. Aquatic ecosystems, such as lakes and rivers, provide numerous species and resources, maintaining the ecological balance of food chains. At the same time, aquatic species directly or indirectly provide ecosystem services such as food, medicine, and raw materials to humans. Furthermore, the development of many tourism industries is closely related to water resources and ecosystem services as the attractiveness of water resource attractions such as lakes, beaches, and hot springs impacts the development and economic benefits of the tourism industry [10]. Water resources and ecosystem services exert substantial influence on socioeconomic development and human welfare [11]. The abundance or scarcity of water resources affects the development and expansion of economic activities. Adequate water resources can meet human domestic and agricultural irrigation needs while providing a sustainable and stable source of funding for ecosystems, maintaining ecological balance, and ensuring the health of ecosystem services [12,13]. To achieve sustainable economic and social development for humanity, the preservation and judicious utilization of water resources serve as effective facilitators.
Reservoirs, as a type of water engineering, are essential means for achieving rational water allocation and the spatial optimization of water resources [6]. They bear the important mission of ensuring the safe use of water in regions. Moreover, reservoirs are typical artificial ecosystems, possessing functions such as maintaining wetland ecological stability and protecting biodiversity [14]. Therefore, achieving scientifically optimized reservoir management facilitates the efficient use of water resources and enhances their ability to provide ecosystem services to specific regions [15]. Water resources management and optimization involve the scientific and reasonable management and distribution of reservoir storage and discharge to meet human needs and ensure sustainable socioeconomic development. For water resource management in reservoirs, incorporating the improvement and optimization of ecosystem service effects into the measurement framework not only contributes to the sustainable use of water resources but also takes into account the maintenance of regional ecological homeostasis [16]. The processes of reservoir storage and discharge can affect riverine ecosystems, affecting ecosystem services such as aquatic biodiversity, wetland protection, and water quality improvement [17]. Thus, in reservoir water resources management, the ecological needs of riverine ecosystems should be considered under the premise of ensuring human water resource needs. Rational reservoir storage and discharge plans should be developed to minimize adverse effects on ecosystems [18]. Secondly, there is also an inherent need for reservoir management agencies to realize the ecological service potential of each project as much as possible with the help of the scientific allocation of water resources [19]. Configuration options should maximize ecosystem service provisioning while meeting the needs of different regions and stakeholders, thereby contributing to sustainable socioeconomic development [20]. Furthermore, it is imperative to implement long-term water resource planning and comprehensive management to make scientifically sound predictions and adjustments to reservoir water quantity, thereby addressing future challenges related to water resources.
To ensure that reservoir water allocation schemes meet regional water demand while also considering the effect of ecosystem services, this study conducted the following research from the standpoint of balancing supply and demand: (1) referring to the ecosystem services theory framework, a model for assessing the service value of plain reservoirs was proposed, integrating various methods such as shadow engineering and willingness to pay; (2) a water resources multi-objective optimization model was constructed, including indicators such as the index of ES meeting (ESI) and the index of WR meeting (WSI) and their coordination degree (WED); (3) the ARIMA time series forecasting model was applied to set multiple external scenarios for reservoir water quantity management, exploring water allocation schemes under changing economic growth rates and scenarios of improved societal water use efficiency; and (4) finally, using the Datun Reservoir, a key hub of the water transfer project along the northern part of Shandong Province, part of the South-to-North Water Diversion East Route Project in China, as an actual case, the model was applied.

2. Materials and Methods

2.1. Ecosystem Service Supply and Demand Relationship

2.1.1. Calculation of Ecosystem Service Functions and Values of Reservoirs

Reservoirs in water transfer projects provide WRs to the regions along their routes to support economic production and residential life. They are also crucial to maintaining the water abundance of water systems along their routes and purifying water quality [21,22]. Some reservoirs also have the function of providing ecological replenishment to regional ecosystems, such as wetlands and swamps [23]. The development of scenic water areas also provides recreational facilities for residents, and some large reservoirs have been transformed into tourist attractions, bringing significant tourism benefits to the region [15,16]. This study categorizes ecosystem services following the classification framework of Pahl-Wostl et al. [24] and Zhao et al. [25] into regulation, provision, support, and cultural services. Based on the engineering characteristics of reservoirs and referring to the research of Safaei et al. [26] and Sun et al. [27], this study summarizes a total of five sub-services that reservoirs may provide.
Drawing from existing research on various ecosystem service valuation methods, this study combines various accounting methods, including the market value method [28], shadow engineering method [29], and the willingness-to-pay method [30], to determine reservoirs’ ecosystem service values (ESVs). The calculation methods for each service function are presented in Table 1.

2.1.2. The Index of Ecosystem Service Meeting

The index of ES meeting (ESI) is used as an indicator to quantify the relationship between regional demand and a reservoir’s contribution. In the following calculation process, the ESS represents the value of ecosystem services provided by the reservoir, which is the sum of the values of various service functions. The ESD represents the region’s ES demand.
E S I = E S S E S D
The ecosystem service supply (ESS) of a reservoir comprises the service values provided by various service functions, and the calculation process is as shown in Formula (2).
E S S = V R S + V S S + V P S + V C S
In the above formula, V R S , V S S , V P S ,   and   V C S refer to the values of regulation, supporting, provisioning, and cultural services. These values are calculated by summing the results of the corresponding sub-service functions.
The ESD refers to human preferences for the services provided by ecosystems and is often described using broader socioeconomic characteristics to express the demand for ESs. Drawing on the research results of Wang et al. [31], the ESD is calculated using economic density ( E j , in billions of CNY/km2), population density ( H j , in people/km2), and land development level ( D j ). The formula for calculating ecosystem service demand is as follows:
E S D = D j × l n E j × l n H j
Table 1. Methods of calculating reservoirs’ ESVs.
ES TypesMethodsAccounting Models
Regulation servicesFlood
regulation
Shadow
project
V F R = Q M Q C × C F R
Q M : the reservoir’s ultimate storage capacity (m3);
Q C : the reservoir’s actual storage capacity (m3);
C F R : the cost of average flood storage (CNY/m3),
the value is 0.67 in this paper concerning Qi et al. [32].
Supporting servicesCarbon sequestration and
oxygen release
Industrial
generation
V C R = V C S + V O R
V C S : the service value of sequestering carbon;
V O R : the service value of releasing oxygen.
V C S = Q C S × P C O 2
P C O 2 :   the   unit   market   value   of   C O 2 (CNY/t), 1242;
Q C S :   the   total   C O 2 sequestered in plain reservoir(t).
V O R = Q O R × P O 2
P O 2 :   the   unit   industrial   O 2   cost (CNY/t), 400;
Q O R : the amount of oxygen released from the reservoir(t).
Q C S = M C O 2 / M C × S × Q C
S :   the   rate   of   water   absorbing   C O 2   ( t C O 2 m 2 / m 3 );
M C O 2 / M C :   the   conversion   ratio   of   C   to   C O 2 , 44/12.
Q O R = M O 2 / M C O 2 × Q C S
M O 2 / M C O 2 :   the   conversion   ratio   of     C O 2   to   O 2 , 32/12.
Water storageMarket
value
V W T = P W T × Q C
P W T : the unit water storage value, 0.611(CNY/m3),
referring to Jia et al. [33].
Provision servicesWater supplyShadow
project
V W S = P W i Q W i
P W i : the shadow price of various types of water supply;
Q W i : the amount of each type of water supply (m3); i = 1,2,3, and 4 indicate the types of water supply, divided into industrial, agricultural, domestic, and ecological water.
Cultural
services
Social education and scientific
research
Willingness
to pay
V E D = N × R × δ
N : the population of the service area;
R : the per capita disposable income of the service area (CNY);
δ : the proportion of disposable income that residents are willing to pay (%).

2.2. Water Resource Supply and Demand Relationship

Similarly, by creating an index of water resource meeting (WSI), the WR supply and demand relationship between the reservoir and the region can be reflected.
W S I = W S S W S D W S S = i = 1 n Q W i W S D = j = 1 m W U j × N j
In Formula (4), the WSS represents the amount of water resources provided by the reservoir to the region, while the WSD represents the region’s water demand. Q W i represents the water provided by the reservoir, W U j is the annual per capita water use in a region j (m3/person), and N j is the total population of region j for the current year.

2.3. Synergy between ES and WR Supply and Demand

The primary function of a reservoir is to ensure the water security of a region while also providing substantial ecosystem services for the well-being of the local community. Achieving a coordinated and harmonious relationship between these two aspects is important for realizing sustainable management [34]. So, to reflect the coordination relationship between WR and ES supply and demand for reservoirs, a coupling coordination model was used as follows:
W E D = M × N M = 2 × W S I E S I W S I + E S I 2 1 2 N = α W S I + β E S I
The WED represents the coordination degree between the WSI and ESI. M refers to the coupling degree, for which N reflects the comprehensive coordination; α and β   are both 0.5.

2.4. Water Optimization Allocation Model

2.4.1. Objective Function

The objective of the water optimization allocation model in this study is to maximize the ESI, WSI, and the level of synergy between the ES supply and WR supply for a reservoir serving an area. So, the model’s objective function contains three parts and is constructed as follows:
F = max   ( E S I , W S I , W E D )

2.4.2. Constraints

A reservoirs’ supply of WRs and ESs to a region is influenced by its design parameters. Constraints in the planning model are set based on aspects related to the accounting of ES and WR supply and demand, such as storage capacity, water diversion, and water supply capacity.
(1) Constraint on storage capacity:
C m i n Q C C m a x
In the above formula, C m i n and C m a x represent the dead storage capacity and maximum storage capacity of the reservoir, respectively. Q C stands for the actual storage capacity based on the annual records of the reservoir management authorities.
(2) Constraint on water supply capacity:
i = 1 n Q W i W S m a x i = 1 n Q W i / W S D γ m i n i = 1 n Q W i Q D
In the above equation, W S m a x represents the maximum annual water supply designed for the reservoir, the minimum water supply reliability designed for the reservoir, and Q D   stands for the water diversion.
(3) Realistic constraint:
All variables in this study are non-negative constants.

2.4.3. Model Solution

There are three maximization-form objectives (ESI, WSI, and WSD) that comprise the optimization aim of the multi-objective optimization model in this paper. To obtain the model’s results, a mature multi-objective optimization (NSGA-II) was used after setting the variables. The NSGA-II can accelerate the optimization speed and achieve good results by using a crowding distance comparison as the criterion for comparing individuals in a population [35,36]. This algorithm is commonly applied in studies addressing the allocation of multi-type water consumption in a region.

2.5. Data Prediction and Scenario Setting

Optimally configuring the ecosystem services and water resources of a reservoir requires a thorough consideration of the development status of the region’s economic and social systems. In this study, by constructing a multi-scenario prediction model, various time series variables and reservoir evaporation in the service area of the reservoir project were predicted. Multiple development scenarios were set to further simulate reservoir water allocation plans for the future.

2.5.1. ARIMA Prediction Model

Population, GDP, and other economic statistical data in a region often exhibit characteristics of stable time series data. Therefore, when conducting long-term studies on such issues, time series forecasting methods are commonly used to predict future changes. The Autoregressive Integrated Moving Average Model (ARIMA) is a mature method in time series forecasting [37]. This study utilized the ARIMA model to forecast changes in social and economic statistical data such as population, GDP, and industrial and agricultural water consumption, etc. The basic model is as follows:
d Y t = μ + i = 1 m φ i d Y t + j = 1 n θ j ε t 1
In Equation (9), Y t represents the original time series data, d Y t is the time series obtained after differencing d times, μ represents the residual, m   is the autoregressive order, n is the moving average order, φ i i = 1,2 , , m   a n d   θ j j = 1,2 , , n   represent the model parameters, and   ε t 1 is the white noise error sequence.
The root mean square error (RMSE) was used as an indicator to measure the fit of the model and ensure the accuracy of the forecasted results. The following shows the calculation process:
R 2 = 1 T T ^ t 2 / T T ¯ t 2 R M S E = i = 1 k T t T ^ t 2 k
In the equation, T t represents the original data sequence, T ^ t represents the predicted data sequence, and   T ¯ t represents the mean value of the predicted data sequence. The closer R 2 is to 1, the better the prediction result, and the smaller the RMSE, the higher the prediction accuracy.

2.5.2. Scenario Setting

Various factors, including government policies and shifts in industrial structure, will impact the future economic development and utilization of water resources in a reservoir service area. Therefore, relying solely on predictive results for formulating water resource allocation plans is insufficient. In this study, based on the predictive results, various simulation scenarios were further set around economic development and societal water conservation awareness to ensure that water resource management plans by reservoir management agencies can adapt to the future development of the region.
Table 2 presents three regional development scenarios set in this study. Using the predictive results of the time series forecasting model as a baseline reference, scenarios were established for economic conditions higher or lower than predicted. Considering that regional water usage is influenced by water efficiency and technological progress, scenarios were also set for improved water efficiency. Referring to Ma et al. [38], in which 1% technological progress promotes a 0.73% improvement in water efficiency, in scenarios with improved water efficiency, the baseline prediction of total societal water usage was downwardly adjusted by 7%.

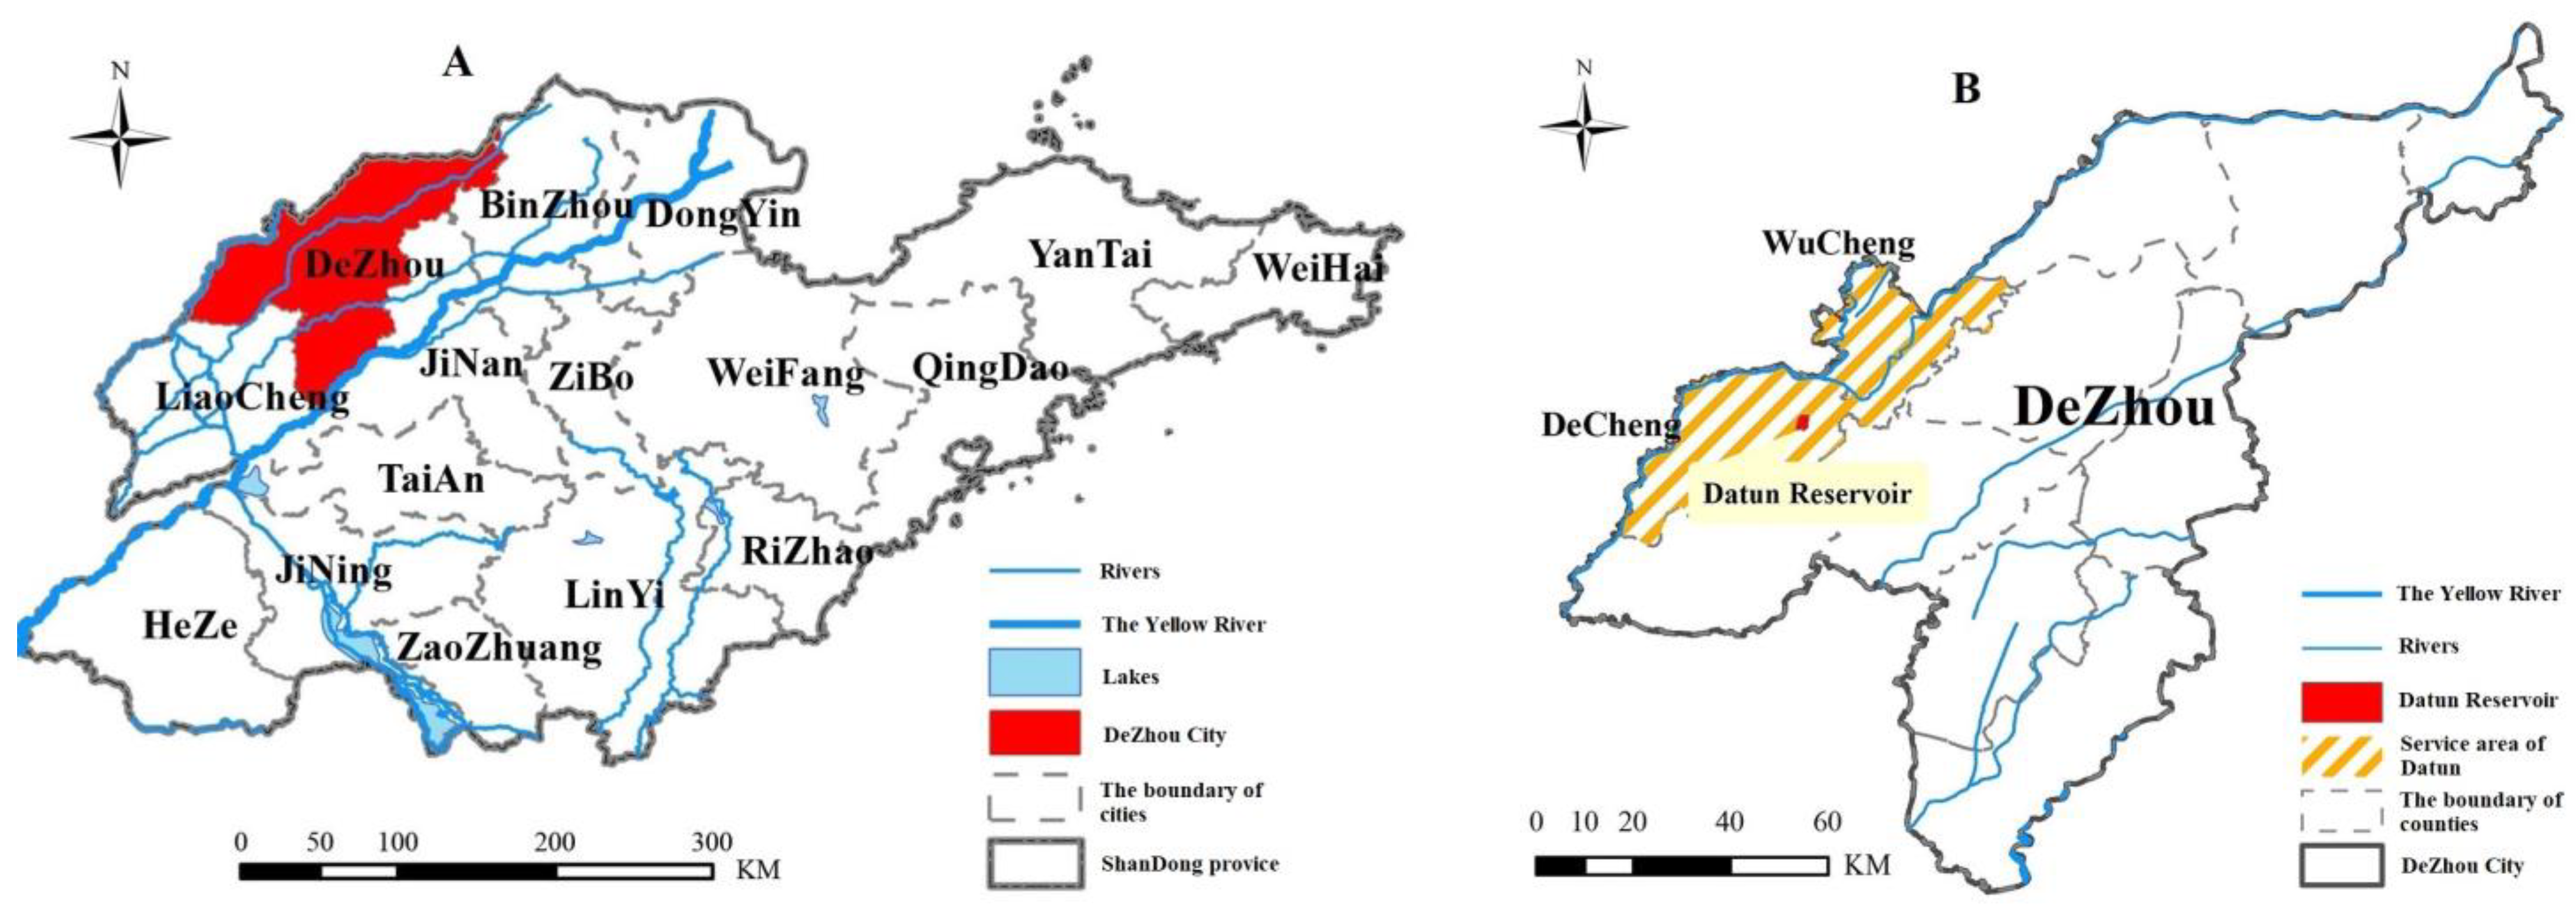
2.6. Case and Data Source

2.6.1. Case of Datun Reservoir

The Datun Reservoir is a key hub for water delivery projects in northern Shandong Province and is part of the eastern route of the South-to-North Water Diversion project in China (As shown in Figure 1). It is located on the east side of Wucheng County, Dezhou City, Shandong Prnovince. The main areas supplied are Decheng District and Wucheng County in Dezhou City. The designed reservoir water level of the Datun Reservoir is 29.80 m with a 52.09 million m3 total storage capacity; it covers a total area of 9553.04 acres and has a water surface area of up to 61 square kilometers. The total investment in the project is CNY 1,014,224.3 million. After the completion of the Datun Reservoir in 2014, it undertook the important mission of supplying industrial and domestic water for Dezhou City, relieving the local water resource load pressure significantly and playing a positive role in improving the quality of life for local people.

2.6.2. Data Resource

This study primarily utilized data encompassing economic, social, and ecological aspects relevant to the service area of the reservoir as well as engineering parameters and daily water management scheduling data for the reservoir. Statistical data comprising social, economic, and ecological data were mainly sourced from the Shandong Statistical Yearbook, Dezhou Statistical Yearbook, and Dezhou Water Resources Bulletin. The specific data for the Datun Reservoir in the actual case calculation were provided by the Datun Reservoir Management Office. These data included reservoir parameters, expansion plans, water quality monitoring data, and historical water supply volumes.

3. Results

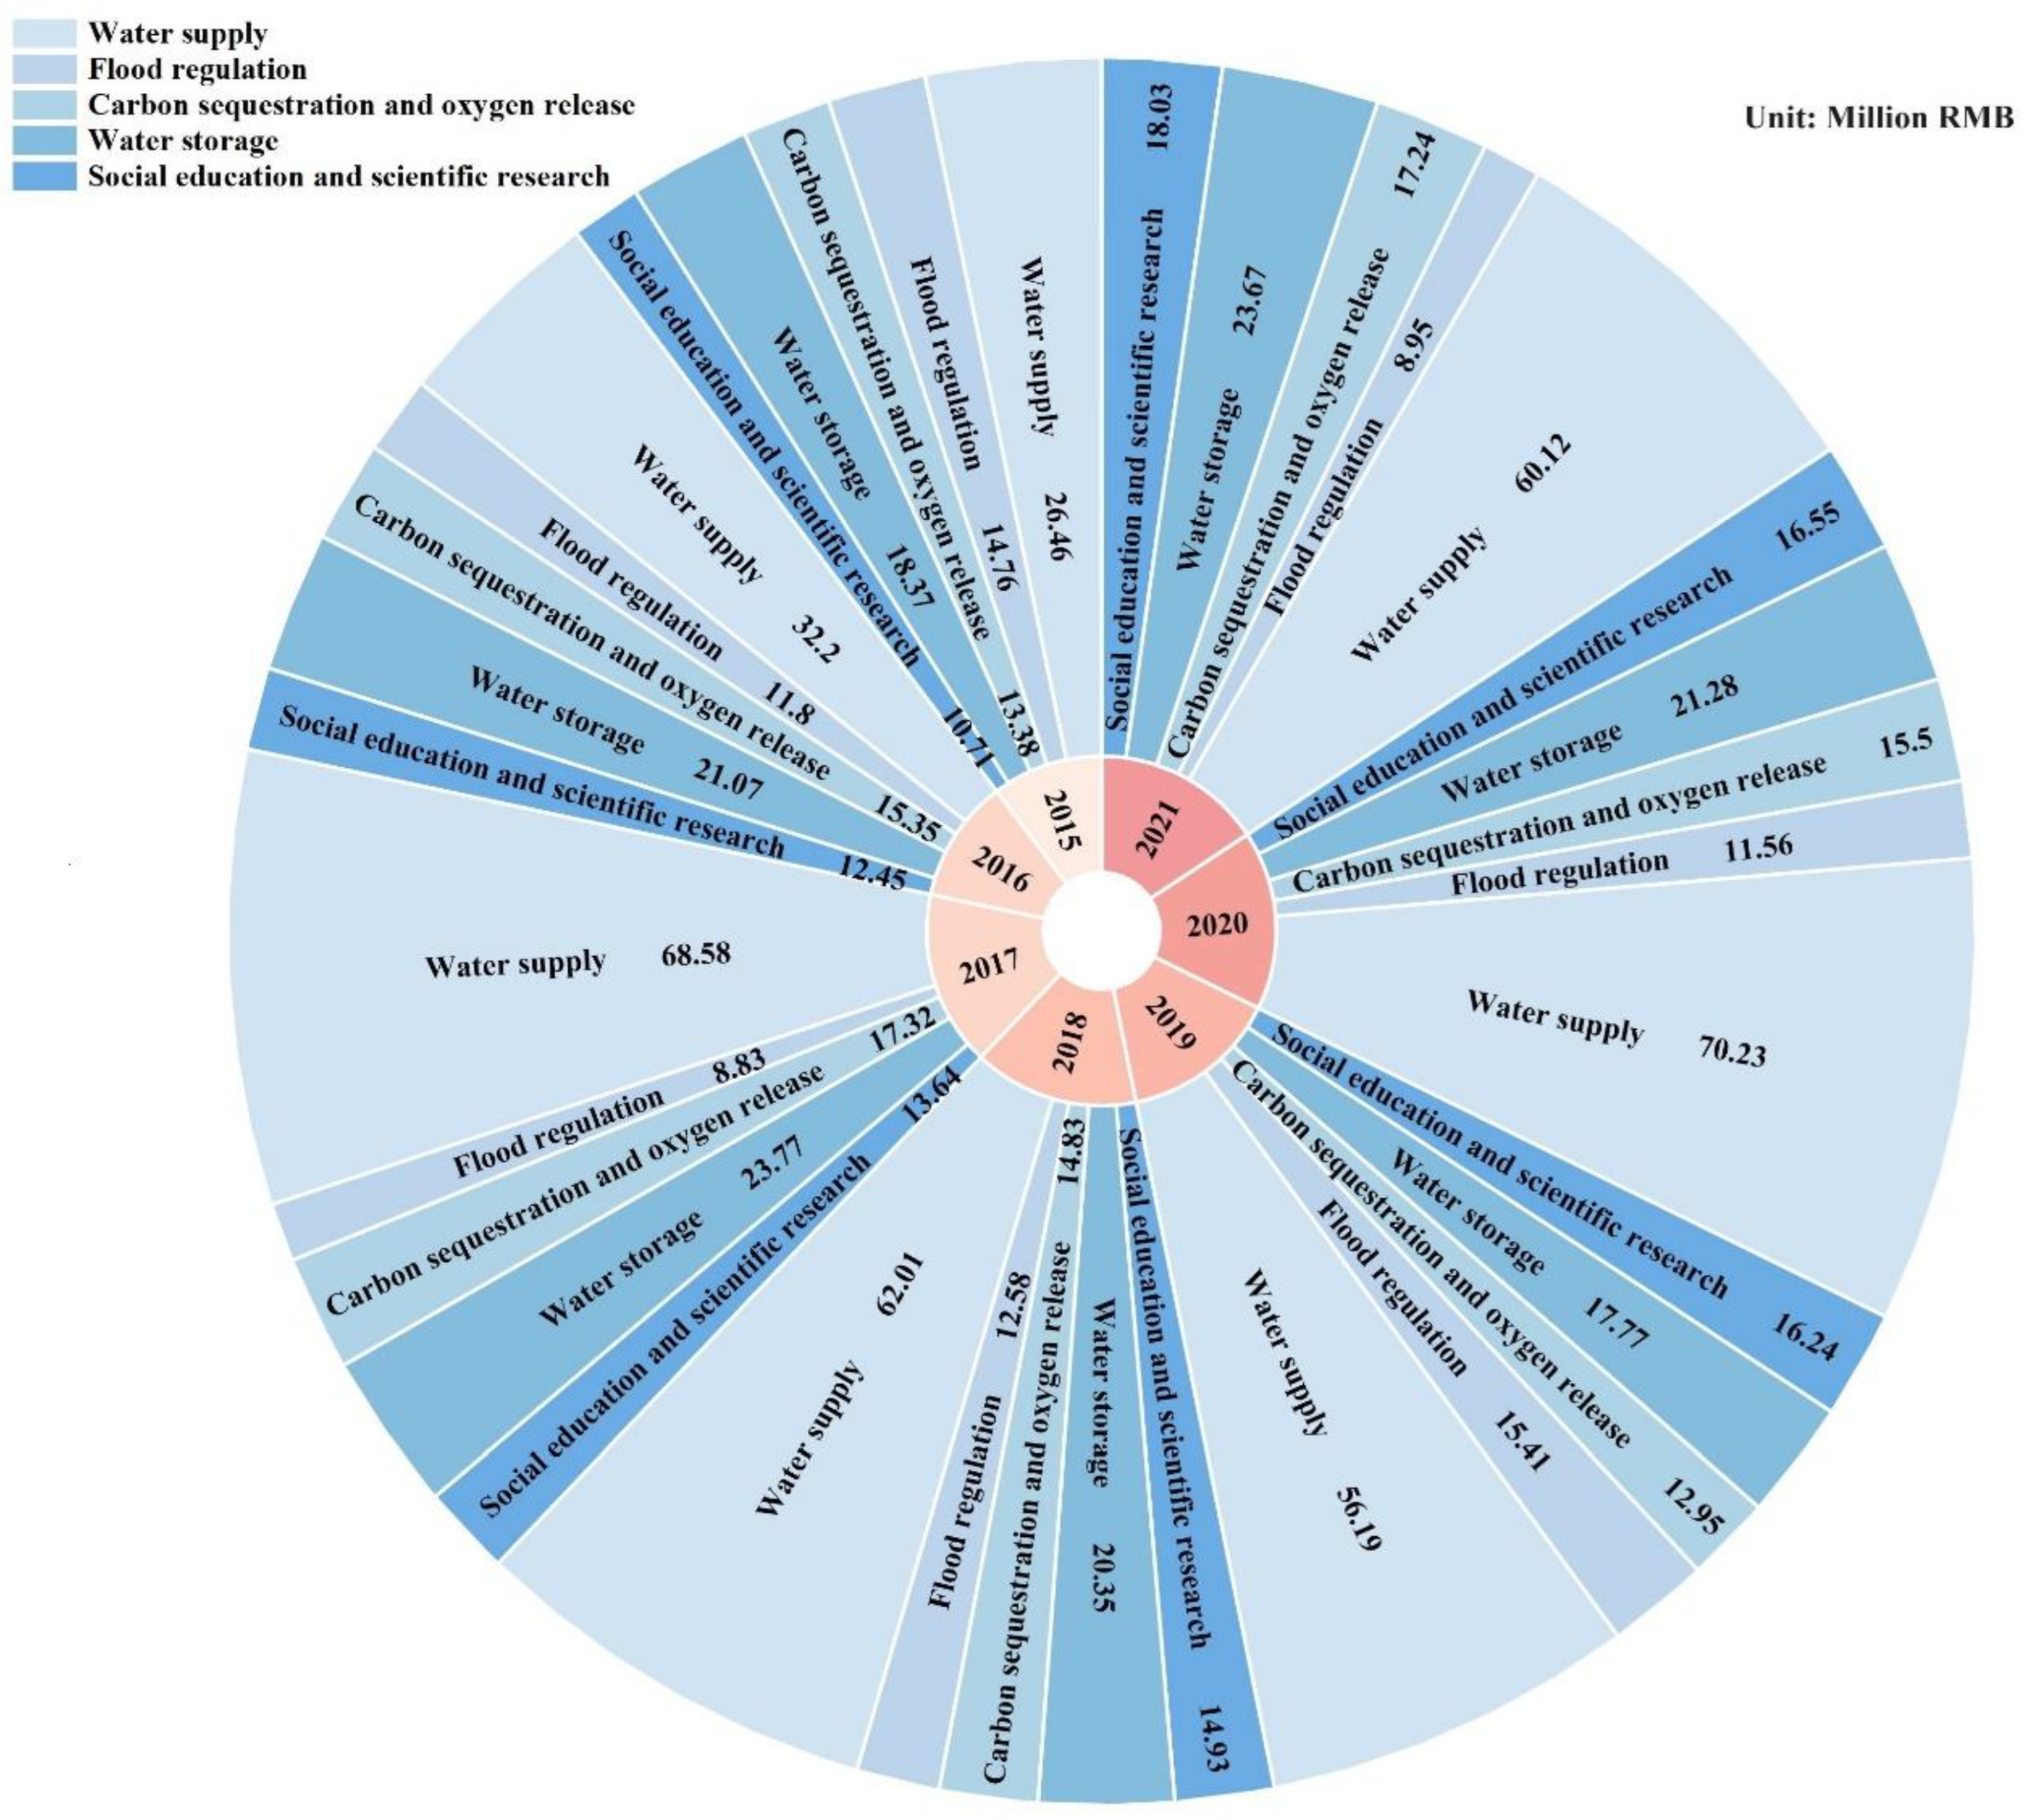
3.1. The Ecological System Service Value of the Datun Reservoir

The Datun Reservoir supplies industrial water to the Decheng District of Dezhou City and domestic water to Wucheng County. The water delivery process uses a pipe–culvert direct delivery form. Therefore, water losses such as evaporation during the water delivery process are not considered in the calculation of ESVs. Only water evaporation during the daily storage process of the reservoir is considered for calculating the value of its climate regulation service. Through field investigations and an analysis of the Datun Reservoir, it was found that the Datun Reservoir employs “fish farming for water quality” ecological aquaculture. In addition, since the Datun Reservoir is an artificially constructed plain reservoir, the main body of the project was built based on saline–alkali land restoration, mainly using a concrete construction. This paper continues the research viewpoint of Guo, Boeing, Borgomeo, Xu, and Weng [15] and argues that the reservoir does not possess the ecological functions, such as biodiversity and habitat, that natural water bodies like lakes have.
Figure 2 presents the accounting results for various ESVs for the Datun Reservoir from 2015 to 2021. The overall ecosystem service value of the reservoir was CNY 83.68 million in 2015, increasing to CNY 128.01 million by 2021. The composition of the reservoir’s regulatory, supporting, provisioning, and cultural services shows that provisioning services, particularly water supply services, dominate. In 2021, the water resource provisioning service value accounted for 46.97% of the total ESVs. This is primarily due to the main mission of such reservoir projects, which is to provide sufficient water for production and daily life in the serviced area. Water supply service value had the highest proportion in the annual ESVs, reaching CNY 70.23 million in 2020.
Additionally, water storage value is another significant component of the ecosystem service value of the project, second only to water supply service value in quantity. In 2017, the water storage service value reached its highest at CNY 23.77 million. The reservoir’s support for the regional ecosystem also includes carbon sequestration and oxygen release functions, with up to an CNY 17.24 million service value in 2021. On the cultural service front, the Datun Reservoir maintains a close collaboration with educational and research institutions in the serviced area, fulfilling social missions such as safety education and water science projects. It also serves as the base for water ecology and safety education in Dezhou City, providing a cultural service value of CNY 18.03 million in 2021.
The ESV assessment results from 2015 to 2021 highlight the importance of water supply and water storage services, which are closely related to water scheduling and management, as significant sources of the reservoir’s ecosystem service provision. So, adopting more scientific water resource scheduling and allocation schemes to achieve balance between improvements in service value and regional water supply is deemed necessary.

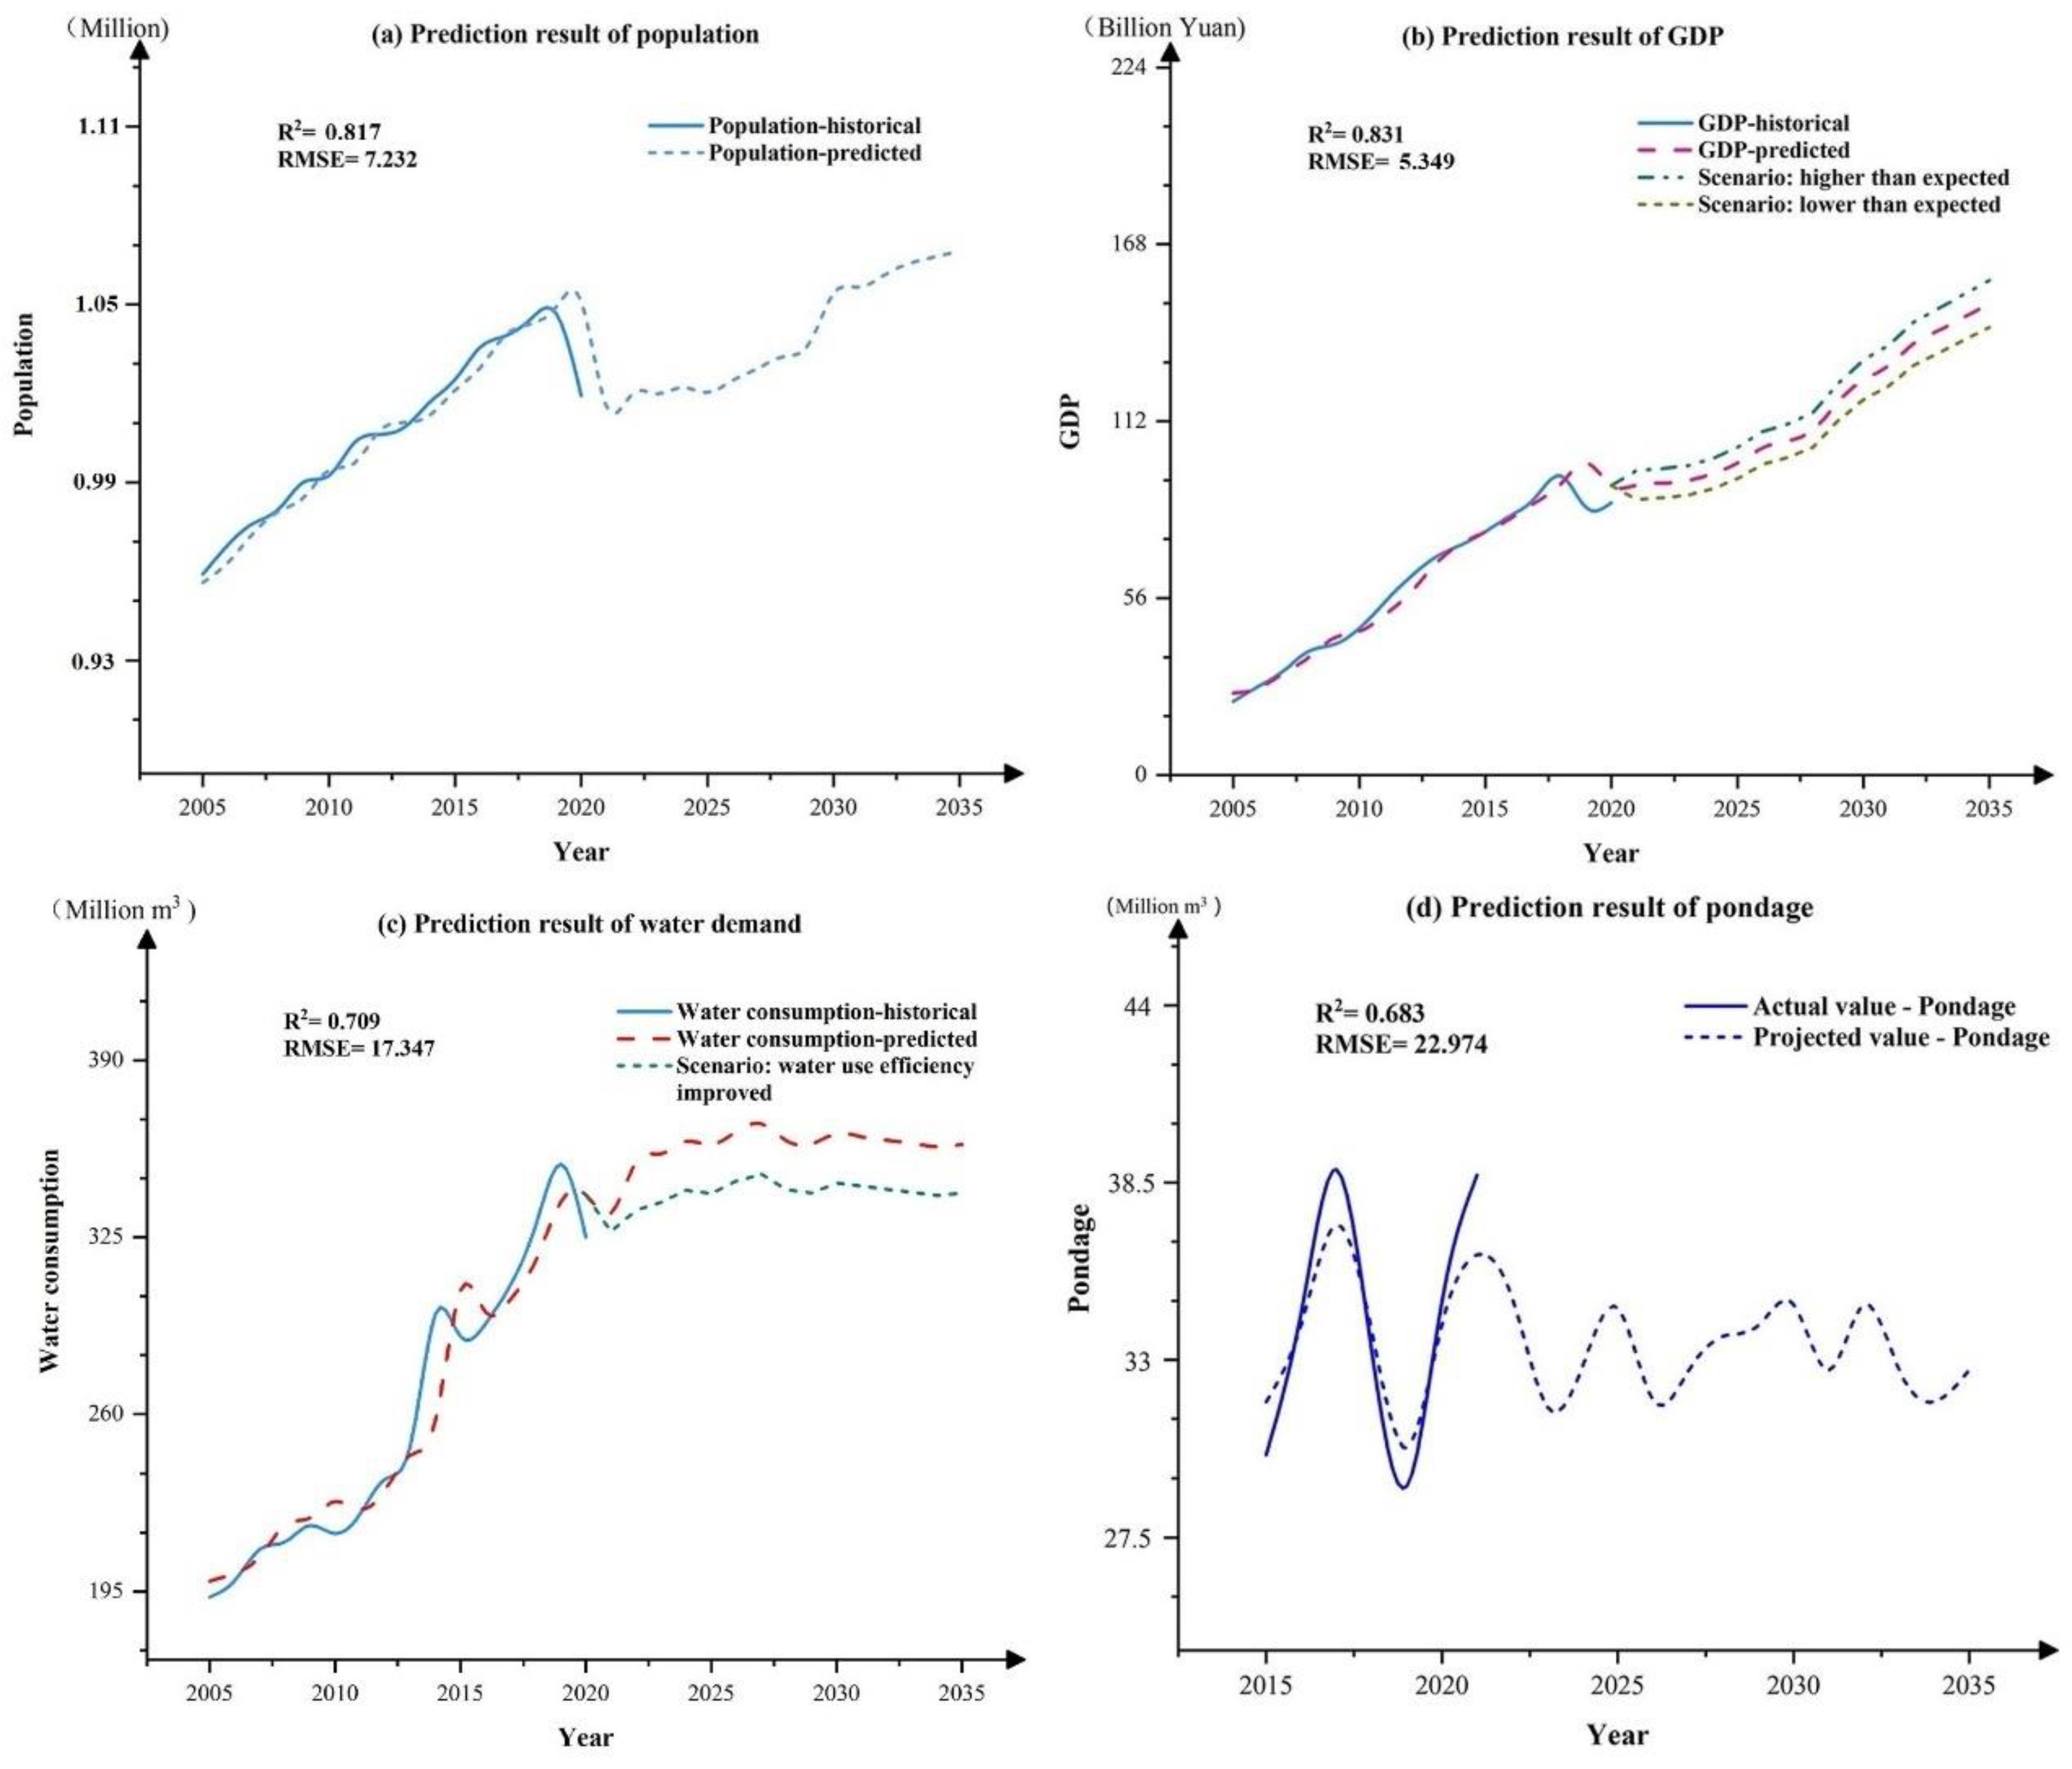
3.2. Results of ARIMA Model Prediction

This study applied the time-series-forecasting ARIMA model to predict social and economic statistical data, including population growth, GDP, and social water demand, for the Datun Reservoir service area. Additionally, historical data were used to forecast the water storage of the Datun Reservoir. These predictions served as a basis for subsequent optimization model calculations and the development of multiple scenario plans. Figure 3 presents a fitting situation between the predicted data curves and historical data for these indicators.
In Figure 3a, regarding population changes, the predicted curve maintains a good fit with historical values before 2020. The evaluation indicators R2 and RMSE are 0.817 and 7.232, respectively, indicating reasonably accurate predictions. The historical data show that population growth in the service area was relatively stable before 2020, with an annual increase of around 17,000 people. Due to a decline in population numbers in 2020, the model’s predicted curve maintains a growth trend but with a deceleration in growth rate.
In Figure 3b, the GDP forecast includes scenarios in which economic growth exceeds or falls below expectations, with adjustments of +5% and −5% applied to the predicted results. The predicted curve exhibits a good fit with historical values, and both the R2 and RMSE performance indicators are satisfactory, indicating reliable predictions. In Figure 3c, the forecast of water demand in the service area considers a scenario of improved societal water efficiency due to technological advancements. Based on conclusions about technological progress and closure efficiency from Ma, Huang, Zhang, and Tian [38], the predicted results were adjusted downwards by 7%. The overall fit between the predicted curve and historical values remains effective.
Similarly, in Figure 3d, the forecast of water storage data for the Datun Reservoir ensures the validity of the results.

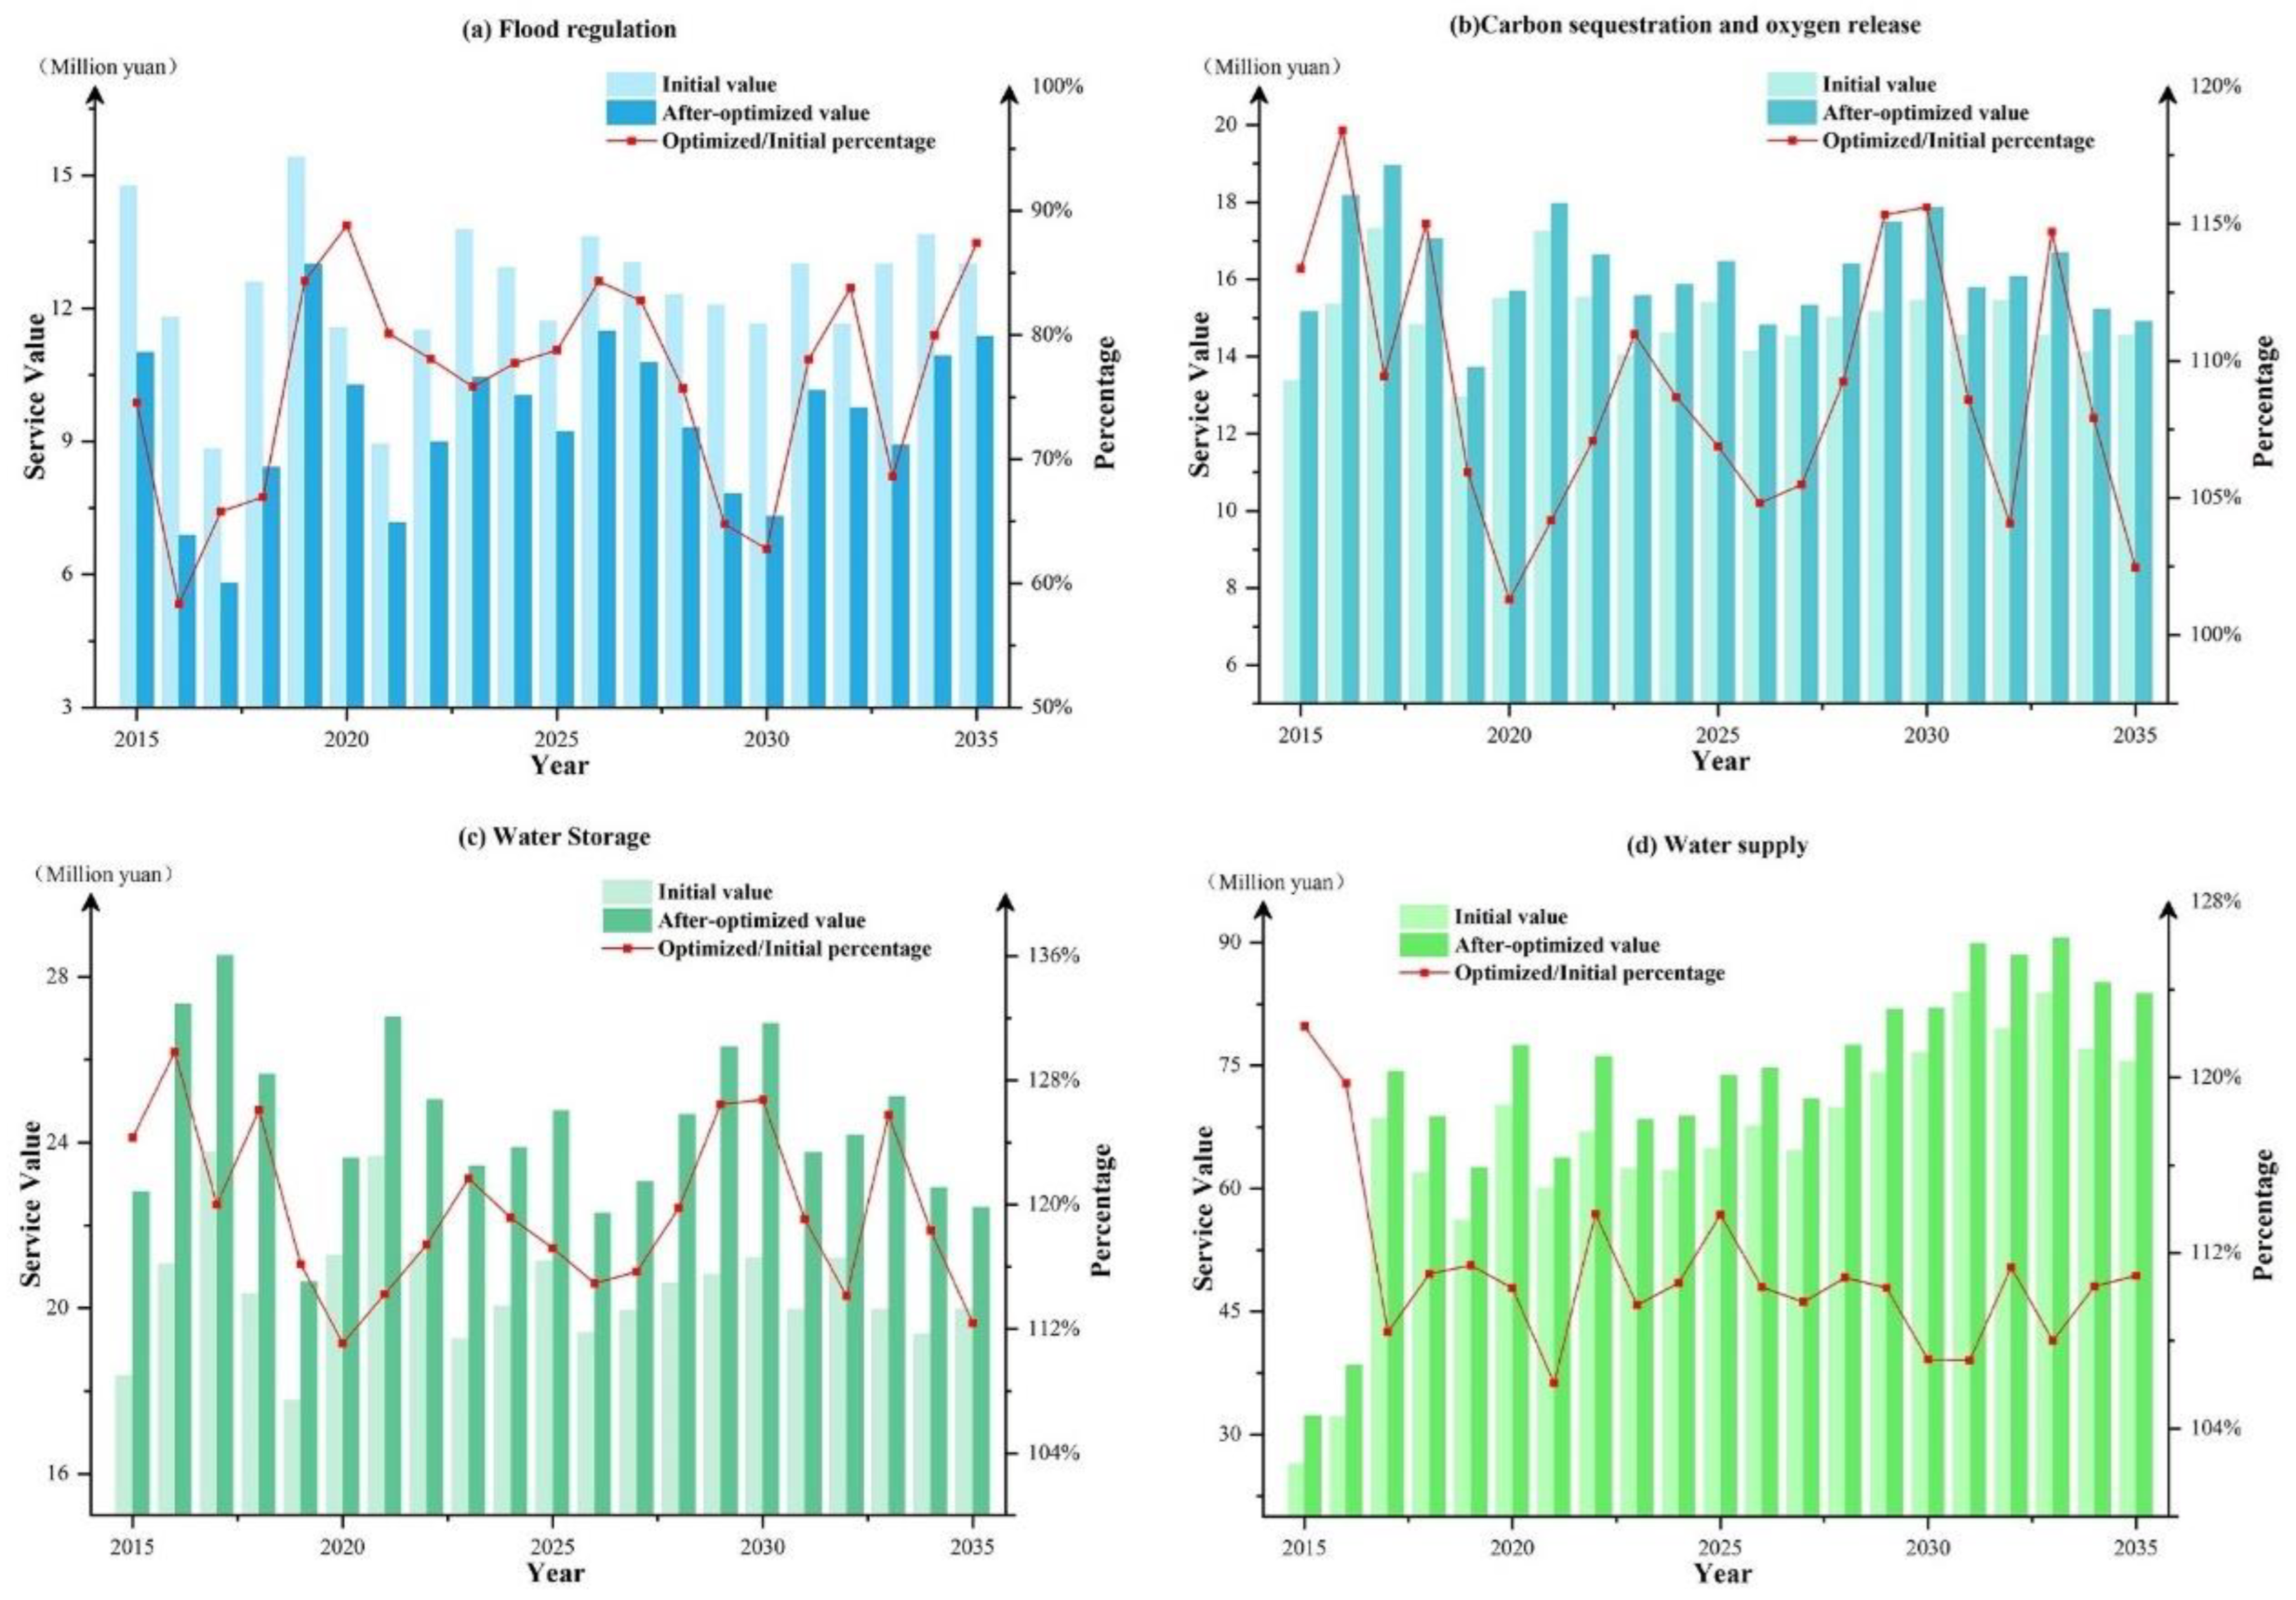
3.3. Results of Water Optional Allocation

The water-resource-related scheduling of the Datun Reservoir was optimized using the ESI, WSI, and WED as optimization objectives. As the reservoir is not responsible for agricultural irrigation tasks in the service area and does not provide direct ecological replenishment, the use of the water supply mainly includes domestic and industrial water use. Additionally, water scheduling involves reservoir storage. Table 3 presents the numerical results of the optimized water allocation for the reservoir. Comparing these results with the actual water allocation records for the reservoir from 2015 to 2021 reveals significant optimization potential within the effective design parameters of the reservoir. The existing water resource allocation scheme has not fully realized the reservoir’s potential.
In terms of domestic water supply, the optimized supply is higher than the recorded values. For the service area, the domestic water supply is primarily sourced from groundwater extraction, and the use of transfer reservoirs for the domestic water supply is still at a relatively low level, far from meeting the actual domestic water demand. Increasing the use of external pumped water is beneficial for ensuring local groundwater security and water ecosystem stability. In terms of the industrial water supply, the optimized results are also higher than the original data, indicating that the reservoir’s potential for providing industrial water for Dezhou City has not been fully exploited.
Table 4 shows the results after comparing the difference in the total ESVs provided by the reservoir before and after optimization. It can be seen that since the completion of the reservoir’s construction in 2014 and its initial operational stages in 2015 and 2016, the biggest improvements in overall ESVs after optimization were 10.05% and 11.36%, respectively. In other years, after optimization through the water allocation model, the overall service value can be improved by 5.15% to 8.57%. This indicates that the optimization model constructed in this study has practical application value for enhancing the ecological service value of reservoir projects.
The ESVs of the Datun Reservoir’s various segmented services were reassigned through the process of optimizing water resource allocation. Figure 4 displays changes in flood regulation, carbon sequestration and oxygen release, water storage, and water supply services before and after optimization.
Figure 4a shows the flood regulation service value, which experienced a significant decrease after water allocation optimization. In 2016, the value dropped to only 60% of the pre-optimization level. Figure 4b indicates that the carbon sequestration and oxygen release service value increased by 2% to 18% after optimization, with a noTable 18% growth in 2016 from CNY 15.349 million to CNY 18.173 million. Figure 4c demonstrates a substantial improvement in the water storage service value after water allocation optimization, consistently exceeding 110% of the original values. In 2016, the value increased by CNY 6.286 million. Figure 4d reflects the differences in the water supply service value before and after optimization. In 2015 and 2016, during the initial operational stages of the Datun Reservoir, domestic and industrial water supply levels were relatively low, leading to a significant gap between the actual demand in the service area and the allocated water. After optimization, the water supply service value increased to 124% and 120% of the pre-optimization levels in 2015 and 2016, respectively. The subsequent improvement in water allocation optimization remained at around 9%.
Figure 5 illustrates changes in optimization objectives, namely the ESI, WSI, and WED, before and after water allocation optimization. From the information in the graph, it can be observed that through the reallocation of water for domestic, industrial, and reservoir storage purposes, the ecological service, water supply, and water–ecology harmony provided by the Datun Reservoir to its service area have all been enhanced. Specifically, in 2016, the ESI experienced the highest improvement, increasing by 11.36% from 0.047 to 0.052. The ESI achieved its most significant increase in 2015, rising by 22.33% from 0.0347 to 0.042. Similarly, the WED saw its most substantial increase in 2015, reaching 7.715% from 0.196 to 0.222 after optimization.

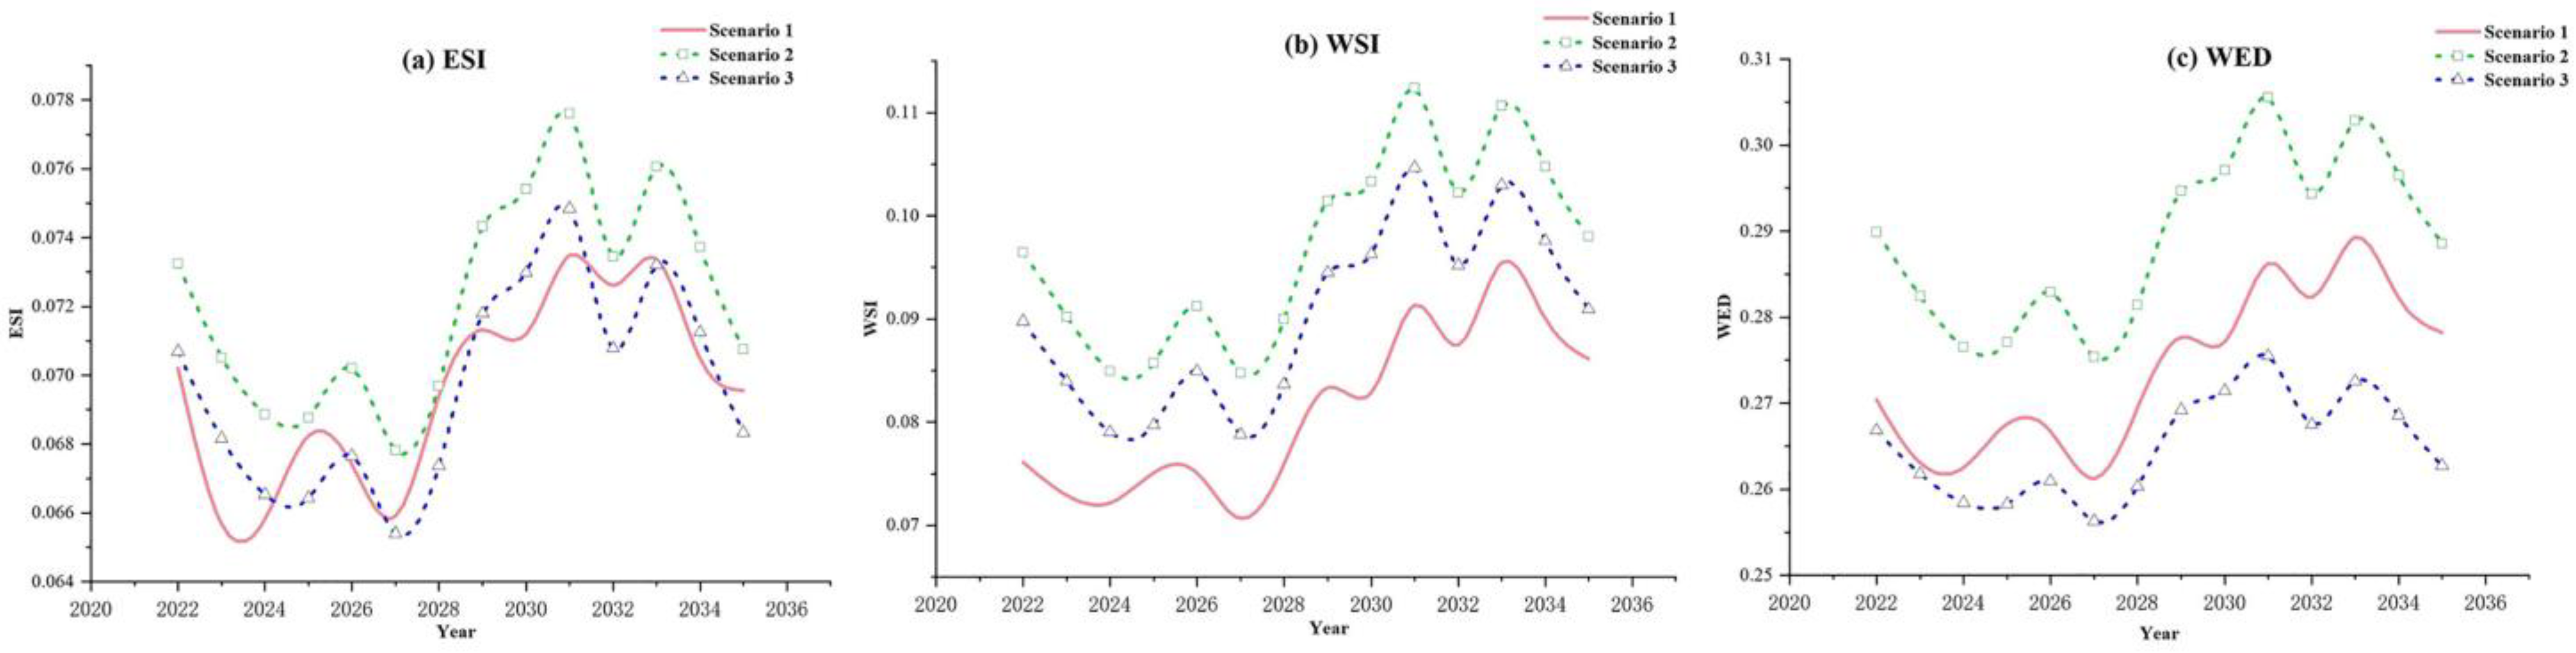
3.4. Water Allocation under Different Scenarios

In three different scenarios considering variations in economic growth and social water use efficiency, water allocation for the Datun Reservoir was optimized, and the results are presented in Table 5.
Under Scenario 1 conditions, in which the economic growth level and social water use efficiency in the service area remain at the current level, the baseline predicted results were used for the calculation. In this scenario, after optimization, the allocated volumes for the domestic water supply are projected to reach 8.60, 8.97, and 11.42 million m3 in 2025, 2030, and 2035, respectively. Industrial water supply volumes are estimated to be 18.37, 21.12, and 19.33 million m3 for the same years, while reservoir storage volumes are expected to be 36.98, 40.13, and 33.50 million m3.
Under Scenario 2 conditions, in which the economic growth level in the service area exceeds expectations and social water use efficiency improves, the allocated volumes for various water resources are generally higher than those in Scenario 1. Domestic water supply volumes are projected to reach 8.88, 19.74, and 39.73 million m3 in 2025, 2030, and 2035, respectively. Industrial water supply volumes are estimated to be 9.08, 25.81, and 44.14 million m3, while reservoir storage volumes are expected to be 11.71, 20.84, and 38.78 million m3 for the same years.
Under Scenario 3 conditions, in which the economic growth level in the service area is lower than expected but social water use efficiency improves, the domestic water supply volumes are generally lower than those in Scenario 1. In 2025, 2030, and 2035, they are projected to reach 7.99, 18.62, and 38.51 million m3, respectively. Industrial water supply volumes are higher than in Scenario 1 but lower than in Scenario 2, estimated to be 8.17, 24.35, and 43.94 million m3. Reservoir storage volumes are expected to be 10.54, 19.66, and 37.84 million m3 for the same years.
Figure 6 illustrates the various ESVs provided by the Datun Reservoir after optimization in different scenarios. Figure 6a reflects changes in the water supply service value. In Scenario 2, the configuration provides the highest water resource supply, resulting in a higher water supply service value compared to the other two scenarios. In terms of flood regulation service value, in Figure 6b, Scenario 2 performs better than the other two scenarios, with the highest flood regulation service value reaching CNY 13 million in 2027. Figure 6c shows the carbon sequestration and oxygen release service value; Scenarios 2 and 3 maintain consistency, and both surpass Scenario 1. As for the water storage service value of Figure 6d, the differences in the water source conservation service value among the three scenarios are relatively small and remain at a similar level. Figure 6e shows that the total ESV in Scenario 2 outperforms the other two scenarios.
Figure 7 illustrates the water allocation schemes and corresponding changes in the ESI, WSI, and WED for the three scenarios. Figure 7a shows that Scenario 2 consistently outperforms the other two scenarios for the ESI except in 2028, when it is comparable to Scenario 1. The ESI values for Scenario 1 and Scenario 3 exhibit significant fluctuations. In terms of the WSI in Figure 7b, due to the higher-than-expected economic growth in Scenario 2, the water demand is significantly higher. Consequently, the water resource supply for the Datun Reservoir is enhanced, resulting in a significantly better WSI compared to Scenario 1 and Scenario 3. In Scenario 3, the improvement in the WSI is facilitated by the combined effect of increased water use efficiency and slowed economic growth, reducing societal water demand. Figure 7c reflects that the water allocation scheme in Scenario 2 exhibits a significantly better WED than the other two scenarios. Over time, the gap between the WEDs of Scenario 3 and Scenario 1 widens, indicating that under the conditions of Scenario 3, when economic growth slows down, reservoir management should prioritize balancing the water supply with ecological service achievement, gradually achieving a more coordinated development between the two.

4. Discussion

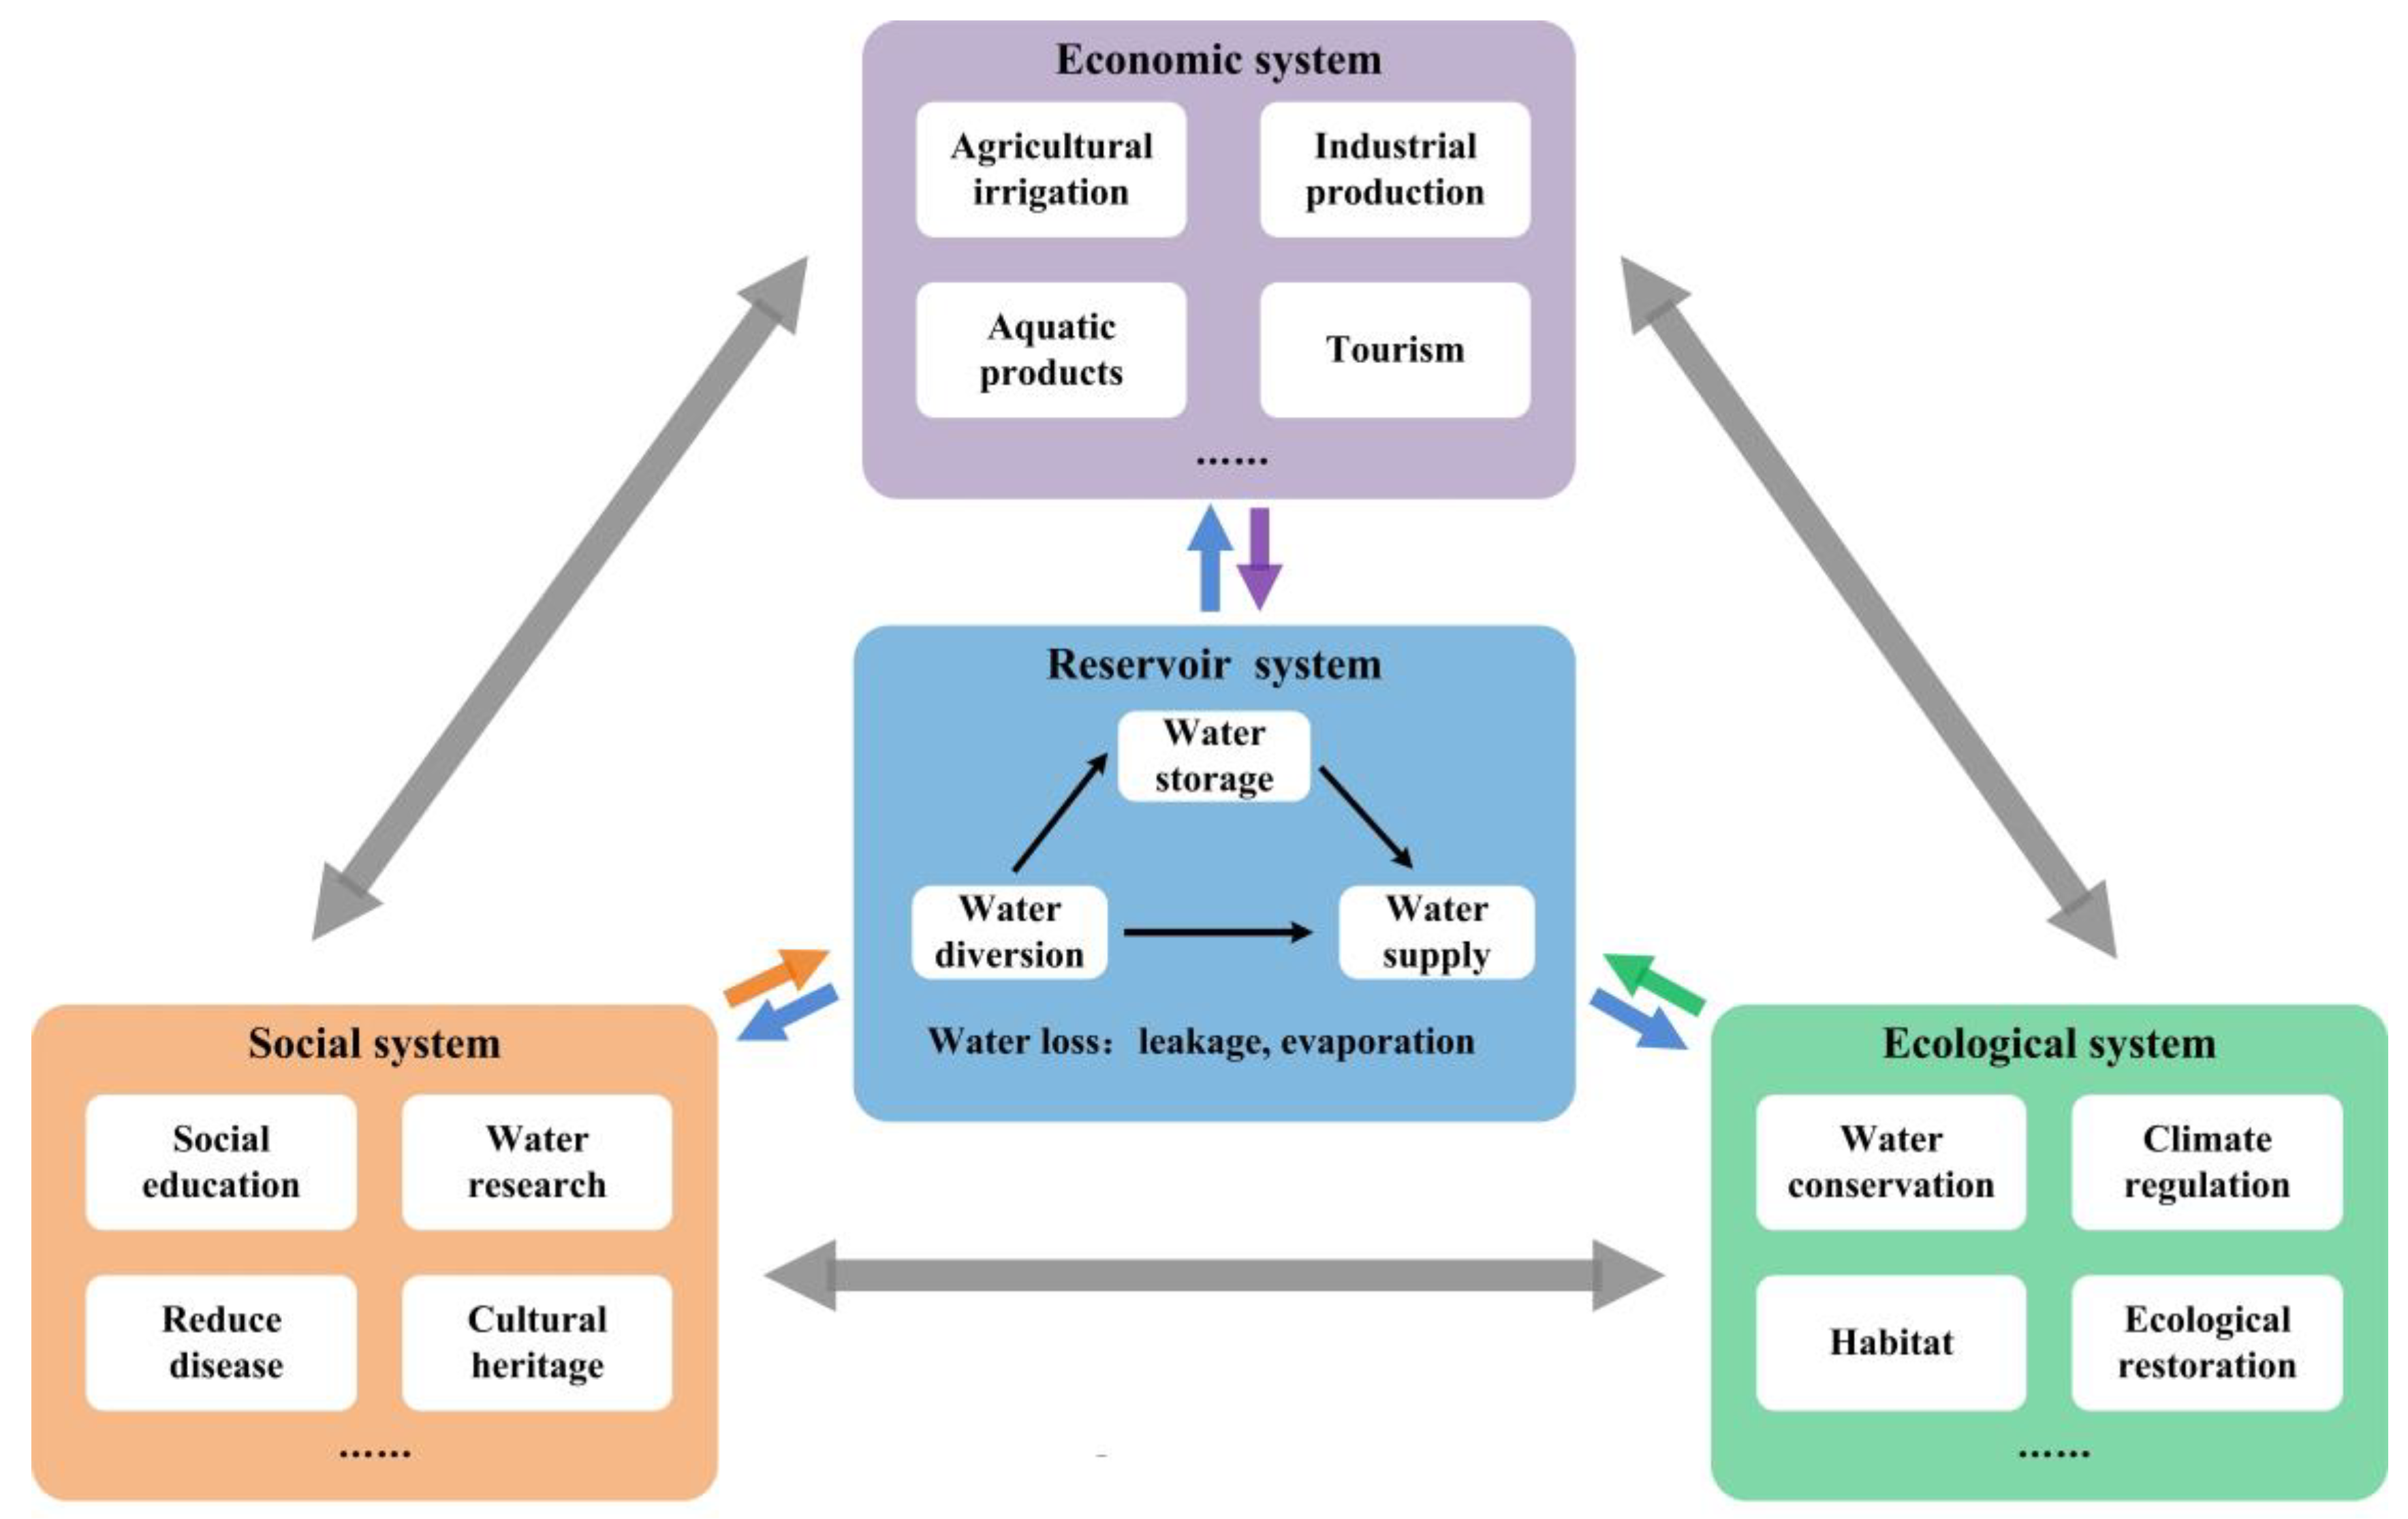
4.1. The Basic Functions and Ecosystem Service Roles of Reservoirs

In this paper, following the framework of the ecosystem services theory, the reservoir is identified to have five types of ecosystem service functions. These functions provide regulation, supply, support, and cultural services to the reservoir’s service area. Reservoirs, as typical hydraulic engineering projects, bear the important responsibility of achieving interregional water transfer and ensuring the water demand for local production activities is met, which is significant for human well-being in the region (Figure 8). The transport, storage, supply, and purification of water are the core tasks of reservoir engineering. Thus, water supply and water purification, a reservoir’s core functions which are closely related to water flow, bring ESVs to the region. Reservoirs can also provide clean electrical energy to a region through the construction of hydroelectric power stations. This helps reduce dependence on traditional energy sources, lower greenhouse gas emissions, and promote sustainable development in the region. In water-deficient areas, reservoirs can play a supporting role in restoring natural ecosystems through ecological water replenishment. Large valley-type reservoirs, in addition to the main engineering structure, also include surrounding natural ecosystems such as wetlands, shoreline vegetation, and water bodies, providing important ecological functions at a large-scale regional level and, for example, preserving wetlands and riverbank zones, planting suitable vegetation, providing habitat and food sources, and sustaining various types of wildlife. Some reservoirs with abundant natural resources are gradually developed into water scenic areas, making full use of natural landscapes and historical cultural scenery, attracting tourists, and generating economic income and cultural services for the region. In addition, reservoirs can also explore social education functions such as hydroculture and historical heritage, serving as research bases for ecological conservation and artificial ecosystem-related studies.

4.2. Optimization Management of Reservoir Water Allocation and ESVs

This study focuses on the indexes of WR meeting (WSI) and ES meeting (ESI) of reservoirs and further establishes the coordinated degree index (WED) to measure their coordination. A water allocation model for reservoirs is collectively constructed. In the case application of the Datun Reservoir, it is found that due to its late completion date, the potential of the reservoir in terms of water supply and ecosystem services has not been fully explored. Furthermore, the findings indicate that optimizing the distribution of reservoir storage, domestic water, and industrial water supply can lead to improvements in the ESI, WSI, and WED to varying degrees while still meeting regional water demand, as compared to the actual water allocation scheme implemented from 2015 to 2021. Among them, the optimized ESI shows the most significant improvement, with an increase of 22.33% compared to the actual ESI in 2015. There exists considerable potential for enhancing the current water management program of the Datun Reservoir. The reservoir can moderately increase the water supply for agricultural production and residents in the service areas and replace the use of groundwater with water transfer in different places, thus easing the load on the local water resources ecosystem. The management authorities also did not pay enough attention to the project’s role in providing ecosystem services. Merely satisfying the regional water resource demand while neglecting ecological effects is not conducive to the sustainable management of hydraulic engineering. There is a close connection between reservoirs and the socioeconomic and ecological systems of the service area, and water flow plays a crucial role. Water supply, purification, hydropower generation, etc., are not only the core functions of reservoirs but also the main sources of ESVs. According to the case, the calculated water supply service value reached CNY 60.12 million in 2021, accounting for 46.97% of the overall service value of the reservoir. Therefore, by constructing a water allocation model that considers both water resource supply and ESVs, reservoirs can help provide optimized ESVs to the surrounding areas while fulfilling their basic functions.
To address different economic and social development trends, this study, using a predictive model, sets water allocation scenarios for reservoirs under different economic growth rates and social water use efficiency scenarios. In the case application, the WSI maintains a similar trend in all three scenarios, while the ESI shows significant differences: when the economy maintains high growth (Scenario 2), the reservoir can achieve high levels for both the ESI and WSI, and the water supply and ecosystem service supply show good coordination. However, when economic growth slows down (Scenario 3), the reservoir’s ESI will change dramatically due to factors such as a decrease in regional water demand, and the WED will also remain at a lower level. Changes in population, economic growth, and water use efficiency in the development situation will cause salient changes in the demand for industrial, agricultural, and domestic water supply from the areas surrounding the reservoir. This directly affects changes in the water supply service value, thereby altering the overall service value. For reservoir management organizations facing different trends in economic and social development, it is imperative to develop real-time water allocation strategies that effectively harmonize water and ecosystem service supply coordination. In particular, when economic growth slows down, as the demand for water resources in economic production activities decreases, reservoir management agencies should optimize the scheme of allocating ecological, domestic, and agricultural water in real time by strengthening the water replenishment function of the reservoir to wetland, river, and other ecological systems. The ecological service benefits of the project can be improved so as to achieve the maximum value of ecological services as much as possible while meeting water demand, and maintaining a balance between the two.

4.3. Research Shortcomings and Outlook

In this paper, the ESVs of reservoirs are assessed, and ecosystem services are incorporated into the institutional standards of reservoir water optimization management policies. A case study was conducted on the Datun Reservoir, demonstrating that through water optimization allocation while considering the demand satisfaction for ecosystem services and water resources, comprehensive improvements can be achieved in the ESI, WSI, and WED. However, in setting constraints for this study, only constraints at the parameter level of the reservoir’s engineering itself were considered. Constraints were constructed based on storage capacity, water intake, and water supply capabilities to establish constraints for the water optimization model. This study emphasizes that reservoir management should not only ensure basic water supply but also emphasize additional ESVs. However, the operational and maintenance costs resulting from different reservoir operation scenarios were not within the scope of this study, mainly due to the study’s primary objectives and limitations in relevant data. Additionally, under different scenario settings, in the water optimization results of the Datun Reservoir, when the economy exhibits low growth, the coordination degree (WED) between the water supply and ecosystem services remains at a lower level and even shows a declining trend. External economic downturn pressures will likely further influence reservoir management organizations’ consideration of cost factors.
In future research, when constructing water allocation models that consider ecological effects, the study will further incorporate operating costs, social factors, and other internal and external factors into the research scope. This approach aims to make the model more realistic and applicable to guide the work of reservoir and other hydraulic engineering management organizations. Additionally, considering the societal demand for sustainable development and clean production, analyzing the ecological support functions of artificial structures such as reservoirs and exploring the role of artificial ecosystems in promoting regional sustainability will be a focus of future work.

5. Conclusions

To achieve the optimization of reservoirs, balancing regional water resource supply and considering the value of ecosystem services, this paper sequentially constructs an assessment model for the ESVs of reservoirs, including a multi-objective water allocation model that incorporates the ESI, WSI, and WED. Additionally, the ARIMA model is applied to predict trends in regional economic and social development, considering three different scenarios to adapt water allocation to different future situations, accounting for the effects of improved social water use efficiency due to technological advancements. Finally, the study model is applied to the Datun Reservoir as a practical case.
The research findings indicate that integrating ESVs into the reservoir water allocation scheme can promote an overall increase in ESVs. Through a case analysis considering the actual conditions of the Datun Reservoir, optimizations are made for the domestic water supply, industrial water supply, and storage capacity. The actual water allocation scheme of the reservoir in 2021 resulted in an overall service value of CNY 128.01 million, which increased to CNY 133.98 million after optimization, achieving a growth of 4.67%. The most significant improvement occurred in 2016, reaching 11.36%. Furthermore, since the reservoir was completed in 2014, allocations of domestic water supply and industrial water supply have increased, indicating significant optimization potential in the water allocation of the reservoir within the effective design parameter range. The existing water resource allocation scheme has not fully realized the configuration potential of the reservoir.
In formulating water allocation schemes for different future development scenarios, when the economy maintains high-speed growth and social water use efficiency improves (Scenario 2), the Datun Reservoir can ensure regional water supply needs are met (a high WSI) while maximizing the satisfaction of regional ecosystem service demands (a high ESI). The two factors exhibit good coordination (a WED maintaining a high level). However, with a slowdown in economic growth, even with an improved social water use efficiency, the reservoir faces a sharp decline in regional water demand. After ensuring the regional water supply (the WSI is high), its role in satisfying the demands of regional ecosystem services is weakened (the ESI is at a low level), and the WED is also at a low level. Therefore, facing a slowdown in economic growth, the decline in water consumption will cause the water supply function of the reservoir to weaken. At this time, the management organization should expand an ecological restoration function of the project, promote the value of ecological services, and promote coordination between the water supply and ecological benefits.
This study integrates ecosystem service value into the development of reservoir water allocation schemes and daily management, establishing a multi-objective allocation model that addresses both regional water resources and ecosystem service requirements. This model can assist engineering management organizations, such as reservoirs, in formulating more reasonable management plans. It ensures the completion of the reservoir’s basic functions while optimizing the provision of ESVs to the region. It is of great significance to promote the scientific management and sustainable development of such projects.

Author Contributions

B.T.: data curation, methodology, and writing—original draft, Q.S.: data curation, software, and writing—original draft. J.W.: supervision and project administration. J.Z.: funding acquisition, resources, and writing—review and editing. Z.X.: visualization and writing—review and editing. All authors have read and agreed to the published version of the manuscript.

Funding

This research was supported by the Young Scientists Fund of the National Natural Science Foundation of China (no. 42301351) and the National Social Science Fund of China (no. 20BGL196).

Data Availability Statement

The data presented in this study are available on request from the corresponding author.

Acknowledgments

We are grateful for the assistance of the engineering management organizations of the Datun Reservoir and South-to-North Water Diversion East Route Company. We also thank the reviewers and editors who participated in the review process.

Conflicts of Interest

The authors declare no conflicts of interest.

References

  1. Abdi-Dehkordi, M.; Bozorg-Haddad, O.; Salavitabar, A.; Goharian, E. Developing a sustainability assessment framework for integrated management of water resources systems using distributed zoning and system dynamics approaches. Environ. Dev. Sustain. 2021, 23, 16246–16282. [Google Scholar] [CrossRef]
  2. Jansson, A.; Folke, C.; Rockstrom, J.; Gordon, L. Linking freshwater flows and ecosystem services appropriated by people: The case of the Baltic Sea drainage basin. Ecosystems 1999, 2, 351–366. [Google Scholar] [CrossRef]
  3. Yang, Z.; Huang, X.; Fang, G.; Ye, J.; Lu, C. Benefit evaluation of East Route Project of South to North Water Transfer based on trapezoid cloud model. Agric. Water Manag. 2021, 254, 106960. [Google Scholar] [CrossRef]
  4. Momblanch, A.; Paredes-Arquiola, J.; Andreu, J. Improved modelling of the freshwater provisioning ecosystem service in water scarce river basins. Environ. Model. Softw. 2017, 94, 87–99. [Google Scholar] [CrossRef]
  5. Fu, B.; Wang, Y.K.; Xu, P.; Yan, K.; Li, M. Value of ecosystem hydropower service and its impact on the payment for ecosystem services. Sci. Total Environ. 2014, 472, 338–346. [Google Scholar] [CrossRef] [PubMed]
  6. Bekoe, J.; Balana, B.B.; Nimoh, F. Social cost-benefit analysis of investment in rehabilitation of multipurpose small reservoirs in northern Ghana using an ecosystem services-based approach. Ecosyst. Serv. 2021, 50, 101329. [Google Scholar] [CrossRef]
  7. Costanza, R.; de Groot, R.; Sutton, P.; van der Ploeg, S.; Anderson, S.J.; Kubiszewski, I.; Farber, S.; Turner, R.K. Changes in the global value of ecosystem services. Glob. Environ. Change-Hum. Policy Dimens. 2014, 26, 152–158. [Google Scholar] [CrossRef]
  8. Martinez-Guerra, E.; Ghimire, U.; Nandimandalam, H.; Norris, A.; Gude, V.G. Wetlands for environmental protection. Water Environ. Res. 2020, 92, 1677–1694. [Google Scholar] [CrossRef]
  9. Zhao, B.; Li, B.; Zhong, Y.; Nakagoshi, N.; Chen, J.-k. Estimation of ecological service values of wetlands in Shanghai, China. Chin. Geogr. Sci. 2005, 15, 151–156. [Google Scholar] [CrossRef]
  10. Drius, M.; Bongiorni, L.; Depellegrina, D.; Menegon, S.; Pugnetti, A.; Stifter, S. Tackling challenges for Mediterranean sustainable coastal tourism: An ecosystem service perspective. Sci. Total Environ. 2019, 652, 1302–1317. [Google Scholar] [CrossRef]
  11. Turner, K.G.; Anderson, S.; Gonzales-Chang, M.; Costanza, R.; Courville, S.; Dalgaard, T.; Dominati, E.; Kubiszewski, I.; Ogilvy, S.; Porfirio, L.; et al. A review of methods, data, and models to assess changes in the value of ecosystem services from land degradation and restoration. Ecol. Model. 2016, 319, 190–207. [Google Scholar] [CrossRef]
  12. Pittock, J.; Lankford, B.A. Environmental water requirements: Demand management in an era of water scarcity. J. Integr. Environ. Sci. 2010, 7, 75–93. [Google Scholar] [CrossRef]
  13. Crespo, D.; Albiac, J.; Dinar, A.; Esteban, E.; Kahil, T. Integrating ecosystem benefits for sustainable water allocation in hydroeconomic modeling. PLoS ONE 2022, 17, e0267439. [Google Scholar] [CrossRef] [PubMed]
  14. Jones, S.K.; Boundaog, M.; DeClerck, F.A.; Estrada-Carmona, N.; Mirumachi, N.; Mulligan, M. Insights into the importance of ecosystem services to human well-being in reservoir landscapes. Ecosyst. Serv. 2019, 39, 100987. [Google Scholar] [CrossRef]
  15. Guo, Z.; Boeing, W.J.; Borgomeo, E.; Xu, Y.; Weng, Y. Linking reservoir ecosystems research to the sustainable development goals. Sci. Total Environ. 2021, 781, 146769. [Google Scholar] [CrossRef] [PubMed]
  16. Ho, L.; Goethals, P. Sustainability of Lakes and Reservoirs: Multiple Perspectives Based on Ecosystem Services. Water 2021, 13, 2763. [Google Scholar] [CrossRef]
  17. Tranmer, A.W.; Weigel, D.; Marti, C.L.; Vidergar, D.; Benjankar, R.; Tonina, D.; Goodwin, P.; Imberger, J. Coupled reservoir-river systems: Lessons from an integrated aquatic ecosystem assessment. J. Environ. Manag. 2020, 260, 110107. [Google Scholar] [CrossRef]
  18. Hatamkhani, A.; Moridi, A.; Asadzadeh, M. Water allocation using ecological and agricultural value of water. Sustain. Prod. Consum. 2022, 33, 49–62. [Google Scholar] [CrossRef]
  19. Fu, Y.C.; Zhang, J.; Zhang, C.L.; Zang, W.B.; Guo, W.X.; Qian, Z.; Liu, L.S.; Zhao, J.Y.; Feng, J. Payments for Ecosystem Services for watershed water resource allocations. J. Hydrol. 2018, 556, 689–700. [Google Scholar] [CrossRef]
  20. Laurita, B.; Castelli, G.; Resta, C.; Bresci, E. Stakeholder-based water allocation modelling and ecosystem services trade-off analysis: The case of El Carracillo region (Spain). Hydrol. Sci. J. 2021, 66, 777–794. [Google Scholar] [CrossRef]
  21. Su, Q.; Chen, X. Efficiency analysis of metacoupling of water transfer based on the parallel data envelopment analysis model: A case of the South–North Water Transfer Project-Middle Route in China. J. Clean. Prod. 2021, 313, 127952. [Google Scholar] [CrossRef]
  22. Sun, S.; Zhou, X.; Liu, H.; Jiang, Y.; Zhou, H.; Zhang, C.; Fu, G. Unraveling the effect of inter-basin water transfer on reducing water scarcity and its inequality in China. Water Res. 2021, 194, 116931. [Google Scholar] [CrossRef] [PubMed]
  23. Hecht, J.S.; Lacombe, G.; Arias, M.E.; Dang, T.D.; Piman, T. Hydropower dams of the Mekong River basin: A review of their hydrological impacts. J. Hydrol. 2019, 568, 285–300. [Google Scholar] [CrossRef]
  24. Pahl-Wostl, C.; Lukat, E.; Stein, U.; Troeltzsch, J.; Yousefi, A. Improving the socio-ecological fit in water governance by enhancing coordination of ecosystem services used. Environ. Sci. Policy 2023, 139, 11–21. [Google Scholar] [CrossRef]
  25. Zhao, J.; Ge, Y.; Li, Y.; Li, C. Study on the appropriate standard of eco-compensation based on ecosystem service value in Dawen River basin. J. Arid Land Resour. Environ. 2023, 37, 446–452. [Google Scholar] [CrossRef]
  26. Safaei, H.; Motlagh, M.G.; Khorshidian, M.; Malmasi, S. Introducing a process to select the appropriate dam compensation option based on ecosystem services. Environ. Dev. Sustain. 2022, 24, 13011–13034. [Google Scholar] [CrossRef]
  27. Sun, Q.; Wang, J.G.; Zhang, J.; Xing, Z.C. Selecting reservoir reconstruction schemes from an ecological-economic trade-off perspective: Model building and case study. J. Clean. Prod. 2022, 376, 134183. [Google Scholar] [CrossRef]
  28. Chen, D.; Zhong, L. Review of the value evaluation and realization mechanism of ecosystem services. J. China Agric. Resour. Reg. Plan. 2023, 44, 84–94. [Google Scholar]
  29. Meng, Y.; Zhang, H.; Jiang, P.; Guan, X.; Yan, D. Quantitative assessment of safety, society and economy, sustainability benefits from the combined use of reservoirs. J. Clean. Prod. 2021, 324, 129242. [Google Scholar] [CrossRef]
  30. Luo, L.; Yang, L.; Xie, H.; Guan, Z.; Wei, P. Ecosystem service value of mine park under ecological restoration background: A case study of Zijin Mountain in Fujian Province. Chin. J. Ecol. 2022, 41, 2171–2179. [Google Scholar] [CrossRef]
  31. Wang, J.; Zhai, T.; Lin, Y.; Kong, X.; He, T. Spatial imbalance and changes in supply and demand of ecosystem services in China. Sci. Total Environ. 2019, 657, 781–791. [Google Scholar] [CrossRef] [PubMed]
  32. Qi, N.; Sun, W.; Kan, H.; Liu, L.; Zou, J.; Pang, Z.; Zhang, G. Evaluation on water-related ecosystem services of Minyun reservoir during 2008-2019. Bull. Soil Water Conserv. 2021, 41, 276–283. [Google Scholar] [CrossRef]
  33. Jia, Y.; Shen, J.; Wang, H. Research on the confirmation, measurement and form compilation of regional water resources assets. J. Nat. Resour. 2022, 37, 3297–3312. [Google Scholar] [CrossRef]
  34. Zehtabian, E.; Masoudi, R.; Yazdandoost, F.; Sedghi-Asl, M.; Loáiciga, H.A. Investigation of water allocation using integrated water resource management approaches in the Zayandehroud River basin, Iran. J. Clean. Prod. 2023, 395, 136339. [Google Scholar] [CrossRef]
  35. Heydari, F.; Saghafian, B.; Delavar, M. Coupled Quantity-Quality Simulation-Optimization Model for Conjunctive Surface-Groundwater Use. Water Resour. Manag. 2016, 30, 4381–4397. [Google Scholar] [CrossRef]
  36. Wang, J.; Qin, T.; Lv, X.; Ni, Y.; Zhang, Q.; Ma, L. Study of Optimal and Joint Allocations of Water and land Resources for Multiple Objectives. Water Resour. Manag. 2023, 37, 1241–1256. [Google Scholar] [CrossRef]
  37. Jiao, G.; Chen, S.; Wang, F.; Wang, Z.; Wang, F.; Li, H.; Zhang, F.; Cai, J.; Jin, J. Water Quality Evaluation and Prediction Based on a Combined Model. Appl. Sci. 2023, 13, 1286. [Google Scholar] [CrossRef]
  38. Ma, H.; Huang, D.; Zhang, J.; Tian, Z. The provincial differences of china’s water use efficiency in recent years: Technological progress or technical efficiency. Resour. Sci. 2012, 34, 794–801. [Google Scholar]
Figure 1. The service area of the Datun Reservoir. (A) Shandong Province. (B) Dezhou City.
Water 16 00563 g001
Figure 2. Ecosystem service value of the Datun Reservoir in 2015–2021.
Water 16 00563 g002
Figure 3. Results of the projections regarding the (a) population, (b) GDP, (c) water demand of the service area, and (d) pondage of the Datun Reservoir.
Water 16 00563 g003
Figure 4. The results of the Datun Reservoir’s flood regulation (a), carbon sequestration and oxygen release (b), water storage (c), and water supply (d) service values after optimization.
Water 16 00563 g004
Figure 5. Optimized results for the ESI, WSI, and WED.
Water 16 00563 g005
Figure 6. (a) water supply, (b) flood regulation, (c) carbon sequestration and oxygen release, (d) water storage and (e) total ESVs in different scenarios.
Water 16 00563 g006
Figure 7. Different scenarios: results for (a) ESI, (b) WSI, and (c) WED.
Water 16 00563 g007
Figure 8. The interaction between reservoir functions and regional economic, social, and ecological systems.
Water 16 00563 g008
Table 2. Multi-scenario setting.
ScenariosInstructionsEconomic IndicatorsSocial Water Usage Indicators
1Baseline scenario: based on the predictive model results.Using predictive resultsUsing predictive results
2High economic growth exceeding expectations with improved water efficiency.Making upward adjustments to the predictive results, referring to the region’s economic plans.Make downward adjustments to the baseline predictive results.
3Low economic growth below expectations with improved water efficiency.Making downward adjustments to the predictive results, referring to the region’s economic plans.Make downward adjustments to the baseline predictive results.
Table 3. The optimized results of water allocation (unit: million m3).
YearDomestic Water SupplyIndustrial Water SupplyPondage
InitialOptimal InitialOptimal InitialOptimal
20152.949 3.096 7.075 7.166 30.060 34.077
20163.352 3.519 8.847 9.085 34.484 40.829
20175.033 5.284 20.946 21.878 38.908 42.580
20186.607 6.837 16.881 17.245 33.311 38.304
20197.141 7.598 14.144 15.124 29.090 30.817
20209.516 9.891 17.085 18.477 34.830 35.279
20217.811 8.102 14.961 16.056 38.738 40.359
20258.473 8.597 16.114 18.374 34.603 36.984
20308.731 8.968 20.272 21.116 34.714 40.129
203510.781 11.420 17.838 19.334 32.689 33.496
Note: the initial values after 2021 refer to the results of the forecast model under the base scenario.
Table 4. The optimized results for total ESVs (unit: million CNY).
Year2015201620172018201920202021
Initial value83.68 92.87 132.14 124.70 118.57 135.12 128.01
Value after optimization 92.09 103.42 141.28 134.92 126.23 143.69 133.98
Increased percentage10.05%11.36%6.91%8.20%6.46%6.34%4.67%
Year2022202320242025202620272028
Initial value134.47 129.23 130.36 134.54 136.84 135.40 142.35
Value after optimization 145.99 137.64 139.22 145.68 145.36 143.41 152.44
Increased percentage8.57%6.50%6.80%8.27%6.22%5.91%7.09%
Year2029203020312032203320342035
Initial value147.21 150.98 158.72 155.87 159.95 154.61 154.42
Value after optimization 158.52 160.21 166.89 166.63 169.88 164.63 163.89
Increased percentage7.68%6.11%5.15%6.91%6.21%6.48%6.13%
Note: the initial values after 2021 refer to the results of the forecast model under the base scenario.
Table 5. Water allocation in different scenarios (unit: million m3).
YearScenario 1Scenario 2Scenario 3
Domestic Industrial PondageDomestic Industrial PondageDomestic Industrial Pondage
20228.9117.9437.399.1722.4539.38.2621.1838.43
20238.2817.6634.998.6521.1938.457.7919.9937.77
20247.8818.1235.668.2920.1640.137.4619.0238.9
20258.618.3736.988.8819.7439.737.9918.6238.51
20268.119.2233.298.9221.9634.78.0320.7132.97
20278.2817.6234.449.1419.7635.178.2218.6433.41
20288.3719.0136.859.2520.9137.598.3219.7236.71
20299.1420.839.299.4424.4642.338.4923.0741.43
20308.9721.1240.139.0825.8144.148.1724.3543.94
203110.0822.9935.4810.2527.5638.29.2325.9937.29
20329.2922.2636.129.524.7840.228.5523.3838.21
203310.5223.837.4910.8126.1840.169.7324.738.15
20349.4422.8234.219.5525.3639.428.623.9238.45
203511.4219.3333.511.7120.8438.7810.5419.6637.84
Disclaimer/Publisher’s Note: The statements, opinions and data contained in all publications are solely those of the individual author(s) and contributor(s) and not of MDPI and/or the editor(s). MDPI and/or the editor(s) disclaim responsibility for any injury to people or property resulting from any ideas, methods, instructions or products referred to in the content.

