Abstract
In the low-lying, river-rich Pearl River Delta in South China, an extensive network of flood defense levees, spanning over 4400 km, plays a crucial role in urban flood management. These levees are designed to withstand floods and storm surges, yet their failure can lead to significant human and economic losses, highlighting the need for robust urban flood defense strategies. This necessitates the development of a sophisticated geographic information system for the levee network and rapid, accurate assessment methods for levee conditions to support water management and flood mitigation efforts. This study focuses on the levees along the Hengmen waterway in the Pearl River Delta, utilizing airborne Light Detection and Ranging (LiDAR) technology to gather 3D spatial data of the levees. Employing the Cloth Simulation Filter (CSF) algorithm, non-ground point cloud data were extracted. The study improved upon the region-growing algorithm, using a seed point set approach for the automatic extraction of levee point cloud data. The accuracy and completeness of levee extraction were evaluated using the quality index. This method achieved effective extraction of four levee types, showing significant improvements over traditional algorithms, with extraction quality ranging from 72% to 83%. Key research outcomes include the development of a novel method for detecting localized levee depressions based on the computation of the variance of angles between normal vectors in single-phase levee point cloud data. An adaptive optimal neighborhood approach was utilized to accurately determine the normal vectors, effectively representing the local morphology of the levee point clouds. Applied in three levee depression detection experiments, this method proved effective, demonstrating the capability of single-phase data in identifying regions of levee depression deformation. This advancement in levee monitoring technology marks a significant step forward in enhancing urban flood defense capabilities in regions such as the cities of the Pearl River Delta in China.
1. Introduction
In the realm of urban flood management, the incorporation of levee systems into these networks is paramount for safeguarding urban regions, particularly in the case of sophisticated delta city clusters [1,2,3]. These levee systems act as the primary bulwark against surging water levels, offering indispensable protection in the event of floods [4,5]. However, these levees are frequently subjected to damage from flood erosion, human activities, and natural subsidence, which collectively heighten their susceptibility to structural failure. Potential breaches in these defenses pose severe risks of casualties and economic losses [6,7,8,9,10]. The Pearl River Delta, one of South China’s most densely populated regions, is distinguished by its low-lying topography and intricate river networks. The area is fortified by an extensive array of flood protection levees, with those classified as third-level or higher cumulatively spanning in excess of 4400 km. Consequently, there is an urgent need to establish a detailed foundational geographic information system (GIS) for the levee network and to develop precise and rapid assessment methods for levee conditions. Such advancements would furnish technological support to various levels of water management and flood control departments, aiding in disaster mitigation management and enhancing the efficacy of emergency response [11,12,13].
In acquiring spatial information of hydraulic engineering structures and other constructions, traditional surveying methods, such as using total stations, Real-time Kinematic (RTK) positioning, and drone aerial photography, are commonly used. However, these processes often encounter challenges such as low efficiency and high labor costs [12,13,14]. Airborne Light Detection and Ranging (LiDAR) systems circumvent these constraints by swiftly capturing expansive and precise three-dimensional point clouds of topographical features via a laser radar mechanism deployed from an aerial platform. The application of airborne LiDAR technology for the extraction of levee point clouds surmounts the challenges inherent in traditional levee data acquisition methods, which are typically labor-intensive and demonstrate limited operational efficiency. Employing this approach markedly elevates productivity within the domain of levee surveying.
Some research has conducted thorough investigations into and achieved considerable enhancements in the methodologies for classifying and extracting building-related information from LiDAR point clouds [14,15,16]. The direct extraction of point cloud data stands out as the most straightforward and widely employed method. As based on point cloud features, this type of method utilizes different attribute information inherent in LiDAR point cloud data, such as elevation, intensity, and number of returns, or geometric features derived from three-dimensional coordinate information, like curvature and roughness, to directly classify point clouds [17,18,19,20,21]. Bethel and Rottensteiner have successfully extracted building point clouds by exploiting the characteristic weak last-return signals from buildings [18].
Object-oriented point cloud classification and extraction is another common classification method, involving initial segmentation of unclassified point clouds, in which classification is based on the features of segmented objects. This approach primarily targets point clouds with prominent planar characteristics [22,23,24,25]. Poux et al. [26] utilized planar fitting to estimate point cloud normal vectors and employed these vectors as criteria for the region-growing algorithm, thereby successfully extracting building point clouds. While this method demonstrates effectiveness in extracting planar building point clouds, the quality of building extraction is significantly influenced by the results of clustering and the selection of seed points in the region-growing algorithm. The integration of imagery and point clouds for classification and extraction is also a commonly used method [27,28,29,30]. The classification of point clouds by using the fusion of multiple data types, such as the approach of Kabolizade et al. [31], involves utilizing distinct spectral characteristics of buildings and vegetation in remote sensing imagery, combined with the red-green band index in LiDAR point cloud attributes, to separate vegetation point clouds. Although the use of multi-source data as an auxiliary for point cloud classification enhances accuracy to some extent, effective integration of such data poses challenges.
Deformation monitoring using laser point cloud data commonly employs two methods: one entails direct terrain reconstruction, considering surface features and incorporating expert evaluation, while the other compares multi-temporal point cloud data to calculate vertical elevation changes, identifying deformation location and extent. Airborne LiDAR point clouds for deformation monitoring primarily focus on reservoir dams, vulnerable residential buildings, and highway slopes [32,33,34,35]. Jaboyedoff and Derron [36] highlighted the historical development, performance basics, and advantages and limitations of LiDAR, emphasizing its impact on landslide mapping, rock discontinuity characterization, and the ongoing evolution of the technique for improved research in this field. Lindenbergh and Pfeifer [37] used the Iterative Closest Point (ICP) method to achieve effective and precise registration of two sets of point cloud data, using the elevation differences between these datasets for the deformation monitoring of ship locks in ports. Alba et al. [38] utilized different scanners to scan dams, calculating the vertical changes at identical points on the dam body from the point cloud data obtained by both instruments, thereby acquiring the deformation information of the dam. Due to the high cost of acquiring multi-temporal point cloud data, deformation detection based on single-phase data acquisition has become a practical necessity. This approach involves fully utilizing the geometric relationships inherent in the point cloud, identifying and analyzing deformation damage by comparing the geometric features of point clouds in deformed and non-deformed regions, thereby detecting characteristic points of deformation on the surface of objects [39].
Despite the widespread application for the airborne LiDAR point, the levee point clouds are still not commonly utilized for shape-based monitoring purposes, as suggested by the scarcity of relevant literature. Despite the scarcity of research focused on the extraction of deformation regions from single-phase data, this paper addresses this gap by introducing two novel contributions: First, we present a levee-adaptive region-growing algorithm specifically developed for the automatic extraction of levee point cloud data. Second, we propose a rapid detection method for identifying levee depression deformations utilizing the extracted point cloud data as shown in Section 2.3.5 and Section 2.3.6. This innovative method synergizes iterative minima with machine learning techniques, significantly minimizing the necessity for manual input while delivering results with high accuracy and strong adaptability across diverse terrains. With a streamlined set of parameters, this approach is engineered to furnish dependable deformation monitoring outcomes.
2. Materials and Methods
2.1. Data Collection
The acquisition of LiDAR data pertinent to this research was executed in the proximity of the Hengmen Waterway, located within Zhongshan City, Guangdong Province, as illustrated in Figure 1. The geographic coordinates that demarcate the data collection zone span from 22°34′ to 22°35′ N latitude and 113°24′ to 113°38′ E longitude, encompassing an expanse of 51 km2. The Hengmen Waterway, a principal estuarine channel of the Pearl River Delta, is bordered by extensive flood protection levees of varying types. The airborne LiDAR survey was carried out in December 2016, with the area of interest delineated by the red polygon in Figure 1a. According to the tidal/level variation characteristics, the low tide of the astronomical neap day occurred at 1 p.m. on 22 December 2016, when the water level near the study area was at its lowest. To diminish the influence of aquatic surfaces on the integrity of the levee data, the surveying activity was strategically scheduled for approximately 1 p.m. to coincide with the low tide conditions, thereby ensuring minimal water coverage at the levee bases.
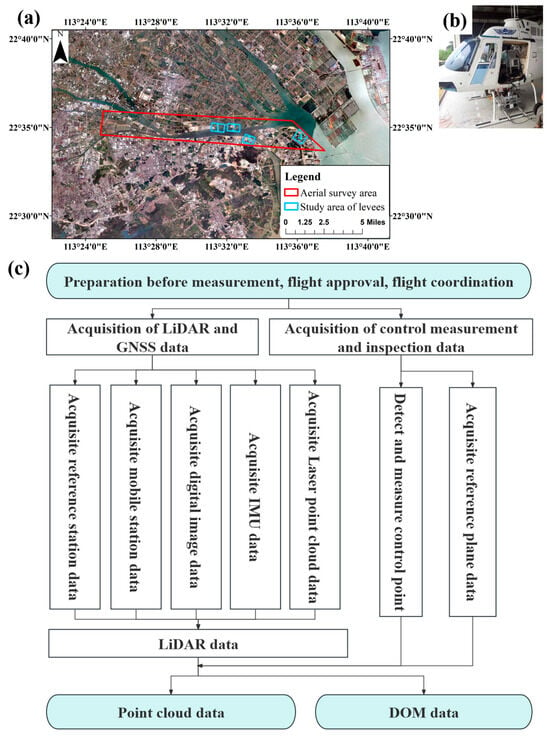
Figure 1.
(a) Geographical extent of the aerial LiDAR survey over the Hengmen Waterway; (b) configuration of the airborne LiDAR scanning apparatus; (c) flowchart of the LiDAR point cloud processing protocol [40].
The airborne laser scanning apparatus employed for this data collection, depicted in Figure 1b, was the Harrier 69i (TopoSys, Munich, Germany), which is capable of a maximum pulse frequency of 400 kHz and possesses a scanning swath of 45/60 degrees. Aerial imaging was conducted utilizing a Rollei Metric AIC Pro digital camera (RolleiMetric GmbH, Braunschweig, Germany), while plane control measurements were ascertained using a CHC Navigation V8 dual-frequency GNSS receiver (Tianbaonette Technology Co., LTD., Wuhan, China). Subsequent to the field data acquisition phase, processing was undertaken using TerraSolid software (v.2021) to synthesize point cloud and Digital Orthophoto Map (DOM) datasets. The methodological sequence and the technical specifications associated with the aerial survey and subsequent data curation are delineated in Figure 1c and Table 1.

Table 1.
Aerial survey technical parameters.
The LiDAR dataset procured for this analysis was aligned with the CGCS2000 national coordinate system for planar positioning and referenced to the 1985 Chinese National Height Datum for altitudinal data. This dataset maintained a point cloud density of 16 points per square meter and was accompanied by ultra-high-resolution imagery with a pixel size of 0.05 m. The spatial accuracy of the LiDAR point cloud was validated to a horizontal precision of 0.25 m and a vertical precision of 0.15 m. Data fidelity, particularly the altitudinal accuracy of the laser footprint, was meticulously verified through the use of ten strategically positioned ground control stations. This paper predominantly addresses the structural analysis of levees, aiming to assess the robustness of the proposed automated technique for point cloud extraction from levees exhibiting varied structural characteristics. To accommodate the disparity in spatial distribution between levee constructions and other landscape features, four distinct levee types along the Hengmen Waterway were selected as the focal regions in this case study.
As indicated in Figure 1 and Figure 2, the levee sections under scrutiny were identified as Levees 1 to 4. Figure 2 presents the initial point cloud data and Digital Orthophoto Map (DOM) images for each section. Levee 1, spanning an area of 68,874 m2, comprises 1,055,926 points. The topography in this region is notably level, with the levee exhibiting characteristics of a standardized man-made structure. The levee’s surface is uniform, with a salient linear configuration, and the surrounding land primarily consists of residential structures, sparse vegetation, aquatic expanses, and aquaculture ponds with synthetic coverings. Levee 2 extends over 35,683 m2 and includes 560,617 points. The adjacent terrain is predominantly flat, though the connecting roadway displays notable undulations. This levee, of a standardized man-made design, presents a more intricate “S”-shaped structure compared to Levee 1 and is surrounded by low-lying crops and a range of vegetation heights. Levee 3 encompasses 19,260 m2 with 327,826 points. The terrain here is uniform, and the levee itself is a non-standard man-made edifice, enveloped by diverse vegetation types. Its structure is primarily linear, with the area hosting both medium and low vegetation. Lastly, Levee 4 covers approximately 19,867 m2 and consists of 231,834 points. The terrain is generally level with some undulating areas. This non-standard man-made levee is characterized by its dense vegetation and a predominantly “S”-shaped complex contour. The vicinity largely comprises low-lying crops and a mixture of medium and tall vegetation.
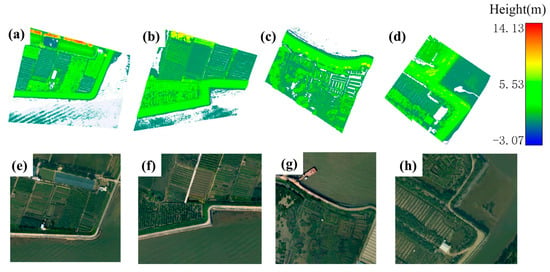
Figure 2.
Point clouds and image data of study regions: las data (a–d) for Levees 1–4; (e–h) images for Levees 1–4.
2.2. Introduction to Levee Structure
Figure 3 and Figure 4 illustrate the geometric model and basic structural elements of a standard levee. A typical levee structure usually comprises elements such as the crest and slopes, including both the waterside and landward slopes. The crest is generally built flat with a specific width, featuring extreme slope changes at the junctions with the slopes, and often has a wave wall on the water-facing side to resist flood overtopping. Additionally, in the study area, jetties are often constructed on the waterside slopes of the levees, narrower than the crest, to counteract flood and wave erosion and facilitate river channel inspections.

Figure 3.
Schematic representation of the levee’s constituent elements.

Figure 4.
Key elements of the levee 3D point cloud.
2.3. Method
2.3.1. Main Process
The present study meticulously evaluates point cloud data derived from an airborne LiDAR survey of the Hengmen waterway zone, with a particular emphasis on the multitude of levee formations encapsulated within the data. The central thrust of the research is to refine methodologies for both the extraction of levee point clouds and the identification of localized topographical depressions within these structures. The salient research activities are encapsulated in Figure 5 and are delineated as follows:
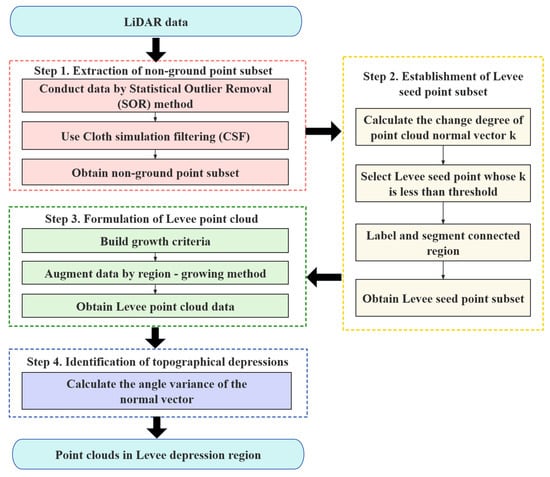
Figure 5.
Flowchart of monitoring of levee deformation for urban flood risk management using airborne 3D point clouds.
- Step 1: Extraction of Non-Ground Point Subset from LiDAR Data
The initial stage involves the application of a Statistical Outlier Removal (SOR) filter to the LiDAR dataset to expunge points that are not pertinent to the ground surface. Subsequent to this filtration, the Cloth Simulation Filter (CSF) algorithm is employed to discriminate between ground and non-ground points effectively, culminating in the isolation of the non-ground point subset.
- Step 2: Establishment of Levee Seed Point Subset from Non-Ground Points
The process commences with the exclusion of vegetation-influenced points from the non-ground subset, executed by analyzing the rate of change in the normal vectors of the point cloud. This is followed by the segmentation of the point cloud using a connected region labeling technique, which facilitates the derivation of initial levee seed points.
- Step 3: Formulation of Comprehensive Levee Point Cloud Using Seed Points
The investigation advances through the development and application of a region-growing algorithm, which is designed to augment the levee seed point subset. This strategic expansion yields a more comprehensive assemblage of levee point cloud data.
- Step 4: Identification of Topographical Depressions in Levee Point Cloud
The detection of deformation within the levee point clouds is predominantly conducted through the analysis of variance in the angles between the normal vectors of the point cloud. This evaluation employs an adaptive, optimally selected neighborhood principal component analysis method to ascertain the presence and extent of deformed topographical features. Each of these steps is integral to the overarching objective of advancing the precision and efficacy of levee analysis through innovative point cloud data processing techniques.
2.3.2. Basic Principle of Levee Point Cloud Extraction
In this study, we employ an advanced object-oriented region-growing algorithm, augmented by the geometric attributes of point clouds, to meticulously extract levee point cloud data, which is meticulously depicted in Step 2 of Figure 5. Levee point cloud extraction involves extracting levee terrain point clouds from non-ground points obtained via CSF [41,42,43]. Then, normal vectors of the point cloud, calculated from the non-ground points, are used as criteria for selecting initial discrete levee seed points. Subsequently, these seed points are clustered and segmented using the connected region labeling method to form a set of levee seed points. Finally, the angle of normal vectors and height differences are used as criteria for regional growth to extract the levee point cloud, as detailed in Figure 6:

Figure 6.
Flowchart of levee point cloud extraction.
2.3.3. Levee Seed Point Selection
The normal vectors of the point cloud are estimated using principal component analysis (PCA) and adjusted using the Minimum Spanning Tree (MST) algorithm. The degree of variation in point cloud normal vectors refers to the average angle between a point’s normal vector and those of all points within a certain neighborhood. Points on the same plane typically have normal vectors pointing in the same direction, with smaller angles between them. Figure 7 represents the number of levee and vegetation points. In terms of the change rate of the normal vector, the two vertical axes of Figure 7 (Figure 7a and Figure 7b) show that Figure 7a is the number of points in the levee and Figure 7b is for vegetation. Compared to vegetation, levee planes (Figure 7a) are more pronounced, exhibiting smaller variations in their point cloud normal vectors, allowing for effective removal of scattered vegetation points (Figure 7b) while retaining most of the levee point cloud.

Figure 7.
Number of points of (a) levee and (b) vegetation point clouds with the change rate of normal vector in depression region.
Statistical analysis of the variation in levee normal vectors revealed that points with a value less than 0.10 accounted for 98.13% of the selected levee points. Therefore, the threshold for selecting initial levee seed points was set at 0.10. However, when vegetation canopies are extensive or other structures like houses are present in the study area, the feature value of normal vector variation might also be small, potentially falling below the set threshold. To ensure the accuracy of levee point cloud extraction, further effective filtering of these noise points is necessary. Considering the discrete distribution of vegetation points, the independence of houses, and the spatial continuity of levees, the connected component labeling (CCL) method based on Euclidean distance clustering segmentation is used to cluster and segment levee seed points, filtering out clusters that do not meet the point cloud number threshold (such as rooftops, dense vegetation canopies, viaducts, power towers, etc.). Thus, levee seed points for subsequent regional growth are obtained. Finally, the extracted levee seed points are used as a basis for the regional growth extraction of the final levee point cloud, with the angle of normal vectors serving as the growth criteria, as illustrated in Figure 8.
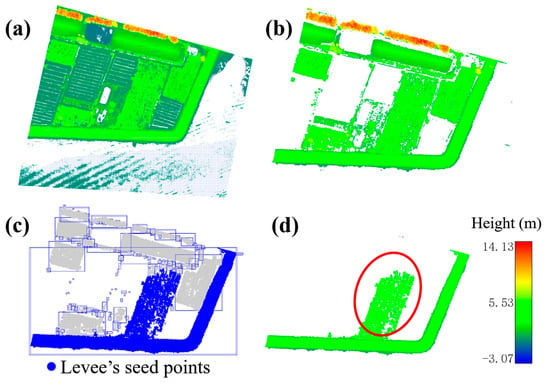
Figure 8.
Seed point selection processes: (a) las data of Levee 1; (b) CSF-filtered non-ground points; (c) a set of seed points constructed by connected region markers; (d) levee’s seed point set with the vegetation points within the red circle being incorrectly classified.
2.3.4. Evaluation
From the extraction results of the four types of levee point clouds in the aforementioned study regions, the method presented in this paper successfully extracted complete levees within the study range. To comprehensively evaluate these results, qualitative analysis alone is insufficient; a quantitative assessment of the algorithm’s effectiveness is also necessary for a thorough evaluation and analysis of the levee point cloud extraction results achieved in this study.
Due to the absence of standard levee point cloud data in the study regions for reference, this paper combines the Digital Orthophoto Map (DOM) of each levee in the study area. Levee point clouds are extracted through manual interactive classification to serve as a reference for evaluation. The effectiveness of the levee point cloud extraction is analyzed based on the accuracy metrics defined by Heipke et al. [44], namely correctness, completeness, and quality indices. They are computed as follows.
where TP denotes the number of levee points correctly segmented; FN denotes the number of levee points that are not segmented; and FP denotes the number of levee points incorrectly segmented.
2.3.5. Adaptive Normal Vector Estimation
- (1)
- Normal vector computation
After determining the local neighborhood of the point cloud, geometric features such as curvature, roughness, and dimensional characteristics of the point cloud can be computed. The surface variation in a local neighborhood of a point is indicated by the change in direction of the normal vector at the microtangent plane of the point. Greater surface variation in the local area implies a larger change in the direction of the normal vectors and, consequently, a larger variance in the angle of normal vectors. This variation is strictly dependent on the precise representation of local point cloud normal vectors, as illustrated in Figure 9.
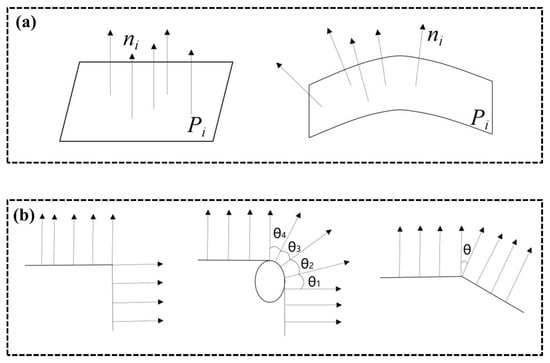
Figure 9.
Normal vector (a) distribution and (b) orientation of levee plane.
We employ a method based on local surface fitting to calculate the normal vectors of point clouds. The PCA embedded in this method constructs a covariance matrix and identifies the normal vector of a point as corresponding to the smallest eigenvalue. The normal vector results calculated from point clouds with different neighborhood sizes exhibit variations [45]. As illustrated in Figure 10, the normal vectors represented by the red dots differ depending on the neighborhood size. The normal vector calculated using PCA within the neighborhood indicated by the solid black circle is shown as a solid black arrow, while the normal vector for the same point calculated with PCA within the larger neighborhood indicated by the dashed black circle is shown as a dashed black arrow. As can be seen in the figure, the normal vectors obtained from the two different neighborhood ranges are not consistent. The normal vector of the red point calculated with the smaller neighborhood (solid black line) more accurately reflects the actual condition. In contrast, the normal vector calculated with the larger neighborhood (dashed black line) does not truly represent the point’s normal vector. However, for the red point on a locally flat surface in Figure 10b, the normal vector estimated with the larger neighborhood (dashed black line) is more representative of the actual situation.
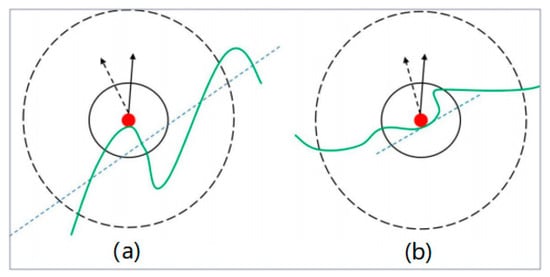
Figure 10.
Impact of different neighborhood sizes on the estimation results of normal vectors about (a) large rolling region and (b) flat region. Large neighborhoods are denoted with dashed lines and small ones with solid lines; circles show the range and arrows point to the normal vector direction.
- (2)
- Determination of the optimal neighborhood based on PCA
To accurately reflect the variations in local surface normal vectors, it is necessary to calculate point cloud normal vectors using different neighborhood sizes, thus minimizing the impact of errors due to inappropriate neighborhood selection on the estimation of point cloud normal vectors. This study determines the adaptively optimal neighborhood for calculating point cloud normal vectors based on the geometric characteristics of the point cloud data. After PCA is applied, three eigenvalues λ1, λ2, and λ3 and their corresponding eigenvectors v1, v2, and v3 are obtained, with eigenvalues satisfying the condition λ1 ⩾ λ2 ⩾ λ3 > 0. According to the relative size relationship of eigenvalues, the spatial distribution of different point sets can be reflected. The dimensionality relationship of the local neighborhood of the point cloud can also be characterized using three eigenvalues [46]: when λ1 ≫ λ2, λ3≈ 0, the local neighborhood dimension of the point tends to be one-dimensional, meaning that the feature neighborhood of the point cloud locally is linear; when λ1 ≫ λ2 ≈ λ3, the local neighborhood dimension of the point tends to be two-dimensional, meaning that the feature neighborhood of the point cloud locally is a plane; and when λ1 ≈ λ2 ≈ λ3, the local neighborhood dimension of the point tends to be three-dimensional, meaning that the feature neighborhood of the point cloud locally is a surface.
Based on these characteristics, local neighborhood dimensional features of the point cloud can be mathematically represented as one-dimensional (1D), two-dimensional (2D), and three-dimensional models through Equation (2) [47]. The spatial distribution characteristics of a point cloud can be inferred by constructing the probability of feature dimensions for the local neighborhood model. Introducing the concept of information entropy helps determine these characteristics, and a local neighborhood entropy function is created to define dimensional attributes. If the point cloud in the local neighborhood is well ordered, its information entropy is smaller, indicating more homogeneous features and a tendency toward a single dimension. Thus, the optimal representation of local spatial features in the point cloud is achieved through the size of this neighborhood.
At this juncture, the optimal neighborhood size can be determined by identifying the local neighborhood size with the minimum information entropy:
Cohen improved the information entropy function by replacing the local neighborhood dimensional feature model of the point cloud with an eigenvalue model of the local neighborhood covariance matrix [48]. The eigenvalues obtained from different neighborhood sizes are inserted into Equation (5) to calculate Eη. The optimal neighborhood size K for the point cloud corresponds to the smallest value of Eη
where , and i = 1, 2, and 3.
Summarizing the above, the specific steps for estimating point cloud normal vectors based on an adaptively optimal neighborhood can be outlined as follows: First, initialize the neighborhood search radius to the minimum value of the set neighborhood radius, and set the maximum value and step size for the radius. Next, construct the local least squares plane P for the point cloud pi using the minimum neighborhood radius and solve for eigenvalues and eigenvectors using PCA. Then, calculate the information entropy value based on the eigenvalues obtained from PCA. Increase the search radius size according to the set step size and repeat the calculation of information entropy. The iteration ends when the neighborhood search radius reaches the set maximum value. Compare the information entropy values calculated under different search neighborhood radii; the optimal neighborhood for the point is the search neighborhood radius size corresponding to the minimum entropy value. The specific workflow is illustrated in Figure 11.
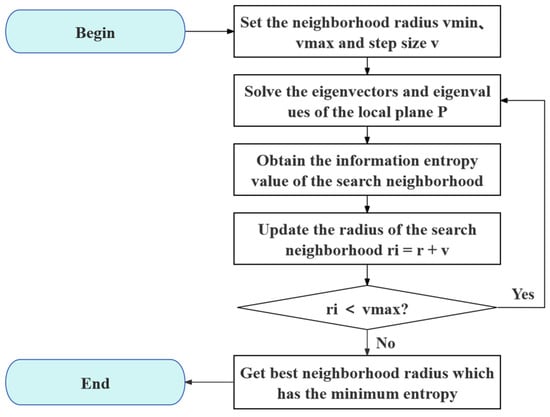
Figure 11.
Flowchart of levee point cloud extraction process.
2.3.6. Deformation Detection of Levee Depression
Levees face numerous damages during their prolonged usage, with slope collapses and depressions being common forms of levee deterioration, as shown in Figure 12. To achieve more refined and dynamic management of levees in coastal regions, it is essential to enhance the monitoring of local deformations such as collapses and damages due to human alterations.
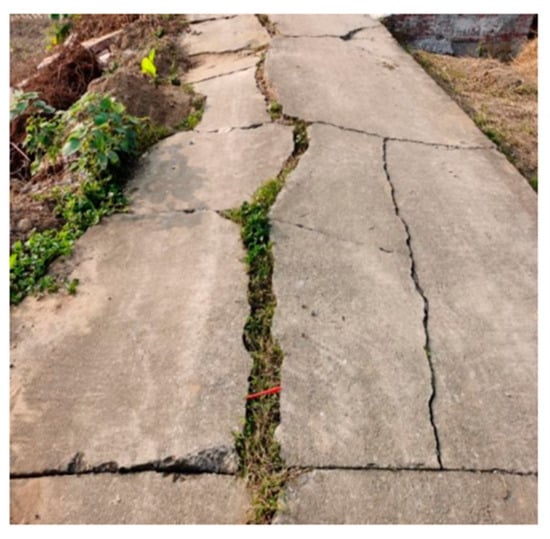
Figure 12.
A damaged levee surface.
Depression deformations in levees most frequently manifest along the waterside slope, spanning from the jetty to the crest. These deformations originate at the waterside shoulder of the crest and extend downward, potentially culminating in breaches at the crest. Surface alterations within these depressed areas are markedly more conspicuous when contrasted with the regular levee surfaces. As the topology transitions from the normative to the depressed state, the point cloud normal vectors also exhibit significant alterations, with their directions becoming increasingly erratic. This results in an escalated variance of the angles between the normal vectors within the point clouds of the depressed levee sections. Consequently, this variance serves as a quantitative indicator for the identification of localized depression deformations in levee structures.
The detection process commences with the precise estimation of the normal vectors pertaining to the levee point cloud data, employing a method predicated on an adaptive selection of the optimal neighborhood size. Subsequently, the variance of the angles between these normal vectors, which is computed utilizing the adaptively optimal neighborhood size, is employed as the benchmark for delineating characteristic points indicative of levee depression deformations. The ensuing stage involves refining the dataset through the exclusion of noise points with the aid of ancillary data such as elevation and slope maps. The clustering of the depression deformation point clouds of the levee is then executed to assemble the definitive collection of depression deformation point clouds. The comprehensive methodology and resultant data are elucidated in Figure 13.

Figure 13.
Flowchart of depressed levee region detection from point clouds.
3. Results
3.1. Extraction of Levee Point Cloud
3.1.1. Extraction Results
Based on the non-ground points obtained from CSF filtering in each levee study area, the point clouds are preliminarily classified using the aforementioned feature values of the degree of change in normal vectors. The connected region labeling method is employed to construct a set of levee seed points. Subsequently, a region-growing algorithm based on the seed point set is used to further differentiate between levee and non-levee points, effectively extracting the levee point clouds. During the extraction process using the region-growing algorithm based on seed point sets, a critical parameter is the threshold value θ of the angle between normal vectors, which is used to determine the growth criteria. Considering the adaptability of the proposed algorithm to different types of levee structures and scenarios, as well as the subsequent detection of depression deformation in levee point clouds, the threshold values θ for the angle between normal vectors for the region growing of the seed point set in each levee study area were determined through multiple experiments to be 10°, 12°, 15°, and 18°, respectively. By setting appropriate threshold values for the angle between normal vectors and height differences, the region-growing process yields results for the four types of levee point clouds in the study area, as illustrated in Figure 14, Figure 15, Figure 16 and Figure 17.
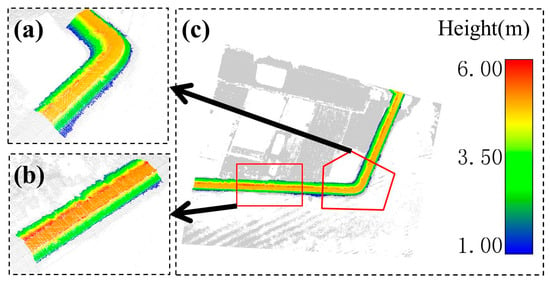
Figure 14.
Extracted point cloud based on the proposed workflow for (a) band part and (b) straight part of (c) Levee 1.
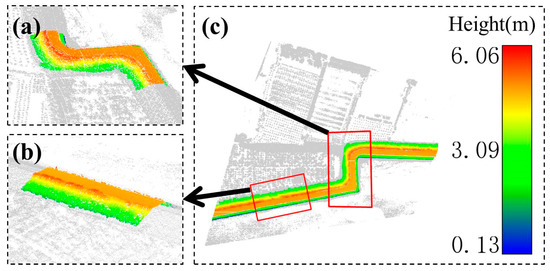
Figure 15.
Extracted point cloud based on the proposed workflow for (a) band part and (b) straight part of (c) Levee 2.
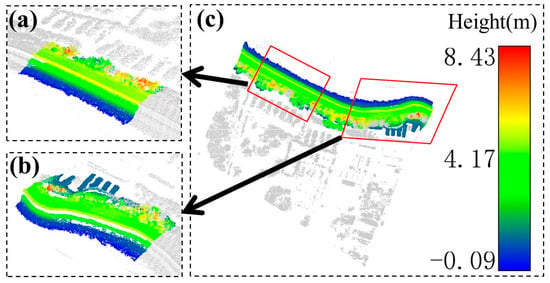
Figure 16.
Extracted point cloud based on the proposed workflow for (a) straight part and (b) band part of (c) Levee 3.
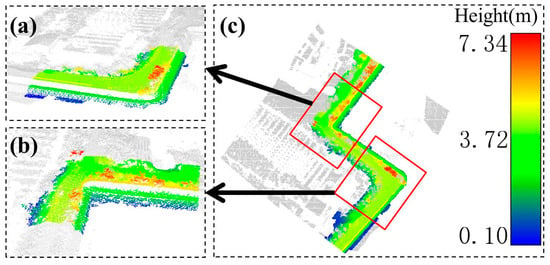
Figure 17.
Extracted point cloud based on the proposed workflow for (a) band part and (b) straight part of (c) Levee 4.
3.1.2. Comparative Evaluation of Different Research Methods
- (1)
- With traditional edge detection method
An analytical comparison is conducted between levees delineated utilizing the conventional Canny edge detection method [49] and those discerned through the bespoke levee-adaptive region-growing method, as exhibited in Figure 18. The comparative results are graphically represented within this figure, where the contours of levees identified by the algorithm are encapsulated within a red boundary box, highlighting the precision of the proposed extraction process.
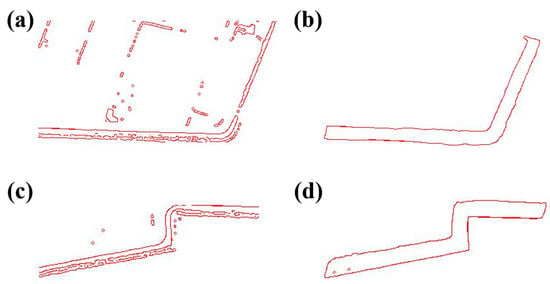
Figure 18.
Traditional Canny edge detection algorithm for Levees 1 and 2 (a,c); levee-adaptive region-growing algorithm for Levees 1 and 2 (b,d).
- (2)
- With traditional region-growing algorithms
Additionally, the proficiency of the conventional region-growing technique in the context of levee extraction is critically assessed against the performance of the tailored levee-adaptive region-growing method. This comparative analysis is visually encapsulated in Figure 19. The figure highlights zones labeled (1) to (5), which correspond to the erroneously segmented points that are not characteristic of the levee structure, thereby providing a clear demarcation of the limitations inherent in the traditional approach when contrasted with the specialized method.
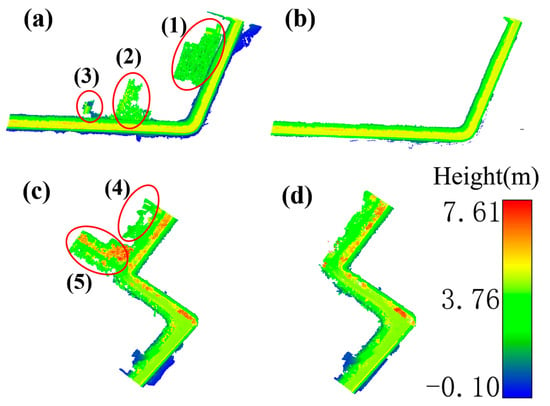
Figure 19.
Seed selection by traditional region-growing algorithm for Levees 1 and 2 (a,c) with the vegetation points within the red circles being incorrectly classified and levee-adaptive region-growing algorithm for Levees 1 and 2 (b,d).
3.1.3. Evaluation of Accuracy
As delineated in Figure 20, the correctness index is quantified as the proportion of correctly identified levee points relative to the aggregate of levee points extracted, thereby serving as an indicator of the algorithm’s precision. The metrics of detection accuracy and quality rates, as derived from the levee point cloud extractions via the levee-adaptive region-growing method across all studied levees (Levees 1–4), are observed to outperform those yielded by the traditional region-growing approach. Completeness is articulated as the ratio of accurately extracted levee point clouds to the bona fide totality of existing levee point clouds, reflecting the authentic rate of the algorithm’s extraction capacity. Quality is employed as an overarching metric reflecting the total efficacy of the algorithm’s extraction process. For detailed numerical values, Table 2 should be consulted.
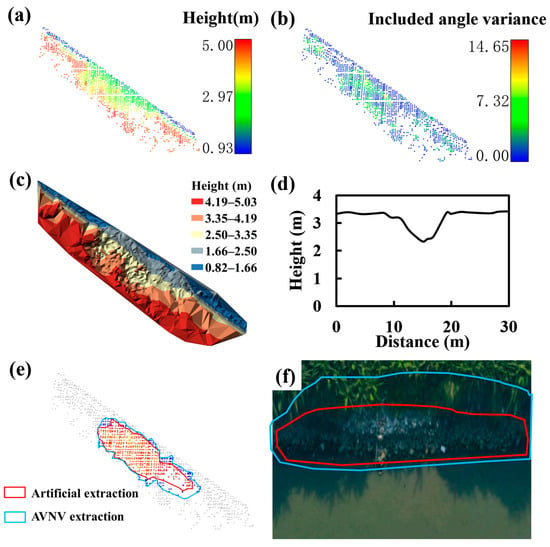
Figure 20.
Statistical comparison between traditional region-growing and levee-adaptive region-growing algorithms: (a) detection rate; (b) accuracy rate; (c) quality rate.

Table 2.
Statistics of extraction evaluation indices of four types of levees in the study area.
3.1.4. Results Analysis
Figure 14, Figure 15, Figure 16 and Figure 17 display schematic diagrams of the extraction results for four types of levee point clouds. It is evident that the colored points representing the levee point clouds are distinctly separated from the gray points representing non-levee point clouds, indicating effective extraction of levee point clouds in each study area. Furthermore, the method effectively extracts not only the structurally regular, standard levees (Levee 1 and Levee 2) in the study regions but also the irregular, non-standard levees (Levee 3 and Levee 4). This demonstrates the adaptability of the levee-adaptive region-growing algorithm based on seed point sets for different types of levee point clouds in the study area. Additionally, the various terrains and vegetation types in the study area contribute to the complexity of the surface features, yet the algorithm adapts well to these diverse scenarios, making it suitable for most levee point cloud extraction and analysis contexts.
- (1)
- Qualitative analysis
A comprehensive analysis of the extracted point clouds from different levees in the study area allows for a rapid assessment of the general distribution and basic outline boundaries of the levees. Moreover, for more regular, standard levees in the study area, the algorithm also effectively extracts point clouds that represent detailed local morphological information of the levees. As shown in the detailed diagrams of local levees in Figure 14 and Figure 15 (parts b and c), the point clouds at different locations of levees are completely extracted with rich detailed information, especially at the turning points of the levees. The algorithm also achieves complete extraction of the point clouds of the landward slopes and jetties of the levees in the study area.
However, with the increased complexity of levee forms and diversity of the surrounding scenarios, there is a slight decline in the effectiveness of point cloud extraction. For instance, in Levee 3 and Levee 4, the extraction of the levee slopes is incomplete, and some parts of the levee walls are not fully extracted. Additionally, there are some structural omissions in the extracted levee point clouds, mainly located at the edges of the levee structures and the transition between the slopes and the crest, as shown in parts c of Figure 16 and Figure 17. These edge omissions occur because the angles between the normal vectors of the levee point clouds and adjacent vegetation points are significantly different, leading to misclassification as non-levee points during region growing.
Internal omissions are due to low point cloud density in some regions of the levee slopes (due to the direction of laser scanning) or irregular, non-standard levee structures covered with vegetation, failing to meet the algorithm criteria during region growing, resulting in missing point clouds. Furthermore, there are slight vegetation coverages on the crest and landward slopes of the levees, as shown in Figure 16b and Figure 17b. This is mainly because the non-standard levees have vegetation cover on their crests, which is closely connected to the levees and meets the criteria set for region growing, leading to misclassification as levee point clouds. Also, in Levee 3 and Levee 4, there are river floodplain point clouds on the waterside base, as indicated by the red circles in Figure 15c. This occurs because the floodplain point clouds have smaller angles between normal vectors similar to the slope, and their planar characteristics are strong, leading to misidentification as levee point clouds.
Nevertheless, notwithstanding potential disturbances from ground objects, the results obtained through the levee-adaptive region-growing algorithm remain markedly superior to those derived from both the traditional region-growing algorithm and the traditional Canny edge detection method. In comparison with the other two types of algorithms, our approach, on one hand, mitigates interference from other structures in the vicinity and, on the other hand, successfully achieves comprehensive extraction of the levee structure. Moreover, it effectively delineates the boundary between the levee and the ground features associated with it (Figure 18 and Figure 19).
- (2)
- Quantitative analysis
Based on the statistical results in Table 2 and Figure 20, the detection rates of the levees using the algorithm in this study are 95%, 93%, 81%, and 85%, respectively; the correctness rates are 87%, 86%, 84%, and 83%, respectively; and the quality indices are 83%, 81%, 75%, and 72%, respectively. Compared to traditional region-growing algorithms, the method in this study achieves higher detection rates, correctness rates, and quality indices, with quality improvements of 11%, 10%, 8%, and 5%, respectively, indicating effective extraction of levee point clouds. Overall, the algorithm achieves good detection and correctness rates, but the quality of levee point cloud extraction decreases with the increasing complexity of levee forms and diversity of scenarios in the study area. This decrease is due to the more complex structures of Levee 3 and Levee 4, which are not standard levee structures and are covered with substantial vegetation. These vegetation point clouds are misclassified as levee point clouds during region growing.
3.2. Analysis of Deformation Detection Results
The experiment selected point cloud data from three different levee depression regions. Following the levee depression deformation identification process, the point cloud data were processed, and the results were compared with manually extracted levee depression point clouds. The identification results of each levee depression region are shown in Figure 21, Figure 22 and Figure 23.
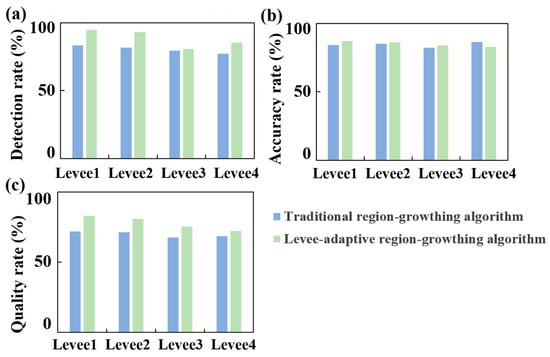
Figure 21.
Identified levee deformation of Region 1: (a) original point cloud; (b) angle variance of the normal vectors; (c) elevation (TIN); (d) change in levee crown; (e) reconstruction of levee depression region; (f) levee depression region.
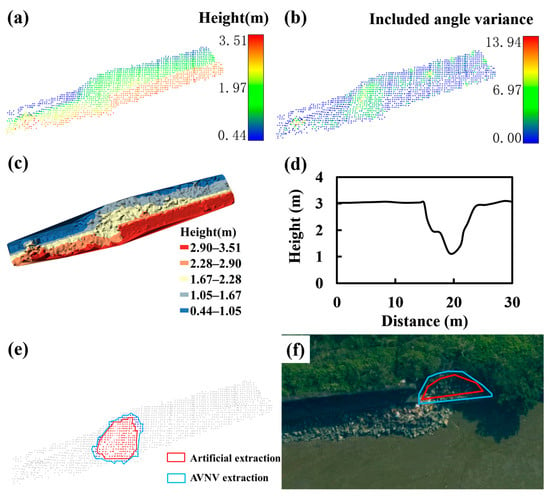
Figure 22.
Identified levee deformation of Region 2: (a) original point cloud; (b) angle variance of the normal vectors; (c) elevation (TIN); (d) change in levee crown; (e) reconstruction of levee depression region; (f) levee depression region.
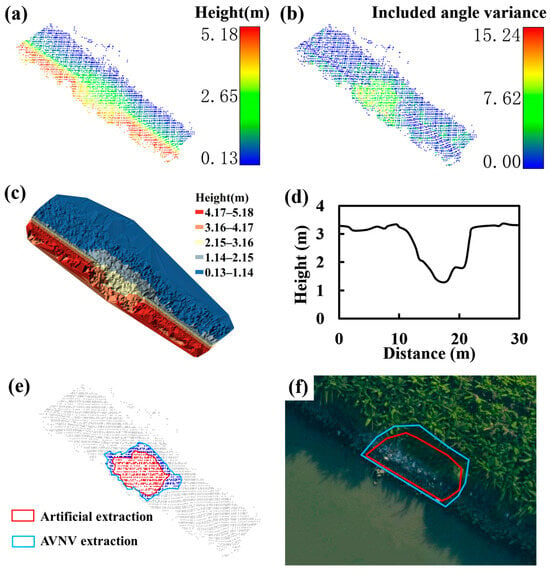
Figure 23.
Identified levee deformation Region 3: (a) original point cloud; (b) angle variance of the normal vectors; (c) elevation (TIN); (d) change in levee crown; (e) reconstruction of levee depression region; (f) levee depression region.
Figure 21a, Figure 22a and Figure 23a display the original point cloud elevation diagrams of each levee depression region. Through the levee depression deformation identification process, the variance of the point cloud normal vectors’ angles in each depression region was calculated, as shown in Figure 21b, Figure 22b and Figure 23b. It can be observed from Figure 21b, Figure 22b and Figure 23b that the levee deformation regions are located in the middle sections of the levees, and the variance of the point cloud normal vectors’ angles in these regions is significantly greater than that of the normal levee point clouds. Typically, the variance of normal vectors’ angles for regular levee point clouds ranges from 0 to 5 rad2, while for deformed levees, it ranges from 5 to 10 rad2, and in some depression regions, the values even exceed 10 rad2.
Additionally, to more clearly observe the results, irregular triangular network elevation diagrams generated from each levee depression region’s point cloud data were created, as shown in Figure 21c, Figure 22c and Figure 23c. From these diagrams, the general shape of the levee can be clearly seen, with varying crest elevations in each figure. Changes in elevation are drastic in regions where depression deformations occur on the crest. To further investigate these changes, the point cloud elevations along the central axis of the crest were extracted, as shown in Figure 21d, Figure 22d and Figure 23d. Normal crest elevations are around 3 to 3.5 m, but in regions where levee depressions occur, the crest elevations drop sharply (as indicated by the red lines in the figures) to between 1 and 3 m. This indicates that when a flat levee crest undergoes depression, there is a sudden drop in elevation, followed by a return to normal height, and the elevations in the depression regions are generally lower than the normal crest elevation of 3 m, making these regions highly susceptible to flood erosion and breach.
In Figure 21e, Figure 22e and Figure 23e shows the reconstruction diagrams of the levee depressions after removing anomalies, with blue point clouds representing the identified deformed regions of the levee. To further validate the correctness of the identified levee depression regions, DOM actual images were used for comparative analysis, as shown in Figure 21f, Figure 22f and Figure 23f. Comparing the reconstructed diagrams of the levee depression regions with the real orthophoto shows that the levee depression regions identified by this method largely correspond with the actual conditions of the levee, although the identified regions are slightly smaller than the actual depression regions. This discrepancy may be due to the influence of the normal morphology point clouds on the boundary of the depression area, leading to similar results in the calculation of point cloud normal vector angles.
The identification results are significantly influenced by the point cloud sampling density; regions with higher point cloud density are more easily identified than those with lower density. This is because regions with higher point cloud density provide more points for the algorithm to calculate, resulting in local normal vectors that more accurately reflect the local changes in the levee, as shown in Figure 23. However, if the levee surface is covered with vegetation, this method may mistakenly classify vegetation point clouds as deformed point clouds, as shown in Figure 21b. This misclassification occurs because vegetation point clouds are distributed more chaotically, causing the local levee surface to be discontinuous and have large curvature variations, leading to larger calculated variance values of normal vector angles in the adaptively optimal neighborhood and thus being misidentified as levee depression deformation point clouds. However, combined with the optical image data acquired at the same time, we can further identify this scene.
4. Discussion
This paper applies airborne LiDAR technology to levee point cloud extraction, achieving a method suitable for the automatic extraction of levee point clouds and the detection of local depression deformations in levees. This provides technical reserves and scientific support for the surveying, investigation, and management of levees. The main innovations of this paper are as follows:
In classifying and extracting levee point clouds based on non-ground points, this paper improves the region-growing algorithm based on seed point sets. It introduces the degree of variation in the normal vectors of levee point clouds for preliminary classification. Subsequently, seed point sets are constructed using point cloud connected region labeling for region growing, enabling effective extraction of different types of levee point clouds and offering a practical solution for the automatic extraction of levee point clouds. The region-growing algorithm holds notable advantages in the realm of point cloud segmentation. Its inherent simplicity and intuitiveness make it accessible, allowing for a straightforward understanding of the segmentation process. The method excels in adapting to local characteristics, effectively capturing the structure and patterns within a given region. Its robustness against noise enhances its reliability, as it can mitigate the impact of isolated outliers. Furthermore, the resulting segmentation often exhibits local consistency, ensuring that points within a region share similar attributes and form coherent segments.
Change detection techniques applied to point cloud data can reveal subtle deformations that may not be apparent through traditional inspection methods through single-phase data. By using region growing for the levee detection, if there is no adaption considered, the sensitivity of the method to parameter choices, including seed point selection criteria and similarity thresholds. Inappropriate parameter settings can lead to suboptimal segmentation results, necessitating careful tuning. Additionally, the computational intensity of the region-growing algorithm, particularly for large point clouds, poses a challenge to efficiency. The method’s local nature may struggle with varying point densities and may not effectively capture global context information, potentially resulting in over-segmentation or under-segmentation. Moreover, the dependency on seed point selection adds another layer of complexity, as inaccurate seed choices can lead to incomplete or inaccurate segmentation outcomes. Nevertheless, point cloud data provide quantitative information about the elevation, shape, and spatial distribution of the levee. Through detailed analysis of the point cloud, engineers can quantify deformations, identify regions of concern, and assess the severity of the changes.
In the extraction of levee point clouds from non-ground points, this study enhances the region-growing algorithm by refining seed point sets and incorporating variations in levee point cloud normal vectors for initial classification. It utilizes connected point cloud regions marked with seed points and employs the region-growing algorithm for the effective extraction of different levee point cloud types, offering a practical solution for automated extraction. The study also introduces a method for detecting levee depressions and deformations based solely on single-phase point cloud data. Leveraging the disorderly distribution of normal vectors, it uses an adaptive optimal neighborhood calculation to identify characteristic points, allowing rapid detection of regions experiencing levee depressions and deformations.
5. Conclusions
Airborne LiDAR technology, as a unique geospatial information acquisition technology, has been widely applied in fields such as mapping geographic information, urban planning, and environmental protection. The hardware system of airborne LiDAR technology has been extensively studied, and the focus of related research has shifted to point cloud post-processing and analysis. Point cloud filtering and the extraction of different geometric features using airborne LiDAR remain research hotspots. Research on building extraction based on airborne LiDAR point cloud data has mainly focused on houses, roads, and power towers and relatively less on levee point cloud extraction in water conservancy engineering facilities. Additionally, multi-phase point cloud data are commonly used for the deformation monitoring of buildings. Based on this, this paper conducts research on airborne LiDAR point cloud filtering, the extraction of different types of levee point clouds, and the detection of levee depression deformations using single-phase point cloud data. The main research contents and results are as follows:
A levee-adaptive region-growing algorithm based on seed point sets was developed for extracting levee point clouds. The algorithm first calculates the degree of variation in point cloud normal vectors as the criterion for selecting levee seed points, obtaining discrete seed points. Then, seed point sets are constructed through point cloud connected region labeling, and region growing is performed using the angle and height difference of point cloud normal vectors as growth criteria. The results show that the proposed algorithm effectively extracts point clouds of four different types of levees, retaining detailed information about the levees. In the cases we studied, the overall quality of levee point cloud extraction was 83%, 81%, 75%, and 72%, respectively, representing improvements of 11%, 10%, 8%, and 5% over traditional methods based on single seed points. This method has high accuracy in extracting both artificially constructed standard and non-standard levee point clouds and can automatically extract levee point clouds with minimal human intervention, demonstrating significant practical value.
A method was developed to detect levee depression deformations using single-phase levee point cloud data by calculating the variance of normal vector angles. To accurately represent the local morphology of the levee point clouds, the method uses an adaptively optimal neighborhood to solve for normal vectors. Based on the experiment, the results showed that the method significantly improved the estimation accuracy of point cloud normal vectors. Applied to three levee depression detection experiments, the method effectively detected regions of levee depression deformations using single-phase point cloud data. In comparison with another commonly used method, our approach, on one hand, mitigates interference from other structures in the vicinity and, on the other hand, successfully achieves comprehensive extraction of the levee structure. Moreover, it effectively delineates the boundary between the levee and the ground features associated with it.
The primary focus of this paper is on the filtering of airborne LiDAR point cloud data, the extraction of levee point clouds, and the detection of levee deformations, yielding promising experimental results. However, there are regions for improvement, including the fusion of multi-source data to enhance the accuracy of levee building extraction, the potential application of deep learning, particularly neural network algorithms, for point cloud classification in levee contexts, and the need to combine geometric structure information and multi-source remote sensing information to accurately identify the deformation of the levees. The study suggests future research directions to address these aspects, aiming for a more comprehensive understanding and application of point cloud data in levee analysis and monitoring.
Author Contributions
Conceptualization, X.W. and Y.H.; methodology, X.W.; software, Y.W. (Yidan Wang) and X.L.; validation, Y.W. (Yidan Wang), Y.H., X.L., Y.W. (Yuli Wang), Y.L. and T.O.C.; formal analysis, X.W., X.L., Y.W. (Yuli Wang), Y.L. and T.O.C.; investigation, X.W., Y.H. and T.O.C.; resources, X.W., Y.W. (Yidan Wang), Y.H., X.L. and Y.L.; data curation, Y.W. (Yidan Wang), X.L., Y.W. (Yuli Wang) and Y.L.; writing—original draft preparation, X.W.; writing—review and editing, Y.H. and T.O.C.; visualization, Y.W. (Yidan Wang), X.L., Y.W. (Yuli Wang) and Y.L.; supervision, X.W., Y.H. and T.O.C.; project administration, Y.H. and T.O.C.; funding acquisition, X.W. and Y.H. All authors have read and agreed to the published version of the manuscript.
Funding
This research was funded by the National Natural Science Foundation of China (42001026) and the National Key R&D Program of China (2021YFC3001000).
Data Availability Statement
The airborne Lidar data used in this study are unavailable due to policy restrictions.
Acknowledgments
The anonymous reviewers are acknowledged for their valuable comments.
Conflicts of Interest
Author Xionghui Liao was employed by the company Guangzhou Urban Planning & Design Survey Research Institute Co., Ltd., in China. The remaining authors declare that the research was conducted in the absence of any commercial or financial relationships that could be construed as a potential conflict of interest.
References
- Prashar, N.; Lakra, H.S.; Shaw, R.; Kaur, H. Urban Flood Resilience: A comprehensive review of assessment methods, tools, and techniques to manage disaster. Prog. Disaster Sci. 2023, 20, 100299. [Google Scholar] [CrossRef]
- Chan, F.K.S.; Yang, L.E.; Scheffran, J.U.R.; Mitchell, G.; Adekola, O.; Griffiths, J.A.; Chen, Y.; Li, G.; Lu, X.; Qi, Y.; et al. Urban flood risks and emerging challenges in a Chinese delta: The case of the Pearl River Delta. Environ. Sci. Policy 2021, 122, 101–115. [Google Scholar] [CrossRef]
- Mishra, A.; Mukherjee, S.; Merz, B.; Singh, V.P.; Wright, D.B.; Villarini, G.; Paul, S.; Kumar, D.N.; Khedun, C.P.; Niyogi, D.; et al. An Overview of Flood Concepts, Challenges, and Future Directions. J. Hydrol. Eng. 2022, 27, 3122001. [Google Scholar] [CrossRef]
- Fang, X.; Li, J.; Ma, Q. Integrating green infrastructure, ecosystem services and nature-based solutions for urban sustainability: A comprehensive literature review. Sustain. Cities Soc. 2023, 98, 104843. [Google Scholar] [CrossRef]
- Freire Diogo, A.; Antunes do Carmo, J. Peak Flows and Stormwater Networks Design—Current and Future Management of Urban Surface Watersheds. Water 2019, 11, 759. [Google Scholar] [CrossRef]
- Anders, K.; Winiwarter, L.; Mara, H.; Lindenbergh, R.; Hfle, B. Fully automatic spatiotemporal segmentation of 3D LiDAR time series for the extraction of natural surface changes. ISPRS J. Photogramm. Remote Sens. 2021, 173, 297–308. [Google Scholar] [CrossRef]
- Ali, M.E.N.O.; Taha, E.D.; Mohamed, M.H.A.; Mandouh, A.A. Generation of digital terrain model from multispectral LiDar using different ground filtering techniques. Egypt. J. Remote Sens. Space Sci. 2021, 24, 181–189. [Google Scholar] [CrossRef]
- Shinde, R.C.; Durbha, S.S.; Potnis, A.V. LidarCSNet: A deep convolutional compressive sensing reconstruction framework for 3D airborne Lidar point cloud. ISPRS J. Photogramm. Remote Sens. 2021, 180, 313–334. [Google Scholar] [CrossRef]
- Ceccato, F.; Simonini, P. The effect of heterogeneities and small cavities on levee failures: The case study of the Panaro levee breach (Italy) on 6 December 2020. J. Flood Risk Manag. 2023, 16, e12882. [Google Scholar] [CrossRef]
- Chotkan, S.; van der Meij, R.; Klerk, W.J.; Vardon, P.J.; Aguilar-López, J.P. A Data-Driven Method for Identifying Drought-Induced Crack-Prone Levees Based on Decision Trees. Sustainability. 2022, 14, 6820. [Google Scholar] [CrossRef]
- Wang, X.; Wang, X.; Zhai, J.; Li, X.; Huang, H.; Li, C.; Zheng, J.; Sun, H. Improvement to flooding risk assessment of storm surges by residual interpolation in the coastal areas of Guangdong Province, China. Quat. Int. 2017, 453, 1–14. [Google Scholar] [CrossRef]
- Silva-Tulla, F.; Nicholson, P.G. Embankments, Dams, and Slopes—Geology of the New Orleans Area and the Canal Levee Failures, GSP 161 ed.; American Society of Civil Engineers: Reston, VA, USA, 2007; pp. 1–12. [Google Scholar]
- Kahl, D.T.; Schubert, J.E.; Jong-Levinger, A.; Sanders, B.F. Grid edge classification method to enhance levee resolution in dual-grid flood inundation models. Adv. Water Resour. 2022, 168, 104287. [Google Scholar] [CrossRef]
- Vosselman, G.; Maas, H. Airborne and Terrestrial Laser Scanning; Whittles Publishing: Dunbeath, UK, 2010; pp. 1–11. ISBN 978-1-904445-87-6. [Google Scholar]
- Gargoum, S.A.; Basyouny, K.E. A literature synthesis of LiDAR applications in transportation: Feature extraction and geometric assessments of highways. Giscience Remote Sens. 2019, 56, 864–893. [Google Scholar] [CrossRef]
- Sharma, M.; Garg, R.D.; Badenko, V.; Fedotov, A.; Min, L.; Yao, A. Potential of airborne LiDAR data for terrain parameters extraction. Quat. Int. 2021, 575–576, 317–327. [Google Scholar] [CrossRef]
- Haithcoat, T.L.; Song, W.; Hipple, J.D. Building footprint extraction and 3-D reconstruction from LIDAR data. In Proceedings of the IEEE/ISPRS Joint Workshop on Remote Sensing and Data Fusion over Urban Areas (Cat. No.01EX482), Rome, Italy, 8–9 November 2001; pp. 74–78. [Google Scholar]
- Rottensteiner, F.; Briese, C. A new method for building extraction in urban areas from high-resolution LiDAR data. Int. Arch. Photogramm. Remote Sens. Spat. Inf. Sci. 2001, 34, 295–301. [Google Scholar]
- Niemeyer, J.; Rottensteiner, F.; Soergel, U. Contextual classification of lidar data and building object detection in urban areas. ISPRS J. Photogramm. Remote Sens. 2014, 87, 152–165. [Google Scholar] [CrossRef]
- Donnell, J.; Truong-Hong, L.; Boyle, N.; Corry, E.; Cao, J.; Laefer, D.F. LiDAR point-cloud mapping of building façades for building energy performance simulation. Autom. Constr. 2019, 107, 102905. [Google Scholar] [CrossRef]
- Gamal, A.; Wibisono, A.; Wicaksono, S.B.; Abyan, M.A.; Hamid, N.; Wisesa, H.A.; Jatmiko, W.; Ardhianto, R. Automatic LIDAR building segmentation based on DGCNN and euclidean clustering. J. Big Data 2020, 7, 102. [Google Scholar] [CrossRef]
- Vu, T.T.; Yamazaki, F.; Matsuoka, M. Multi-scale solution for building extraction from LiDAR and image data. Int. J. Appl. Earth Obs. Geoinf. 2009, 11, 281–289. [Google Scholar] [CrossRef]
- Ramiya, A.M.; Nidamanuri, R.R.; Krishnan, R. Segmentation based building detection approach from LiDAR point cloud. Egypt. J. Remote Sens. Space Sci. 2017, 20, 71–77. [Google Scholar] [CrossRef]
- Miliaresis, G.; Kokkas, N. Segmentation and object-based classification for the extraction of the building class from LIDAR DEMs. Comput. Geosci. 2007, 33, 1076–1087. [Google Scholar] [CrossRef]
- Abdullah, S.; Awrangjeb, M.; Lu, G. LiDAR Segmentation using Suitable Seed Points for 3D Building Extraction. ISPRS Int. Arch. Photogramm. Remote Sens. Spat. Inf. Sci. 2014, XL-3, 1–8. [Google Scholar] [CrossRef]
- Poux, F.; Mattes, C.; Selman, Z.; Kobbelt, L. Automatic region-growing system for the segmentation of large point clouds. Autom. Constr. 2022, 138, 104250. [Google Scholar] [CrossRef]
- Mohla, S.; Pande, S.; Banerjee, B.; Chaudhuri, S. FusAtNet: Dual Attention Based SpectroSpatial Multimodal Fusion Network for Hyperspectral and LiDAR Classification. In Proceedings of the IEEE/CVF Conference on Computer Vision and Pattern Recognition Workshops, Seattle, WA, USA, 14–19 June 2020. [Google Scholar]
- Gilani, S.A.N.; Awrangjeb, M.; Lu, G. An Automatic Building Extraction and Regularisation Technique Using LiDAR Point Cloud Data and Orthoimage. Remote Sens. 2016, 8, 258. [Google Scholar] [CrossRef]
- Akbulut, Z.; Özdemir, S.; Acar, H.; Karsli, F. Automatic Building Extraction from Image and LiDAR Data with Active Contour Segmentation. J. Indian Soc. Remote Sens. 2018, 46, 2057–2068. [Google Scholar] [CrossRef]
- Wierzbicki, D.; Matuk, O.; Bielecka, E. Polish Cadastre Modernization with Remotely Extracted Buildings from High-Resolution Aerial Orthoimagery and Airborne LiDAR. Remote Sens. 2021, 4, 13. [Google Scholar] [CrossRef]
- Kabolizade, M.; Ebadi, H.; Ahmadi, S. An improved snake model for automatic extraction of buildings from urban aerial images and LiDAR data. Comput. Environ. Urban Syst. 2010, 34, 435–441. [Google Scholar] [CrossRef]
- Deligiannakis, G.; Pallikarakis, A.; Papanikolaou, I.; Alexiou, S.; Reicherter, K. Detecting and monitoring arly Post-Fire sliding phenomena using UAV & ndash; SFM photogrammetry and t-LiDAR-Derived point clouds. Fire 2021, 4, 87. [Google Scholar] [CrossRef]
- Demurtas, V.; Orrù, P.E.; Deiana, G. Evolution of deep-seated gravitational slope deformations in relation with uplift and fluvial capture processes in central eastern sardinia (Italy). Land 2021, 10, 1193. [Google Scholar] [CrossRef]
- Schulze, S.; Fischer, E.C.; Mahmoud, H. Framework for Post-Wildfire investigation of buildings: Integrating LiDAR data and numerical modeling. Fire Technol. 2021, 57, 2407–2432. [Google Scholar] [CrossRef]
- Pánek, T.; Břežný, M.; Kapustová, V.; Lenart, J.; Chalupa, V. Large landslides and deep-seated gravitational slope deformations in the Czech Flysch Carpathians: New LiDAR-based inventory. Geomorphology 2019, 346, 106852. [Google Scholar] [CrossRef]
- Jaboyedoff, M.; Derron, M. Chapter 7—Landslide analysis using laser scanners. In Remote Sensing of Geomorphology; Tarolli, P., Mudd, S.M., Eds.; Elsevier: Amsterdam, The Netherlands, 2020; Volume 23, pp. 207–230. ISBN 0928-2025. [Google Scholar]
- Lindenbergh, R.; Pfeifer, N. A statistical deformation analysis of two epochs of terrestrial laser data of a lock. In Proceedings of the 7th Conference On Optical 3-D Measurement Techniques, Vienna, Austria, 3–5 October 2005; Volume 2, pp. 325–330. [Google Scholar]
- Alba, M.; Fregonese, L.; Prandi, F.; Scaioni, M.; Valgoi, P. Structural monitoring of a large dam by terrestrial laser scanning. Int. Arch. Photogramm. Remote Sens. Spat. Inf. Sci. 2006, 36, 51. [Google Scholar]
- Kromer, R.A.; Hutchinson, D.J.; Lato, M.J.; Gauthier, D.; Edwards, T. Identifying rock slope failure precursors using LiDAR for transportation corridor hazard management. Eng. Geol. 2015, 195, 93–103. [Google Scholar] [CrossRef]
- Salles, R.; Campos Velho, H.; Shiguemori, E. Automatic Position Estimation Based on Lidar × Lidar Data for Autonomous Aerial Navigation in the Amazon Forest Region. Remote Sens. 2022, 14, 361. [Google Scholar] [CrossRef]
- Sarıtaş, B.; Kaplan, G. Enhancing Ground Point Extraction in Airborne LiDAR Point Cloud Data Using the CSF Filter Algorithm. Adv. Lidar 2023, 3, 53–61. [Google Scholar]
- Zhang, W.; Qi, J.; Wan, P.; Wang, H.; Xie, D.; Wang, X.; Yan, G. An Easy-to-Use Airborne LiDAR Data Filtering Method Based on Cloth Simulation. Remote Sens. 2016, 8, 501. [Google Scholar] [CrossRef]
- Serifoglu Yilmaz, C.; Yilmaz, V.; Gungor, O. Ground Filtering of a UAV-based Point cloud with the Cloth Simulation Filtering Algorithm, In Proceedings of the International Conference on Advances and Innovations in Engineering (ICAIE). Elazig, Turkey, 21–23 September 2017; pp. 627–630. [Google Scholar]
- Awrangjeb, M.; Fraser, C.S. An Automatic and Threshold-Free Performance Evaluation System for Building Extraction Techniques From Airborne LIDAR Data. IEEE J. Sel. Top. Appl. Earth Obs. Remote Sens. 2014, 7, 4184–4198. [Google Scholar] [CrossRef]
- Mitra, N.J.; Nguyen, A. Estimating Surface Normals in Noisy Point Cloud Data. In SCG ‘03: Proceedings of the Nineteenth Annual Symposium on Computational Geometry, San Diego, CA, USA, 8–10 June 2003; Association for Computing Machinery: New York, NY, USA, 2003; pp. 322–328. [Google Scholar]
- Demantk, E.J.; Mallet, C.; David, N.; Vallet, B. Dimension-based scaling selection in 3D Lidar point clouds. Int. Arch. Photogramm. Remote Sens. Spat. Inf. Sci. 2011, 38, 97–102. [Google Scholar] [CrossRef]
- Guan, H.; Gordon, R. A projection access order for speedy convergence of ART (algebraic reconstruction technique): A multilevel scheme for computed tomography. Phys. Med. Biol. 1994, 39, 2005. [Google Scholar] [CrossRef]
- Cohen, J. A Coefficient of Agreement for Nominal Scales. Educ. Psychol. Meas. 1960, 20, 37–46. [Google Scholar] [CrossRef]
- Canny, J. A Computational Approach To Edge Detection. Pattern Analysis and Machine Intelligence. IEEE Trans. 1986, 6, 679–698. [Google Scholar] [CrossRef]
Disclaimer/Publisher’s Note: The statements, opinions and data contained in all publications are solely those of the individual author(s) and contributor(s) and not of MDPI and/or the editor(s). MDPI and/or the editor(s) disclaim responsibility for any injury to people or property resulting from any ideas, methods, instructions or products referred to in the content. |
© 2024 by the authors. Licensee MDPI, Basel, Switzerland. This article is an open access article distributed under the terms and conditions of the Creative Commons Attribution (CC BY) license (https://creativecommons.org/licenses/by/4.0/).