
Changes in Nitrification Kinetics and Diversity of Canonical Nitrifiers and Comammox Bacteria in a Moving Bed Sequencing Batch Biofilm Reactor—A Long-Term Study


Abstract

1. Introduction
2. Materials and Methods
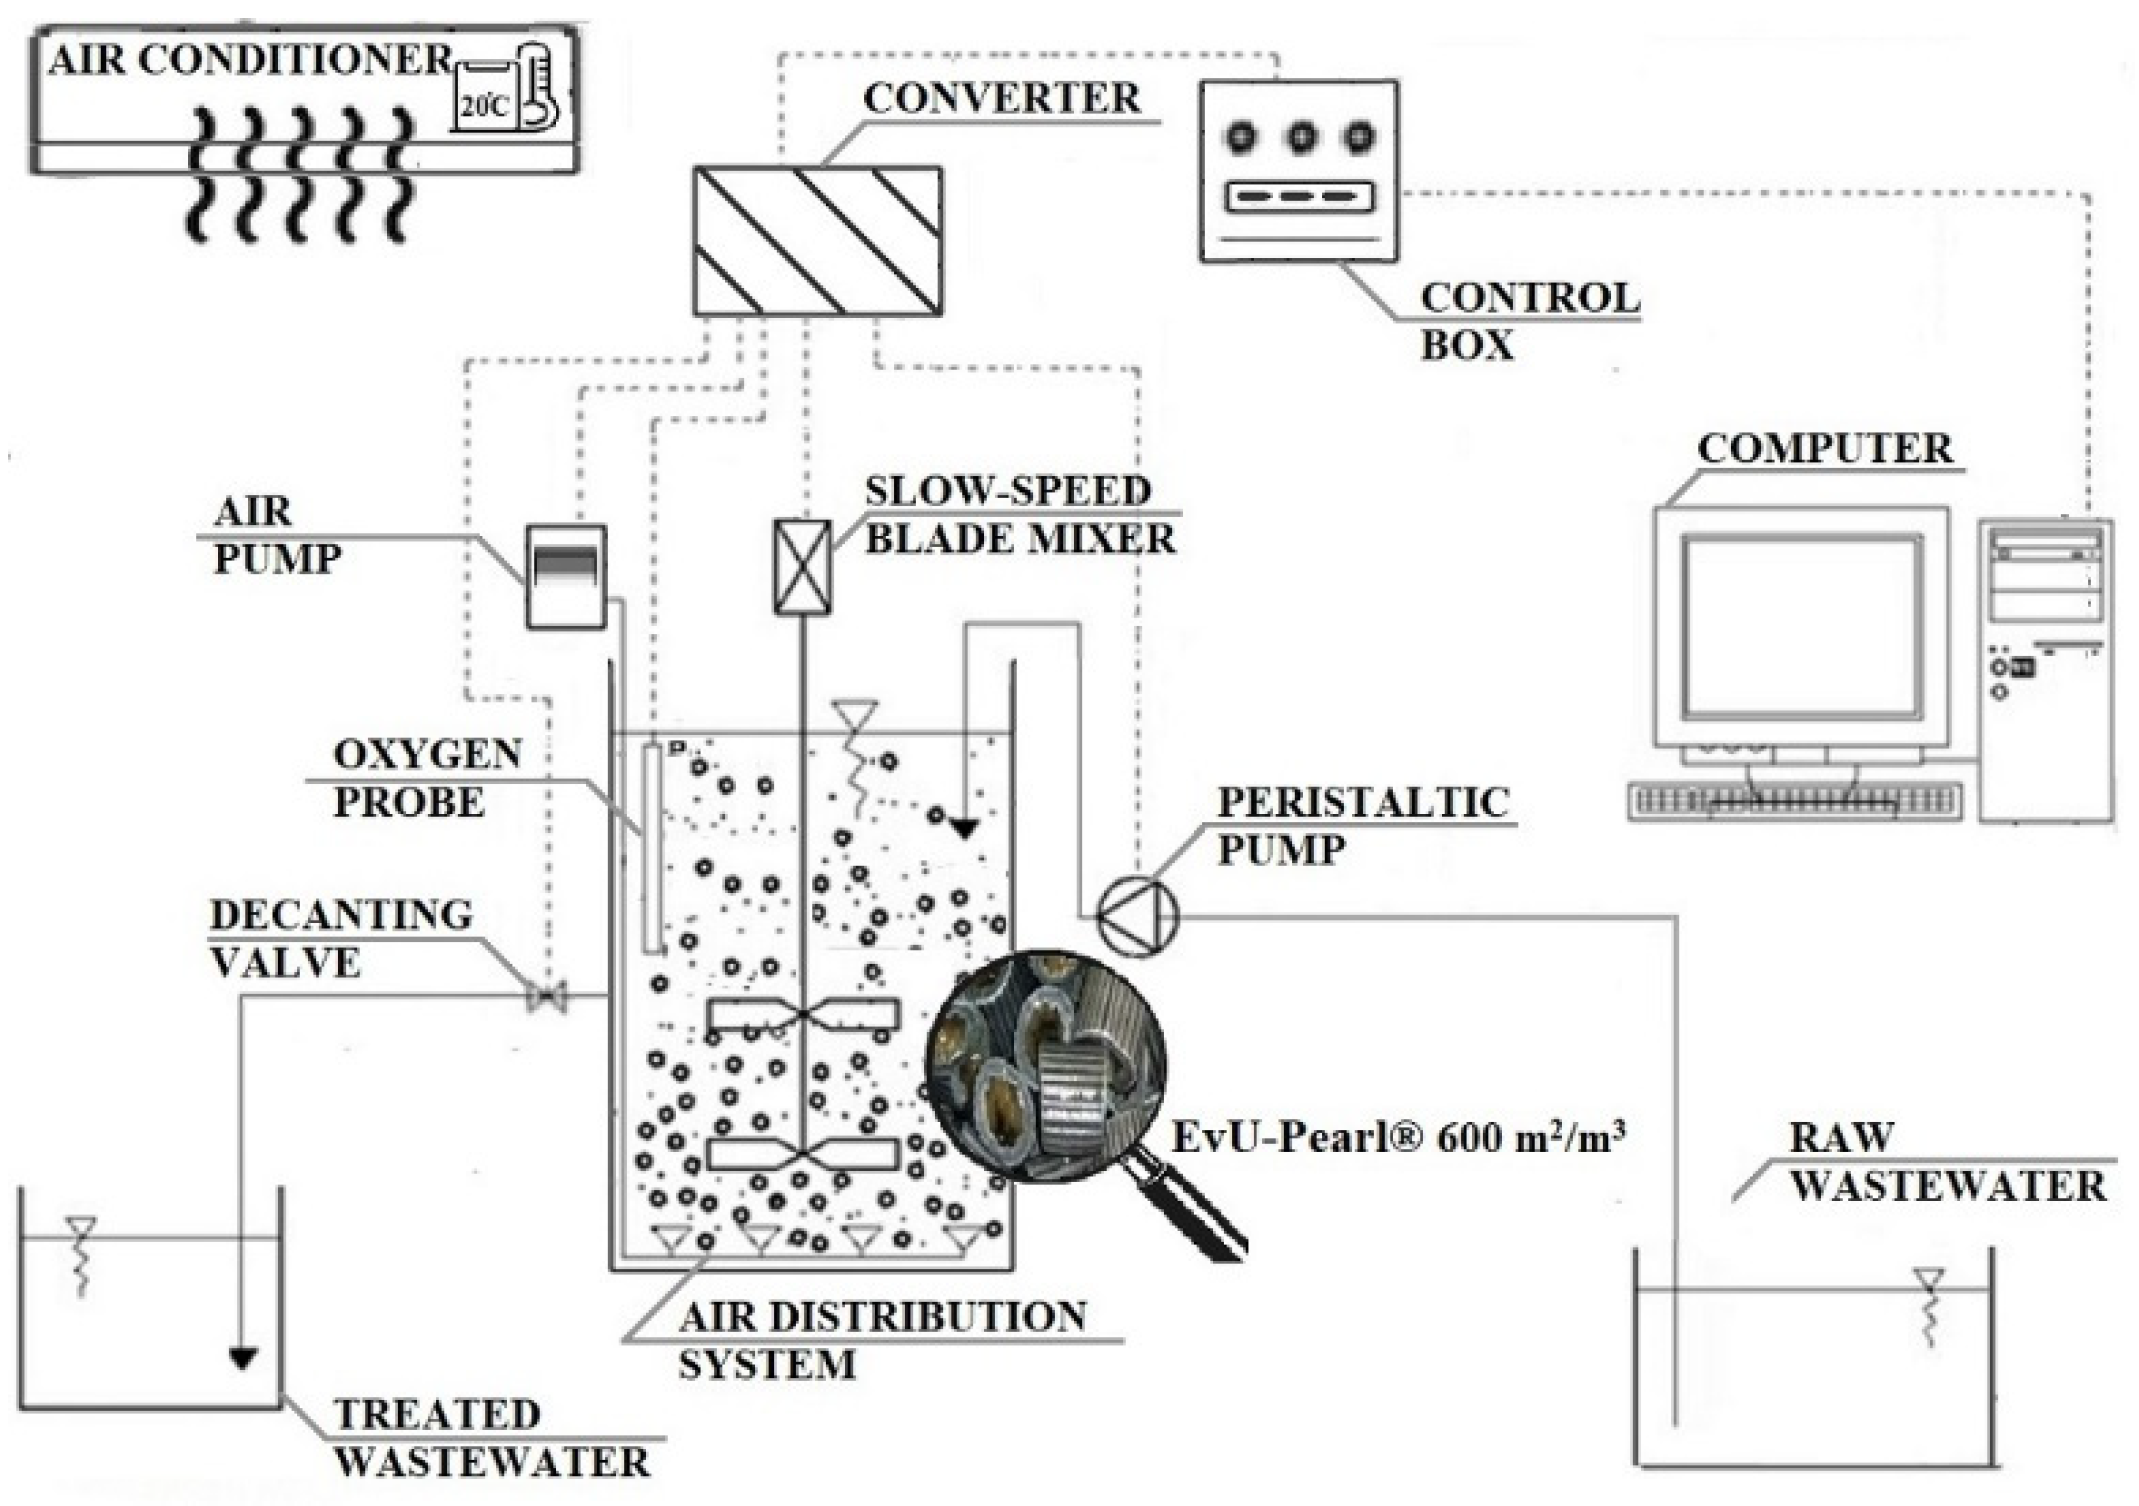
2.1. Reactor Description
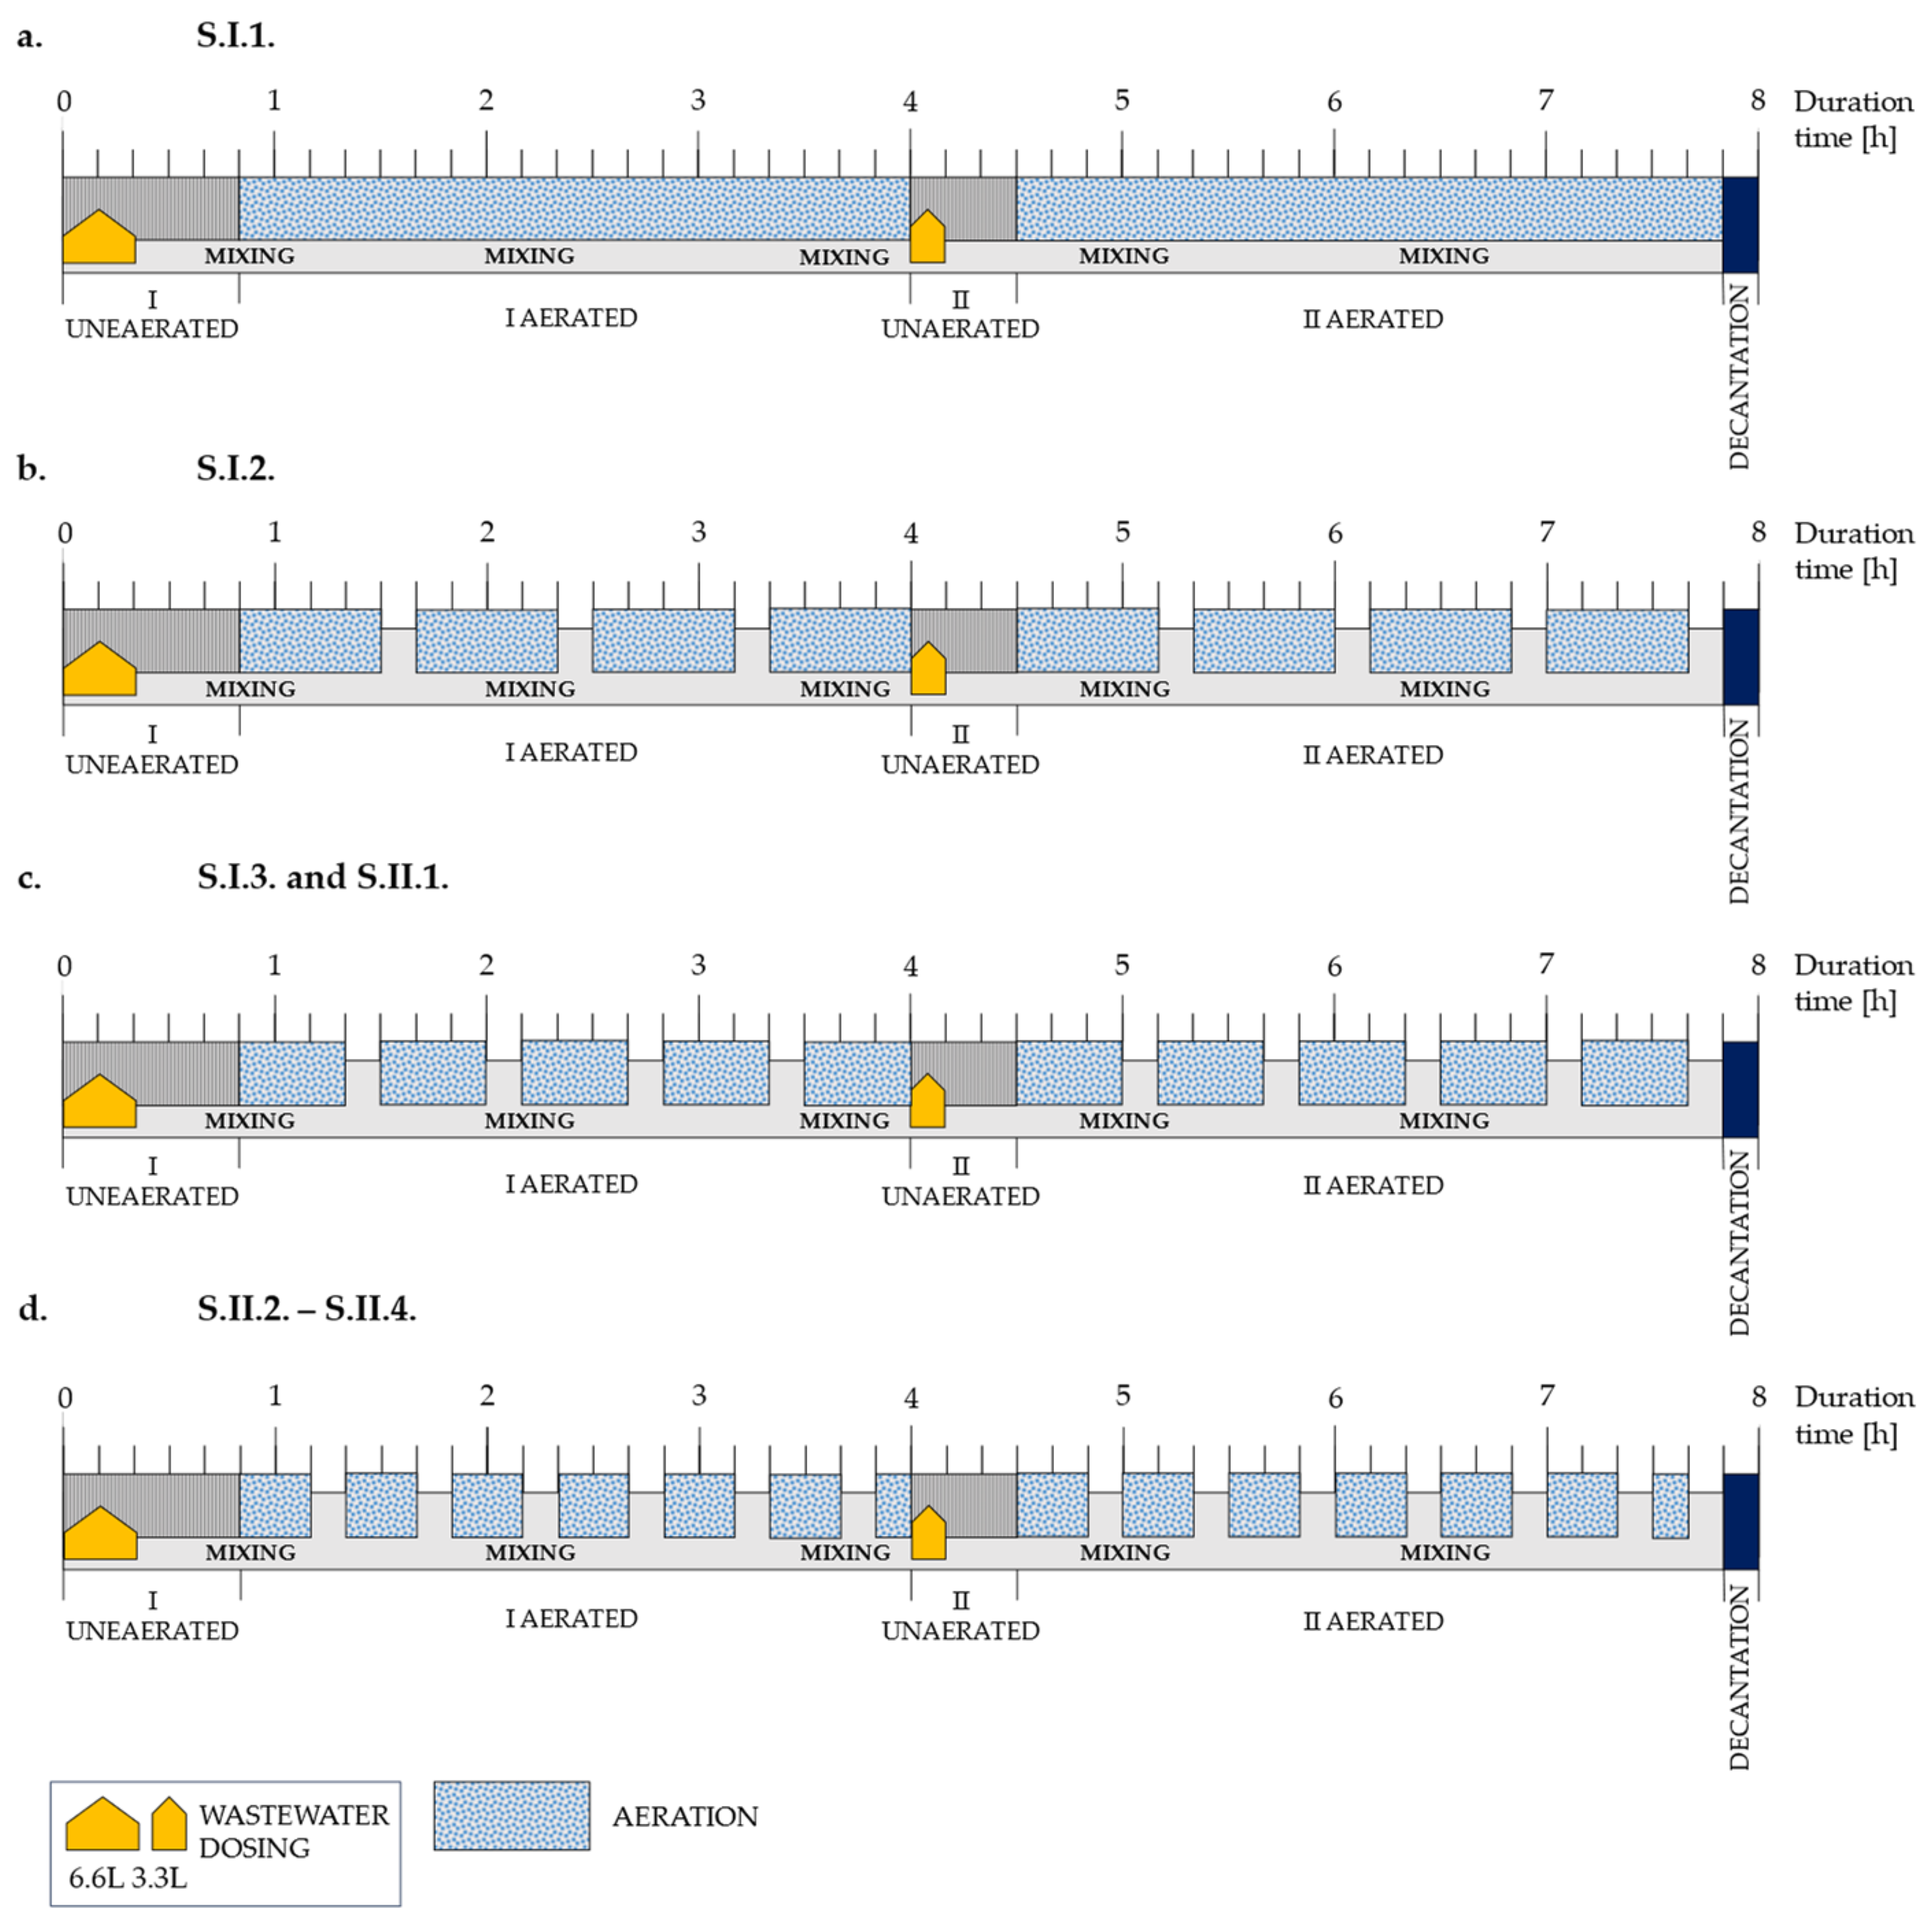
2.2. Operating Conditions
- -
- daily control of ammonia nitrogen concentration in the effluent (except the pandemic period—S.II.3.);
- -
- analysis of the influent and effluent, in the following scope: COD, TN, N-NH4+, N-NO2−, N-NO3−, TP, alkalinity, pH—twice a week (once a week in the pandemic period);
- -
- determination of the quantity of biomass developed in the form of biofilm;
- -
- batch tests of the ammonia utilization rate (AUR) and nitrite utilization rate (NitUR);
- -
- microbiological analyses: quantification of nitrifying bacteria using the absolute qPCR method; description of microbial communities in biofilm based on new generation sequencing data (NGS).
2.3. Ammonia and Nitrite Utilization Rate Batch Test
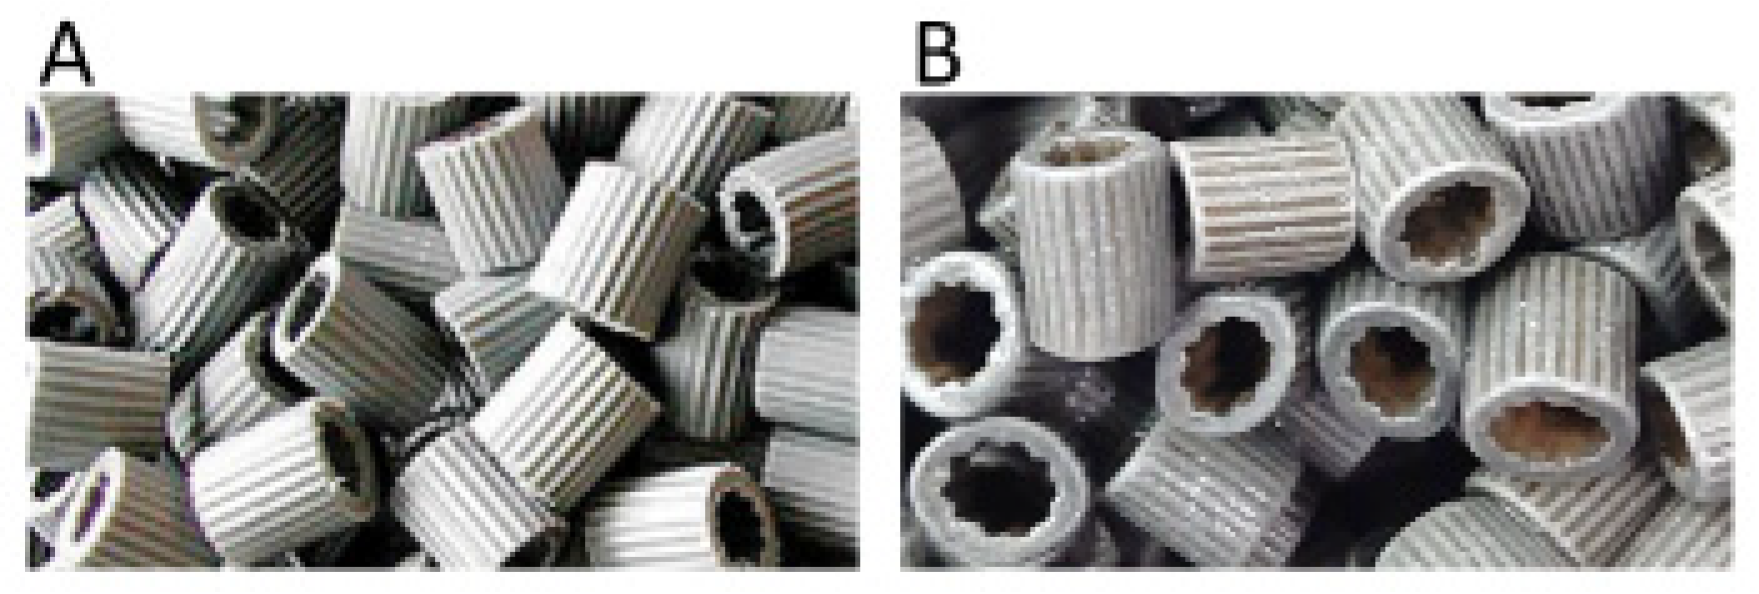
2.4. Quantity of Biofilm
2.5. Microbiological Analysis
2.5.1. DNA Extraction
2.5.2. qPCR
2.5.3. 16S rRNA Amplicon Sequencing
2.6. Analytical Methods
2.7. Statistical Analysis
3. Results and Discussion
3.1. Nutrient Removal Performance
3.2. Analysis of the Microbial Community Composition
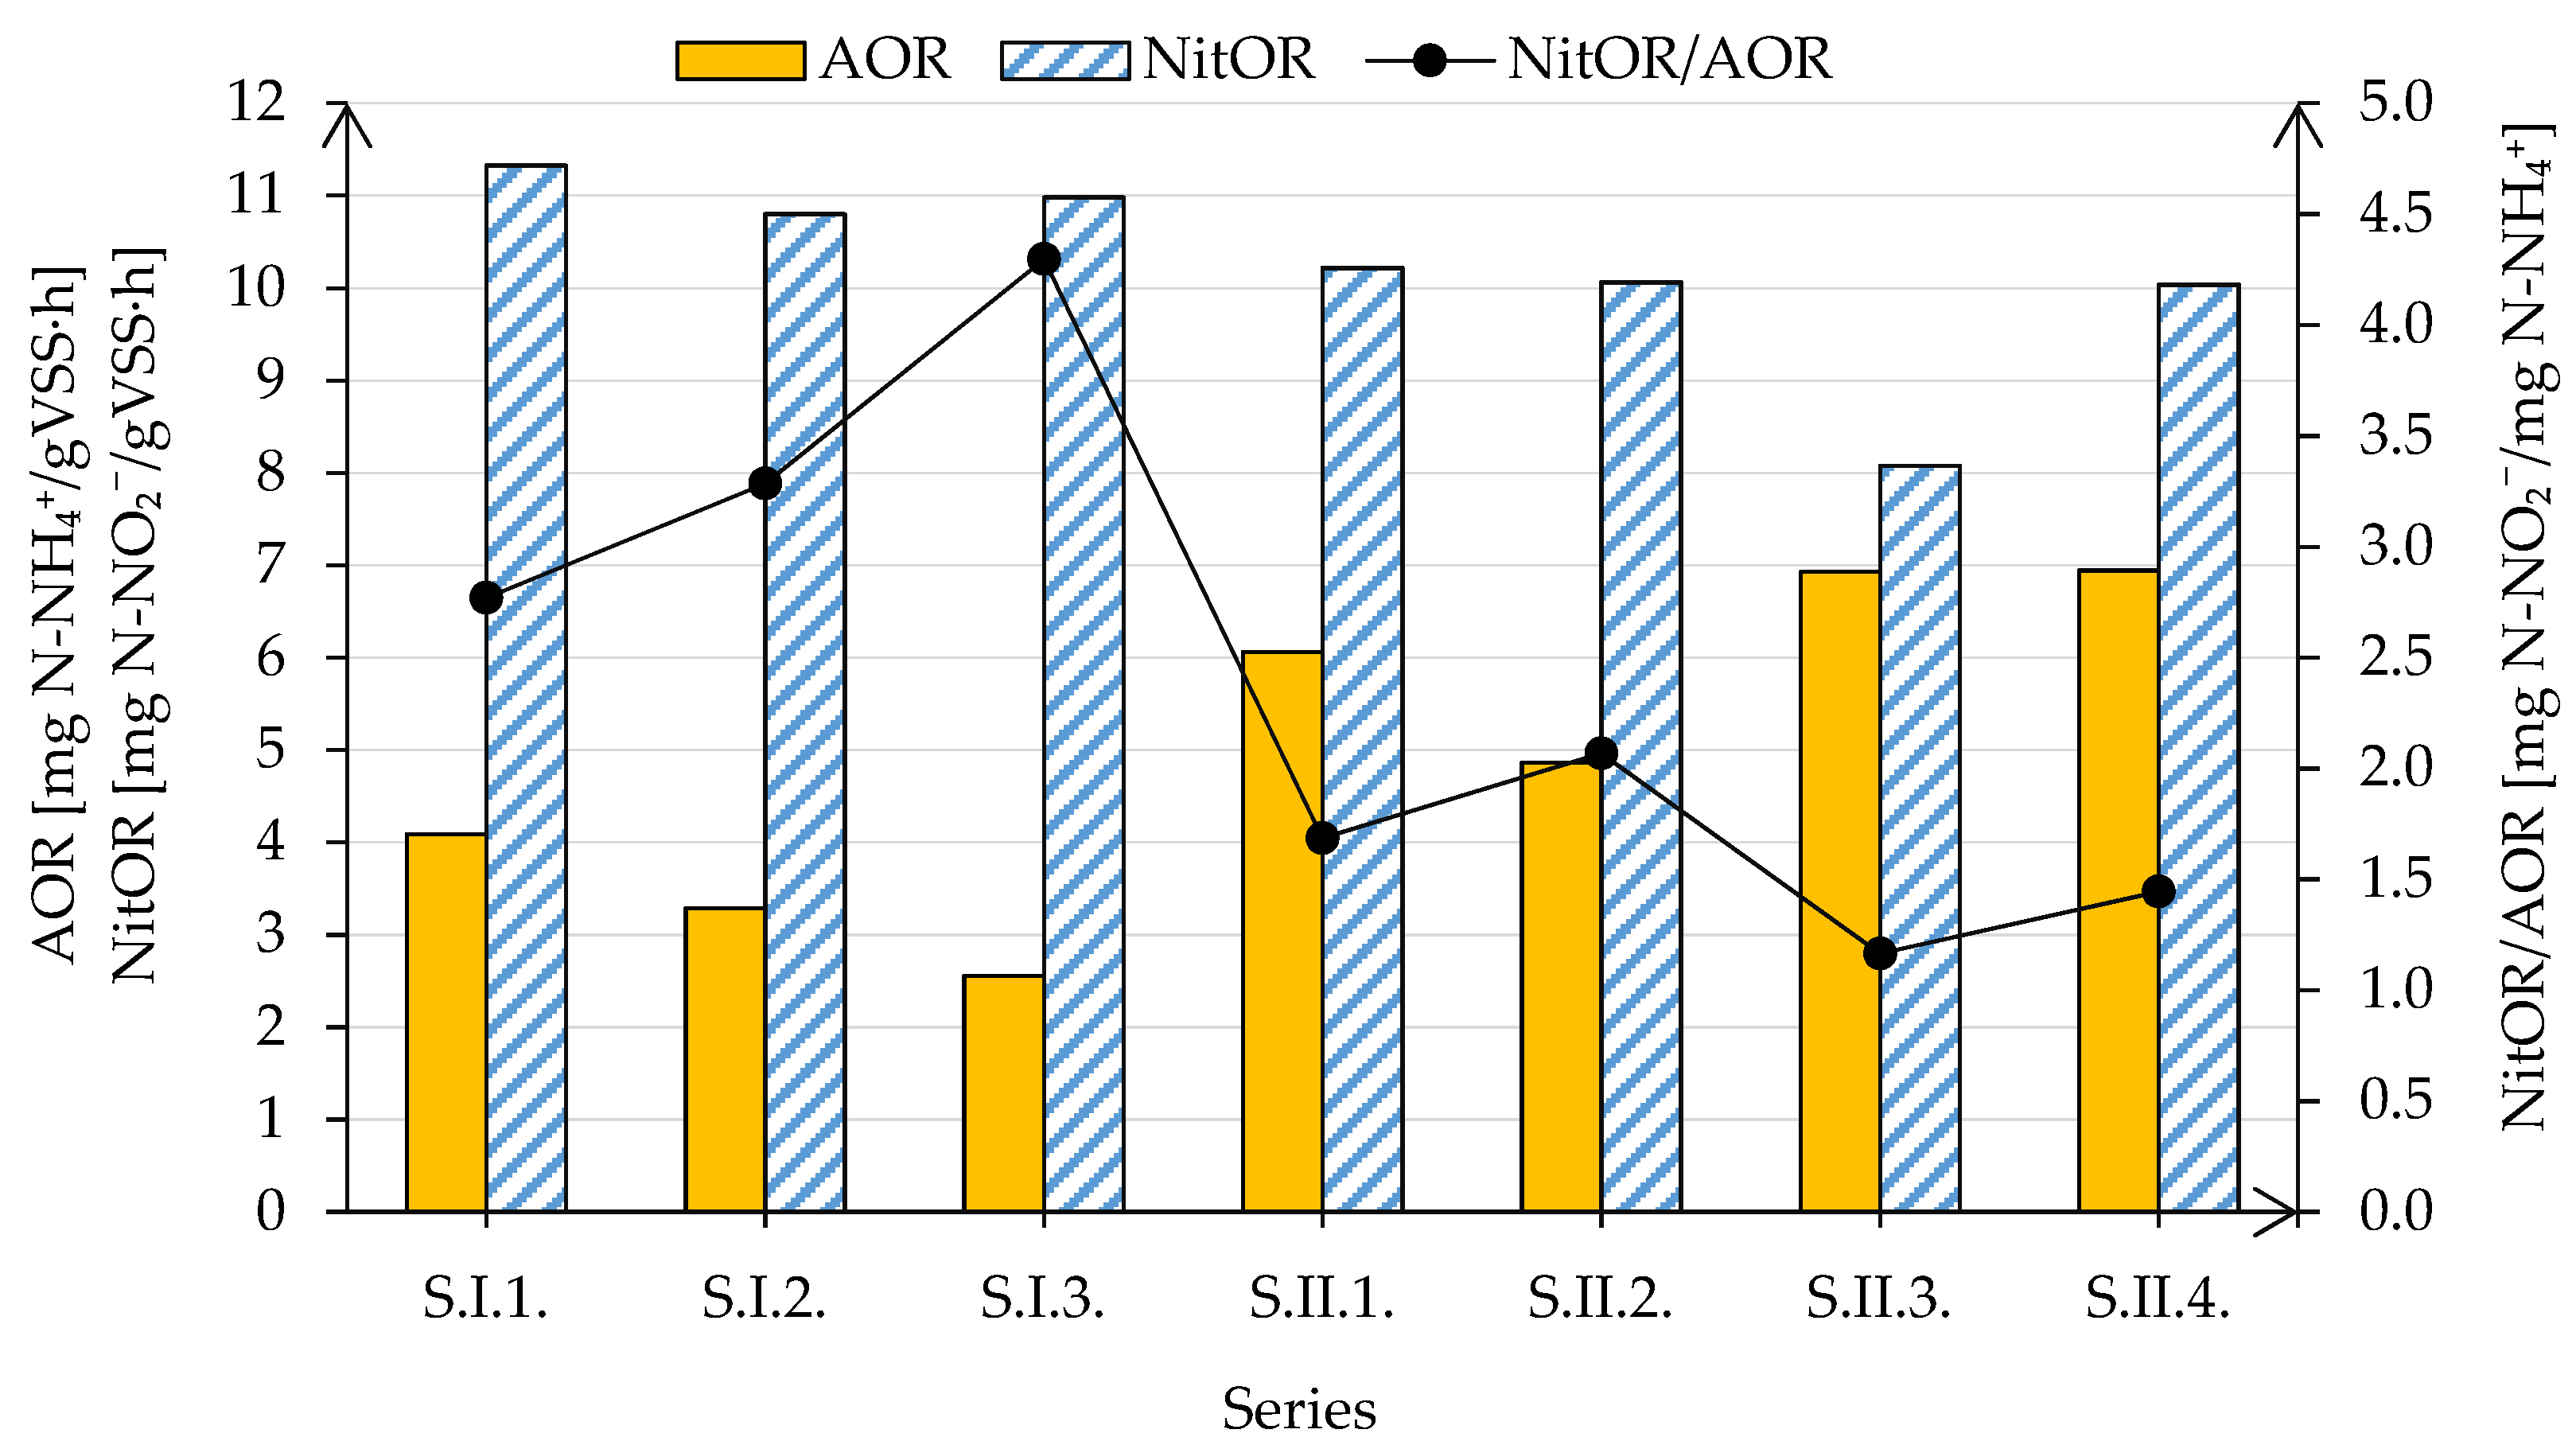
3.3. Nitrification Kinetics and Nitrifier Diversity in the Moving Bed Sequencing Batch Biofilm Reactor
4. Conclusions
- The analysis of the quality of treated wastewater showed high efficiency in COD (96.07 ± 0.74%), N-NH4+ (93.36 ± 2.13%), and TN (75.77 ± 4.57) removal across a wide range of system operating parameters, indicating its high versatility and adaptability to prevailing technological conditions.
- Despite no significant shifts in nitrification efficiency, disparities were observed in the activities and abundance of particular nitrifying microbial populations.
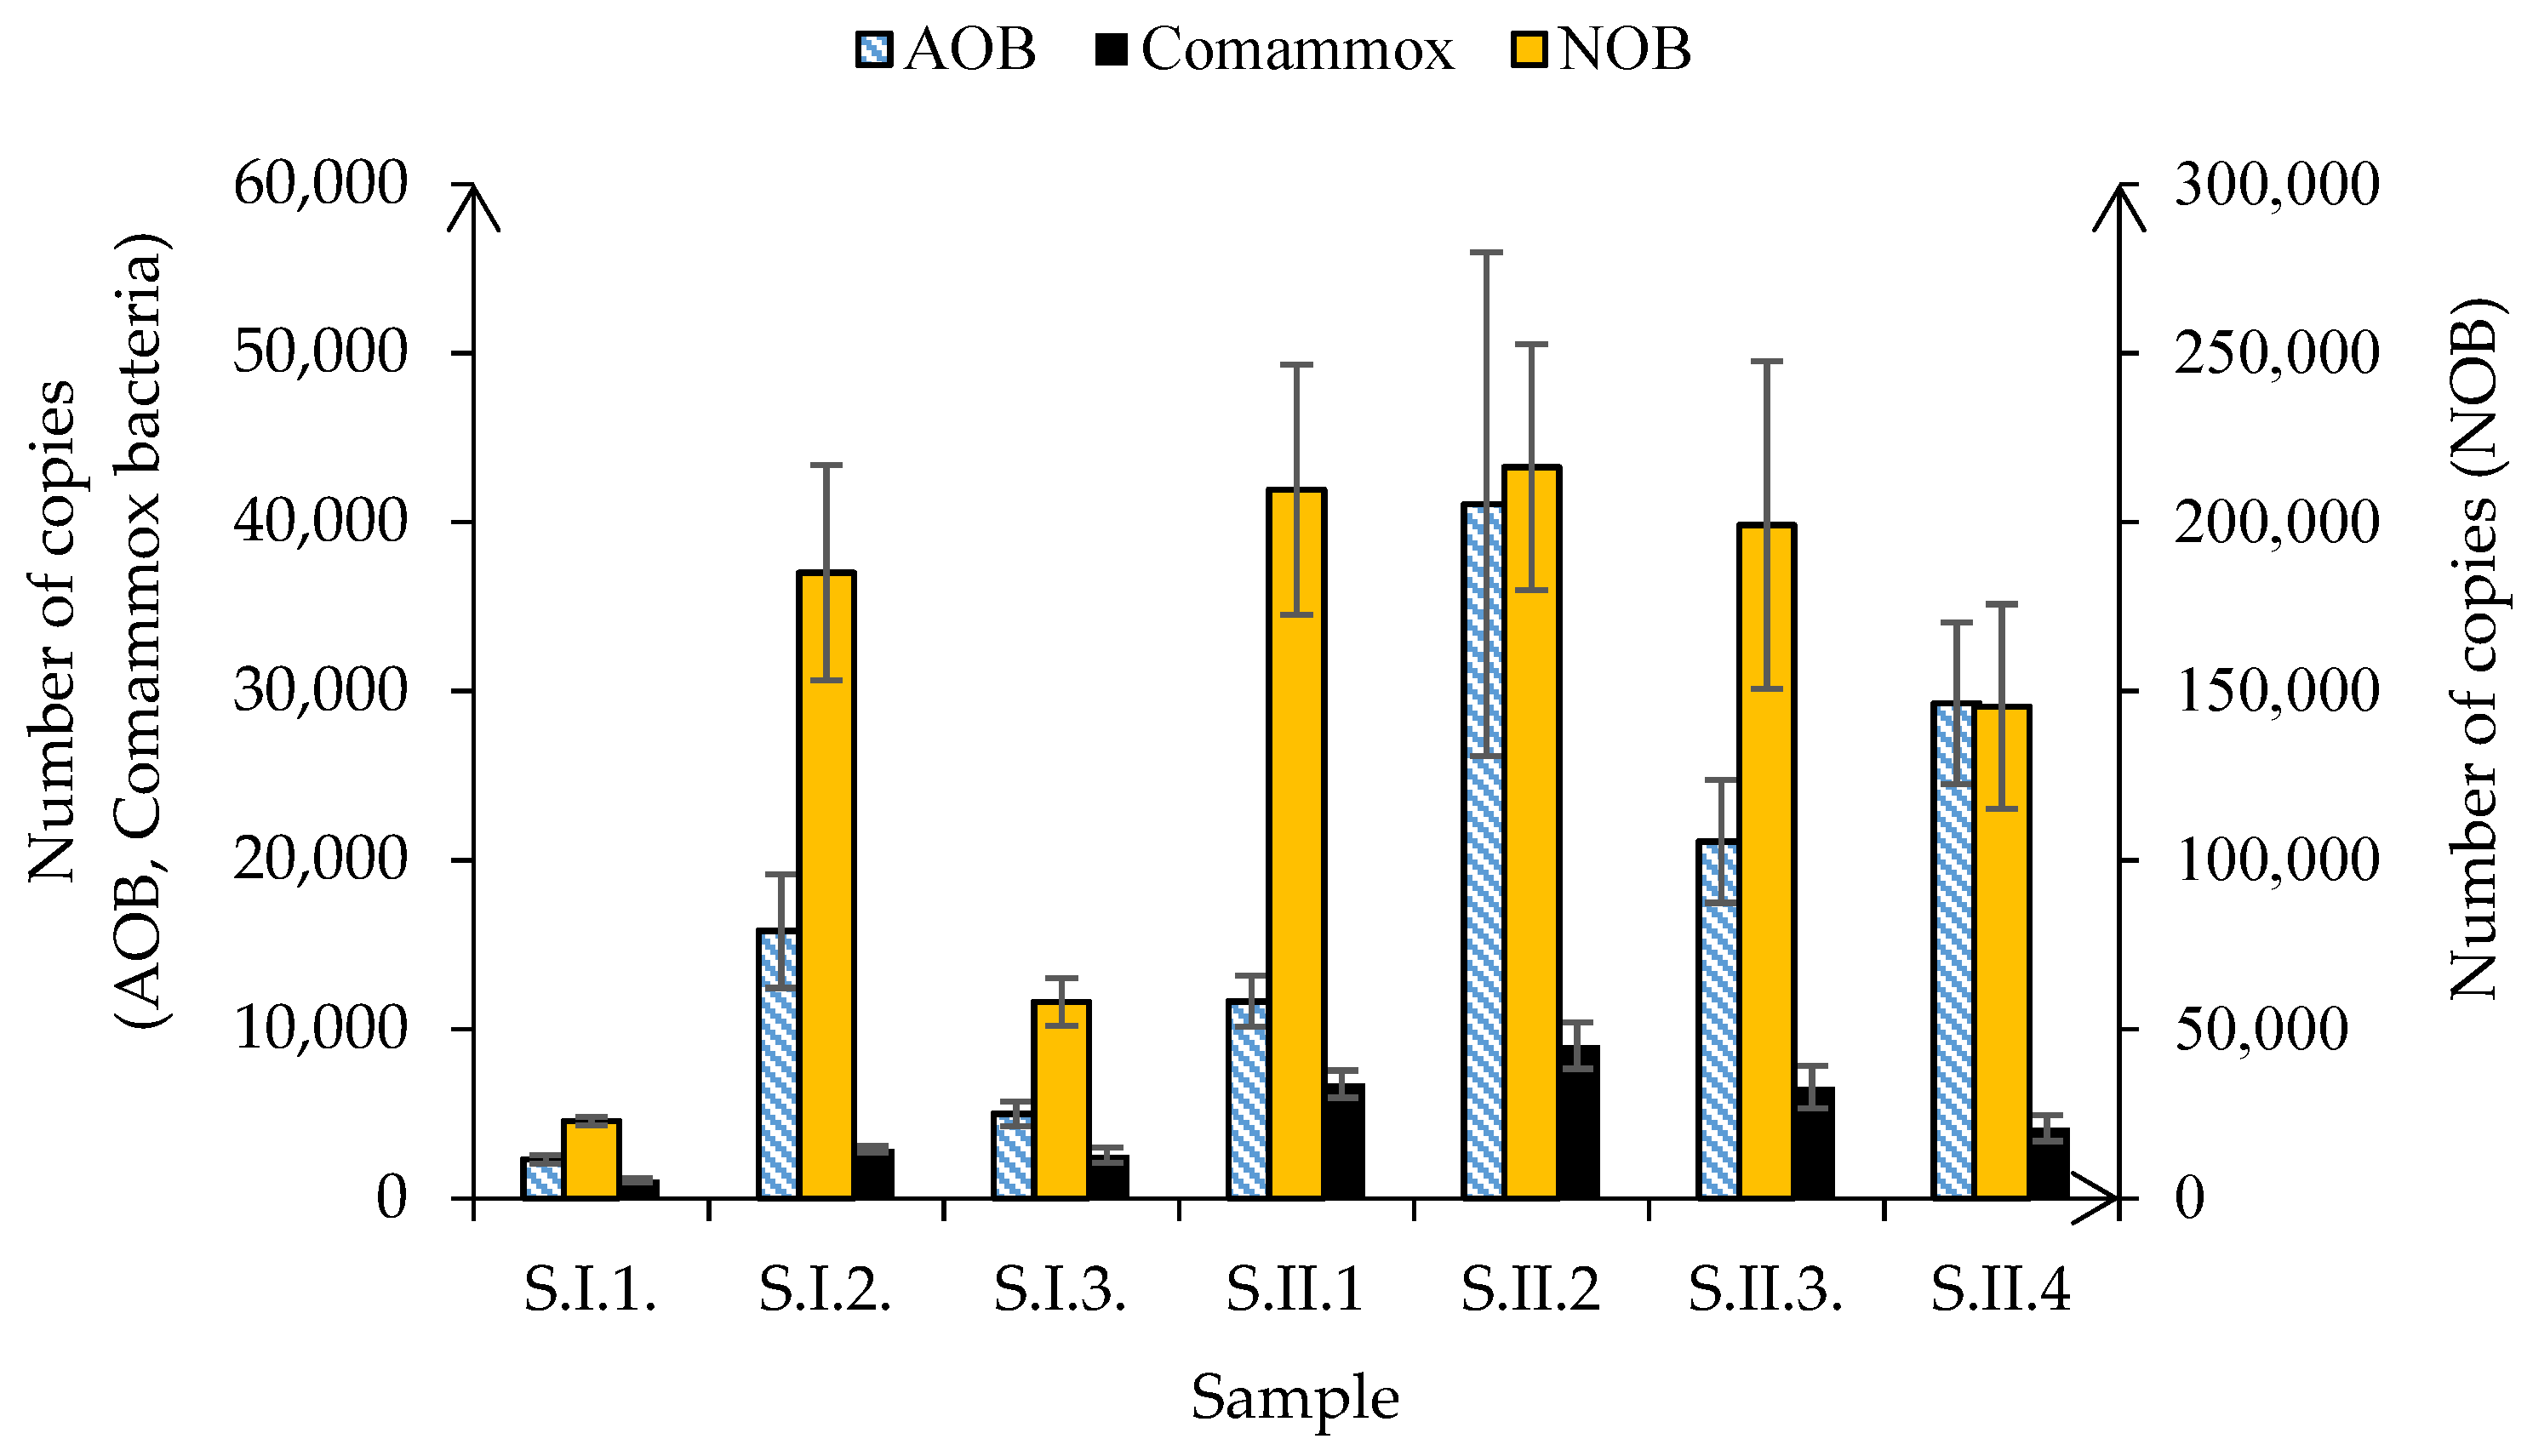
- The activity of bacteria capable of oxidizing ammonia nitrogen changed differently from that of bacteria capable of oxidizing nitrite in response to modifications in the MBSBBR operation, while the abundance of AOB, NOB, and Comammox bacteria shifted in the same direction.
- The oxygen concentration had a significant influence on the diversity of the bacterial community. The reduction of DO in the second stage led to a decrease in the number of taxa (based on the Chao1 index) and an increase in the homogeneity of the bacterial community (based on the Shannon index). This indicates that not all taxa present at the beginning of the experiment were able to adapt to the low DO concentration.
- The primary factor causing the reduction of the activity of ammonia oxidizers was shortening the duration of subphases with aeration during intermittent aeration. The change in the activity of the NOB was only affected by the reduction of the reactor’s organic and nitrogen loading rates.
- The most significant shifts in the abundance of both AOB and NOB were noted after the change in aeration strategy from continuous to intermittent.
- The frequency of occurrence of Comammox bacteria was mostly affected by the transition from continuous to intermittent aeration, as well as by reducing the DO from 6 mgO2/L to 3.5 mgO2/L.
- Despite long-term stable MBSBBR operation under the same conditions in two separate series, the characteristics of microorganism communities were different.
Supplementary Materials
Author Contributions
Funding
Data Availability Statement
Conflicts of Interest
References
- Ren, Y.; Hao Ngo, H.; Guo, W.; Wang, D.; Peng, L.; Ni, B.J.; Wei, W.; Liu, Y. New perspectives on microbial communities and biological nitrogen removal processes in wastewater treatment systems. Bioresour. Technol. 2020, 297, 122491. [Google Scholar] [CrossRef]
- Deena, S.R.; Kumar, G.; Vickram, A.S.; Singhania, R.R.; Dong, C.D.; Rohini, K.; Anbarasu, K.; Thanigaivel, S.; Ponnusamy, V.K. Efficiency of various biofilm carriers and microbial interactions with substrate in moving bed-biofilm reactor for environmental wastewater treatment. Bioresour. Technol. 2022, 359, 127421. [Google Scholar]
- Leyva-Díaz, J.C.; González-Martínez, A.; Muñío, M.M.; Poyatos, J.M. Two-step nitrification in a pure moving bed biofilm reactor-membrane bioreactor for wastewater treatment: Nitrifying and denitrifying microbial populations and kinetic modeling. Appl. Microbiol. Biotechnol. 2015, 99, 10333–10343. [Google Scholar] [CrossRef] [PubMed]
- Khanongnuch, R.; Di Capua, F.; Lakaniemi, A.M.; Rene, E.R.; Lens, P.N.L. H2S removal and microbial community composition in an anoxic biotrickling filter under autotrophic and mixotrophic conditions. J. Hazard. Mater. 2019, 367, 397–406. [Google Scholar] [CrossRef] [PubMed]
- Chaali, M.; Naghdi, M.; Brar, S.K.; Avalos-Ramirez, A. A review on the advances in nitrifying biofilm reactors and their removal rates in wastewater treatment. J. Chem. Technol. Biotechnol. 2018, 93, 3113–3124. [Google Scholar] [CrossRef]
- Sodhi, V.; Singh, C.; Cheema, P.P.S.; Sharma, R.; Bansal, A.; Jha, M.K. Simultaneous sludge minimization, pollutant and nitrogen removal using integrated MBBR configuration for tannery wastewater treatment. Bioresour. Technol. 2021, 341, 125748. [Google Scholar] [CrossRef] [PubMed]
- Safwat, S.M. Performance of moving bed biofilm reactor using effective microorganisms. J. Clean. Prod. 2018, 185, 723–731. [Google Scholar] [CrossRef]
- Leyva-Díaz, J.C.; Monteoliva-García, A.; Martín-Pascual, J.; Munio, M.M.; GarcíaMesa, J.J.; Poyatos, J.M. Moving bed biofilm reactor as an alternative wastewater treatment process for nutrient removal and recovery in the circular economy model. Bioresour. Technol. 2020, 299, 122631. [Google Scholar] [CrossRef] [PubMed]
- Wang, J.; Rong, H.; Cao, Y.; Zhang, C. Factors affecting simultaneous nitrification and denitrification (SND) in a moving bed sequencing batch reactor (MBSBR) system as revealed by microbial community structures. Bioprocess Biosyst. Eng. 2020, 43, 1833–1846. [Google Scholar] [CrossRef]
- Iannacone, F.; Di Capua, F.; Granata, F.; Gargano, R.; Esposito, G. Simultaneous nitrification, denitrification and phosphorus removal in a continuous-flow moving bed biofilm reactor alternating microaerobic and aerobic conditions. Bioresour. Technol. 2020, 310, 123453. [Google Scholar] [CrossRef]
- Hoang, V.; Delatolla, R.; Laflamme, E.; Gadbois, A. An investigation of moving bed biofilm reactor nitrification during long-term exposure to cold temperatures. Water Environ. Res. 2014, 86, 36–42. [Google Scholar] [CrossRef]
- Sabba, F.; Terada, A.; Wells, G.; Smets, B.F.; Nerenberg, R. Nitrous oxide emissions from biofilm processes for wastewater treatment. Appl. Microbiol. Biotechnol. 2018, 102, 9815–9829. [Google Scholar] [CrossRef]
- Massoompour, A.R.; Borghei, S.M.; Raie, M. Enhancement of biological nitrogen removal performance using novel carriers based on the recycling of waste materials. Water Res. 2020, 170, 115340. [Google Scholar] [CrossRef]
- Bassin, J.P.; Kleerebezem, R.; Rosado, A.S.; van Loosdrecht, M.C.; Dezotti, M. Effect of different operational conditions on biofilm development, nitrification, and nitrifying microbial population in moving-bed biofilm reactors. Environ. Sci. Technol. 2012, 46, 1546–1555. [Google Scholar] [CrossRef]
- Zhao, J.; Zheng, M.; Su, Z.; Liu, T.; Li, J.; Guo, J.; Yuan, Z.; Hu, S. Selective Enrichment of Comammox nitrospira in a Moving Bed Biofilm Reactor with Sufficient Oxygen Supply. Environ. Sci. Technol. 2022, 48, 2934–2941. [Google Scholar] [CrossRef]
- Annavajhala, M.K.; Kapoor, V.; Santo-Domingo, J.; Chandran, K. Comammox Functionality Identified in Diverse Engineered Biological Wastewater Treatment Systems. Environ. Sci. Technol. Lett. 2018, 5, 110–116. [Google Scholar] [CrossRef]
- Zajac, O.; Zubrowska-Sudol, M.; Ciesielski, S.; Godzieba, M. Effect of the Aeration Strategy on NOB Suppression in Activated Sludge and Biofilm in a Hybrid Reactor with Nitrification/Denitrification. Water 2022, 14, 72. [Google Scholar] [CrossRef]
- Zajac, O.; Zubrowska-Sudol, M. Nitrification kinetics, N2O emission, and energy use in intermittently aerated hybrid reactor under different organic loading rates. Int. J. Environ. Sci. Technol. 2023, 20, 10061–10074. [Google Scholar] [CrossRef]
- Pal, L.; Kraigher, B.; Brajer-Humar, B.; Levstek, M.; Mandic-Mulec, I. Total bacterial and ammonia-oxidizer community structure in moving bed biofilm reactors treating municipal wastewater and inorganic synthetic wastewater. Bioresour. Technol. 2012, 110, 135–143. [Google Scholar] [CrossRef]
- Rother, E.; Cornel, P. Optimising design, operation and energy consumption of biological aerated filters (BAF) for nitrogen removal of municipal wastewater. Water Sci. Technol. 2004, 50, 131–139. [Google Scholar] [CrossRef]
- PN-EN872:2007; Water Quality—Determination of Suspended Solids—Method by Filtration through Glass Fibre Filters. Polish Committee for Standardization: Warszawa, Poland, 2007.
- Holmes, A.J.; Costello, A.; Lidstrom, M.E.; Murrell, J.C. Evidence that particulate methane monooxygenase and ammonia monooxygenase may be evolutionarily related. Microbiol. Lett. 1995, 132, 203–208. [Google Scholar] [CrossRef]
- Rotthauwe, J.H.; Witzel, K.P.; Liesack, W. The ammonia monooxygenase structural gene amoA as a functional marker: Molecular fine-scale analysis of natural ammonia-oxidizing populations. Appl. Environ. Microbiol. 1997, 63, 4704–4712. [Google Scholar] [CrossRef]
- Dionisi, H.M.; Layton, A.C.; Harms, G.; Gregory, I.R.; Robinson, K.G.; Sayler, G.S. Quantification of Nitrosomonas oligotropha-like ammonia-oxidizing bacteria and Nitrospira spp. from full-scale wastewater treatment plants by competitive PCR. Appl. Environ. Microbiol. 2002, 68, 245–253. [Google Scholar] [CrossRef]
- Fowler, S.J.; Palomo, A.; Dechesne, A.; Mines, P.D.; Smets, B.F. Comammox nitrospira are abundant ammonia oxidizers in diverse groundwater-fed rapid sand filter communities. Environ. Microbiol. 2018, 20, 1002–1015. [Google Scholar] [CrossRef]
- Klindworth, A.; Pruesse, E.; Schweer, T.; Peplies, J.; Quast, C.; Horn, M.; Glöckner, F.O. Evaluation of general 16S ribosomal RNA gene PCR primers for classical and next-generation sequencing-based diversity studies. Nucleic Acids Res. 2013, 41, e1. [Google Scholar] [CrossRef]
- Bolyen, E.; Rideout, J.R.; Dillon, M.R.; Bokulich, N.A.; Abnet, C.C.; Al-Ghalith, G.A.; Alexander, H.; Alm, E.J.; Arumugam, M.; Asnicar, F.; et al. Reproducible, interactive, scalable and extensible microbiome data science using QIIME 2. Nat. Biotechnol. 2019, 37, 852–857. [Google Scholar] [CrossRef]
- Martin, M. Cutadapt Removes Adapter Sequences from High-Throughput Sequencing Reads. EMBnet J. 2011, 17, 10–12. [Google Scholar] [CrossRef]
- Edgar, R.C. Search and clustering orders of magnitude faster than BLAST. Bioinformatics 2010, 26, 2460–2461. [Google Scholar] [CrossRef]
- Quast, C.; Pruesse, E.; Yilmaz, P.; Gerken, J.; Schweer, T.; Yarza, P.; Peplies, J.; Glöckner, F.O. The SILVA ribosomal RNA gene database project: Improved data processing and web-based tools. Nucleic Acids Res. 2013, 41, D590–D596. [Google Scholar] [CrossRef]
- APHA. Standard Methods for the Examination of Water and Wastewater, 23rd ed.; APHA: Washington, DC, USA, 2017; pp. 1–23710. [Google Scholar]
- Podedworna, J.; Zubrowska-Sudoł, M. Nitrogen and phosphorus removal in a denitrifying phosphorus removal process in a sequencing batch reactor with a forced anoxic phase. Environ. Technol. 2012, 33, 237–245. [Google Scholar] [CrossRef]
- Phanwilai, S.; Kangwannarakul, N.; Noophan, P.; Kasahara, T.; Terada, A.; Munakata-Marr, J.; Figueroa, L.A. Nitrogen removal efficiencies and microbial communities in full-scale IFAS and MBBR municipal wastewater treatment plants at high COD: N ratio. Front. Environ. Sci. Eng. 2020, 14, 115. [Google Scholar] [CrossRef]
- Feng, L.; Jia, R.; Zeng, Z.; Yang, G.; Xu, X. Simultaneous nitrification-denitrification and microbial community profile in an oxygen-limiting intermittent aeration SBBR with biodegradable carriers. Biodegradation 2018, 29, 473–486. [Google Scholar] [CrossRef]
- Yoon, S.H.; Ha, S.M.; Kwon, S.; Lim, J.; Kim, Y.; Seo, H.; Chun, J. Introducing EzBioCloud: A taxonomically united database of 16S rRNA gene sequences and whole-genome assemblies. Int. J. Syst. Evol. Microbiol. 2017, 67, 1613–1617. [Google Scholar] [CrossRef]
- Luan, Y.N.; Yin, Y.; Xu, Y.; Zhang, F.; Wang, X.; Zhao, F.; Xiao, Y.; Liu, C. Simultaneous nitrification and denitrification in a novel rotating self-aerated biofilm reactor for decentralized wastewater treatment. Bioresour. Technol. 2023, 369, 128513. [Google Scholar] [CrossRef]
- Regmi, P.; Thomas, W.; Schafran, G.; Bott, C.; Rutherford, B.; Waltrip, D. Nitrogen removal assessment through nitrification rates and media biofilm accumulation in an IFAS process demonstration study. Water Res. 2011, 45, 6699–6708. [Google Scholar] [CrossRef]
- Yao, Q.; Peng, D.C. Nitrite oxidizing bacteria (NOB) dominating in nitrifying community in full-scale biological nutrient removal wastewater treatment plants. Amb Express 2017, 7, 25. [Google Scholar] [CrossRef] [PubMed]
- Yang, S.; Yang, F. Nitrogen removal via short-cut simultaneous nitrification and denitrification in an intermittently aerated moving bed membrane bioreactor. J. Hazard. Mater. 2011, 195, 318–323. [Google Scholar] [CrossRef] [PubMed]
- Shao, Y.; Shi, Y.; Mohammed, A.; Liu, Y. Wastewater ammonia removal using an integrated fixed-film activated sludge-sequencing batch biofilm reactor (IFAS-SBR): Comparison of suspended flocs and attached biofilm. Int. Biodeterior. Biodegrad. 2017, 116, 38–47. [Google Scholar] [CrossRef]
- Park, H.D.; Regan, J.M.; Noguera, D.R. Molecular analysis of ammonia-oxidizing bacterial populations in aerated-anoxic orbal processes. Water Sci. Technol. 2002, 46, 273280. [Google Scholar] [CrossRef]
- Fang, F.; Wang, S.N.; Li, K.Y.; Dong, J.Y.; Xu, R.Z.; Zhang, L.L.; Xie, W.M.; Cao, J.S. Formation of microbial products by activated sludge in the presence of a metabolic uncoupler o-chlorophenol in long-term operated sequencing batch reactors. J. Hazard. Mater. 2020, 384, 121311. [Google Scholar] [CrossRef] [PubMed]
- Yang, L.; Xu, X.; Wang, H.; Yan, J.; Zhou, X.; Ren, N.; Lee, D.J.; Chen, C. Biological treatment of refractory pollutants in industrial wastewaters under aerobic or anaerobic condition: Batch tests and associated microbial community analysis. Bioresour. Technol. Rep. 2022, 17, 100927. [Google Scholar] [CrossRef]
- Luan, Y.N.; Yin, Y.; An, Y.; Zhang, F.; Wang, X.; Zhao, F.; Xiao, Y.; Liu, C. Investigation of an intermittently-aerated moving bed biofilm reactor in rural wastewater treatment under low dissolved oxygen and C/N condition. Bioresour. Technol. 2022, 358, 127405. [Google Scholar] [CrossRef] [PubMed]
- Bian, X.; Wu, Y.; Li, J.; Yin, M.; Li, D.; Pei, H.; Chang, S.; Guo, W. Effect of dissolved oxygen on high C/N wastewater treatment in moving bed biofilm reactors based on heterotrophic nitrification and aerobic denitrification: Nitrogen removal performance and potential mechanisms. Bioresour. Technol. 2022, 365, 128147. [Google Scholar] [CrossRef] [PubMed]
- Daims, H.; Lebedeva, E.V.; Pjevac, P.; Han, P.; Herbold, C.; Albertsen, M.; Jehmlich, N.; Palatinszky, M.; Vierheilig, J.; Bulaev, A.; et al. Complete nitrification by Nitrospira bacteria. Nature 2015, 528, 504–509. [Google Scholar] [CrossRef] [PubMed]
- Sakoula, D.; Koch, H.; Frank, J.; Jetten, M.S.M.; van Kessel, M.A.H.J.; Lücker, S. Enrichment and physiological characterization of a novel comammox Nitrospira indicates ammonium inhibition of complete nitrification. ISME J. 2021, 15, 1010–1024. [Google Scholar] [CrossRef] [PubMed]
- Huang, T.; Xia, J.; Liu, T.; Su, Z.; Guan, Y.; Guo, J.; Wang, C.; Zheng, M. Comammox nitrospira Bacteria Are Dominant Ammonia Oxidizers in Mainstream Nitrification Bioreactors Emended with Sponge Carriers. Environ. Sci. Technol. 2022, 56, 12584–12591. [Google Scholar] [CrossRef] [PubMed]
- Zajac, O.; Zubrowska-Sudol, M.; Godzieba, M.; Ciesielski, S. Changes in the activity and abundance of canonical nitrifiers and Comammox bacteria during stream switching: Shifting from a mainstream hybrid reactor for C, N, and P removal to a sidestream biofilm nitrification reactor. J. Water Process. Eng. 2024, 57, 104655. [Google Scholar] [CrossRef]
- Roots, P.; Wang, Y.; Rosenthal, A.F.; Griffin, J.S.; Sabba, F.; Petrovich, M.; Yang, F.; Kozak, J.A.; Zhang, H.; Wells, G.F. Comammox nitrospira are the dominant ammonia oxidizers in a mainstream low dissolved oxygen nitrification reactor. Water Res. 2019, 157, 396–405. [Google Scholar] [CrossRef]
- Cotto, I.; Dai, Z.; Huo, L.; Anderson, C.L.; Vilardi, K.J.; Ijaz, U.; Khunjar, W.; Wilson, C.; De Clippeleir, H.; Gilmore, K.; et al. Long solids retention times and attached growth phase favor prevalence of Comammox bacteria in nitrogen removal systems. Water Res. 2020, 169, 115268. [Google Scholar] [CrossRef]


| Stage | Series | Duration | Oxygen Concentration during Aerated Subphases (DO) | Ratio between Times of Non-Aerated and Aerated Subphases (R) | Organic Loading Rate (OLR) | Nitrogen Loading Rate (NLR) |
|---|---|---|---|---|---|---|
| Unit | [d] | [mgO2/L] | [-] | [gCOD/m3·d] | [gN/m3·d] | |
| I | S.I.1. | 1–40 | 6 | 0 | 537 | 64 |
| S.I.2. | 41–79 | 1/4 | ||||
| S.I.3. | 80–100 | 1/3 | ||||
| II | S.II.1. | 101–196 | 3.5 | 1/3 | 537 | 64 |
| S.II.2. | 197–330 | 1/2 | 537 | 64 | ||
| S.II.3. | 331–430 | 1/2 | 402 | 48 | ||
| S.II.4. | 431–445 | 1/2 | 537 | 64 | ||
| Parameter | Unit | Stage I | Stage II | |||||
|---|---|---|---|---|---|---|---|---|
| S.I.1. | S.I.2. | S.I.3. | S.II.1. | S.II.2. | S.II.3. | S.II.4. | ||
| COD | mgO2/L | 21.42 ± 2.68 | 17.53 ± 2.16 | 18.25 ± 3.96 | 18.39 ± 4.79 | 21.20 ± 2.52 | 21.99 ± 3.23 | 18.84 ± 2.88 |
| TN | mgN/L | 13.98 ± 2.26 | 17.71 ± 2.50 | 18.70 ± 1.02 | 14.10 ± 2.27 | 12.94 ± 1.06 | 18.77 ± 2.01 | 15.43 ± 2.93 |
| TKN | mgN/L | 3.99 ± 1.92 | 3.20 ± 0.75 | 3.39 ± 1.35 | 3.80 ± 1.23 | 4.26 ± 1.16 | 4.34 ± 0.95 | 4.28 ± 0.29 |
| N-NH4+ | mgNH4+/L | 0.77 ± 0.52 | 0.77 ± 0.40 | 0.60 ± 0.33 | 0.61 ± 0.48 | 0.87 ± 0.44 | 0.99 ± 0.46 | 1.07 ± 0.49 |
| N-NO2− | mgN-NO2−/L | 0.24 ± 0.16 | 0.29 ± 0.37 | 0.03 ± 0.02 | 0.15 ± 0.17 | 0.13 ± 0.13 | 0.30 ± 0.22 | 0.22 ± 0.24 |
| N-NO3− | mgN-NO3−/L | 9.74 ± 3.45 | 14.22 ± 2.85 | 16.14 ± 2.40 | 10.13 ± 2.34 | 8.55 ± 1.17 | 14.14 ± 1.97 | 10.93 ± 2.75 |
| ECOD * | % | 95.80 ± 0.55 | 96.59 ± 0.41 | 96.57 ± 0.72 | 96.42 ± 0.95 | 95.84 ± 0.48 | 95.69 ± 0.63 | 96.32 ± 0.57 |
| ENit * | % | 93.86 ± 2.96 | 94.64 ± 1.68 | 94.52 ± 2.22 | 93.56 ± 2.04 | 93.15 ± 2.29 | 92.68 ± 1.56 | 92.64 ± 0.67 |
| EDenitr. * | % | 79.02 ± 3.42 | 72.19 ± 3.68 | 70.56 ± 3.69 | 76.77 ± 3.69 | 78.79 ± 1.57 | 69.10 ± 3.49 | 74.05 ± 4.71 |
Disclaimer/Publisher’s Note: The statements, opinions and data contained in all publications are solely those of the individual author(s) and contributor(s) and not of MDPI and/or the editor(s). MDPI and/or the editor(s) disclaim responsibility for any injury to people or property resulting from any ideas, methods, instructions or products referred to in the content. |
© 2024 by the authors. Licensee MDPI, Basel, Switzerland. This article is an open access article distributed under the terms and conditions of the Creative Commons Attribution (CC BY) license (https://creativecommons.org/licenses/by/4.0/).
Share and Cite
Zajac, O.; Zubrowska-Sudol, M.; Godzieba, M.; Ciesielski, S. Changes in Nitrification Kinetics and Diversity of Canonical Nitrifiers and Comammox Bacteria in a Moving Bed Sequencing Batch Biofilm Reactor—A Long-Term Study. Water 2024, 16, 534. https://doi.org/10.3390/w16040534
Zajac O, Zubrowska-Sudol M, Godzieba M, Ciesielski S. Changes in Nitrification Kinetics and Diversity of Canonical Nitrifiers and Comammox Bacteria in a Moving Bed Sequencing Batch Biofilm Reactor—A Long-Term Study. Water. 2024; 16(4):534. https://doi.org/10.3390/w16040534
Chicago/Turabian StyleZajac, Olga, Monika Zubrowska-Sudol, Martyna Godzieba, and Slawomir Ciesielski. 2024. "Changes in Nitrification Kinetics and Diversity of Canonical Nitrifiers and Comammox Bacteria in a Moving Bed Sequencing Batch Biofilm Reactor—A Long-Term Study" Water 16, no. 4: 534. https://doi.org/10.3390/w16040534
APA StyleZajac, O., Zubrowska-Sudol, M., Godzieba, M., & Ciesielski, S. (2024). Changes in Nitrification Kinetics and Diversity of Canonical Nitrifiers and Comammox Bacteria in a Moving Bed Sequencing Batch Biofilm Reactor—A Long-Term Study. Water, 16(4), 534. https://doi.org/10.3390/w16040534