Abstract
China has a vast territory and a long history of inland navigation. This paper is based on the Shaying River Shenqiu hub project, and a normal physical model with a geometric scale of 65 was established to simulate the characteristics of water and sediment in the entrance area of the project. By setting different working conditions and measuring and analyzing the velocity flow pattern of the wharf area, planning suggestions for the artificial channel with straight cut-off can be given. Simultaneously, the study simulates the natural sediment deposition state in typical years, observing changes in terrain and evaluating their impact on navigation, thereby validating the rationality of scouring and desilting processes. The research findings indicate that in the reconstructed river wharf’s entrance area, the flow velocity is low, and the flow pattern is stable, ensuring that the transverse flow velocities along the recommended route meet the requirements for vessel navigation. Post-scouring from the regulating gate discharge, downstream deposition decreases, with a sediment flushing efficiency reaching 68.5%. Under the specified conditions, the thickness of sediment deposition after scouring does not negatively affect the water level for ships entering or departing the wharf. The results of this study may offer valuable reference insights for the planning of artificial rivers in similar terrains.
1. Introduction
Since ancient times, inland river navigation has been a crucial mode of transportation. In today’s society, the role of inland waterway transportation continues to gain prominence in the transportation sector. As the demands on shipping continue to rise, some outdated shipping hubs have gradually begun undergoing upgrades. Some newly built or rebuilt shipping hubs have altered the original terrain, topography, and water-sediment characteristics of the channel. Therefore, re-planning of the channel and analysis of sediment deposition are crucial steps before navigation.
When the ship is passing, the quality of the flow conditions will have different effects on the navigation. Many scholars have carried out a lot of research on the characteristics of channel flow. Fošumpaur studied the influence of power plant flood discharge on the navigation conditions of the approach channel [1]. Qi Chunfeng et al. proposed a new type of diversion structure to reduce the transverse flow velocity and improve the navigation conditions [2]. Through physical model tests, Carl-Uwe Böttner et al. provided verification data to further corroborate a numerical approach and to gain deeper insight into the flow conditions in the gap flow underneath the vessel in very shallow water [3]. Zhang Shuaishuai et al. analyzed the influence of unsteady reservoir flow and sand excavation on the channel conditions of the Yangtze River through mathematical models [4]. Wang Taiwei, Liu Zhaoheng, and others used a two-dimensional hydrodynamic model to simulate channel conditions and calculate flow conditions, providing data support for ship navigation [5,6,7]. Lee Gil Seong et al. conducted a numerical simulation, analyzed the flow pattern of the approach channel, and designed the spillway guide wall to meet the stable flow conditions [8]. Cen Wen et al. used a two-dimensional steady flow mathematical model to simulate the navigable flow condition for entrance and connection reach in the upstream and downstream approach channels of the Tiangongtang junction, corresponding to different quantities of flow, and discussed the flow conditions for navigation at the entrance area of the approach channels [9]. Dian Guang Ma et al. combined the physical model with the ship model to study the navigation flow conditions and navigation mechanism to tackle the problem that the navigation flow conditions in the downstream entrance area and the linkage section of the lock are poor and it is difficult for the ship to enter the port [10].
In addition to the flow conditions, sediment deposition is also an important reason to hinder the operation of the channel. As early as the 1960s, Chinese scholar Zhang Ruijin put forward the basic method to solve the sediment problem of the GeZhouBa water conservancy project: navigation in still water, using dynamic water to scour sediment. Cheng Yifei et al. discussed the significant impact of the operation of the Xiaolangdi Reservoir on sediment transport and channel evolution in the Lower Yellow River since 2000. This investigation into the spatiotemporal adjustment characteristics of channel evolution is of significance to the management of the Lower Yellow River, covering different channel-pattern reaches of braided, transitional and meandering [11]. The water and sediment-supply conditions of the Yellow River have undergone significant changes since the implementation of the water and sediment regulation scheme (WSRS) in 2002 by the joint operation of large reservoirs. Therefore, Naishuang Bi et al. conducted a systematic study and evaluation of the impact of the remediation plan on the erosion and deposition of the downstream river [12]. Un Ji et al. used the calibrated and validated two-dimensional model to quantitatively analyze the effects of different sediment control methods on the sedimentation reduction at the Nakdong River Estuary Barrage in Korea [13]. Through the analysis of field survey data, J.C. Agunwamba and Jun Wang et al. summarized the sediment deposition problems of the canals in Rivers State of Nigeria and the Three Gorges of the Yangtze River, respectively [14,15]. Based on a large hydropower station already built on the Yellow River, combined with a physical model test, Zhou Heng et al. proposed that the effective method to solve the sediment problem is to use the newly built desilting tunnel to arrange the water diversion power generation system [16]. Based on the physical model and numerical simulation, Xiaoli Yang et al. studied the effect of sediment control and discharge of sediment retention weir by taking the Derisubaoleng Reservoir as an example [17]. Dah Mardeh Arman et al. studied the change of erosion and deposition in the downstream of a stepped spillway through a physical model [18]. Hua Fu and Jiongxin Xu took part of the Yangtze River and part of the Yellow River as examples to analyze the influence of river erosion and deposition [19,20]. Yeyun Tao, Le Hien T.T. and Yoo Hyung Ju used a three-dimensional numerical model to simulate sediment deposition and scour [21,22,23].
Different from the work of some scholars who mainly focus on the navigation conditions and sediment deposition studies of natural rivers [24,25,26,27], the unique feature of the Shenqiu hub is to transform the original Shaying river channel artificially, change the original curved river channel into a linear river channel, and build a wharf in the original curved area. The distinctive transformation method has changed the flow patterns and sediment distribution of the original natural river. Based on the project of the Shenqiu hub in the Shaying River, this paper studies the physical model test of the reconstructed regulating gate and the entrance area of the wharf, discusses the hydraulic characteristics and sediment deposition law of the wharf entrance area under different dispatching modes, analyzes the influence of flow velocity and flow pattern of the ship in the wharf area under various working conditions, studies the deposition of the hub under different water and sediment conditions, and examines the scouring effect of the discharge of the regulating gate on the river deposition, so as to provide references for the navigation of similar terrain.
2. Engineering Overview
The Shaying River is the largest tributary of the Huai River, with a long history of inland navigation. Since the 1950s, numerous regulating gates have been successively constructed, and in the 1980s, a batch of navigation facilities was completed. The downstream section of the Shaying River, from Zhoukou City to the provincial border, spans approximately 89.4 km and remains navigable throughout the year. However, due to the limitations of the Shenqiu ship lock and the channel grade, it can only be navigable seasonally for 300-ton ships, which cannot meet the needs of the large-scale development of ships. This section has become a bottleneck in the river channel, so that the shipping role of the Shaying River cannot be effectively played. Therefore, it is necessary to implement the upgrading project of the Shaying River channel.
The project intends to demolish the old Shenqiu ship lock located on the Shaying River, cut and straighten the originally curved river channel on the left bank of the river, and build a new ship lock and regulating gate about 8 km downstream of the original hub. The control gate adopts a 50-year design flood as the standard, and the flow through the gate is 4150 m3/s. According to the relevant regulations on the classification of hydraulic structures in China [28], the main building level of the project is grade 2, and the secondary building level is grade 3. The hub is arranged on the artificial river channel after cutting and straightening. The regulating gate is next to the ship lock and arranged on the south side. The distance between the regulating gate and the central axis of the ship lock is 210 m. The overall layout of the hub is shown in Figure 1.
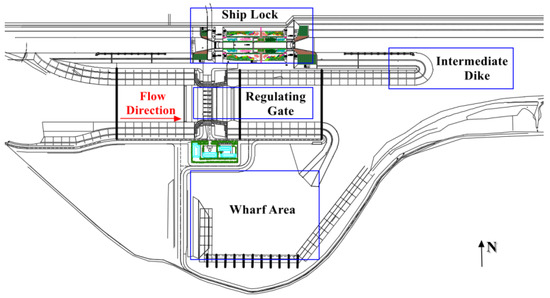
Figure 1.
Overall layout of the hub.
3. The Design of The Model
According to the requirements of the model scale design in the standard [29], the model is designed as a moving bed normal model, which satisfies the gravitational similarity criterion, and considers the requirements of turbulence resistance similarity and sand incipient similarity.
3.1. Model Scale
According to the test site and research tasks, the geometric scale is selected to be 65. According to the principle of gravitational similarity, the relevant scales for the model are presented in Table 1.

Table 1.
Model Scale Summary Table.
The settling velocity scale is denoted by ; the bulk density of the model sand is denoted by ; the model sand bulk density and water bulk density difference scale is denoted by .
3.2. Selection of Model Sand
Based on past experimental experience [30,31], several types of model sands were selected as alternatives for the current experiment. The selection was made considering their physical characteristics, settling similarity, and incipient similarity conditions to choose model sands suitable for this experiment.
The sediment particles will sink under the action of gravity in the water, and their settling velocity is related to the sand Reynolds number . When the Reynolds number is below 0.5, the surrounding water exhibits laminar flow. When the Reynolds number exceeds 1000, the surrounding water transitions to a turbulent flow state.
In this experiment, the particle size of the natural sand in the river prototype is about 0.003–0.004 mm. According to the Reynolds number formula , the Reynolds number of the prototype sand is about 0.4, which stays in the laminar flow state, so the Stokes formula is applicable.
According to the Stokes formula [32],
In this equation, the settlement velocity of the model sand is denoted by ω; the bulk density of the model sand is denoted by ; the bulk density of the water is denoted by γ; the gravitational acceleration is denoted by g; and the viscosity coefficient is denoted by ν.
Settlement velocity scale:
Sediment particle size scale:
In Equations (2) and (3),the particle size scale is denoted by ; the settlement velocity scale is denoted by , and the value of is the same as the flow velocity scale shown in Table 1; the scale of viscosity coefficient is denoted by , and its value is related to factors such as water temperature and sediment concentration. The value of in this experiment is 1. The water bulk density scale is denoted by ; the model sand bulk density and water bulk density difference scale is denoted by . The density of each model sand and the calculated particle size scale are shown in Table 2.

Table 2.
Model sand density and particle size scale.
When considering the incipient similarity conditions, the incipient motion velocity scale is obtained by using the incipient motion velocity formula, from which the particle size ratio is derived. This serves as the criterion for selecting model sands.
Shamov formula [33]:
In this equation, the incipient motion velocity of model sand is denoted by V; other parameters in Equation (4) are the same as Equation (1).
Incipient motion velocity scale:
Sediment particle size scale:
The value of the incipient motion velocity scale is the same as the flow velocity scale shown in Table 1. The value of is 65. is the same as Equation (3). The resulting data are shown in Table 2 below.
According to the above model of sand density and particle size scale, we can establish the function relationship as shown in Figure 2.
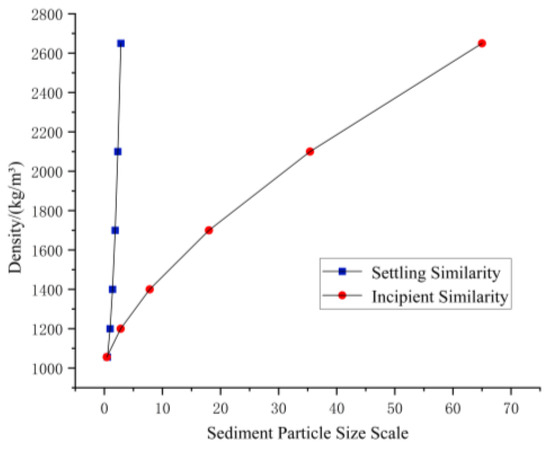
Figure 2.
The relationship function between model sand density and particle size scale.
Based on the relationship between the density and particle size scale of different types of model sands mentioned above, model sands that simultaneously satisfy both settling and incipient similarity can be identified—namely, the intersection point of the two curves, where the particle size scale λd is approximately 1.072, and the density is around 1170 kg/m3. Taking a comprehensive approach into consideration, resin particles were selected as the model sand for this experiment.
3.3. Making of the Physical Model
The overall model of the hub was constructed strictly according to the original engineering topography, including the regulating gate, the wharf, and the upstream and downstream navigation channels, covering a total river segment with an upstream length of 1.6 km and a downstream length of 2.4 km. The riverbed model utilized a cement–sand slurry coating, and the structures were constructed using acrylic and glass materials. The complete model is illustrated in Figure 3.
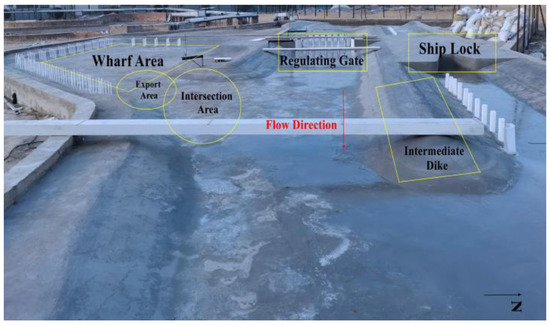
Figure 3.
Overall layout of the model.
4. Hydraulic Characteristics Experiment
During the test, the physical model was divided into four main areas: the downstream area (of the regulating gate), the wharf area, the export area (of the wharf), and the intersection area (between the export area and the downstream of the regulating gate). The plan of the main study area is shown in Figure 4. This paper primarily investigates the flow velocity and sedimentation in the wharf entrance area, which includes the export area and the intersection area.
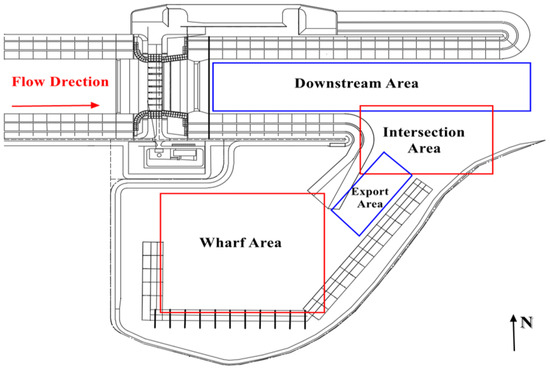
Figure 4.
The plan of the study area.
The experimental model adopts a constant flow, gravity-driven circulation water supply system. The functions of the main measuring instruments are as follows: controlled using an E-MAG electromagnetic flow meter to regulate the upstream water flow in the channel; recorded using fixed water level needles and self-recording water level gauges to monitor changes in water levels at various control points along the channel; measured using an L-8 infrared multi-point rotating vane flowmeter and an ADV flowmeter to capture the distribution of flow velocities; assessed through underwater topographic instruments, total stations, and similar devices to measure changes in the riverbed; vibrations in gates detected using a DASP dynamic intelligent monitoring device; documented using a digital camera to record the entire process.
4.1. Experiment Scheme
According to the planning and operation conditions of the regulating gate and the combination of the design water level, the optimal operation scheme comparison test of the gate dispatching mode is carried out. The optimal dispatching operation mode of the gate given by the test results is shown in Table 3. According to the six design conditions and the corresponding gate scheduling operation mode, the flow velocity test is carried out in the entrance area.

Table 3.
Gate scheduling operation scheme of each design condition.
The main test sections and test points of the hydraulic elements collected in the experiment are shown in Figure 5.
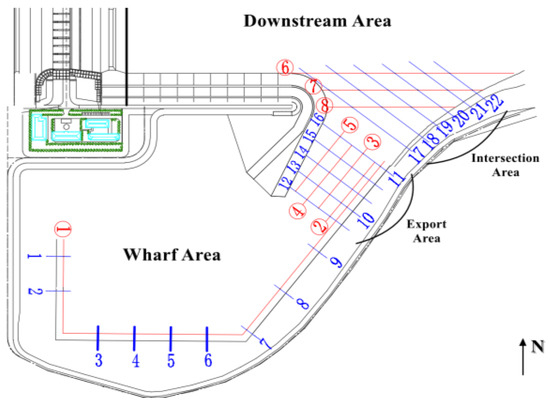
Figure 5.
Measurement point position of hydraulic characteristics experiment.
(1) Layout of the measurement points in the wharf area.
A survey section perpendicular to the wharf is made in the front of wharf 1# to wharf 11#, and the number is 1–11. Measuring line ➀ is parallel to the wharf and 13 m away from the front of the wharf. The intersection of each section and measuring line ➀ is the measurement point of the wharf—a total of 11 measurement points.
(2) Layout of the measuring points in the export area.
The export section is arranged in the area between the 10# wharf and the diversion dike. Taking section No. 10 as the reference, a section is set at a distance of 32.5 m, parallel to the direction of section No. 9, which is recorded as section No. 12. In the direction of section No. 11, three parallel sections are set at an interval of 32.5 m, which are sections 14–16 (section No. 13 coincides with section No. 10, section No. 16 coincides with section No. 11)—a total of five test sections. A total of four measuring lines are set up every 26 m parallel to the wharf and from the wharf front, which are recorded as measuring lines ➁–➄, and the intersection with the section is the measuring point, making a total of 20 measuring points.
(3) Layout of the measuring points in intersection area.
Based on section No. 11, a parallel section is set at an interval of 56 m along the exit direction, which is recorded as section No. 17. Then, taking section No. 17 as the basis, a parallel section is set every 32.5 m, making a total of five sections, numbered 18–22. Three measuring lines are arranged. The intersection line between the bank slope and the elevation of 26 m downstream of the regulating gate is set as measuring line ➅, and a parallel survey line is set up every 32.5 m in the direction of the wharf as measuring lines ➆–➇, with a total of 16 measuring points in the intersection area.
4.2. Experiment Result
The flow velocities of the cross-section of the wharf area, the export area, and the intersection area under each working condition are shown in Table 4, Table 5 and Table 6.

Table 4.
The cross-sectional flow velocities of the wharf area under various working conditions.

Table 5.
The cross-sectional average flow velocities of the export area under various working conditions.

Table 6.
The cross-sectional flow velocities of the export area under working condition 6.
It can be seen from the test data in Table 4 that the wharf area is fundamentally a still water area, and the overall flow rate is small. In the case of condition 5, the water depth in the wharf area is extremely shallow, and the data are difficult to measure. Under the other five conditions, the flow velocity is weak, and the flow velocity to the wharf export and intersection areas increases slightly. The experimental water level only exceeds the highest navigable water level under condition 1, and the whole wharf area should stop the ship entering and leaving. Under the other five working conditions, the water level is normal, and the wharf area can pass normally.
Under working condition 1, the flow velocity in the wharf area is relatively low, with a maximum of 0.32 m/s, and it is also low in the export area and the intersection area. The data covering 16 measuring points in the intersection area are shown in Table 7. It can be seen that the flow velocity gradually increases in the direction of the mainstream of the discharge to the regulating gate. Under this working condition, the ship entering the intersection area is perpendicular to the flow velocity direction under the most unfavorable conditions, which can also meet the requirement that the transverse flow velocity of the ship is less than 0.3 m/s [34]. Therefore, the ship entering the wharf is safe in this area.

Table 7.
The cross-sectional flow velocities of the intersection area under working condition 1.
The flow velocity at the outlet of the wharf under condition 2 and condition 3 is slightly higher than condition 1, but it is still small, with a maximum of only 0.24 m/s. The flow law of the intersection area is similar to condition 1, and the flow velocity is still larger in the mainstream area closer to the control gate. The angle between the ship entering the wharf and the flow direction is about 30°, and the transverse flow velocity is 0.28 m/s and 0.24 m/s, respectively, which still meets the requirements of the transverse flow velocity of the ship, and the ship entering the wharf is safe in this area.
The export area and the wharf area of condition 4 and condition 5 are similar, and the water depth is shallow. However, the flow velocity in the intersection area increases greatly. The maximum flow velocity of working condition 4 is measuring line ➅ close to the mainstream area; the flow velocity is 0.54 m/s, and the transverse flow velocity of the ship is about 0.24 m/s. The maximum flow velocity of measuring line ➅ in the intersection area of working condition 5 is 0.56 m/s, and the transverse flow velocity of the ship is about 0.28 m/s. Both of them still meet the requirements of transverse flow velocity.
The flow velocity in the intersection area of condition 6 is the largest in each case, as shown in Table 8. The maximum flow velocity is measuring line ➅ close to the mainstream area, and the flow velocity is 0.97 m/s. Under this condition, the ship needs to reduce the angle with the incoming flow as much as possible to ensure the transverse flow velocity meets the requirements.

Table 8.
The cross-sectional flow velocities of the intersection area under working condition 6.
The wharf area and the intersection area are far away from the regulating gate, and the scheduling form of the gate has little effect on the flow velocity distribution in the entrance area to the wharf. From the experimental observation of each working condition, it can be found that there are obvious dynamic and static separation areas in the intersection area between the wharf outlet and the downstream of the regulating gate. The mainstream is distributed in the downstream section of the regulating gate and near the middle partition wall separated from the lock; while the flow velocity at the wharf outlet is small, and the flow velocity under working conditions 4 and 5 is close to 0, the water flow in the wharf area is mostly static. The flow pattern is shown in Figure 6 and Figure 7.
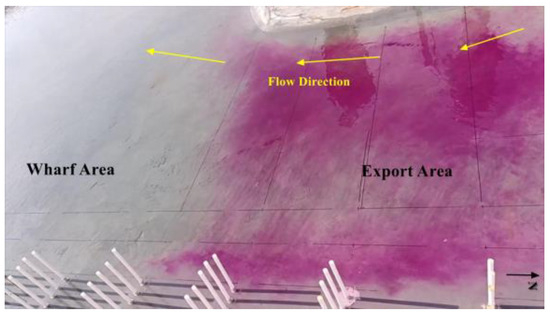
Figure 6.
The flow pattern of the wharf area.
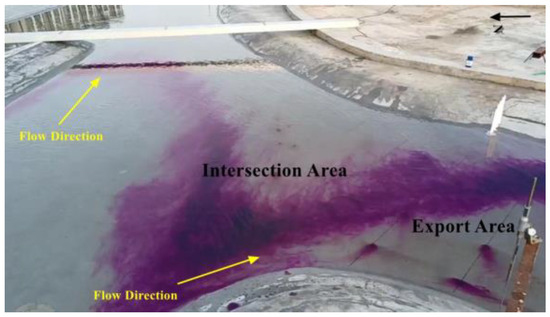
Figure 7.
The flow pattern of the export area and intersection area.
It can be seen from the flow pattern diagram that the main flow of the discharge flow from the regulating gate is close to the left side (the middle partition wall of the regulating gate and ship lock). It can be seen from the flow pattern diagram that the main flow of the discharge flow from the regulating gate is close to the left side (the middle partition wall of the control gate ship lock). The tracer near the outlet of the wharf shows that the dynamic of the main river channel and the static of the wharf area are obviously separated. Under each working condition, the wharf area essentially maintains a static water state, and the wharf outlet is close to the right bank, with a small flow rate.
Comprehensive analysis of the flow velocity distribution and flow pattern in each area in the test shows that the flow velocity from the wharf outlet to the downstream near the right bank is small, and the flow pattern is smooth. Under working condition 1, the water level has exceeded the maximum navigable water level, and the ship should be stopped from entering and leaving the wharf; under condition 2–condition 5, ships can meet the requirements of safe navigation in the entrance area of the wharf. Under condition 6, the maximum flow velocity in the intersection area is 0.97 m/s. Under this condition, the ship should increase the navigation distance in and out of the port, reduce the angle with the incoming flow, and sail at a small angle. When the ship is sailing, the lateral flow rate is required not to exceed 0.3 m/s, otherwise the lateral thrust is too large and safety accidents are prone to occur. According to Table 8, it can be seen that the velocity of the three measuring points on measuring lines ➅➆➇ of section No. 17 is relatively small, so the planned route should be as close as possible to section No. 17. By calculating, whether the transverse velocity is less than 0.3 m/s, the angle between the route and the water flow direction should not be less than 20° when passing through line ➅, and not less than 39° when passing through line ➆. Therefore, the arrangement of the route is recommended as shown in Figure 8. At the same time, the route planned according to condition 6 can also meet the navigation requirements of other conditions.
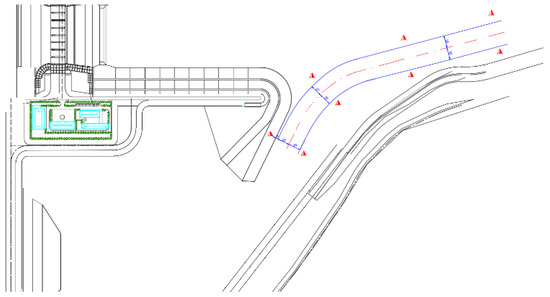
Figure 8.
Recommended route in and out of the wharf.
5. Scouring and Silting Experiment
5.1. Experiment Scheme
After the Shaying River was artificially cut and straightened, a wharf is built in the original curved section, and a regulating gate is built on the later-constructed artificial river channel. Therefore, the terrain changes, and the river regime is very different from the original natural river. The water and sediment discharged by the regulating gate may have an impact on the wharf area. In order to explore the influence of siltation on the entry and exit of ships, the siltation situation was simulated, and the siltation test was carried out.
The 50-year design flood was adopted as the standard for the regulating gate of the hub, and the maximum discharge through the gate was 4150 m3/s. However, according to the nearly 60 years’ worth of data provided by the hydrological station, the actual flow of the river does not meet this standard. According to the actual data, the annual distribution of runoff in the river section is uneven, and the annual variation in runoff is large. It can be roughly divided into three typical years: a wet year (71.69 billion m3), a dry year (12.47 billion m3), and a normal year (multi-year average 32.27 m3). Therefore, these three upstream flow conditions were selected for siltation test. The sediment concentration data used in the experiment were the multi-year average sediment concentration of 1.38 kg/m3 measured by the hydrological station.
The position of the intermediate dike head was recorded as section 0. A section was set every 65 m from section 0 upstream to the control gate interval, making a total of 11 sections, recorded as sections 1–11. In the wharf area, the 10# wharf was set as measuring section “a”, and a measuring section was set every 32.5 m along the wharf exit—a total of nine measuring sections. The layout of the measurement section is shown in Figure 9.
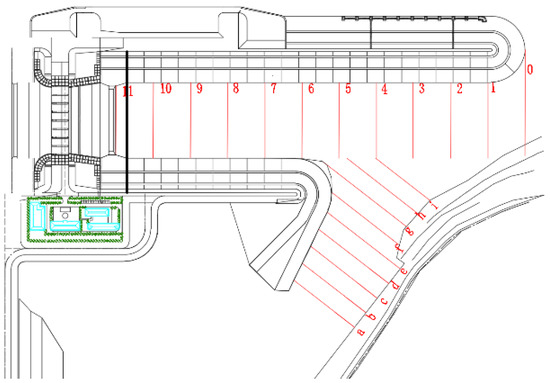
Figure 9.
Measurement point position of scouring and silting experiment.
5.2. Experiment Result
During the siltation test, the regulating gate was discharged from the middle four holes. The flow velocity of the mainstream of the discharge flow was larger and gradually moved closer to the intermediate dike. The fine sediment in the downstream area was mostly not silted up, and the coarse sediment was silted up into a sand wave shape [35]. The siltation distribution after the test is shown in Figure 10.
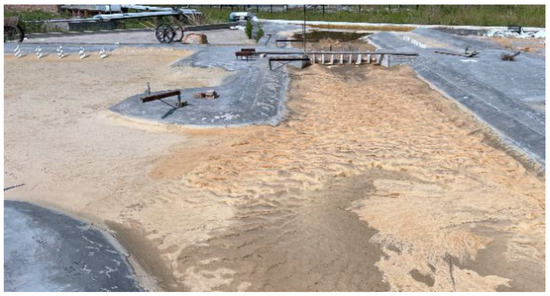
Figure 10.
Topographic distribution after the siltation experiment.
According to the analysis of the total amount of siltation after the test, it can be seen that the siltation between sections 5 and 11 was deeper, and the siltation in the intersection area (1–5 sections) was relatively shallow, but it was also very serious: the amount of siltation in the export area (sections a–i) was small; there was almost no siltation inside the wharf.
The total amount of siltation after the test is shown in Table 9. The analysis of the measured data shows that the siltation between sections 5 and 11 was deeper, and the siltation in the intersection area was relatively shallow, but it was also very serious. The amount of siltation in the export area was small and there was almost no siltation inside the wharf.

Table 9.
Total amount of siltation after the test.
After three different typical years of siltation tests, the siltation at the export area was small and evenly distributed, and the thickness was not deep. The average thickness was 13.6 cm (wet year), 9.88 cm (dry year), and 10.7 cm (normal year), respectively. Under normal circumstances, there is no need for dredging. The siltation in the intersection area is relatively thick. The deepest siltation thickness in the intersection area is shown in Table 10. It can be seen that the siltation distribution is uneven and the terrain changes greatly. The average siltation thickness of the three typical years in the intersection area was 2.27 m, 0.74 m, and 1.41 m.

Table 10.
The deepest siltation thickness of each section in the intersection area.
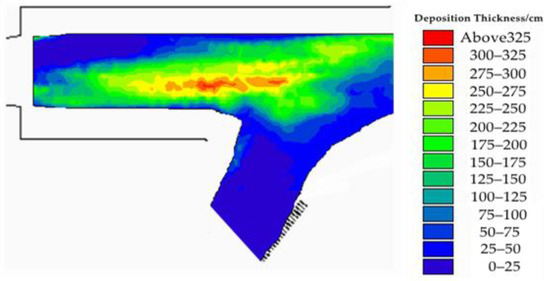
Figure 11.
Distribution of siltation thickness in the wet year.
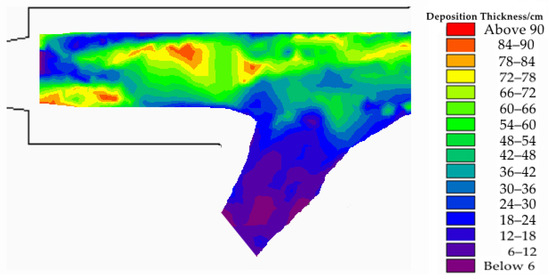
Figure 12.
Distribution of siltation thickness in the dry year.
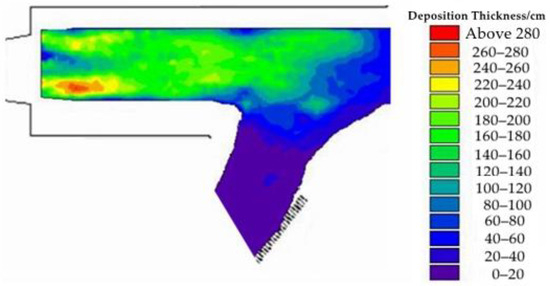
Figure 13.
Distribution of siltation thickness in the normal year.
According to the actual engineering requirements, the bottom elevation of the hub is 26 m, and the normal water level is 31.5 m. Taking the deepest siltation thickness listed in Table 10 as an example, if the siltation thickness reaches 3.41 m, it is difficult to guarantee the navigation depth of 3.5 m under the conditions of normal water storage 2, bad water discharge, and design combination water discharge. The sediment deposition in the river has seriously affected the ship’s entry and exit from the wharf, so it is necessary to dredge the downstream river channel. In this experiment, the method of increasing the flow rate to simulate the erosion and deposition of the downstream river channel was adopted.
5.3. Distribution of Siltation after Scouring
On the basis of the silting terrain, the incoming flow was increased to the maximum navigation flow of 2000 m3/s, and the eight holes of the regulating gate were all opened. The erosion test was carried out for 6 h, so that the water flow was evenly discharged in the downstream channel of the control gate. The total amount of silting after scouring is shown in Table 11.

Table 11.
Total amount of silting after scouring.
As shown in Figure 14, the sediment deposited between sections 1 and 11was obviously scoured to the lower reaches after scouring, sediment deposition in the intersection area was greatly reduced, the water of the wharf area was still roughly in a static state, the siltation at the wharf export did not change much, and the siltation inside the wharf was still shallow.
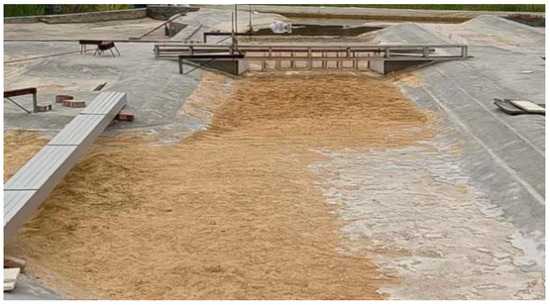
Figure 14.
Sedimentation distribution in the intersection area after scouring.
The comparison of siltation volume in different areas and different years before and after scouring is shown in Figure 15.
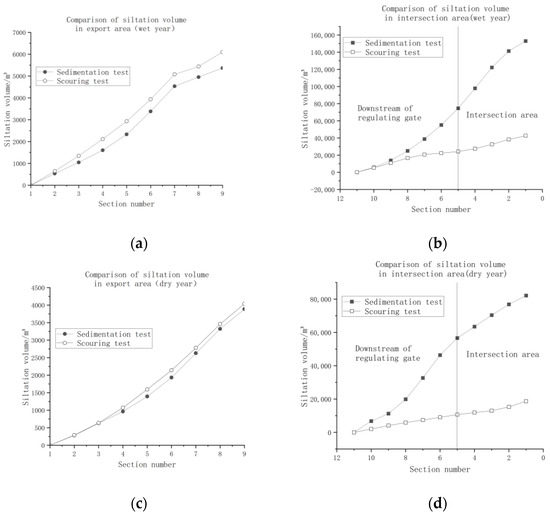
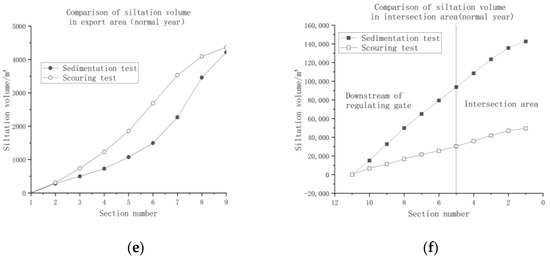
Figure 15.
Comparison of the total amount before and after scouring in the export area and intersection area. (a) Export area (wet year). (b) Intersection area (wet year). (c) Export area (dry year). (d) Intersection area (dry year). (e) Export area (normal year). (f) Intersection area (normal year).
From Figure 15, the effect of the scouring test on sediment deposition can be seen more intuitively: the sediment deposition in the intersection area is significantly reduced. Compared with the results of the siltation test, the amount of sand flushing reached 59,954.4 m3 in the wet year, 17,444.8 m3 in the dry year, and 29,695.2 m3 in the normal year, and the comprehensive sand flushing efficiency was 68.5%. The average siltation thickness in intersection area was reduced to 0.53 m, 0.23 m, and 0.55 m, which can meet the requirements of navigable water depth under various working conditions. The amount of siltation at the export area increased slightly, but the total amount was still small, which has almost no impact on the running of ships.
6. Conclusions
(1) From the observation of each test condition, it can be found that there are obvious dynamic and static segmentation areas in the intersection area, and the main flow is distributed downstream of the regulating gate and near the middle partition wall adjacent to the ship lock. At the export of the wharf and the end of the No. 11 wharf, the flow velocity is almost zero, and the water flow in the wharf area is mostly static.
(2) From the highest navigation conditions, it can be seen that the navigation in the export area is safe. In the intersection area, the ship should increase the navigation distance in and out of the port as much as possible and reduce the angle with the incoming flow to ensure that the transverse velocity meets the requirement of less than 0.3 m/s. The route planning should be as close as possible to section No. 17, and the other routes can refer to the highest navigation conditions. Under the conditions of 5-year flooding, the water level has exceeded the highest navigable level, and ships should cease entry and exit from the wharf.
(3) The results of the siltation test show that the sediment deposition downstream of the control gate is serious. There is slight siltation in the export area. The sediment deposition in the intersection area is serious. Under the conditions of the lowest navigable water level, bad water discharge and normal water storage 2, the flow depth cannot meet the navigation requirements, and river dredging is needed.
(4) Scouring has a significant improvement effect on siltation, and the sediment flushing efficiency can reach 68.5%. It is recommended to monitor the entrance area in real time. When the siltation affects the ship entering and leaving the wharf, the dredging should be reasonable during the non-navigable period. In the future, it is planned to introduce water flow from upstream of the regulating gate to the wharf area, and to rush the siltation in the entrance area downstream, so as to achieve the purpose of the dredging.
Author Contributions
Conceptualization, Y.Z. and X.W.; methodology, Y.Z.; software, X.W.; validation, Y.Z., X.W. and Y.Y.; formal analysis, X.W.; investigation, Y.Z., X.W., Y.Y. and B.C.; resources, Y.Z., X.W., Y.Y. and B.C.; data curation, X.W., Y.Y. and B.C.; writing—original draft preparation, Y.Z., X.W., Y.Y. and B.C.; writing—review and editing, Y.Z. and X.W.; visualization, Y.Z. and X.W.; supervision, Y.Z.; project administration, Y.Z.; funding acquisition, Y.Z. All authors have read and agreed to the published version of the manuscript.
Funding
This research received no external funding.
Data Availability Statement
The data presented in this study are available on request from the corresponding author. The data are not publicly available due to concerns regarding construction privacy.
Conflicts of Interest
The authors declare no conflicts of interest.
References
- Fošumpaur, P. Effects of Hydro Power Plant Releases on Navigation Conditions in the Lower Lock Approach. IOP Conf. Ser. Mater. Sci. Eng. 2002, 1252, 012049. [Google Scholar] [CrossRef]
- Qi, C.; Pu, X.; Peng, W.; Ouyang, Q.; Wang, D.; Liu, Z.; Wang, F. Development and Application of a New Auxiliary Diversion Structure for Mountain Ship Lock: A Case Study of Wuqiangxi Lock in China. Water 2023, 15, 941. [Google Scholar] [CrossRef]
- Böttner, C.-U.; Anschau, P.; Shevchuk, I. Analysis of the flow conditions between the bottoms of the ship and of the waterway. Ocean Eng. 2020, 199, 107012. [Google Scholar] [CrossRef]
- Zhang, S.; Yang, S.; Zeng, S.; Liu, X. Analysis of the effect of unsteady reservoir flow and sand excavation on the channel conditions of the Yangtze River (Yibin-Chongqing). SN Appl. Sci. 2022, 4, 146. [Google Scholar] [CrossRef]
- Wang, T.; Liu, L.; Zhu, W.; Wang, Y. Research and application of hydrodynamics modeling of channel in reservoir area-Case of Feilaixia station to Qingyuan station section. J. Phys. Conf. Ser. 2022, 2230, 012004. [Google Scholar] [CrossRef]
- Liu, Z.; Ma, A.; Cao, M. Shuifu-Yibin Channel Regulation Affected by Unsteady Flow Released from Xiangjiba Hydropower Station. Procedia Eng. 2012, 28, 18–26. [Google Scholar] [CrossRef][Green Version]
- Jia, T.; Qin, H.; Yan, D.; Zhang, Z.; Liu, B.; Li, C.; Wang, J.; Zhou, J. Short-Term Multi-Objective Optimal Operation of Reservoirs to Maximize the Benefits of Hydropower and Navigation. Water 2019, 11, 1272. [Google Scholar] [CrossRef]
- Lee, G.S.; Kim, N.I. Two-Dimensional Flow Analysis of Approach Channel for the Design of Spillway Guidewall. J. Korea Water Resour. Assoc. 1998, 31, 491–501. [Google Scholar]
- Cen, W.; Guo, J.R. Navigable Flow Condition Numerical Simulation for Approach Channel of Tian-gongtang Junction. Adv. Mater. Res. 2012, 1700, 2444–2448. [Google Scholar] [CrossRef]
- Ma, D.G.; Liu, X.; Zhao, J.Q.; Liu, X.F.; Li, S.X. The Research of Navigation Flow Conditions and Improvement Measures on Entrance Area and Connecting Reach of Dahua Lock in Hongshui River. Adv. Mater. Res. 2011, 1270, 3624–3629. [Google Scholar] [CrossRef]
- Cheng, Y.; Xia, J.; Zhou, M.; Deng, S.; Li, D.; Li, Z.; Wan, Z. Recent variation in channel erosion efficiency of the Lower Yellow river with different channel patterns. J. Hydrol. 2022, 610, 127962. [Google Scholar] [CrossRef]
- Bi, N.; Sun, Z.; Wang, H.; Wu, X.; Fan, Y.; Xu, C.; Yang, Z. Response of channel scouring and deposition to the regulation of large reservoirs: A case study of the lower reaches of the Yellow River (Huanghe). J. Hydrol. 2019, 568, 972–984. [Google Scholar] [CrossRef]
- Ji, U.; Jang, E.-K.; Kim, G. Numerical modeling of sedimentation control scenarios in the approach channel of the Nakdong River Estuary Barrage, South Korea. Int. J. Sediment Res. 2016, 31, 257–263. [Google Scholar] [CrossRef]
- Agunwamba, J.C.; Dike, C.C.; Ogarekpe, N.M.; Dike, B.U. Analysis of sedimentation of canals. Int. J. Dev. Sustain. 2013, 2, 306–332. [Google Scholar]
- Wang, J.; Guo, W.; Xu, H.T. Research on Sediment Problem in Dam Area of Three Gorges Project. Appl. Mech. Mater. 2014, 3489, 770–773. [Google Scholar] [CrossRef]
- Zhou, H.; Zhang, X.; Liu, J.; Lu, X.; Sun, H.; Di, S. Study on measures of preventing and reducing silting of old hydropower stations in high sediment content reservoir area. IOP Conf. Ser. Earth Environ. Sci. 2021, 768, 012004. [Google Scholar] [CrossRef]
- Yang, X.; Fang, W.; Wu, L. Experiment Study on Sediment Control and Sediment Discharge of Lake-Type Reservoir on Sediment-Laden River. Appl. Mech. Mater. 2015, 3843, 1066–1072. [Google Scholar] [CrossRef]
- Arman, D.M.; Gholamreza, A.; Shafai, B.M.; Abbas, P.; Hossein, R.S. Experimental Study of Variation Sediments and Effective Hydraulic Parameters on Scour Downstream of Stepped Spillway. Water Resour. Manag. 2023, 37, 4969–4984. [Google Scholar] [CrossRef]
- Fu, H.; He, X.; Ma, Y.C.; Yang, Y.Y. The Riverbed Evolution and its Influence on Channel in Tunaozi Reach after Three Gorges Water Storage. Appl. Mech. Mater. 2012, 2031, 2323–2327. [Google Scholar] [CrossRef]
- Xu, J. Complex response of channel fill-scour behavior to reservoir construction:an example of the upper Yellow river, China. River Res. Appl. 2013, 29, 593–607. [Google Scholar] [CrossRef]
- Ye, Y.; Liang, L.; Cao, Y.; Zhao, H.; Jiang, Y. Virtual Simulation Modeling and Visual Analysis of Sediment Erosion and Deposition Change in River Basin. Adv. Mater. Res. 2014, 1065–1069, 2989–2992. [Google Scholar] [CrossRef]
- Le, H.T.T.; Nguyen, C.V.; Le, D.H. Numerical study of sediment scour at meander flume outlet of boxed culvert diversion work. PLoS ONE 2022, 17, e0275347. [Google Scholar] [CrossRef]
- Yoo, H.J.; Kim, D.H.; Park, M.H.; Lee, S.O. Economic Sediment Transport Control with Sediment Flushing Curves for Sea Dike Gate Operation. J. Coast. Res. 2021, 114, 161–165. [Google Scholar] [CrossRef]
- Pan, J.-S.; Song, C.-Y.; Li, C.-Z.; Liu, Y.-L. Study on reflection and transmission characteristics of shear waves at sediment layer interface. Appl. Geophys. 2022, 19, 53–64. [Google Scholar] [CrossRef]
- Zhang, J.; Yang, X.; Fan, G.; Li, H.; Zhou, J. Physical and numerical modeling of a landslide dam breach and flood routing process. J. Hydrol. 2024, 628, 130552. [Google Scholar] [CrossRef]
- De Leo, A.; Ruffini, A.; Postacchini, M.; Colombini, M.; Stocchino, A. The Effects of Hydraulic Jumps Instability on a Natural River Confluence: The Case Study of the Chiaravagna River (Italy). Water 2020, 12, 2027. [Google Scholar] [CrossRef]
- Castellino, M.; Moroni, M.; Cimorelli, C.; Di Risio, M.; De Girolamo, P. Riverbed Protection Downstream of an Undersized Stilling Basin by Means of Antifer Artificial Blocks. Water 2021, 13, 619. [Google Scholar] [CrossRef]
- SL252-2017; Standard for Rank Classification and Flood Protection Criteria of Water and Hydropower Projects. The Ministry of Water Resources of the People’s Republic of China: Beijing, China, 2017; p. 5.
- SL155-2012; Specification for Normal Hydraulic Model Test. The Ministry of Water Resources of the People’s Republic of China: Beijing, China, 2012; pp. 35–37.
- Meng, L.; Wang, L.; Zhao, J.; Zhan, C.; Liu, X.; Cui, B.; Zeng, L.; Wang, Q. End-member characteristics of sediment grain size in modern Yellow River delta sediments and its environmental significance. Front. Mar. Sci. 2023, 10, 1141187. [Google Scholar] [CrossRef]
- Ji, Y.; Yang, F.; Zhang, H.; Lu, Y. A siltation simulation and desiltation measurement study downstream of the Suzhou Creek Sluice, China. China Ocean Eng. 2013, 27, 781–793. [Google Scholar] [CrossRef]
- Stokes, G.G. On the Effect of the Internal Friction of Fluids on the Motion of Pendulums. Trans. Camb. Philos. Soc. 1851, 9 Pt II, 8–106. [Google Scholar]
- Chien, N.; Wan, Z. Mechanics of Sediment Transport; Science Press: Beijing, China, 1991; pp. 245–252. [Google Scholar]
- GB50139-2014; Inland Navigation Standard. Ministry of Transport Water Board: Beijing, China, 2014; p. 12.
- Sharafati, A.; Tafarojnoruz, A.; Shourian, M.; Yaseen, Z.M. Simulation of the depth scouring downstream sluice gate: The validation of newly developed data-intelligent models. J. Hydro-Environ. Res. 2020, 29, 20–30. [Google Scholar] [CrossRef]
Disclaimer/Publisher’s Note: The statements, opinions and data contained in all publications are solely those of the individual author(s) and contributor(s) and not of MDPI and/or the editor(s). MDPI and/or the editor(s) disclaim responsibility for any injury to people or property resulting from any ideas, methods, instructions or products referred to in the content. |
© 2024 by the authors. Licensee MDPI, Basel, Switzerland. This article is an open access article distributed under the terms and conditions of the Creative Commons Attribution (CC BY) license (https://creativecommons.org/licenses/by/4.0/).