Article

Identifying the Most Discriminative Parameter for Water Quality Prediction Using Machine Learning Algorithms

by
Tapan Chatterjee
1,
Usha Rani Gogoi
2,*,
Animesh Samanta
1,
Ayan Chatterjee
3,
Mritunjay Kumar Singh
1 and
Srinivas Pasupuleti
4
1
Department of Mathematics and Computing, Indian Institute of Technology (Indian School of Mines), Dhanbad 826004, India
2
Department of Computer Science & Engineering, The Neotia University, Diamond Harbour, Kolkata 743368, India
3
Department of Mathematics, School of Science and Technology, The Neotia University, Diamond Harbour, Kolkata 743368, India
4
Department of Civil Engineering, Indian Institute of Technology (Indian School of Mines), Dhanbad 826004, India
*
Author to whom correspondence should be addressed.
Water 2024, 16(3), 481; https://doi.org/10.3390/w16030481
Submission received: 1 December 2023 / Revised: 25 January 2024 / Accepted: 27 January 2024 / Published: 1 February 2024
(This article belongs to the Special Issue Machine-Learning-Based Water Quality Monitoring)

Abstract

:
Groundwater quality is one of the major concerns. Quality of the groundwater directly impacts human health, growth of plants and vegetables. Due to the severe impacts of inadequate water quality, it is imperative to find a swift and economical solution. Water quality prediction may help us to manage water resources properly. The present study has been carried out considering thirty-seven water sample data points form the Pindrawan tank command area of Raipur district, Chhattisgarh, India. A total of nineteen physicochemical parameters were measured, out of which seventeen parameters were used to compute the weight-based groundwater quality index (WQI). In this present work, the primary goal is to identify the most effective parameters for WQI prediction. Out of the seventeen parameters tested, the Mann—Whitney—Wilcoxon (MWW) statistical test has revealed that five parameters Fe, Cr, Na, Ca, and Mg hold a strong statistical significance in distinguishing between drinkable and non-drinkable water. Out of these five parameters, Cr is the only parameter that maintains a different range of values for drinkable water and non-drinkable water. To validate the efficiency of these statistically significant parameters, machine learning techniques like Artificial Neural Networks (ANN) and Logistic Regression (LR) were used. The experimental results clearly demonstrate that out of all the seventeen parameters tested, utilizing only Cr yields remarkably high classification accuracy. ‘Cr’ achieved an accuracy of 91.67% using artificial neural networks. This is much higher than the accuracy of 66.67% obtained using a parameter set with all seventeen parameters. The proposed methodology achieved good accuracy when classifying water samples into drinkable and non-drinkable water using only one parameter, ‘Cr’.

1. Introduction

Groundwater is an invaluable resource that benefits both humans and plants. A significant proportion of Indians continue to rely on groundwater for drinking. Agriculture, which involves both growing crops and raising animals; and forestry, which involves the careful management of forests and woodlands, rely entirely on groundwater resources. The quality of drinking water profoundly affects human health. As reported in [1], about 2.5 billion illnesses and 5 million fatalities are water-borne diseases, that account for 80% of infections in developing countries. So, maintaining the quality of the groundwater is very crucial for human as well as plant health [2]. As found in the literature [3,4,5], many researchers have conducted groundwater quality-based studies. The in-depth investigations primarily concentrated on a specific geographical location, facilitating precise predictions of water quality and efficient management of water resources in that particular area [6]. Testing the water quality for every region is a tedious job, and it also costs an ample amount of money. Most existing studies [7,8,9] have examined over ten parameters to measure how they affect the Water Quality Index. The WQI plays a major role in this context. In the last decades, different types of water quality measurement techniques have been proposed and used. Most of these techniques use the weight of the parameters to calculate the WQI index. WQI is defined as a rating reflecting the composite influence of different water quality parameters [10]. WQI is calculated from the point of view of the suitability of surface water for human consumption [11]. To find out WQI, the authors used the same method used by Yisa et al. (2010) in [12]. In a review paper by Yan et al. (2022) [13] multiple methods of finding WQI have been discussed and addressed. Water quality degradation can have various negative impacts on the socio-economic aspects, such as soil erosion and changes in rainfall patterns. The consequences can be very dangerous [14]. So many counties monitor the water quality by monitoring certain physicochemical parameters [15,16]. This study aims to highlight the significance of proposing and evaluating a highly effective ML-based approach for accurately predicting real-time water quality.
Kord et al. (2022) [17] used 8 parameters including Na ,   Ca ,   Mg ,   Cl , SO 4 , pH, TH, and TDS to model the WQI. They modelled the WQI by using neural networks, with precipitation and water-table fluctuation as inputs. In [18], authors simulate and predict the pH, EC, TDS, TH, PLI, MHMI, and SPI using multiple linear regression (MLR) and artificial neural network algorithms. In a case study-based model to predict the groundwater quality index of Rafsanian Plain, authors used electrical conductivity, total hardness, total dissolved solid, pH, chloride, bicarbonate, sulfate, phosphate, calcium, magnesium, potassium, and sodium as the inputs [19]. In a novel prediction-based model [20], authors analyzed the increase in WQI for nine wells. They found that in five wells, the WQI increased significantly due to the presence of Mn, NH 4   , and NO 3 . Singha et al. (2021) [5] employed a highly effective machine-learning (ML) method to accurately anticipate the quality of groundwater. Instead of using the traditional method of calculating the Water Quality Index (WQI), the authors used a different method called the Entropy Weight-based Groundwater Quality Index (EWQI). This method is based on thirteen physicochemical parameters. ML algorithms such as the Naive Bayes classifier (NBC) and support vector machine (SVM) can accurately estimate and predict the Water Quality Index. These algorithms use measured field parameters to accurately predict the WQI. This eliminates the need for extra time and effort [21]. Gupta et al. (2019) [22] introduced an innovative cascade forward approach in their study, aiming to predict groundwater quality with exceptional accuracy. The method, based on advanced ANN delivers outstanding predictability. Sakizadeh conducted a study in 2016 where they successfully employed Bayesian regularization in an ANN model to make highly accurate forecasts of WQI. The results were highly impressive, with a prediction performance of 94% (R2) achieved. This clearly demonstrates the effectiveness and reliability of the model [23]. ML models have been utilized to predict the hardness of groundwater. They compared the performance of two models, boosted regression trees (BRT) and random forest (RF), using multivariate discriminant analysis (MDA). Using hardness values from 135 groundwater quality monitoring wells and using 11 predictor variables, an accurate determination of hard and soft water has been achieved [24]. Recent advances in ML techniques provide valuable tools for producing an artificial groundwater recharge site suitability map (AGRSSM). A ML algorithm was developed to determine the ideal site for an agricultural groundwater recharge (AGR) project in Iranshahr. The algorithm used nine digitized and geo-referenced data layers. It was trained and validated using 1000 randomly selected points from the study area. The algorithm achieved an accuracy of 97% [25]. Mostly all the papers used more than six or seven parameters to conclude the groundwater quality. Collecting data and conducting laboratory tests can be incredibly time-consuming and financially burdensome. Additionally, the management of data often poses its own set of challenges [26]. Different ML techniques use the water body’s location and elevation as inputs to accurately predict contamination levels. The results are reviewed and analyzed according to groundwater contamination and the chemical composition of the groundwater location. Predictions for pH, temperature, turbidity, dissolved oxygen, hardness, chlorides, alkalinity, and chemical oxygen demand rely on unalterable parameters like latitude, longitude, and elevation [27]. Gaagai et al. (2023) studied groundwater quality for irrigation in the Sahara aquifer in Algeria. They used various methods including irrigation water quality indices (IWQIs), ANN models, and Gradient Boosting Regression (GBR). They also employed multivariate statistical analysis and a geographic information system (GIS). They analysed 27 groundwater samples using traditional techniques. To enhance IWQI, they applied two ML models: ANN and GBR. Their analysis showed that the ANN model outperformed the GBR model, yielding exceptional results [28]. Furthermore, it is worth noting that the process typically requires several years to yield conclusive results. Additionally, it is important to consider that throughout this timeframe, the impact on different regions may undergo modifications [29]. In their study, Asadollah et al. (2021) examined 10 different water quality parameters in order to assess the monthly water quality of the Lam Tsuen River in Hong Kong [30]. Researchers frequently attempt to minimize the number of parameters in order to reduce both costs and the size of the dataset [31]. Knowledge driven and machine learning decision tree-based approach, ANN and deep learning were used in different papers to identify the water quality [32,33,34]. Many studies neglect to capitalize on available data sets when choosing parameters for their research, resulting in inflated costs for the entire project [35].
Based on the literature survey, it has been observed that in order to predict the quality of groundwater, it is essential to analyze multiple parameters and compile the data to make accurate predictions [7,10]. Often this process becomes tedious, time-consuming, manpower-intensive and requires huge amounts of funding to check all the parameters. Because contaminants vary in weight, it is not sufficient to rely on just one or two parameters. It would be more effective to identify the most influential parameter on groundwater contamination using statistical and ML techniques [36]. Previous studies in this area have not provided much insight.
This study aims to uncover the fundamental physicochemical parameters that have a significant impact on water quality in order to address the issues previously mentioned. So, in this recent work, the novelty of the problem is described as follows. Firstly, the authors try to address the problem of identifying the most impactful parameters for analyzing water quality. Furthermore, the authors thoroughly examine the selected optimal parameters in order to unveil the fundamental factor that genuinely differentiates drinkable water from non-drinkable water. Importantly, the authors did so by using existing data instead of creating a new dataset. The Mann—Whitney—Wilcoxon test was used to find statistically significant discriminative parameters for water quality estimation. The authors identified five parameters with clear statistical significance for predicting water quality, out of a total of nineteen present in the dataset. Cr has a distinct range of values for drinkable and non-drinkable water, among these five discriminating parameters. Moreover, the chosen discriminative features were assessed using machine learning techniques to determine their effectiveness in predicting water quality.
The remaining sections of the paper are structured as follows. In Section 2, the experimental dataset and methodology are described. Section 3 provides and discusses the experimental results of the proposed system. It also discusses the results obtained with the different experimental setups. Finally, Section 4 ends with a conclusion of the current work and some notes on future enhancements.

2. Methodology

2.1. Experimental Dataset

For the experimental purpose, we have considered a dataset comprising 37 samples collected from the Pindrawan tank command area of Raipur district, Chhattisgarh, India. Each sample is represented by using 19 significant parameters including pH, Cond, TDS, Alk, Cl ,   Hd ,   F ,   Fe ,   Cr ,   Na ,   K ,   CO 3 ,   HCO 3 , Cl, Ca, Mg, HNO3, Fluoride, and SO4. For labelling of the samples into drinkable and non-drinkable water, we referred to the work published in [12]. In [12], the authors proposed an approach to water quality classification based on the water quality index. Based on the WQI value, the water can be divided into five categories: excellent (WQI < 50), good water (50 < WQI < 100), poor water (100 < WQI < 200), very poor water (200 < WQI < 300), and water unsuitable for drinking (WQI > 300). Based on the parameters of our experimental dataset, we have also calculated the WQI value of each sample. However, due to the small size of our experimental dataset, instead of categorizing data into five classes, we categorize them into 2 classes: drinkable (WQI < 100) and non-drinkable (WQI > 100). In order to improve the accuracy of our predictions, it is important to maintain a balanced experimental dataset. To conduct experiments effectively, the experimental dataset is divided into two distinct sets: a training set and a testing set at a ratio of 8:2 (29 and 8 for training and testing, respectively).

2.2. Machine Learning Algorithms

As reported in the literature, authors have used ANN, multiple linear regression, RF, GBR, SVM, etc., for their research works. Being a classification task, the regression models are not applicable to our research work. Moreover, RF require a large amount of data to produce reliable results, and they may not perform well on small datasets [37]. Similarly, the SVM was overfitted due to very small experimental dataset. Considering that, along with ANN, we have evaluated the performance of logistic regression and K-nearest neighbour (KNN) which are good for a small experimental dataset [38,39] to evaluate the performance of the parameters used in water quality identification. This evaluation allowed us to determine the efficiency of these parameters and draw insightful conclusions. A brief description of each of these methods is provided below.
(1) Artificial Neural Network: ANN resembles how neuronal arrays work in biological learning and memory [40]. A neural network is a bio-inspired system made up of several neurons, which are single processing units. The neurons are coupled utilizing joint mechanisms with specific weights. As reported in the literature, it has been observed that ANN provided better performance over the other ML techniques [22]. In contrast to other ML techniques, ANN is also discovered to be a little bit more accurate with noisy data. With the development of technology and datasets, ANN proves effective in this context. ANN architecture typically comprises of an input layer, a hidden layer and an output layer [40]. The connection between two layers is represented by biases and weights. If Xi is the input at neuron i, bj is the bias of neuron j, and the weight connection from neuron i to neuron j is denoted by Wij, then the activation at the jth neuron is given by the following equation:
Yj = ∑(Xi Wij) + bj
(2) Logistic Regression: LR is a supervised ML algorithm. Its name is logistic regression because its foundation is the logistic or sigmoid function. It is one of the most widely used algorithms for binary classification. LR uses a method known as maximum likelihood estimation to find the model equation as follows:
log[p(X)/(1 − p(X))] = β0 + β1X1 + β2X2 + … + βp
where:
  • Xj: The jth predictor variable
  • βj: The coefficient estimate for the jth predictor variable
(3) K-nearest neighbour: KNN is one of the simplest and widely used supervised ML algorithms. It is a non-parametric and lazy learning algorithm meaning it does not explicitly learn a model during the training phase. Instead, it memorizes the entire training dataset and makes predictions by measuring the similarity of new datapoints with the training samples. Various similarity or distance metrics like Euclidean distance, Manhattan distance and Minkowski distance are there for measuring the similarity between the training samples and new data points.

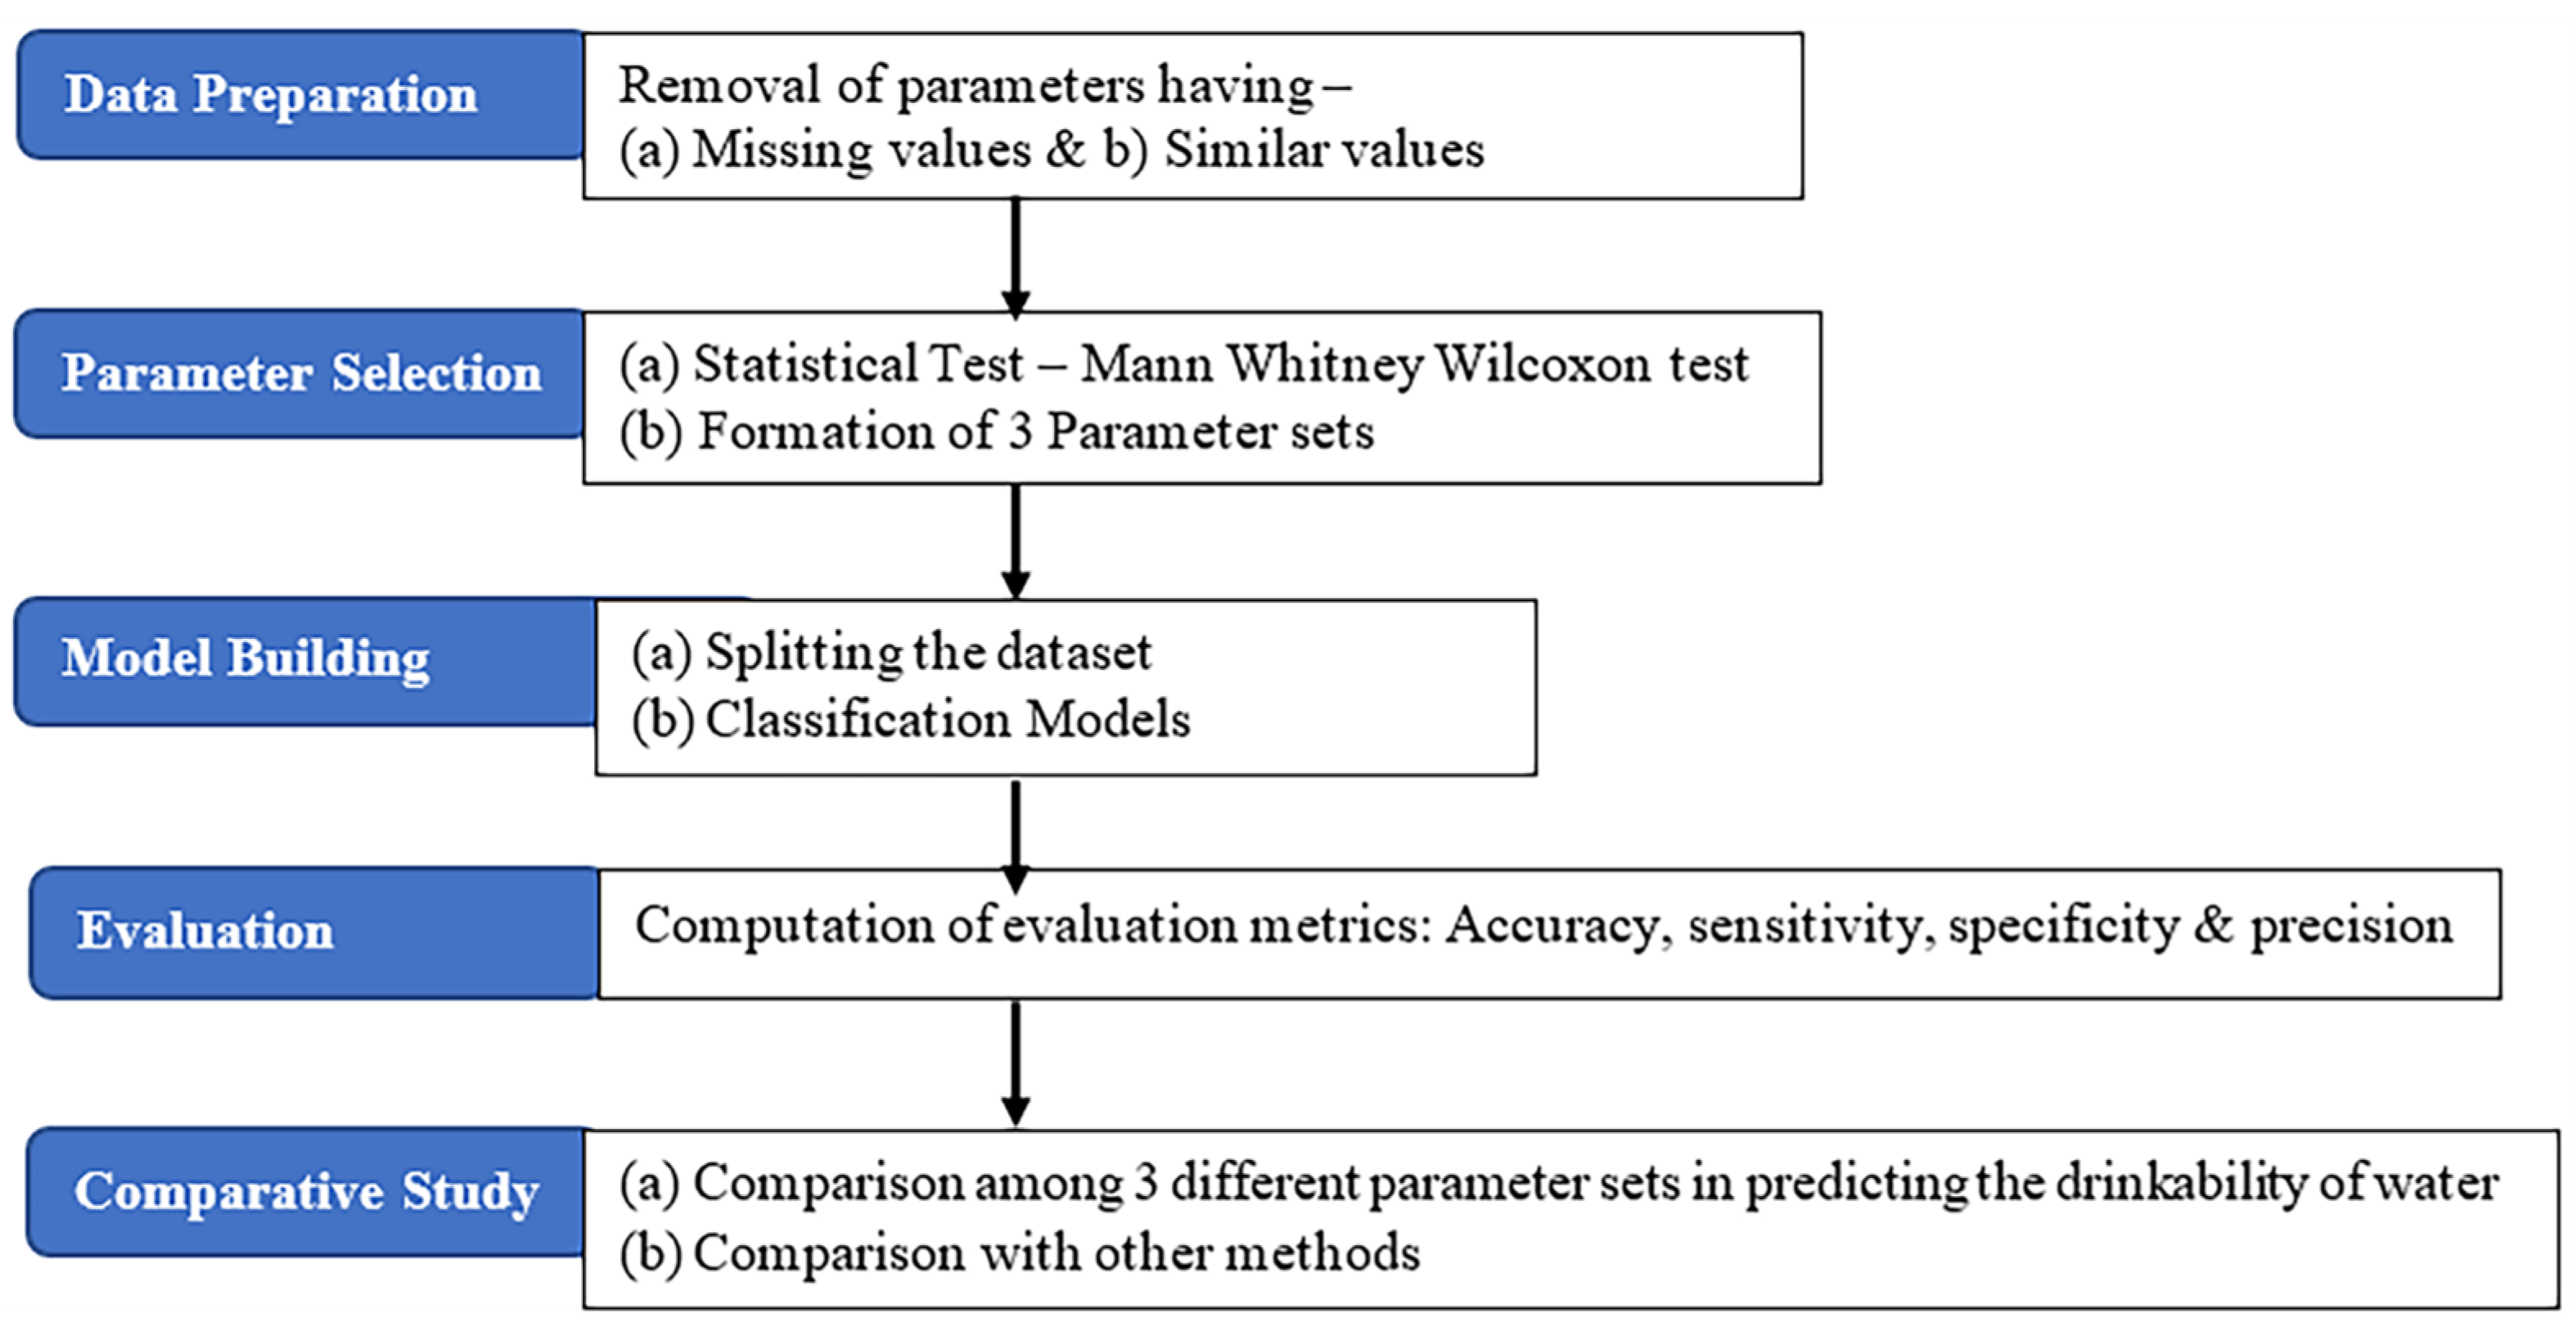
2.3. Proposed Methodology

Our proposed method for predicting water quality begins with a pre-processing phase. This is followed by identifying the most crucial parameters that determine water quality. We then classify samples into categories of drinkable and non-drinkable water. Finally, we evaluate the performance of our designed system to ensure its effectiveness. The flow of the proposed methodology is provided in Figure 1.

2.3.1. Pre-processing

In the experimental dataset, there are some missing values in the ‘ F ’ column, for which authors have dropped the column. Like ‘ F ’, the ‘CO3′ column was also dropped as all entries in the ‘CO3′ columns have the same value ‘0′. After removing the missing values, the data was further enhanced through the application of Standard Scaler (SS) for data normalization. The average values of the parameters for drinkable and non-drinkable water are shown in Table 1.

2.3.2. Parameter Selection

In order to achieve a high level of accuracy in classification, it is essential to focus on parameter selection. As mentioned before, the experimental dataset has been updated with a total of 17 parameters after removing the F   and   CO 3 parameters. As mentioned earlier, the number of samples are low (<38) in each category of our experimental dataset. Moreover, the sample distributions of each parameter are not normally distributed and they are independent. Considering the properties of the samples, the MWW test [41] was used to identify the relevant parameters and discard irrelevant parameters. The MWW test is also referred to as the Wilcoxon Rank Sum test. The MWW test found only those parameters that reached significant differences (p < 0.005) and these parameters are considered as the most discriminative parameters for water quality prediction. The significance level of each parameter value is measured against the null hypothesis and tabulated in Table 1. As illustrated in Table 1, although there are significant differences between the mean values of the parameters of the drinkable and non-drinkable water, only five parameters: Fe, Cr, Na , Ca, and Mg are found to be statistically significant (p < 0.05) in discriminating the drinkable water from the non-drinkable water. The p-value of these parameters reach the significant difference of p < 0.005 and are marked as significant in the fourth column in Table 1. The null hypothesis is Ho: The median of the non-drinkable water is less than the median of the drinkable water. But, the MWW test in most of the parameters rejected the null hypothesis by accepting the alternative hypothesis Ha: The median of the non-drinkable water is greater than the median of the drinkable water.
Furthermore, Figure 2 showcases a visually captivating box plot that effectively showcases the complete range of significant parameter values for both drinkable and non-drinkable water. Figure 2a illustrates that there is a shared range of Ca values between non-drinkable water and drinkable water. For Fe, Ca, Mg, and Na , the drinkable and non-drinkable water have a similar range of values. However, these values are not enough to distinguish between drinkable and non-drinkable water, even though they are statistically significant. The range of only one parameter, Cr, differs between drinkable and non-drinkable water. This difference is depicted in Figure 2b. We will assess the effectiveness of this single parameter in predicting water quality using different ML algorithms.

2.3.3. Model Building

As reported in earlier sections, authors have evaluated the efficiency of the statistically significant parameters by using three ML algorithms: (1) ANN, (2) LR and (3) KNN. For the experimental purpose, a 4-layered ANN comprising 1 input layer, 2 hidden layers, and 1 output layer was built. Depending on the experimental setup, the number of neurons in the input layer varies. After evaluating the performance of various numbers of neurons in the hidden layer, it has been found that the highest accuracy was achieved by having 6 neurons in both the first and second hidden layers. In the hidden layers, we used the ‘Relu’ activation function and in the output layer, the ‘SoftMax’ activation function was used. For designing the LR model, the performance of LR for various set of parameters were evaluated, out of which the highest classification accuracy was obtained with C = 1.0, penalty = ‘l2′, tolerance = 0.0001. Like ANN and LR, the performance of KNN was also evaluated for different combinations of k values and the distance metrics. After trial and error method, the highest accuracy of KNN was obtained with k = 7 and Minkowski distance metric.

3. Results and Discussion

To perform an efficient performance evaluation of the proposed findings, authors evaluate the classification performance of each ML model by using 3 different setups:
(a)
Performance evaluation of the ML models by using all 17 raw parameters
(b)
Performance evaluation of the ML models by using only statistically significant parameters
(c)
Performance evaluation of the ML models by using the most statistically significant parameter Cr.
Authors have utilized four of the most commonly used metrics—accuracy (ACC), recall (RC) or sensitivity (SN), specificity (SP), and precision (PR)—to thoroughly assess the classification algorithms’ performance. The mathematical formula for each of these metrics is provided below:
RC/SN = TP/(TP + FN) × 100
SP = TN/(TN + FP) × 100
ACC = (TP + TN)/(TP + TN + FP + FN) × 100
PR = TP/(TP + FP) × 100
where, TP is the number of non-drinkable water samples classified as non-drinkable.
TN is the number of drinkable water samples classified as drinkable.
FP is the number of drinkable water samples classified as non-drinkable.
FN is the number of non-drinkable samples of water as drinkable.

3.1. Performance of Different Sets of Parameters

This section assesses how well the ‘Cr’ parameter predicts water quality and compares its performance with other parameters. In the first experimental setup, all 17 parameters are fed to the classifiers. The values of each evaluation metric: ACC, SN, SP, and PR are listed in Table 2. As demonstrated in Table 2, it has been seen that the highest classification accuracy obtained with this setup is 66.67% with the ANN. Like the ACC, SN and SP are also poor in all the classifiers. Compared to the previous configuration, we observed that the performance of the second experimental setup, which included only five statistically significant parameters, led to an impressive increase in classification accuracy. By employing the ANN model, the accuracy improved significantly to an impressive 83.33%. In addition to enhancing the ACC classification, the SN and SP also experience significant improvements. The classification performance of the statistically significant parameter ‘Cr’ was evaluated in the last experimental setup, as shown in Table 2. The results revealed a significant improvement in the classification accuracy, reaching an impressive 91.67% when using the ANN model. Moreover, the performance of the SP also showed noticeable improvement.

3.2. Performance Comparison of the Proposed Method with Existing Methods

Many researchers have applied ML algorithms to predict water quality. However, most of these studies have primarily focused on regression models. The effectiveness of their proposed methods has been assessed using metrics such as mean square error, R-squared, and mean absolute error [1]. Being a classification method, the proposed method is compared with only those existing methods which were also classification-based methods. The comparison is performed based on the size of the experimental dataset, number of parameters, ML methods and performance measures. The summary of the comparison is provided in Table 3. According to the data presented in Table 3, the deep neural network (DNN) proposed by U achieved an impressive accuracy of 93%, making it the highest recorded accuracy [42]. However, due to the small dataset, we are not able to evaluate the performance of DNN in this current study. Despite having a minimal architecture, our proposed work achieves an impressive accuracy of 91.67%, which is comparable to the accuracy of DNN [42]. Moreover, as illustrated in Table 3, most of the existing works utilized more than one parameter for water quality prediction. Unlike other methods, our proposed approach requires only one parameter, making it a highly practical solution for real-time water quality prediction from multiple sources. The proposed method is not only efficient, it also allows for seamless integration at a minimal cost.

4. Conclusions

An innovative and highly effective ML-based system has been developed in this study. The study emphasizes on identifying the most effective parameters to classify the water as either drinkable or non-drinkable. The efficacy of 19 different parameters was evaluated to identify the most discriminative parameters for the water quality prediction. The efficiency of discriminative parameters were evaluated by using three most widely used classifiers: ANN, LR and KNN. The conclusions of this study are listed below:
(a)
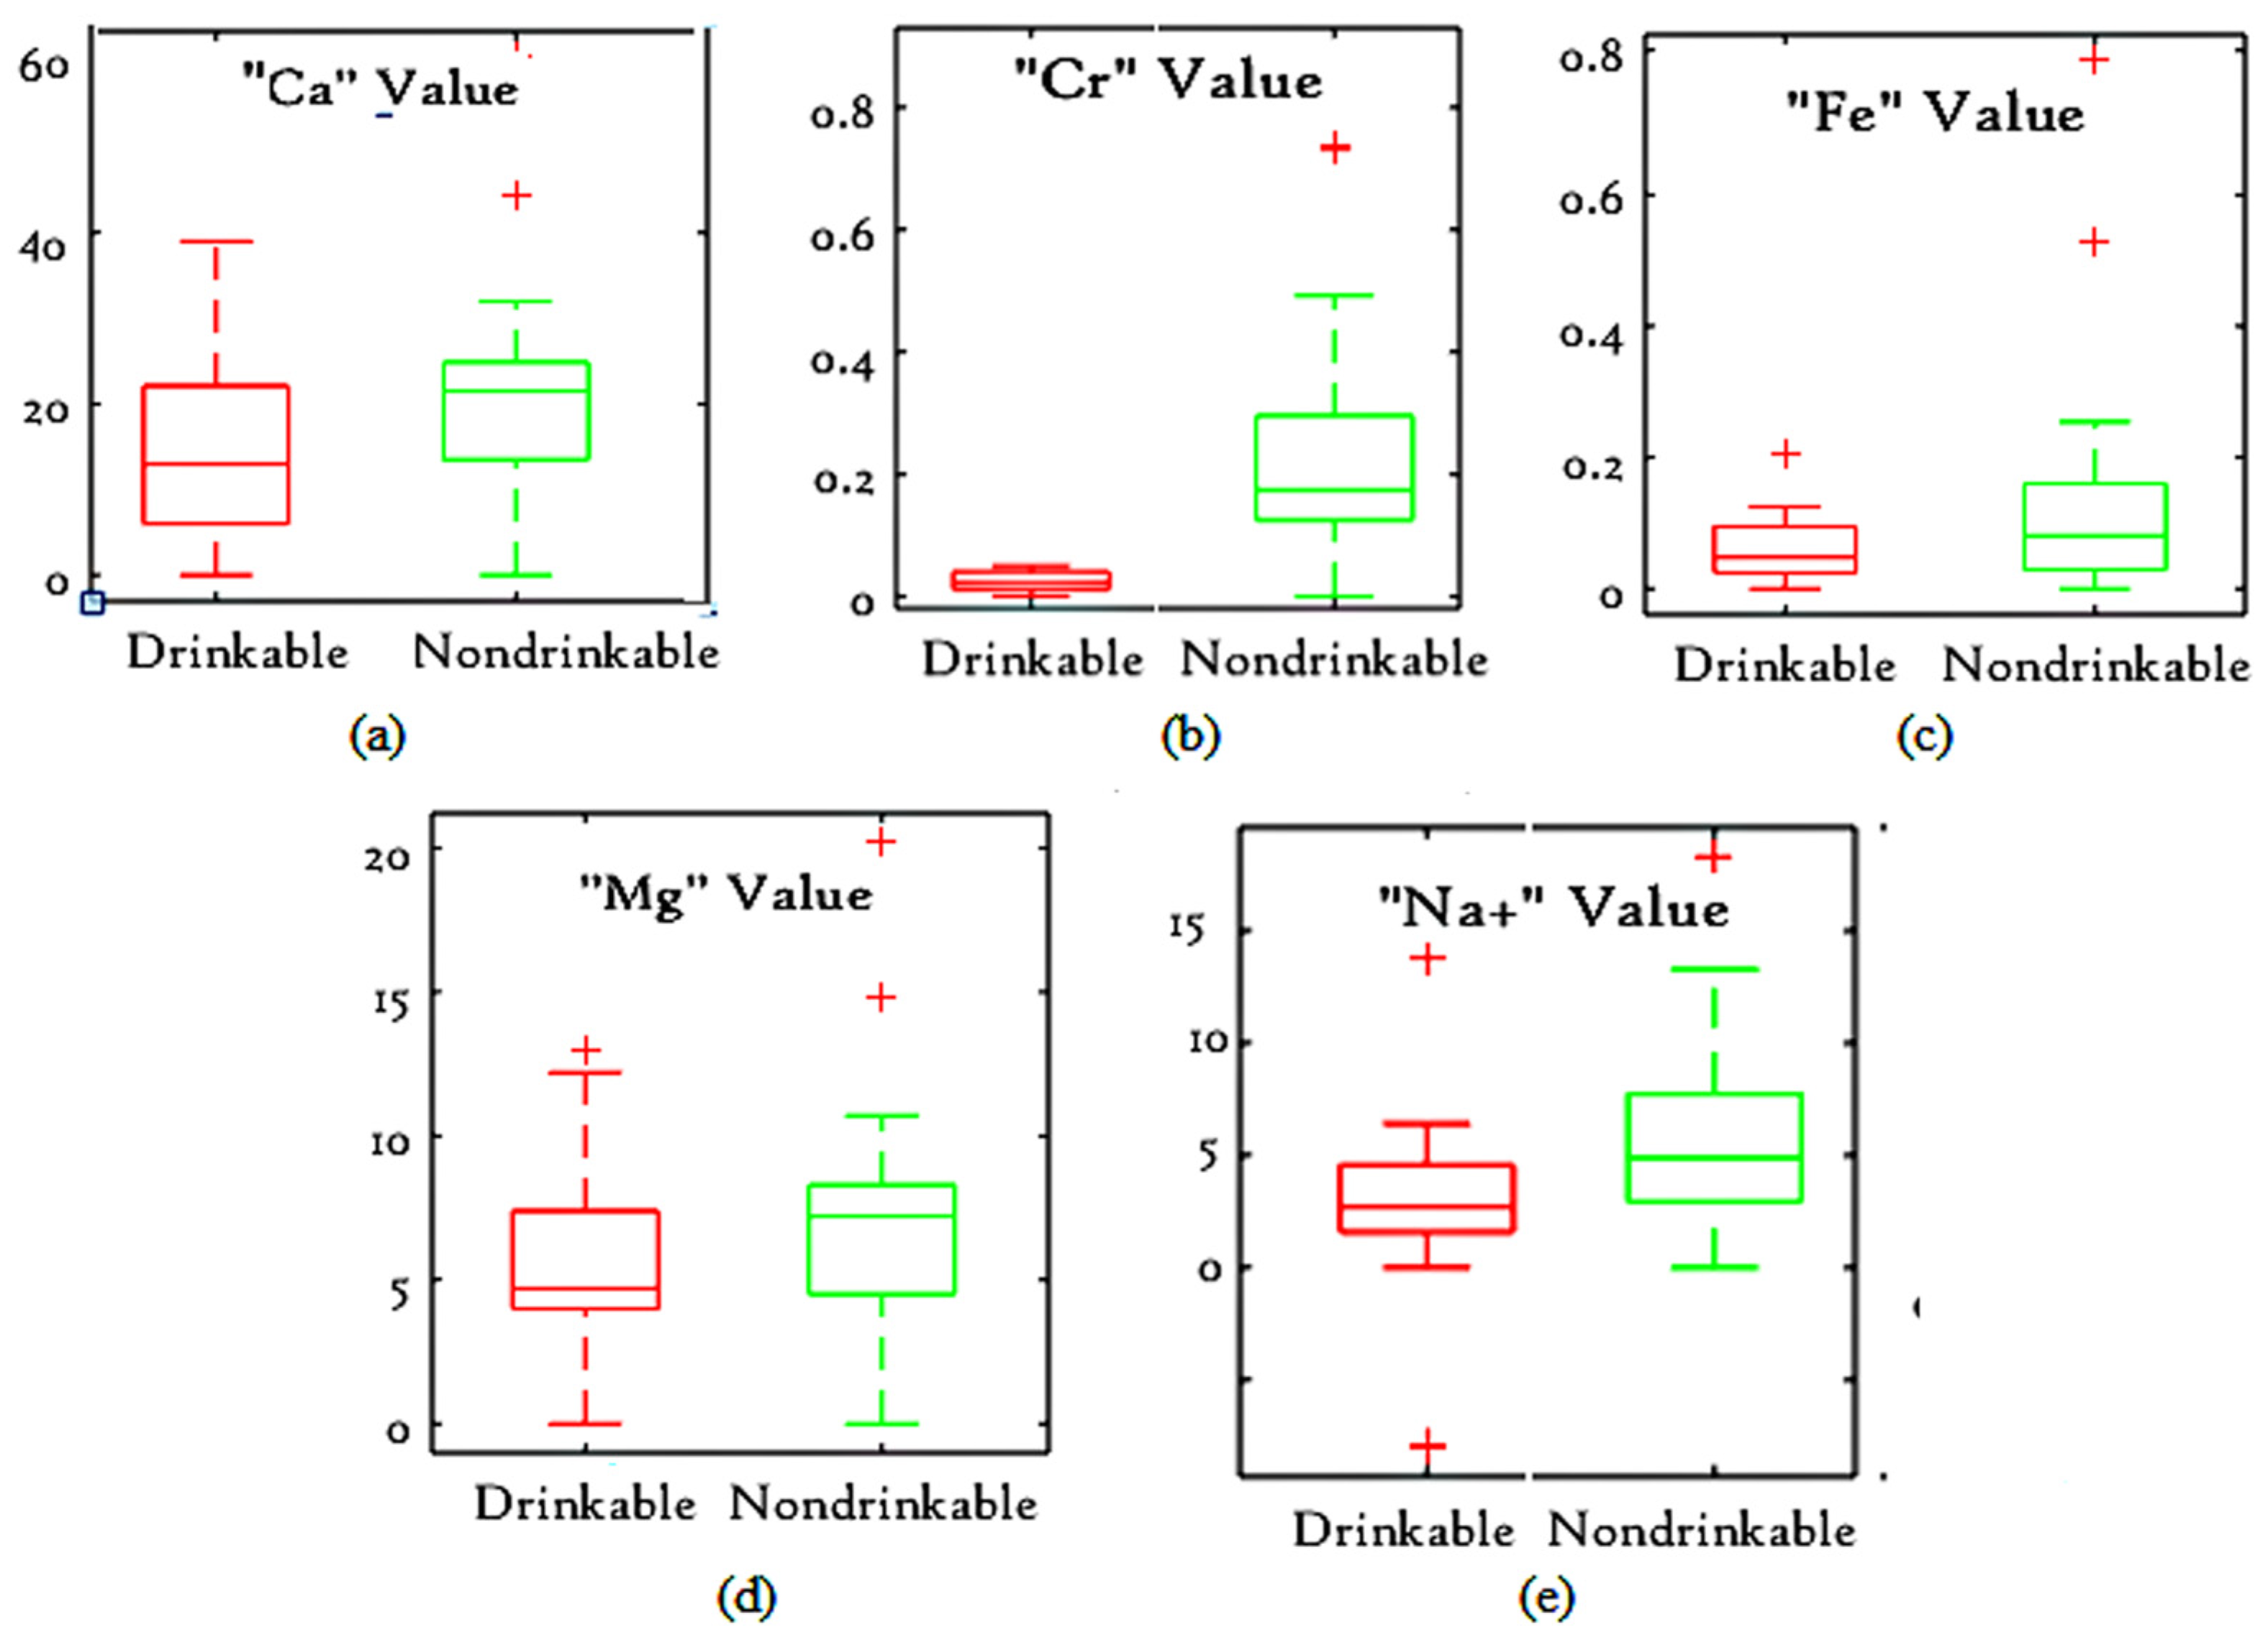
The MWW test reveals that out of all 19 parameters, five parameters including Fe, Cr, Na , Ca and Mg are statistically significant in water quality prediction.
(b)
Out of all these five statistically significant parameters, Cr is the most significant, as the range of Cr values for drinkable water differs from the range of Cr values for non-drinkable water.
(c)
The experimental results show that compared to LR and KNN, ANN is more efficient for water quality prediction. For different sets of parameters, the ANN always shows better results than both LR and KNN. Most of the time the difference is not less than 10%.
(d)
The system that utilizes only the statistically significant features like Fe, Cr, Na , Ca, and Mg achieves higher classification accuracy when compared to the system considering all parameters.
(e)
The system’s development with the single parameter ‘Cr’ has resulted in the most efficient system, achieving an impressive classification accuracy of 91.67% using ANN.
The study concludes that ML enables us to recognize the unique characteristics of a particular area and leverage it to accurately forecast water quality. This method significantly minimizes the time and cost of determining the WQI. However, the small size of the experimental dataset is the only limitation of our proposed method. In future, we will try to collect more real-time data to validate the efficiency of our proposed method.

Author Contributions

Conceptualization, A.S. and A.C.; methodology, U.R.G., T.C.; software, U.R.G. and T.C.; formal analysis, U.R.G. and T.C.; writing—original draft preparation A.S., A.C. and U.R.G.; writing—review and editing, T.C., M.K.S. and S.P.; visualization, U.R.G. and A.C.; supervision, M.K.S. and S.P. All authors have read and agreed to the published version of the manuscript.

Funding

This research received no external funding.

Data Availability Statement

The data presented in this study are available on request from the corresponding author.

Acknowledgments

The authors would like to thank Purushottam Agrawal, Superintending Engineer (Retd), Water Resources (Engg.) Dept., Govt. of Chhattisgarh for sharing the data for research purpose.

Conflicts of Interest

The authors declare that they have no conflicts of interest.

References

  1. Ahmed, U.; Mumtaz, R.; Anwar, H.; Shah, A.A.; Irfan, R.; García-Nieto, J. Efficient water quality prediction using supervised machine learning. Water 2019, 11, 2210. [Google Scholar] [CrossRef]
  2. Malik, A.; Yasar, A.; Tabinda, A.B.; Abubakar, M. Water-borne diseases, cost of illness and willingness to pay for diseases interventions in rural communities of developing countries. Iran. J. Public Health 2012, 41, 39. [Google Scholar] [PubMed]
  3. Tong, S.T.; Chen, W. Modeling the relationship between land use and surface water quality. J. Environ. Manag. 2002, 66, 377–393. [Google Scholar] [CrossRef] [PubMed]
  4. Babiker, I.S.; Mohamed, M.A.; Hiyama, T. Assessing groundwater quality using GIS. Water Resour. Manag. 2007, 21, 699–715. [Google Scholar] [CrossRef]
  5. Singha, S.; Pasupuleti, S.; Singha, S.S.; Singh, R.; Kumar, S. Prediction of groundwater quality using efficient machine learning technique. Chemosphere 2021, 276, 130265. [Google Scholar] [CrossRef] [PubMed]
  6. Abbaspour, K.C.; Rouholahnejad, E.; Vaghefi, S.; Srinivasan, R.; Yang, H.; Kløve, B. A continental-scale hydrology and water quality model for Europe: Calibration and uncertainty of a high-resolution large-scale SWAT model. J. Hydrol. 2015, 524, 733–752. [Google Scholar] [CrossRef]
  7. Lenat, D.R. Water quality assessment of streams using a qualitative collection method for benthic macroinvertebrates. J. North Am. Benthol. Soc. 1988, 7, 222–233. [Google Scholar] [CrossRef]
  8. Bonney, R.; Ballard, H.; Jordan, R.; McCallie, E.; Phillips, T.; Shirk, J.; Wilderman, C.C. Public Participation in Scientific Research: Defining the Field and Assessing Its Potential for Informal Science Education. A CAISE Inquiry Group Report. Online Submission. 2009. Available online: https://eric.ed.gov/?id=ED519688 (accessed on 1 July 2009).
  9. Tim, U.S.; Jolly, R. Evaluating agricultural nonpoint-source pollution using integrated geographic information systems and hydrologic/water quality model. J. Environ. Qual. 1994, 23, 25–35. [Google Scholar] [CrossRef]
  10. Tyagi, S.; Sharma, B.; Singh, P.; Dobhal, R. Water quality assessment in terms of water quality index. Am. J. Water Resour. 2013, 1, 34–38. [Google Scholar] [CrossRef]
  11. Atulegwu, P.U.; Njoku, J.D. The impact of biocides on the water quality. Int. Res. J. Eng. Sci. Technol. 2004, 1, 47–52. [Google Scholar]
  12. Yisa, J.; Tijani, J.O. Analytical studies on water quality index of river Landzu. Am. J. Appl. Sci. 2010, 7. [Google Scholar] [CrossRef]
  13. Yan, T.; Shen, S.L.; Zhou, A. Indices and models of surface water quality assessment: Review and perspectives. Environ. Pollut. 2022, 308, 119611. [Google Scholar] [CrossRef]
  14. Sarker, B.; Keya, K.N.; Mahir, F.I.; Nahiun, K.M.; Shahida, S.; Khan, R.A. Surface and ground water pollution: Causes and effects of urbanization and industrialization in South Asia. Sci. Rev. 2021, 7, 32–41. [Google Scholar] [CrossRef]
  15. Camara, M.; Jamil, N.R.; Abdullah, A.F.B. Impact of land uses on water quality in Malaysia: A review. Ecol. Process. 2019, 8, 1–10. [Google Scholar] [CrossRef]
  16. Gangwar, S. Water quality monitoring in India: A review. Int. J. Inform. Comput. Technol. 2013, 3, 851–856. [Google Scholar]
  17. Kord, M.; Arshadi, B. Applying the water quality index with fuzzy logic as a way to analyze multiple long-term groundwater quality data: A case study of Dehgolān plain. Arab. J. Geosci. 2022, 15, 253. [Google Scholar] [CrossRef]
  18. Agbasi, J.C.; Egbueri, J.C. Assessment of PTEs in water resources by integrating HHRISK code, water quality indices, multivariate statistics, and ANNs. Geocarto Int. 2022, 37, 10407–10433. [Google Scholar] [CrossRef]
  19. Najafzadeh, M.; Homaei, F.; Mohamadi, S. Reliability evaluation of groundwater quality index using data-driven models. Environ. Sci. Pollut. Res. 2022, 29, 8174–8190. [Google Scholar] [CrossRef]
  20. Nsabimana, A.; Wu, J.; Wu, J.; Xu, F. Forecasting groundwater quality using automatic exponential smoothing model (AESM) in Xianyang City, China. Hum. Ecol. Risk Assess. Int. J. 2022, 29, 347–368. [Google Scholar] [CrossRef]
  21. Agrawal, P.; Sinha, A.; Kumar, S.; Agarwal, A.; Banerjee, A.; Villuri, V.G.K.; Annavarapu, C.S.R.; Dwivedi, R.; Dera, V.V.R.; Sinha, J.; et al. Exploring artificial intelligence techniques for groundwater quality assessment. Water 2021, 13, 1172. [Google Scholar] [CrossRef]
  22. Gupta, R.; Singh, A.N.; Singhal, A. Application of ANN for water quality index. Int. J. Mach. Learn. Comput 2019, 9, 688–693. [Google Scholar] [CrossRef]
  23. Sakizadeh, M. Artificial intelligence for the prediction of water quality index in groundwater systems. Model. Earth Syst. Environ. 2016, 2, 8. [Google Scholar] [CrossRef]
  24. Mosavi, A.; Hosseini, F.S.; Choubin, B.; Abdolshahnejad, M.; Gharechaee, H.; Lahijanzadeh, A.; Dineva, A.A. Susceptibility prediction of groundwater hardness using ensemble machine learning models. Water 2020, 12, 2770. [Google Scholar] [CrossRef]
  25. Zaresefat, M.; Derakhshani, R.; Nikpeyman, V.; GhasemiNejad, A.; Raoof, A. Using artificial intelligence to identify suitable artificial groundwater recharge areas for the Iranshahr basin. Water 2023, 15, 1182. [Google Scholar] [CrossRef]
  26. Tiyasha, T.; Tung, T.M.; Bhagat, S.K.; Tan, M.L.; Jawad, A.H.; Mohtar, W.H.M.W.; Yaseen, Z.M. Functionalization of remote sensing and on-site data for simulating surface water dissolved oxygen: Development of hybrid tree-based artificial intelligence models. Mar. Pollut. Bull. 2021, 170, 112639. [Google Scholar] [CrossRef] [PubMed]
  27. Banerjee, K.; Bali, V.; Nawaz, N.; Bali, S.; Mathur, S.; Mishra, R.K.; Rani, S. A machine-learning approach for prediction of water contamination using latitude, longitude, and elevation. Water 2022, 14, 728. [Google Scholar] [CrossRef]
  28. Gaagai, A.; Aouissi, H.A.; Bencedira, S.; Hinge, G.; Athamena, A.; Heddam, S.; Gad, M.; Elsherbiny, O.; Elsayed, S.; Eid, M.H.; et al. Application of water quality indices, machine learning approaches, and GIS to identify groundwater quality for irrigation purposes: A case study of Sahara Aquifer, Doucen Plain, Algeria. Water 2023, 15, 289. [Google Scholar] [CrossRef]
  29. Ongley, E.D. Water quality management: Design, financing and sustainability considerations. In Proceedings of the African Water Resources Policy Conference, Nairobi, Kenya, 26–28 May 1999. [Google Scholar]
  30. Asadollah, S.B.H.S.; Sharafati, A.; Motta, D.; Yaseen, Z.M. River water quality index prediction and uncertainty analysis: A comparative study of machine learning models. J. Environ. Chem. Eng. 2021, 9, 104599. [Google Scholar] [CrossRef]
  31. Uddin, M.G.; Nash, S.; Olbert, A.I. A review of water quality index models and their use for assessing surface water quality. Ecol. Indic. 2021, 122, 107218. [Google Scholar] [CrossRef]
  32. Singha, S.; Pasupuleti, S.; Singha, S.S.; Kumar, S. Effectiveness of groundwater heavy metal pollution indices studies by deep-learning. J. Contam. Hydrol. 2020, 235, 103718. [Google Scholar] [CrossRef]
  33. Agrawal, P.; Sinha, A.; Pasupuleti, S.; Nune, R.; Saha, S. Geospatial analysis coupled with logarithmic method for water quality assessment in part of Pindrawan Tank Command Area in Raipur District of Chhattisgarh. In Climate Impacts on Water Resources in India: Environment and Health; Springer: Cham, Switzerland, 2021; pp. 57–78. [Google Scholar]
  34. Agrawal, P.; Sinha, A.; Pasupuleti, S.; Sinha, J.; Chatterjee, A.; Kumar, S. A mathematical approach to evaluate the extent of groundwater contamination using polynomial approximation. Water Supply 2022, 22, 6070–6082. [Google Scholar] [CrossRef]
  35. Bui, D.T.; Khosravi, K.; Tiefenbacher, J.; Nguyen, H.; Kazakis, N. Improving prediction of water quality indices using novel hybrid machine-learning algorithms. Sci. Total Environ. 2020, 721, 137612. [Google Scholar] [CrossRef] [PubMed]
  36. Khalil, A.; Almasri, M.N.; McKee, M.; Kaluarachchi, J.J. Applicability of statistical learning algorithms in groundwater quality modeling. Water Resour. Res. 2005, 41, W05010. [Google Scholar] [CrossRef]
  37. Lingjun, H.; Levine, R.A.; Fan, J.; Beemer, J.; Stronach, J. Random forest as a predictive analytics alternative to regression in institutional research. Pract. Assess. Res. Eval. 2019, 23, 1. [Google Scholar]
  38. Sperandei, S. Understanding logistic regression analysis. Biochem. Medica 2014, 24, 12–18. [Google Scholar] [CrossRef]
  39. Zhang, Z. Introduction to machine learning: K-nearest neighbors. Ann. Transl. Med. 2016, 4, 218. [Google Scholar] [CrossRef]
  40. Montesinos López, O.A.; Montesinos López, A.; Crossa, J. Fundamentals of artificial neural networks and deep learning. In Multivariate Statistical Machine Learning Methods for Genomic Prediction; Springer International Publishing: Cham, Switzerland, 2022; pp. 379–425. [Google Scholar]
  41. Wilcoxon, F. Individual comparisons by ranking methods. In Breakthroughs in Statistics: Methodology and Distribution; Springer: New York, NY, USA, 1992; pp. 196–202. [Google Scholar]
  42. Shafi, U.; Mumtaz, R.; Anwar, H.; Qamar, A.M.; Khurshid, H. Surface water pollution detection using internet of things. In Proceedings of the 2018 15th International Conference on Smart Cities: Improving Quality of life Using ICT & IoT (HONET-ICT), Islamabad, Pakistan, 8–10 October 2018. [Google Scholar]
Figure 1. Methodology Flow.
Water 16 00481 g001
Figure 2. The boxplots for displaying the range of values for the statistically significant (a) Ca, (b) Cr, (c) Fe, (d) Mg, and (e) Na parameters in drinkable and non-drinkable water.
Water 16 00481 g002
Table 1. The mean values of the parameters in drinkable and non-drinkable samples along with their p-values obtained with the MWW test.
FeaturesDrinkable
(Mean ± SD)
Non-Drinkable
(Mean ± SD)
p-Values
pH7.93 ± 0.3587.81 ± 0.3020.8247
Cond601.733 ± 391.01735.16 ± 433.290.1199
TDS361.0667 ± 234.54444.24 ± 268.430.1199
Alk162 ± 66.23183.86 ± 74.680.0938
Cl 102 ± 54.43103.63 ± 70.030.3146
Hd215.67 ± 98.06194.77 ± 103.850.5451
Fe0.076 ± 0.0470.156 ± 0.1750.0237
Cr0.0254 ± 0.01500.2478 ± 0.1906.34 × 10−8
Na3.88 ± 3.126.281 ± 4.2160.0097
K6.819 ± 8.4527.516 ± 7.7800.1571
HCO34.167 ± 0.9064.25 ± 1.1750.2421
Cl0.148 ± 0.0890.164 ± 0.1380.421
Ca20.067 ± 9.96124.675 ± 11.550.0186
Mg6.93 ± 3.0618.22 ± 3.850.0244
HNO35.28 ± 1.5205.595 ± 1.250.1033
Fluoride0.58 ± 0.1440.485 ± 0.1630.866
SO435.2 ± 6.22036.59 ± 5.660.082
Table 2. The classification performance of different number of parameters in water quality prediction.
MLPerformance Measure(Setup—1)
All Features
(Setup—2) Statistically Significant Features(Setup—3)
‘Cr’
ANNACC66.67%83.33%91.67%
LRACC50.00%66.70%75.50%
KNNACC37.50%81.50%87.50%
ANNSN/RC83.33%100.00%83.33%
LRSN/RC50.00%83.33%100.00%
KNNSN/RC25.00%83.33%100.00%
ANNSP50.00%66.67%100.00%
LRSP37.50%50.00%57.14%
KNNSP50.00%83.33%83.33%
ANNPR57.00%69.00%89.00%
LRPR49.00%52.00%57.15
KNNPR51.00%52.00%60.00%
Table 3. Proposed method performance comparison with existing methods.
Authors, YearSize of the DatasetModel UsedNumber of
Parameters Used
Performance
ACCSN/RCSPPR
U. Ahmed et al. [1], 2019663 Samples10 ML algorithms,
MLP gave the highest result
4-Temperature, Turbidity, pH and
total dissolved solids
0.85070.5640__0.5659
U. Shafi [42], 2018667 SamplesSVM, NN, KNN & Deep NN3-Turbidity, temperature and pH0.930.93---0.94
Our proposed method37
Samples
ANN1- Cr0.91670.8310.89
Disclaimer/Publisher’s Note: The statements, opinions and data contained in all publications are solely those of the individual author(s) and contributor(s) and not of MDPI and/or the editor(s). MDPI and/or the editor(s) disclaim responsibility for any injury to people or property resulting from any ideas, methods, instructions or products referred to in the content.

