Article

Monitoring of Fish Migration in Fishways and Rivers—The Infrared Fish Counter “Riverwatcher” as a Suitable Tool for Long-Term Monitoring

by
Christian Haas
1,*,
Philipp Klaus Thumser
1,
Michael Hellmair
2,
Tyler J. Pilger
2 and
Martin Schletterer
3,4,*
1
I AM HYDRO GmbH, Leopoldstrasse 1, 78112 St. Georgen, Germany
2
FISHBIO, 1617 S Yosemite Blvd., Oakdale, CA 95361, USA
3
TIWAG—Tiroler Wasserkraft AG, Eduard-Wallnöfer-Platz 2, 6020 Innsbruck, Austria
4
Institute of Hydrobiology and Aquatic Ecosystem Management, University of Natural Resources and Life Sciences, Vienna (BOKU), Gregor-Mendel-Straße 33, 1180 Vienna, Austria
*
Authors to whom correspondence should be addressed.
Water 2024, 16(3), 477; https://doi.org/10.3390/w16030477
Submission received: 11 December 2023 / Revised: 11 January 2024 / Accepted: 29 January 2024 / Published: 31 January 2024

Abstract

:
With the globally increasing awareness regarding the interconnectivity between freshwater ecosystems, projects for re-establishing connectivity with fishways as well as stock management are increasing. To ensure the quality and impact of such projects and for extending the scientific state of knowledge on this topic, a detailed monitoring of these measures is mandatory. Automatic, passive, and contactless counting devices can play a major role in these long-term monitoring projects, both for animal protection (non-invasive methods) and technical issues (comparatively low-cost systems in terms of time). Infrared fish counters can be used in a variety of fisheries applications and have proven particularly valuable in situations when long-term or continuous monitoring in lotic systems is required. Herein, we describe the function and technical capabilities of the VAKI Riverwatcher fish counter, provide information regarding its installation, and highlight some specific, practical applications of this technology. We discuss how the Riverwatcher can be used to validate the functionality of fish passage structures and to provide abundance estimates of migratory fish populations. Finally, we call attention to the challenges associated with operating monitoring equipment in variable river systems and briefly discuss potential sources of error that can influence the monitoring results and approaches to minimize or alleviate these errors.

1. Introduction

Globally, riverine management entails, among other actions, the restoration of connectivity for fish at migration barriers. To meet this goal, fish passage structures such as vertical-slot passes, nature-like fishways, and fish lifts are constructed [1]. In Europe, the Water Framework Directive (WFD; directive 2000/60/EC) sets ecological targets for aquatic ecosystems, and re-establishing the longitudinal connectivity of river systems is an important issue therein [2,3]. To date, the functionality of fishways is typically evaluated using fish traps (fykes or nets) positioned within the passage structure [1,3,4]. However, the use of fish traps rarely yields long-term results about migration in fishways. Also, sampling by electrofishing and the marking of fish (e.g., PIT tagging, radio and acoustic tagging [5] is used, but this is labor intensive, often requires animal experimentation permits, and telemetry is limited by the battery life. In order to enable the continuous, non-invasive counting of fish, different camera systems were developed [6,7,8].
The first commercially available optical fish counter, the Riverwatcher, was introduced in 1993 by Vaki Aquaculture Systems and is based on counting equipment from the sector of aquaculture [9]. Monitoring is not restricted to fishways. Elsewhere, fish migration monitoring is applied to provide estimates of the population abundance and migration characteristics of protected and/or commercially valuable riverine fish species, which are then used to set harvest quotas or trigger protective measures.
Our article aims to summarize the application of the Riverwatcher and to discuss the advantages as well as the disadvantages of the system. A lot of monitoring campaigns are not published, and many reports must be considered as part of the “grey literature”. Herein, we provide an overview on the published data per country (search string “country & vaki & riverwatcher & monitoring & pdf” in www.google.com accessed on 2 December 2023).
This manuscript seeks to address the growing need for a comprehensive and non-invasive method for monitoring fish migration in rivers and fishways. With increasing ecological concerns and the legislative emphasis on river ecosystem health, understanding and evaluating the effectiveness of fish passage structures become mandatory. In the subsequent sections, we delve into a detailed overview of the Riverwatcher’s functionalities, discuss its advantages and limitations, and present case studies from Europe and the US. We synthesize the findings from the existing scientific literature as well as the grey literature to provide a comprehensive understanding of the applications of the Riverwatcher system’s role in fish migration monitoring.

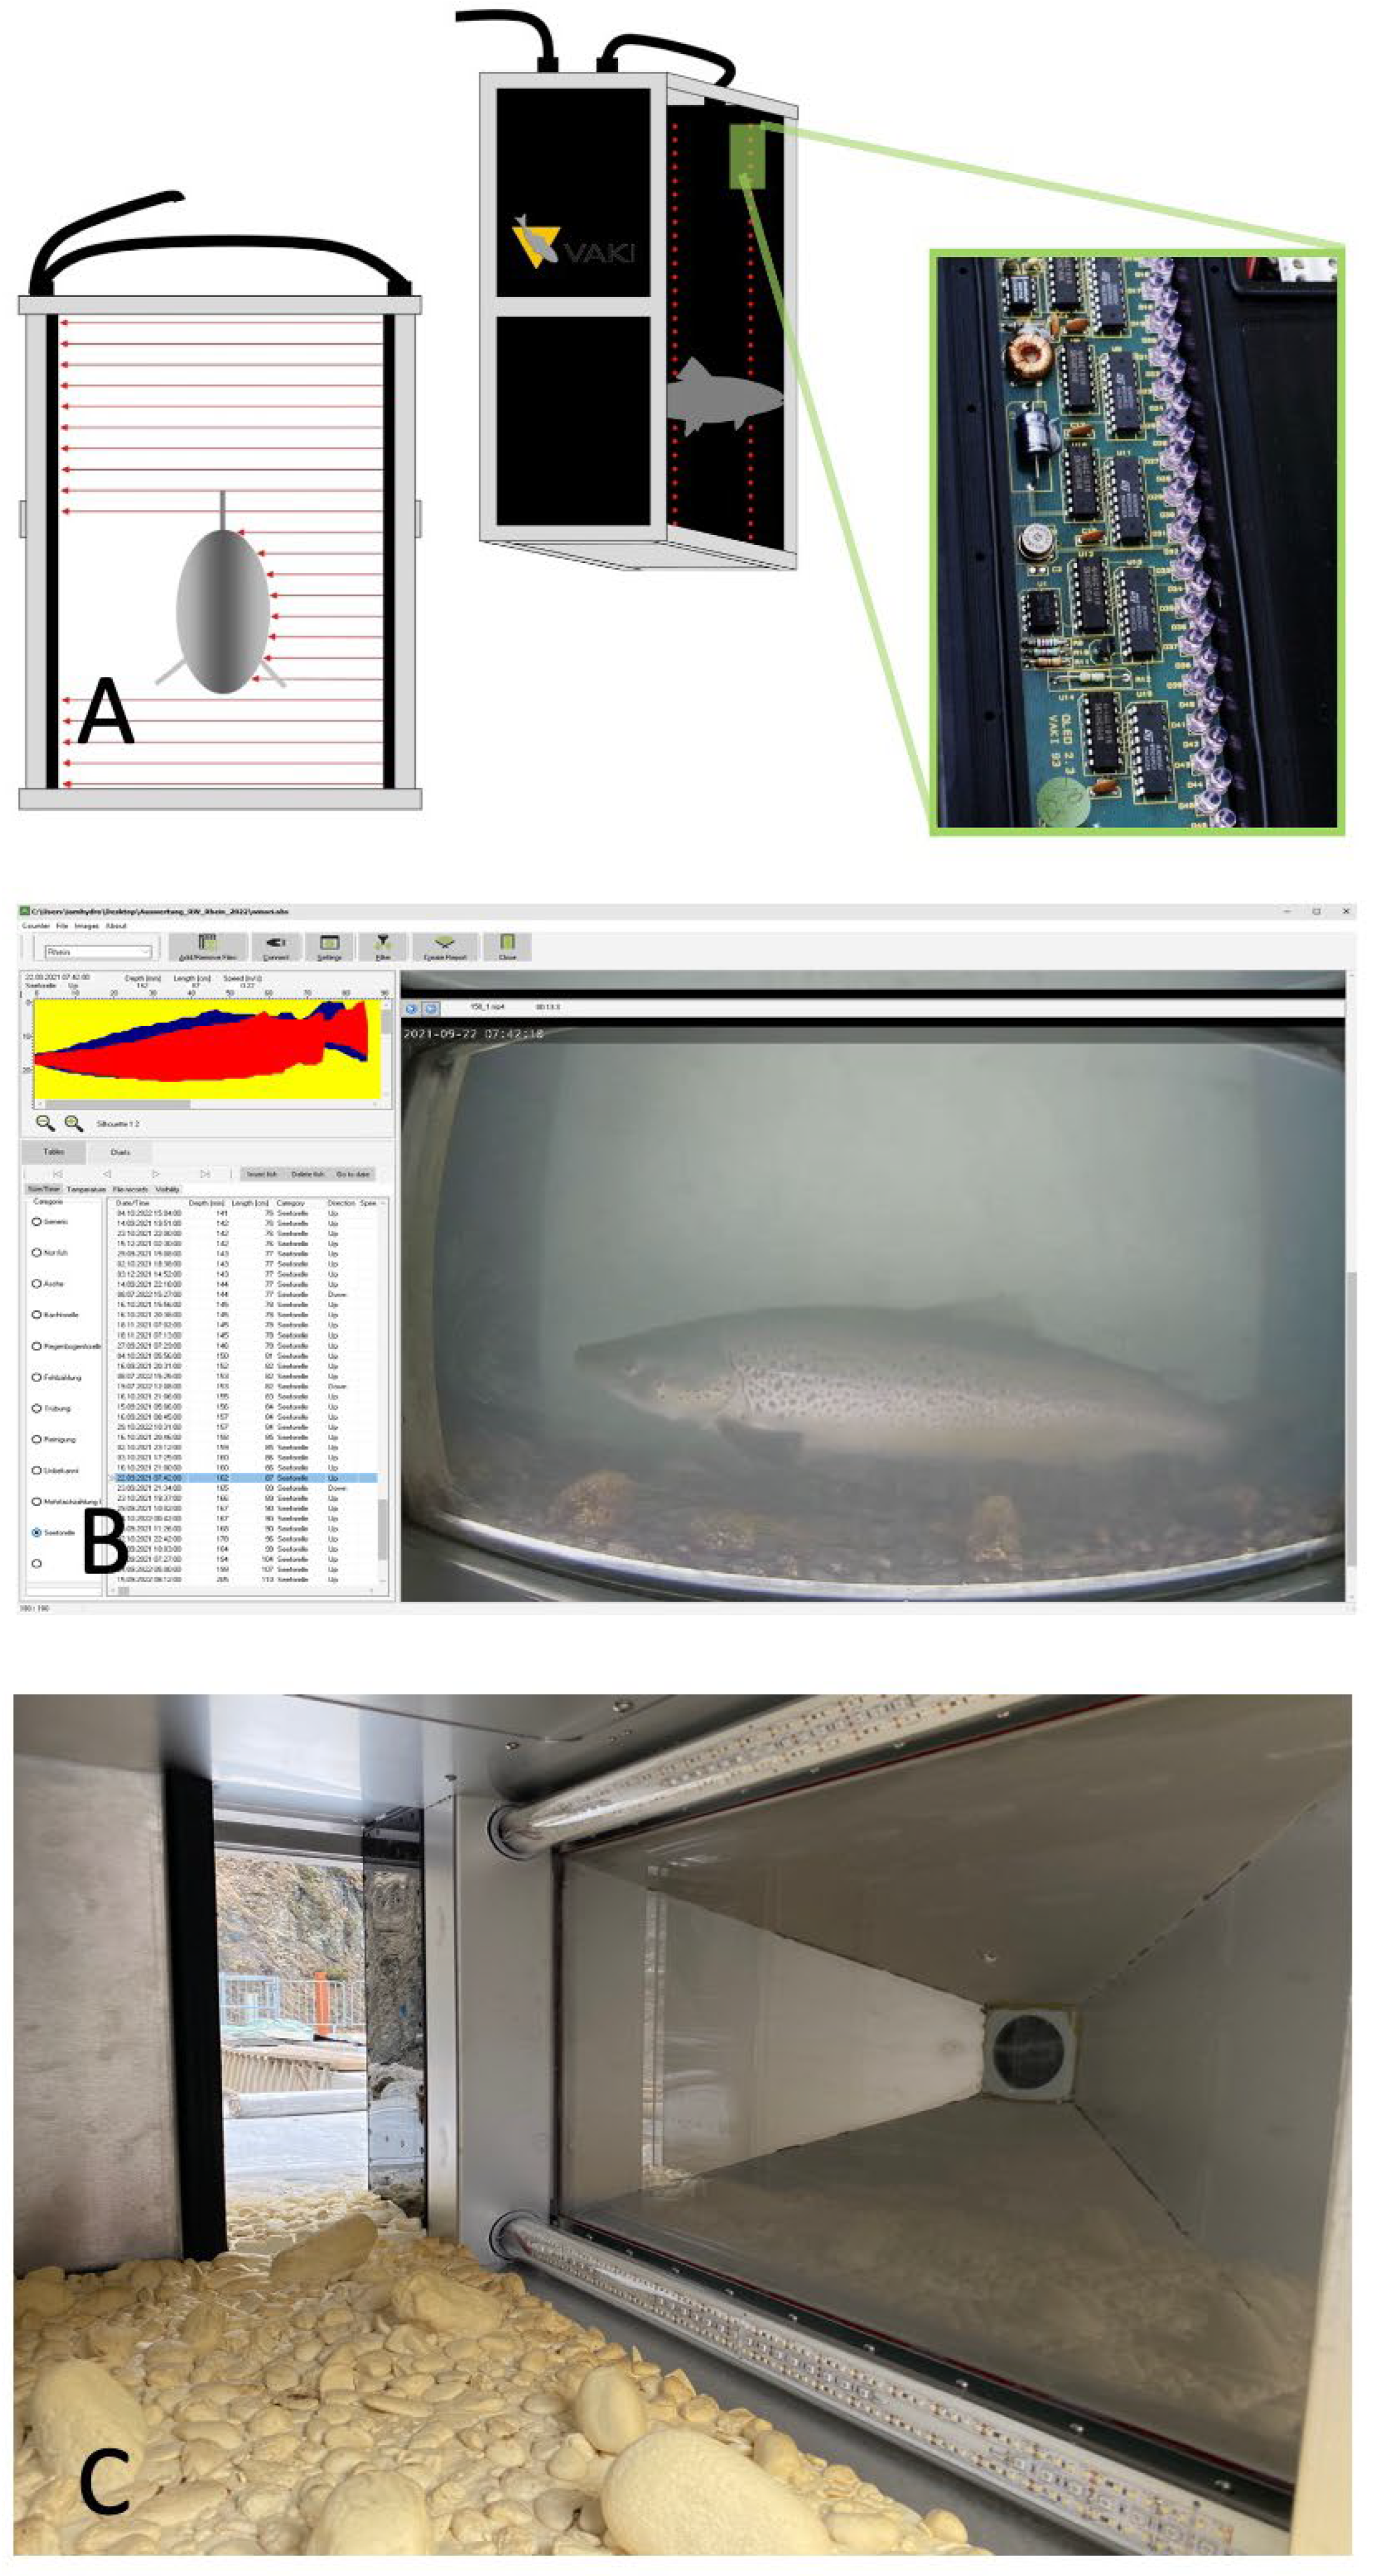
2. System Features and Its Application

The automatic fish counter Riverwatcher is a passive, contactless (non-invasive) counting device, which enables fish to pass the counter without delay or being trapped. Migrating fish are guided through a passage chute where infrared scanners detect, measure, determine direction, and record passing objects. However, not only are fish recorded with this system but also mammals and water birds. For example, in the catchment of the river Dee, the activity of Eurasian otters (Lutra lutra) was assessed [10].
The core of the Riverwatcher system is an infrared scanner with two vertical sets of infrared light barriers (Figure 1). Sequential triggering of these light barriers determines the direction, and a silhouette of the passing specimen is generated (Figure 1). Based on the silhouette, an estimate of the fish length can be automatically calculated using species- or population-specific relationships between body depth and fish length [4,11,12]. In locations where only one or a few easily distinguishable (i.e., with charismatic silhouettes) species occur, the silhouette is sufficient to determine species-specific passage counts. In locations with a more diverse fish community, an optional camera module can be used to aid in species identification. This optional module consists of a laterally mounted, air-filled, stainless-steel cone equipped with a digital camera and infrared and white light illumination. The length and height of the tunnel can be adjusted and customized according to the available space. In central European water bodies, the maximum width is usually limited to 45 cm to ensure proper functionality even during periods with elevated turbidity. In California, a spacing of 35 cm between scanner plates typically produces a 100% detection efficiency at turbidity levels of up to approximately 90 NTU in coastal streams with highly variable and turbid discharge; Riverwatcher systems have also been operated at turbidity levels of more than 800 NTU at a spacing of 20 cm but without species identification. The functionality of the Riverwatcher has been established in several central European rivers (e.g., [5,9,10,13]), the United States (e.g., [14,15,16,17]), and Australia (e.g., [18,19,20]), including in rivers with high species diversity. Herein, we describe the function of the device and present examples of specific applications and experiences from central Europe and North America (Table 1). The manufacturer states that more than 500 rivers are monitored with the Riverwatcher globally [9], i.e., rivers in Australia (e.g., [18,19,20]), Austria (e.g., [5,21]), Canada (e.g., [22]), the Czech Republic (e.g., [23]), Finland (e.g., [24]), France (e.g., [25]), Germany (e.g., [5,23]), Iceland (e.g., [26]), Ireland (e.g., [27]), Norway (e.g., [28,29]), Portugal (e.g., [13]), Poland (e.g., [30]), Spain (e.g., [31]), Switzerland (e.g., [32]), Sweden (e.g., [33,34]), the UK (e.g., [35,36,37]), and the USA (e.g., [38,39]). As shown in Table 1, some installations have been selected to show the long-term performance of the hardware.
Reliability, comparability, low maintenance and operating costs, and minimal effort for data processing are among the most important aspects of long-term monitoring strategies in fishways and rivers. Ideally, data collected during monitoring should permit an evaluation of migration patterns and species composition, specific to the location, species, and environmental (operational) conditions. With a VAKI Riverwatcher, reliability is generally provided through the proper application of the system, permanent installation with continuous operation, and adequate passage detection. Comparability is ensured by using identical systems and operational protocols (cleaning, maintenance, and data processing). Maintenance and cleaning intervals are strongly dependent on the water temperature (bio-film growth) and debris flow.
Initially developed for aquaculture purposes, the system has been used since 1992 for monitoring fish passage. Since then, VAKI Riverwatcher systems have been successfully deployed in many locations in central Europe and North America (e.g., Table 1, [12,44,45,46], meeting the above-mentioned requirements.
In theory, a passage record can be generated by passing debris and result in erroneous estimates of fish passage. This source of error can be at least partially eliminated by user-specified pre-processing of the raw data, i.e., only passing objects meeting size requirements are counted and recorded. Subsequent reviewing of the acquired footage can then be used to verify passage records and identify species, if applicable. When pre-processing is employed, reviewing of recorded footage is very efficient; even large datasets spanning several years can be processed within a relatively short period of time. Experience from California suggests that a period of about 15 min is required to review footage for a 24-h operation period with about 100 fish passages. Fish with a height of at least 2 cm and a length of at least 13 cm can be detected by the scanner. However, as the scanner was originally designed for salmon monitoring, the detection probability decreases substantially for fishes with heights smaller than from 4 to 6 cm, which should be taken into consideration when assessing the results.
For salmonids and larger cyprinids, the detection probabilities are generally high [12,13,21,45,46]. For more detailed observations (e.g., the migration of schooling fish or very small/slim individuals), continuous recording and/or motion-activated detection can be used. For a reliable assessment of the upstream migration of small or slim individuals, this option is recommended. By default, all recorded data are digitally stored on a hard drive on-site. However, remote data acquisition is also available through phone or data networks, permitting the downloading and reviewing of passage counts as well as the modification of operational settings. Remote data acquisition is particularly applicable and recommended at monitoring locations that are difficult or time-consuming to access.
In systems where complimentary monitoring or research efforts are underway, the Riverwatcher system can be combined with a PIT tag (passive integrated transponder) array. The Riverwatcher does not interfere with the PIT technology and can be used to obtain data specific to previously marked individual fish. Such PIT Tag Riverwatcher system have so far been installed in Sweden, e.g., at the river Testeboån in Gävle (Strömsbro), which allows for growth analyses of repeat spawners. For example, a tagged female seatrout (Salmo trutta) spawner returned several times, and the size measurements from the Riverwatcher revealed its condition, i.e., 03.08.2016 = 73 cm, 14.07.2017 = 78 cm, 02.07.2018 = 85 cm, 06.07.2019 = 99 cm, 03.07.2020 = 94 cm, and 03.07.2021 = 94 cm (pers comm. Magnus Thor Asgeirsson, 2021).

3. In Practice: Case Studies Showcasing the Riverwatcher’s Application in Fish Monitoring

3.1. Monitoring Passage at Fishways

The Riverwatcher is often installed in fishways to evaluate migration characteristics, to evaluate the functionality of the fishway, or to estimate abundance. When installing a Riverwatcher into an existing fishway, several factors must be taken into consideration to ensure the functionality of both the counter and the fishway itself. If a new fishway is constructed, it is best to plan for the integration of the counter during the design phase, which helps to ensure adequate accessibility for installation and maintenance.
It is important to ensure that the functionality of a fish passage structure is not diminished by the installation of a counting device [4]. To avoid impairing the hydraulics within a fish pass, the monitoring unit must be positioned so that the guiding chute (fyke, when used with a camera system) is located within one of the pools of the fishway and remains mostly free of debris to maintain stable water levels in front of and behind the counter and to avoid disturbance of the system by air bubbles. Haas et al. recommend a distance of 70–90% of the pool length to minimize air bubbles and turbulence in the system [5]. Riverwatcher systems without a camera system (i.e., scanner plates only) can be integrated in the slot. In either scenario, the current velocity in the fishway typically remains unaffected, as most of the flow can pass through the guiding chute/fyke.
The entry to the camera chamber of the Riverwatcher should be of a similar size as the passage slots in the vertical-slot fishway. Turbidity is an important consideration when determining the dimensions of the camera chamber, as a high turbidity can drastically reduce the image quality and therefore impair species identification. However, the width of the fyke opening leading into the video chamber should be sufficiently large to avoid stacking, a behavioral delay resulting in an accumulation of fish willing to pass the structure [47]. An opening with a width of 20 cm can be sufficient in alpine rivers where the fish community consists predominantly of trout [21].
The scanner plates of the Riverwatcher must remain fully submerged to avoid interference caused by turbulence at the air/water interface. Passage corridor heights of 53 cm (single height with only one camera cone) and 104 cm (double height with two camera cones on top of each other) within the system are available to accommodate a range of water depths; also, the upper parts of the infrared barrier can be deactivated to avoid malfunctioning or poor image quality during periods of low water levels to avoid poor image quality resulting from interference by non-submerged light with the camera sensor. During winter, a fully submerged system can prevent ice damage for surface and floating ice; however, the system should be inspected frequently in freezing conditions.
When a Riverwatcher system is installed, it is important to maintain a barrier-free passage for bottom-oriented fish. Steps or jumps at the entrance to and the exit of the counting chamber should be smoothed by integrating ramps in the fykes (Figure 2). Also, an artificial substrate layer—such as a cast of component epoxy polymer—can be installed at the bottom of the counter (Figure 1) to increase the bottom roughness and facilitate passage for small and bottom-oriented species [12], such as European bullhead, sculpin, loaches, gudgeon, barbels, or suckers.
The guiding chute/fyke leading to the camera chamber should consist of horizontal bars to allow water flow around the counting device and thereby prevent an increased current velocity in the chamber (Figure 2; [4]).
The effort required for routine maintenance can vary depending on the application. In rivers with high debris flow, warm water temperatures, or other harsh operating conditions, short maintenance intervals are necessary. Especially within vertical-slot fishways, the use of a mounted crane for lifting the fyke for cleaning and regular maintenance has been a valuable add-on to the system. In general, for the optical devices (i.e., the camera and scanner) to function properly, the LED emitters and receivers, the camera itself, and the lights must be free of obstruction. Regular cleaning/scrubbing to remove the growth of biofilm is necessary for proper functionality. On average, the scanner and camera should be cleaned every 1–2 weeks during summer and every 2–4 weeks in winter.
For systems that are operated in conjunction with a guiding fyke (Figure 2), additional maintenance is required to prevent the accumulation of debris. Self-cleaning fykes have been used successfully in alpine rivers to reduce the cleaning effort required [21]. In general, the components of the counter system do not require maintenance; however, an annual inspection of all components, particularly plugs, cables, and all air-filled chambers, is recommended.

3.2. Monitoring Passage at Weirs

The Riverwatcher system can also be incorporated in portable or rigid weir structures that are operated continuously or seasonally, such as on the Stanislaus River in California (Figure 3), as discussed below. In contrast to affirming the functionality of fish-passage structures, Riverwatcher systems operated at weirs typically serve to enumerate escapement (in case of semelparous salmon, the number of adults successfully returning to the river), to evaluate migratory responses to environmental conditions [39], or to determine other population characteristics of interest to researchers and managers (such as the proportion of marked individuals; in California, a constant fraction of hatchery-produced fall-run Chinook salmon is marked with an adipose fin clip).
The same maintenance and technical challenges associated with operating a Riverwatcher system in a fish passage structure also apply to weir operation. However, the risk of damage to equipment is generally higher at weirs, as the equipment is less protected during potential floods compared to when housed within a fish passage structure.

3.3. Selected Datasets

3.3.1. Monitoring of Vertical-Slot Fishways

At the vertical-slot fishway of the HPP Langkampfen on the Inn River, Austria, (Table 1, Figure 2) fish migration is monitored with a scanner and a video system. In 2016, 344 upstream and 135 downstream passages were detected in total, with the highest number of passages occurring in May (150 upstream and 44 downstream passages) and the lowest number occurring in January (2 upstream passages) [4]. In 2016, in total, 2727 counts were recorded at this installation, but only 479 could be identified as fish passages. At HPP Kirchbichl on the Inn River in 2022, 3741 counts were generated, whereas 711 were identified as fish, and a parallel investigation with an underwater camera with motion detection found only 444 fish passages and clearly shows the advantages of an infrared scanner unit within turbid environments. The high levels of false counts are attributable to debris (wood, leaves, and garbage) and periods of high turbidity related to glacial influence or heavy rainfalls, especially during summer.
At the Wenns fishway (HPP Prutz-Imst) on the Pitze River, Austria (Table 1), a Riverwatcher has been in use continuously since May 2015 [21]. In 2016, a total of 228 upstream and 82 downstream passages were detected, indicating that the fishway provides passage for both, upstream- and downstream-migrating fish [6]. Such detailed migration patterns can only be detected and observed through continuous monitoring.

3.3.2. Monitoring of Nature-like Fishway

The Riverwatcher installed in a nature-like fishway at the Neckar River, Germany, (Table 1, Figure 2), counted 7903 fish (17 species) within a season (May–December 2016), ranging in length from 8 cm (barbel, Barbus barbus) to 123 cm (wels catfish, Silurus glanis), as shown in Figure 4. Smaller fish (recorded by video) from 5 to 8 cm are manually added to the database by the person in charge of the data processing, and this is carried out within the user interface of the counting software (Winari Version 5.01) with the command “insert fish”. In 2017, 14,987 fish (18 species) were recorded by the Riverwatcher, ranging in length from 11 cm (common bleak, Alburnus alburnus) to 126 cm (wels catfish, Silurus glanis). Within three electrofishing surveys (2012, 2013, and 2014) in the bypass cannel, a total of 31 species were detected, with a maximum of 29 species detected in 2014 [47], especially small fish, e.g. , Alburnoides bipunctatus, Gasterosteus aculeatus, Pseudorasbora parva, Rhodeus amarus, Phoxinus phoxinus, but bottom-oriented bullhead (Cottus gobio) and three gobi species (Proterorhinus marmoratus, Neogobius kessleri, Neogobius melanostomus) were not detected in the Riverwatcher system.
Floating debris posed a significant challenge in the first year of monitoring at this location, and debris deflectors were used successfully to reduce the physical maintenance (cleaning) of the guiding fyke. The processing effort for 7 months of monitoring data (May to December 2016) was 29 h and 42 h for a 12-month monitoring in 2017 with the Winari software version 5.01. The collected monitoring data lend themselves to further analysis of migration characteristics, population composition, and other biologically relevant parameters (Figure 4). However, in this monitoring, the general functionality of the fishway was the main assessment; therefore, the high number of species detected as well as the variation in size classes was the main result of this study. The diurnal distribution of fish passage could have been a result of disturbance during the daytime, as a foot and bike path is situated next to the nature-like fishway. This could be an interesting topic for further research.

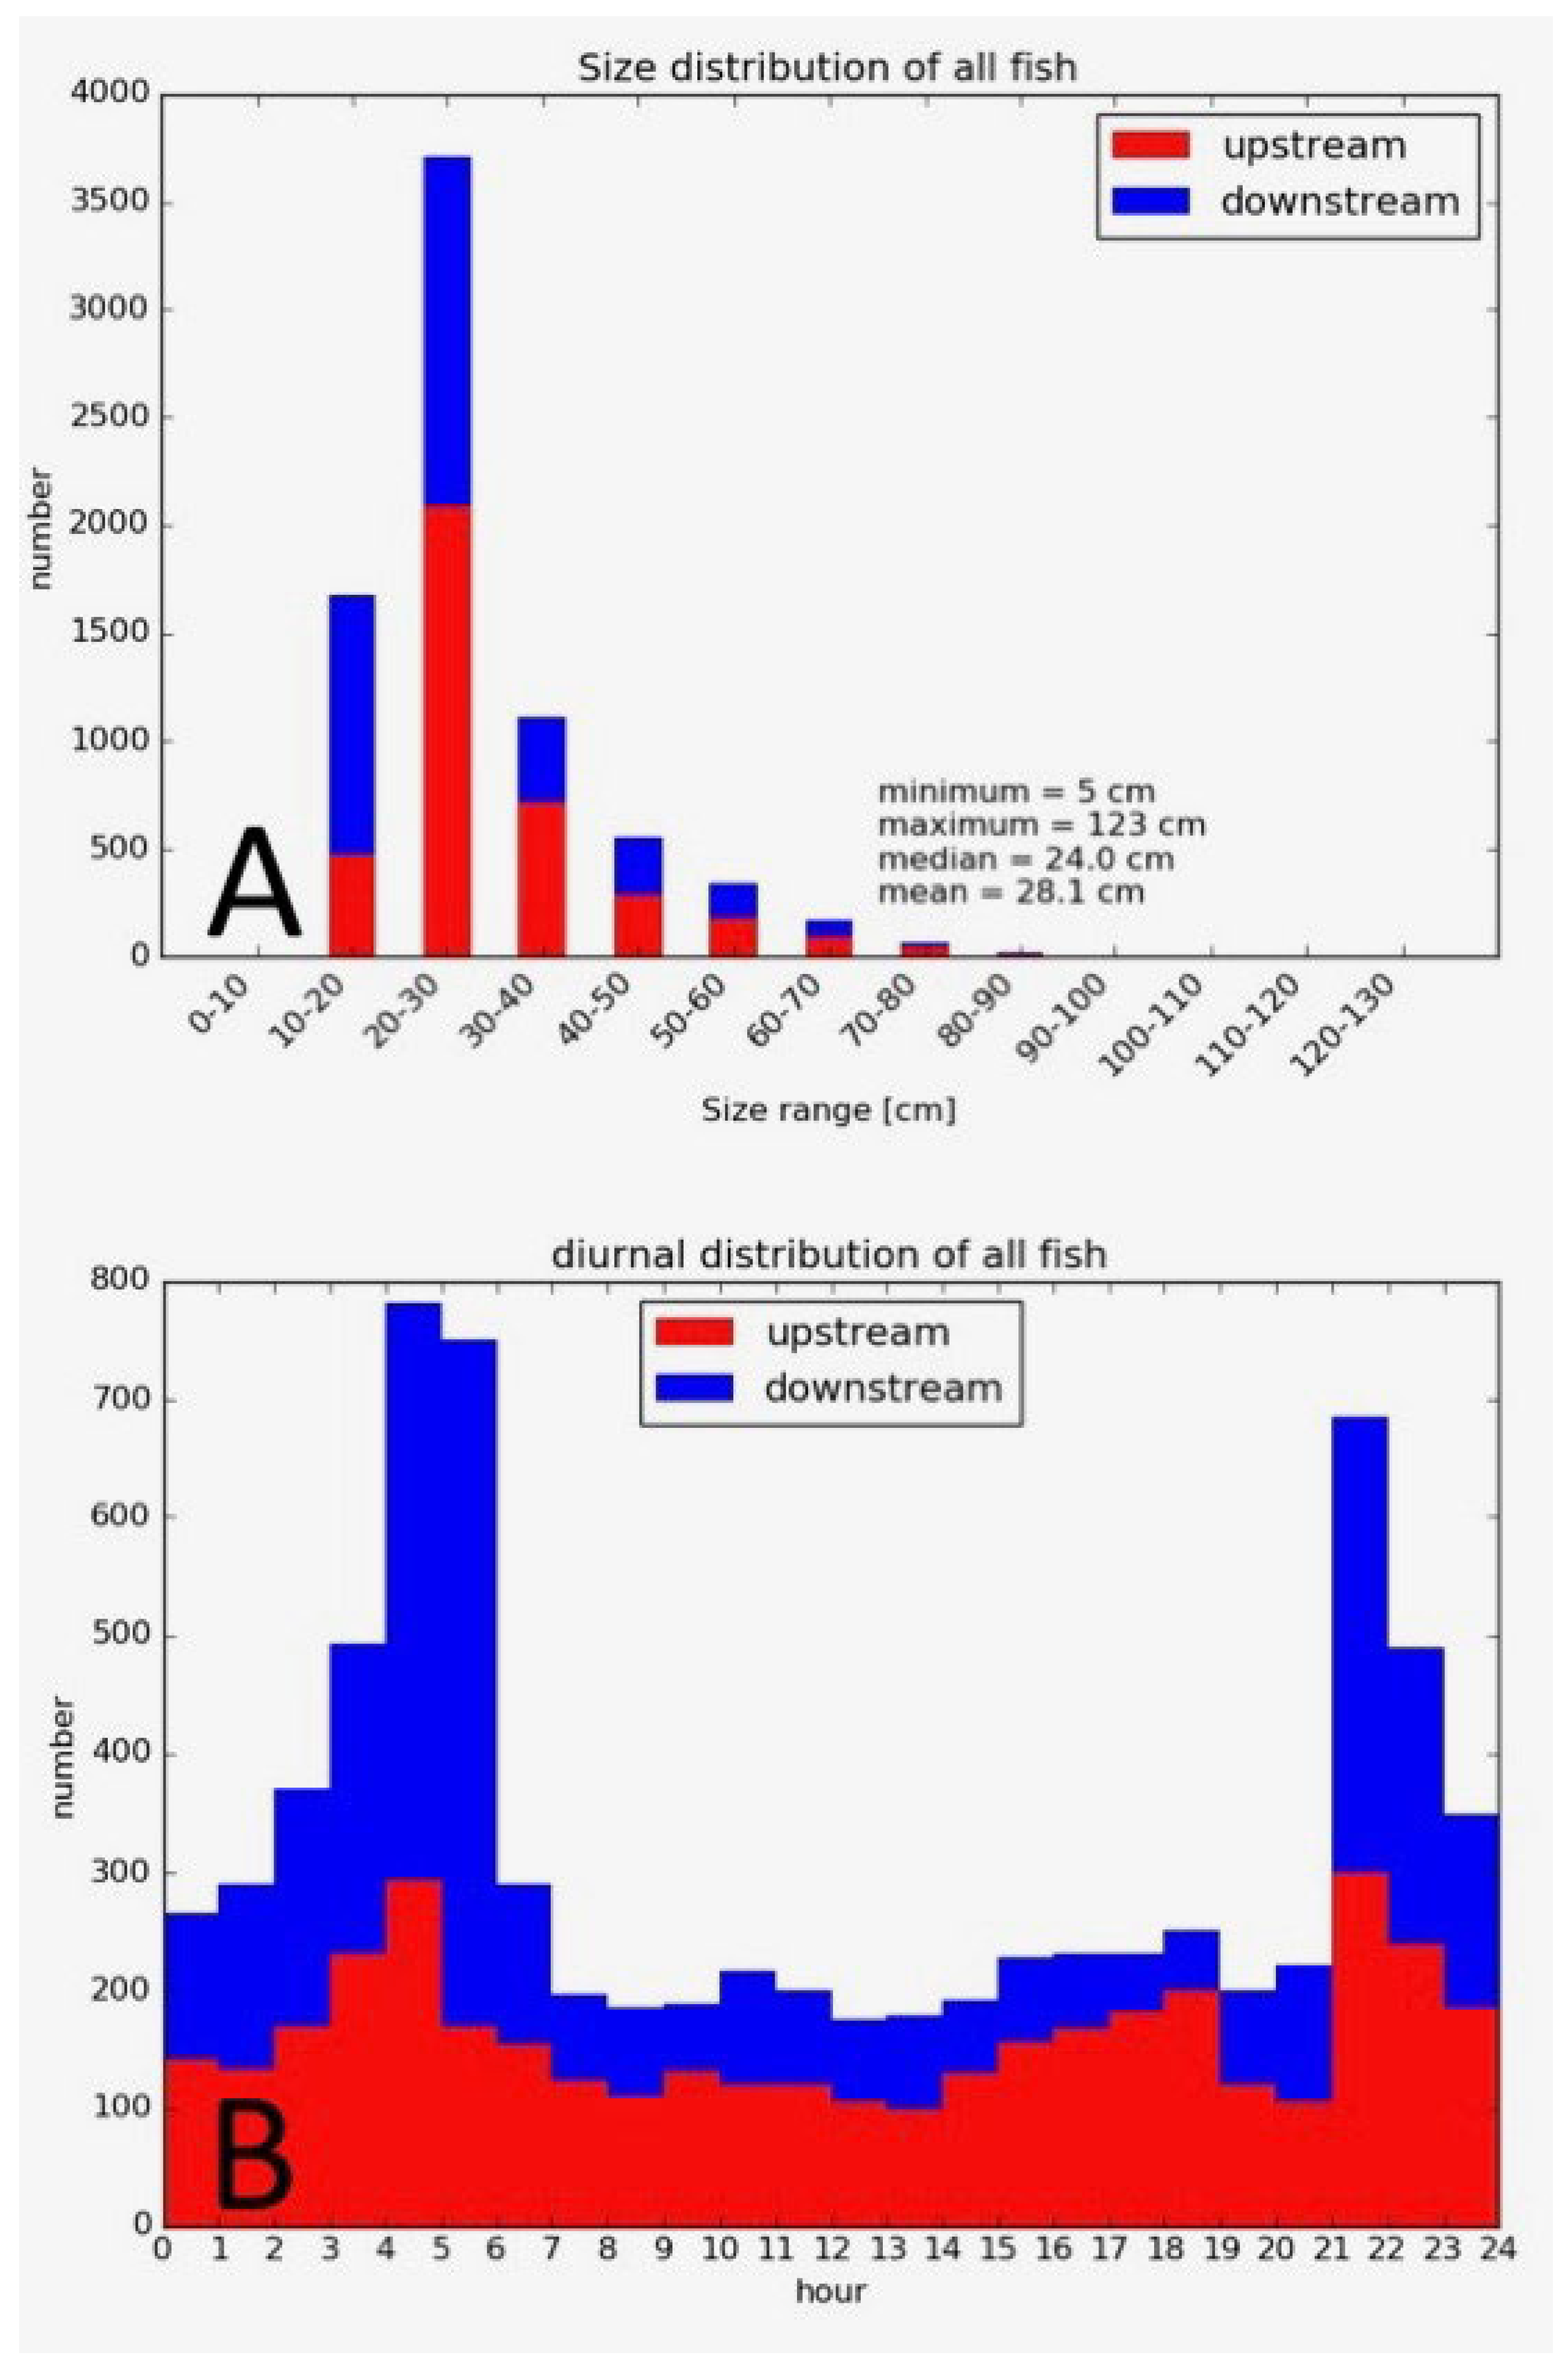
3.3.3. Monitoring of Open Channels

On the Stanislaus River, California, a weir mounted to a substrate rail guides upstream-migrating fish to a passage fyke leading into a Riverwatcher camera chamber (Figure 3). The weir, approximately 40 m wide, can be successfully operated at flows of up to 45 m3/s. The weir has been operated annually since 2004 in autumn and winter to enumerate Chinook salmon returning to their freshwater spawning grounds from the Pacific Ocean. A daily passage of nearly 1400 Chinook salmon and season totals of more than 14,000 individuals were enumerated using the VAKI Riverwatcher on this river (both in 2016). In addition, approximately 20 fish species other than Chinook salmon were detected at the Stanislaus River fish counting station.

4. Discussion

Arguably, the acquisition of a Riverwatcher is associated with a relatively high initial investment for equipment purchase and installation. However, the long-term monitoring costs are relatively low, and a growing number of successful deployments of this technology provide valuable data to researchers. Continuous monitoring with the VAKI Riverwatcher can be an important tool to aid in researching fish population size and also to evaluate the potential relationships between abiotic factors and fish migration, as every passage record is associated with a direction, date, time, and water temperature. Long-term monitoring efforts encompass seasonal, environmental, and population variation, and trends or responses by fish populations to such variations can be used to identify parameters that influence migration behavior [48]. Several installations within a river system provide additional opportunity for the fine-scale analysis of migration rates in order to determine the proportion of migrating individuals within a population or estimate distribution or mortality between separate monitoring stations. However, challenging monitoring/environmental conditions, fish behavior, and subjective data reviewing can introduce errors in passage or abundance estimates. In general, six potential sources of error should be considered when using fish passage data in monitoring [44]:
  • Missed counts can occur if the device malfunctions or if turbidity causes the sensors to fail. If multiple fish pass the scanner simultaneously and only one is counted or if fish pass the device too quickly to trip the sensors, then this will result in missed counts.
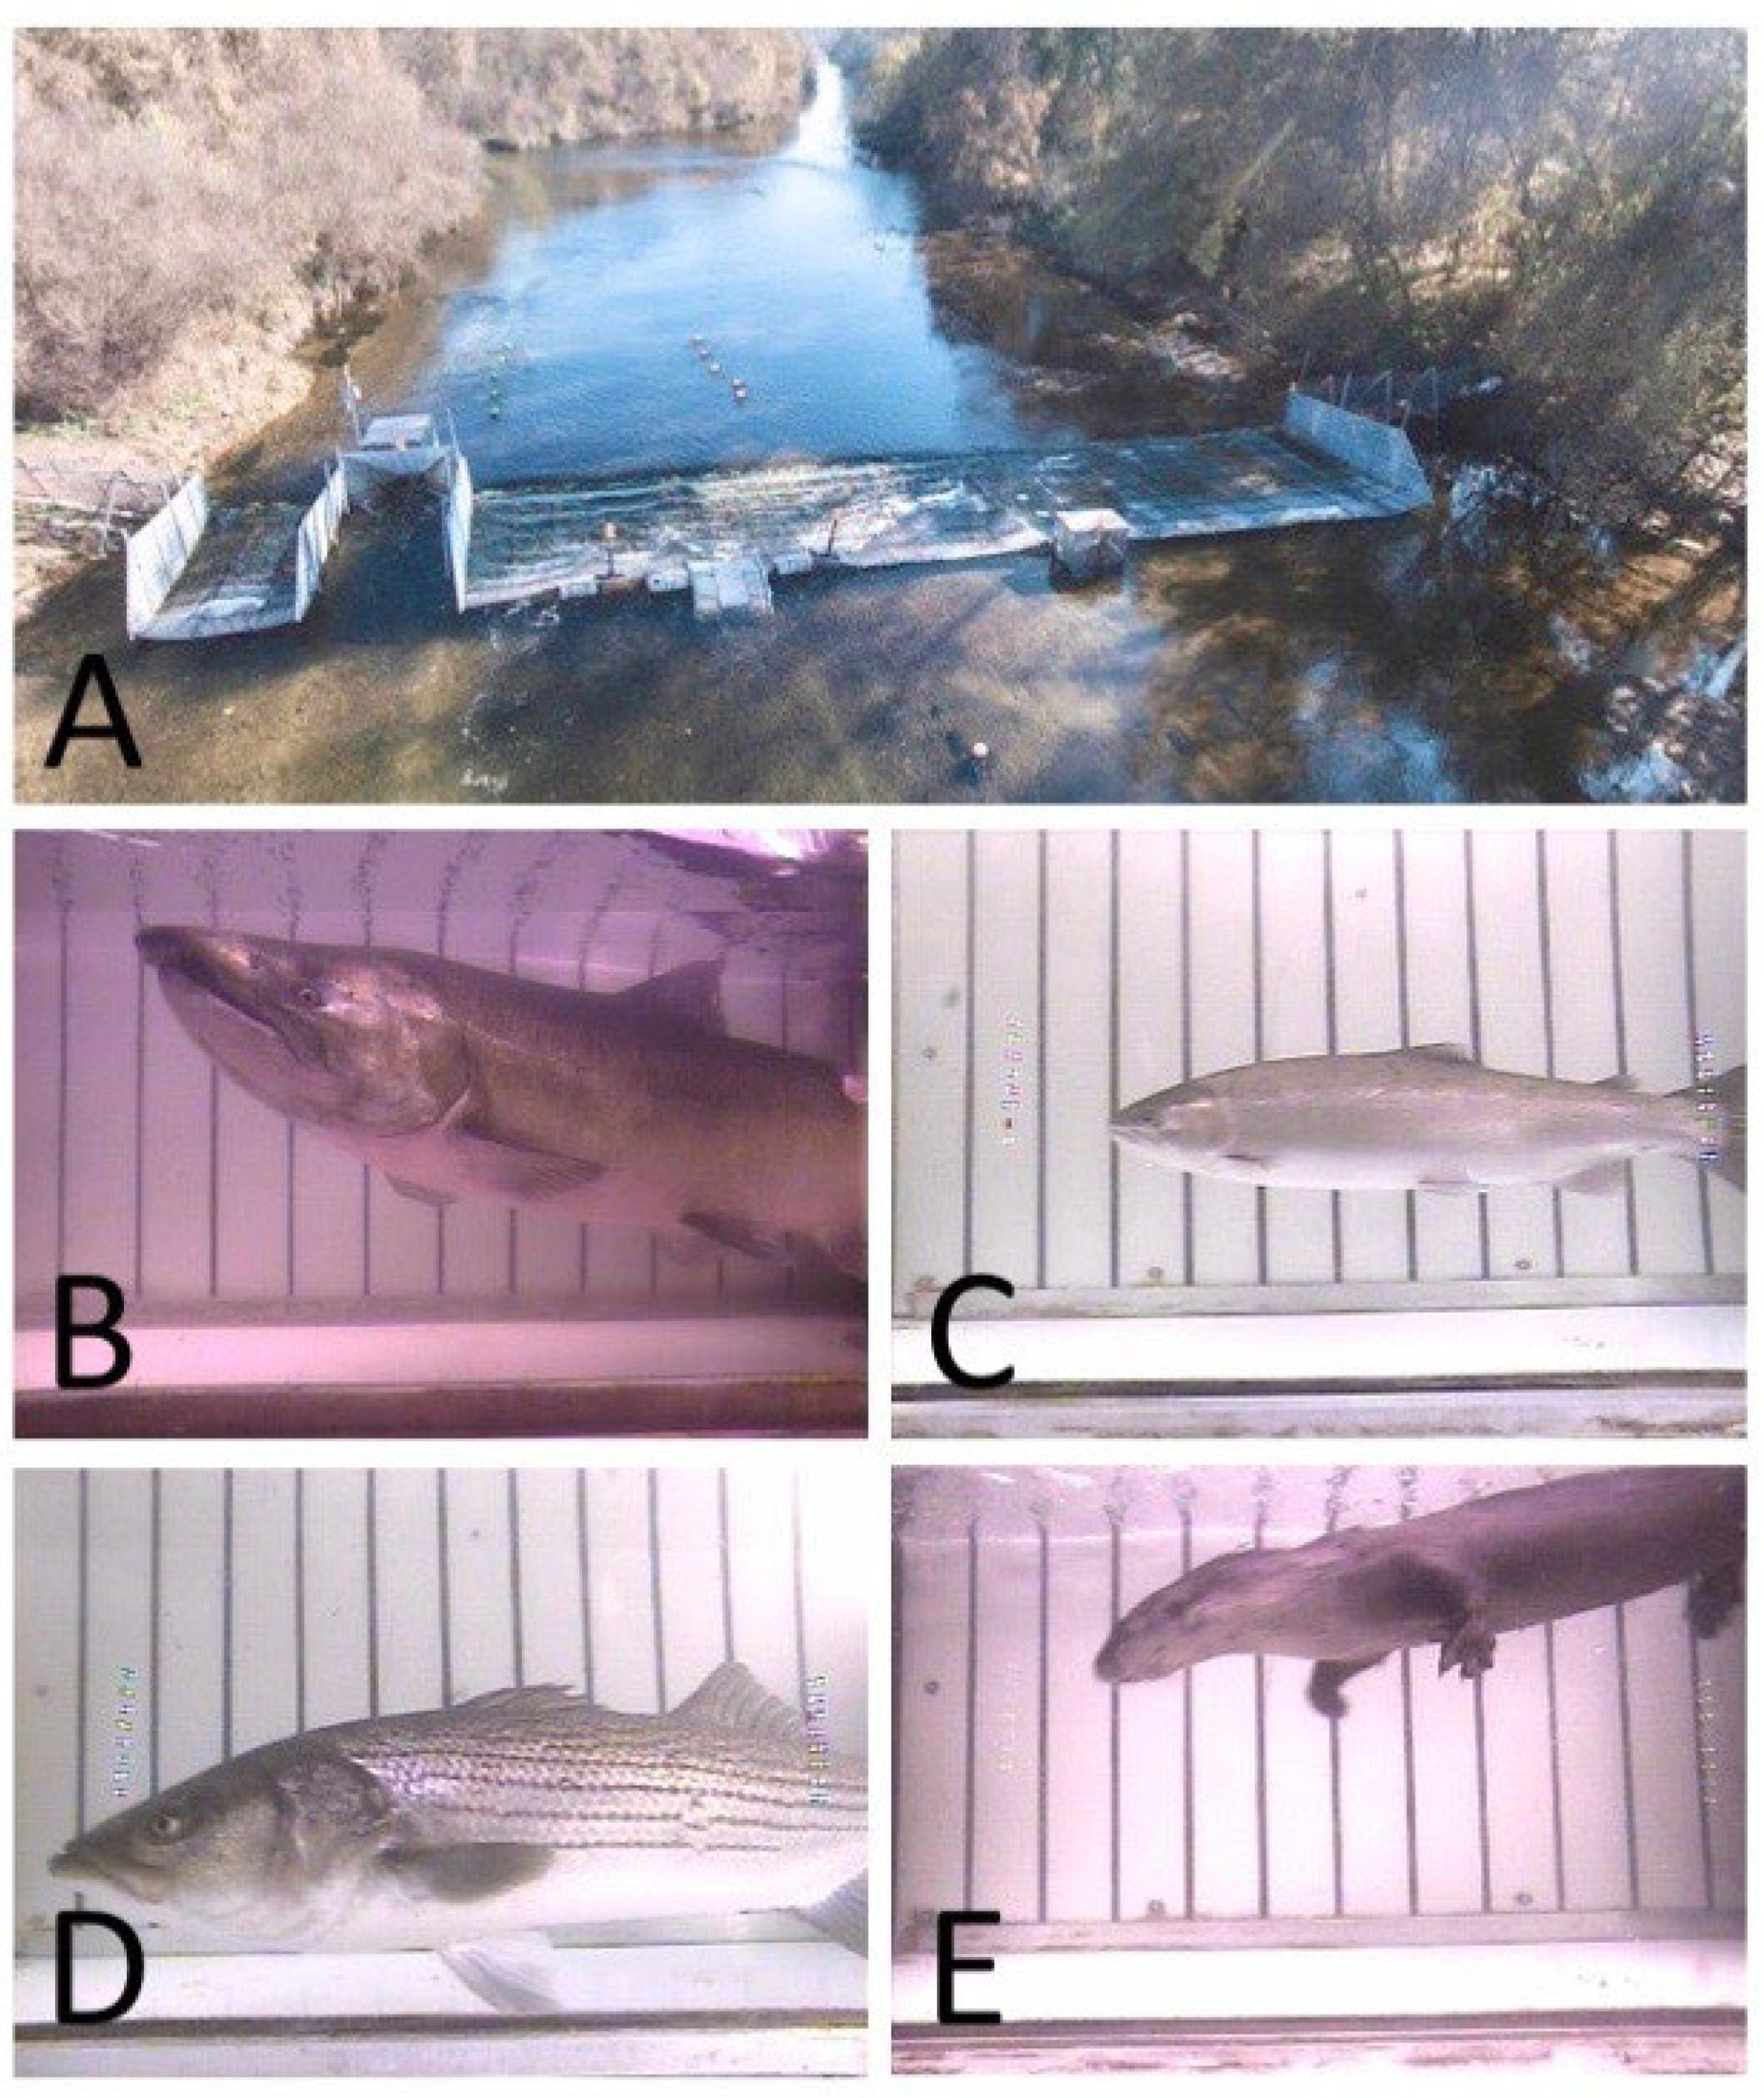
  • False counts occur when objects passing through the scanner (e.g., beavers or debris) and silhouettes are mistaken for the target species.
  • Mixed counts can happen if a fish species other than the target species is misidentified and recorded as a species of interest.
  • By-passed counts will occur if fish are not properly guided through the device due to improper weir installation or if the swim corridor is not constricted enough to trip the device sensors.
  • Double counts can happen if an individual is counted moving upstream and then drops below the device without being counted (e.g., it moves downstream through the camera chamber at the same time as another individual is moving upstream) and is counted again as it swims upstream past the detector a second time.
  • Observer errors can occur when there is variation within and among observers in count verification and species identification. This type of error can also occur if data files become corrupted or lost.
Bergman, Nielson, and Low [44] provide guidance for assessing these sources of error with respect to the specific conditions for a given Riverwatcher installation. These guidelines consist of both procedural and statistical techniques to verify counts and ensure high-quality data. Field validation trials can be performed using a known number of artificial targets or tethered fish dummies to quantify detection rates. Alternatively, detection rates can be estimated by pairing visual counts (either from a counting tower or an overhead video camera) with the device counter. If high levels of turbidity are expected, pairing dual-frequency identification sonar (DIDSON) with a Riverwatcher system can provide accurate estimates, as DIDSON is less sensitive to turbidity [49]. When planning a validation experiment, it is important to perform multiple trials over a range of measured environmental conditions (e.g., turbidity and discharge) that are expected to influence the detection capabilities of the device. Following validation trials, simple linear regression can be used to develop a relationship between empirical detection rates and environmental conditions. Daily counts can then be corrected for imperfect detection to provide estimates of daily passage. Bootstrapping is also recommended to estimate the standard error and confidence intervals for daily counts.
If mixed counts are a concern in a particular application, it may be necessary to estimate species-specific detection rates. In these cases, validation experiments can be performed using camera/video equipment that will achieve an acceptable discrimination between species.
Differences among observers who review passage data may be an additional source of error. However, quantifying within- and among-observer variation is rather simple: a series of images can be used as a standard training set, each with a known true passage count. This training set is then reviewed by all observers multiple times in order to calculate the coefficient of variation (CV) within as well as among observers. In this context, the guidelines for calculating the CV were published, with the suggestion that the within- or among-observer CV should not exceed 10% [44].
Lastly, the possibility that data may be missing should be considered, as this source of error is almost inevitable in highly variable systems. Missing data are of special concern if the desired monitoring results include annual or seasonal total passages, which is typically of particular importance in salmon monitoring applications. High flows and debris or a malfunctioning device will cause missing passage counts for short or long periods of time. Bergman, Nielson, and Low [44] suggest that missing data be statistically imputed using generalized additive modeling (GAM) or Bayesian methods. Both methods have advantages and disadvantages; therefore, it is up to the program statisticians to decide which method is the most appropriate for their system.
Fish-counting devices such as the VAKI Riverwatcher can be used to provide accurate estimates of escapement and population abundance when error sources are recognized and adequately addressed. Just as the technology of fish enumeration devices is continuing to change, so will the methods for validating and accounting for error. Therefore, some degree of experimentation will always be needed to adapt new technology to variable environmental conditions. However, programs that continue to perform validation and calibration trials for their counting device will be rewarded with accurate and precise estimates of abundance and effective monitoring of population trends.
Case-specific experiences highlight some of the opportunities and challenges with the Riverwatcher system. For instance, the scanner and camera system on the Inn River worked well during the peak migration periods in spring and fall but did not provide accurate fish counts during the summer when glacial meting resulted in high turbidity. Further refinement of the operation procedure (such as reducing the scanner width) is planned to maintain continuous, effective monitoring throughout periods with higher turbidity. If used in conjunction, the scanner and camera system can provide more reliable passage data for water bodies with few species and high turbidity compared to typical video systems [12,21]. In the near future, advances in artificial intelligence (AI) and machine learning (ML) can support automated analyses of videos [50].
In addition to validating the functionality of a fishway, data collected by Riverwatcher systems lend themselves to investigating diurnal, seasonal, and interannual patterns in fish passage (Figure 4, [12,21,45]). Interesting findings of such analyses include substantially lower migration rates of Atlantic salmon, Salmo salar, at night compared to during the day [51]. This finding stands in contrast to the prevalent notion that upstream migration occurs predominantly at night [51,52].
Lastly, the system relies on guiding structures to ensure the passage of the individuals through the counter. Designing and installing these structures in technical fishways and smaller water bodies is relatively straightforward. However, their implementation and functionality pose greater challenges in larger rivers. As a consequence, there have been no units installed in large rivers at the current time, only in side channels, bypasses, or fishways at hydraulic structures such as hydropower plants and weirs in these large waterbodies.
In summary, a Riverwatcher system can be a valuable tool in fish migration research with a host of different applications, such as validating the functionality of fish passage structures and determining the abundance and migration characteristics of fish species and populations. The most appropriate configuration of a monitoring system depends on local conditions and constraints, and researchers have to consider the potential limitations and advantages of systems such as the Riverwatcher based on their experience with their local water bodies to ensure the best possible data collection. In some instances, the use of the individual components, such as a camera tunnel with an adjustable light or the scanner unit, may suffice for specific research purposes [4]. However, combining the systems provides the advantages of both and therefore becomes applicable to a wider spectrum of tasks or conditions, ranging from the detection of small individuals to operation under high-turbidity conditions.

Author Contributions

Conceptualization, C.H. and M.S.; Writing—original draft, C.H., P.K.T., M.H., T.J.P. and M.S.; Writing—review & editing C.H. and M.S. All authors have read and agreed to the published version of the manuscript.

Funding

This research received no external funding.

Data Availability Statement

The data presented in this study are available on request from the corresponding authors.

Conflicts of Interest

Author Christian Haas and Philipp Klaus Thumser are employed by the company I AM HYDRO GmbH, which is a sales agent of the Riverwatcher in Germany, Austria and Switzerland (https://iamhydro.com/en/fishmonitoring/riverwatcher/, accessed on 29 January 2024). Author Michael Hellmair and Tyler J. Pilger are employed by the company FISHBIO, which is a sales agent of the Riverwatcher in the United States of America (https://fishbio.com/technology/riverwatcher/, accessed on 29 January 2024). Author Martin Schletterer is employed by the company TIWAG, which deploys the system Riverwatcher for monitoring purposes. This publication aims to summarize the published knowledge and the practical experience regarding the use of the Riverwatcher. The authors underline that this research was carried out independently, thus we declare no conflict of interest.

References

  1. DWA M-509 Deutsche Vereinigung für Wasserwirschaft, A.u. Fischaufstiegsanlagen und Fisch-Passierbare Bauwerke—Gestaltung, Bemessung, Qualitätssicherung. 2014. Available online: https://shop.dwa.de/en/DWA-M-509-Fischaufstiegsanlagen-5-2014/M-509-BUNDLE-14 (accessed on 1 August 2023).
  2. Hering, D.; Borja, A.; Carstensen, J.; Carvalho, L.; Elliott, M.; Feld, C.K.; Heiskanen, A.-S.; Johnson, R.K.; Moe, J.; Pont, D.; et al. The European Water Framework Directive at the age of 10: A critical review of the achievements with recommendations for the future. Sci. Total Environ. 2010, 408, 4007–4019. [Google Scholar] [CrossRef] [PubMed]
  3. Schletterer, M.; Reindl, R.; Thonhauser, T. Options for Re-Establishing River Continuity, with an Emphasis on the Special Solution “Fish Lift”: Examples from Austria. Rev. Eletrôn. Gestão Tecnol. Ambient. (GESTA) 2016, R4/1, 109–128. Available online: https://portalseer.ufba.br/index.php/gesta (accessed on 1 August 2023). [CrossRef]
  4. Haas, C.; Thumser, P.; Mockenhaupt, B.; Schletterer, M. Das System VAKI-Riverwatcher als Möglichkeit für ein Langzeitmonitoring von Fisch-Migration in Fischwanderhilfen. Wasserwirtschaft 2018, 9, 41–48. [Google Scholar] [CrossRef]
  5. EN 17233:2021; Water Quality. Guidance for Assessing the Efficiency and Related Metrics of Fish Passage Solutions Using Telemetry. The European Committee for Standardization CEN: Brussels, Belgium, 2021.
  6. I Am Hydro, G. I Am Hydro GmbH. Von. 2021. Available online: https://iamhydro.com/downloads/i-am-hydro_flyer_hydrocam_2021_en.pdf (accessed on 1 August 2023).
  7. Mader, H.; Käfer, S. FishCam & FishNet—Fischökologisches Monitoring 4.0; Österreichische Wasser-und Abfallwirtschaft: Vienna, Austria, 2020; Volume 72, pp. 129–141. [Google Scholar]
  8. Li, D.; Hao, Y.; Duan, Y. Nonintrusive methods for biomass estimation in aquaculture with emphasis on fish: A review. Rev. Aquac. 2019, 12, 1390–1411. [Google Scholar] [CrossRef]
  9. MSD Animal Health. VAKI Riverwatcher. 2023. Available online: https://www.riverwatcher.is/ (accessed on 1 August 2023).
  10. de Leaniz, C.G.; Forman, D.W.; Davies, S.; Thomson, A. Non-intrusive monitoring of otters (Lutra lutra) using infrared technology. J. Zool. 2006, 270, 577–584. [Google Scholar] [CrossRef]
  11. Haas, C.; Thumser, P.; Völker, F. Technisches Monitoring mit einem Infrarot Fischzähler (VAKI Riverwatcher) am Lachsbach, Sachsen. Wasserwirtschaft 2014, 7/8, 97. [Google Scholar]
  12. Thumser, P.; Haas, C.; Schletterer, M. Technical Monitoring of Fishways: Long Term Monitoring of Fish Movement with the VAKI Riverwatcher along River Inn. Deutsche Gesellschaft für Limnologie (DGL), Erweiterte Zusammenfassungen der Jahrestagung 2016, Hardegsen, 191–195 (Vienna). 2017. Available online: https://www.dgl-ev.de/cms/upload/dokumente/Publikationen/Erweiterte_Zusammenfassungen_Wien_2016.pdf (accessed on 26 September 2022).
  13. Santos, J.M.; Pinheiro, P.J.; Ferreira, M.T.; Bochechas, J. Monitoring fish passes using infrared beaming: A case study in an Iberian river. J. Appl. Ichthyol. 2008, 24, 26–30. [Google Scholar] [CrossRef]
  14. Shardlow, T.F.; Hyatt, K.D. Assessment of the counting accuracy of the Vaki infrared counter on chum salmon. North Am. J. Fish. Manag. 2004, 24, 249–252. [Google Scholar] [CrossRef]
  15. Cuthbert, R.; Fuller, A.; Snider, S. Fall/Winter Migration Monitoring at the Tuolumne River Weir 2009/10 Annual Report. Prepared for: Turlock Irrigation District Modesto Irrigation District. 2010. 16p. Available online: https://tuolumnerivertac.com/Documents/2009TuolWeirReportFinal.pdf (accessed on 1 August 2023).
  16. Valley Water. 2019 Guadalupe River Watershed Fisheries Monitoring. 2020. 154p.. Available online: https://www.valleywater.org/sites/default/files/2019%20Guadalupe%20Watershed%20Fisheries%20Reports%20Compiled.pdf (accessed on 1 August 2023).
  17. Pilger, T.J.; Jonagan, E.; Peterson, M.L.; Guignard, J.; Demko, D.; Fuller, A. Estimates of Fall-run Chinook Salmon Escapement in Two San Joaquin River Tributaries from 2 Device-based and Survey-based Methods. bioRxiv 2023, preprint. [Google Scholar] [CrossRef]
  18. Baumgartner, L.; Bettanin, M.; Mcpherson, J.; Jones, M.J.; Zampatti, B.; Beyer, K. Assessment of an Infrared Fish Counter (Vaki Riverwatcher) to Quantify Fish Migrations in the Murray–Darling Basin; Industry & Investment NSW—Fisheries Final Report Series No. 116; NSW Department of Primary Industries: Albury, Australia, 2010; p. 47. [Google Scholar]
  19. Baumgartner, L.J.; Bettanin, M.; McPherson, J.; Jones, M.; Zampatti, B.; Beyer, K. Influence of turbidity and passage rate on the efficiency of an infrared counter to enumerate and measure riverine fish. J. Appl. Ichthyol. 2012, 28, 531–536. [Google Scholar] [CrossRef]
  20. Jones, M.J.; O’Connor, J.P. Monitoring the performance of fishways and fish passage works. In Arthur Rylah Institute for Environmental Research; Technical Report Series No. 257; Department of Environment, Land Water and Planning: Heidelberg, VIC, Australia, 2017; p. 74. [Google Scholar]
  21. Schletterer, M.; Senn, G.; Menghin, M.; Hubmann, M.; Schwarzenberger, R.; Haas, C.; Thumser, P.; Asgeirsson, M.T. Technisches Fischmonitoring: Installation des ersten RiverWatcher Fischzählers in Österreich. Wasserwirtschaft 2015, 7/8, 103–108. [Google Scholar] [CrossRef]
  22. Ontario Ministry of Natural Resources and Forestry. Lake Ontario Fish Communities and Fisheries: 2018 Annual Report of the Lake Ontario Management Unit; Ontario Ministry of Natural Resources and Forestry: Picton, ON, Canada, 2019; p. 230. ISSN1 1201-8449. Available online: http://www.glfc.org/loc_mgmt_unit/LOA%2019.01.pdf (accessed on 1 August 2023)ISSN2 1201-8449.
  23. Prchalová, M.; Slavík, O.; Bartoš, L. Patterns of cyprinid migration through a fishway in relation to light, water temperature and fish circling behaviour. Int. J. River Basin Manag. 2004, 4, 213–218. [Google Scholar] [CrossRef]
  24. Orell, P.; Erkinaro, J.; Kiljunen, M.; Torniainen, J.; Sutela, T.; Jaukkuri, M.; Mäki-Petäys, A. Short sea migration and precocious maturation in reared Atlantic salmon post-smolts in the northern Baltic Sea. ICES J. Mar. Sci. 2018, 75, 1063–1070. [Google Scholar] [CrossRef]
  25. Fédération du Pas de Calais Pour la Pêche et la Protection du Milieu Aquatique. Available online: http://www.peche62.fr/station-de-videocomptage-a-mourlinghen/ (accessed on 1 August 2023).
  26. MFRI. Risk of Intrusion of Farmed Atlantic Salmon into Icelandic Salmon Rivers: MFRI Assessment Reports (Report No. 2020); Marine & Freshwater Research Institute: Hafnarfjörður, Iceland, 2020; p. 57. Available online: https://www.hafogvatn.is/static/extras/images/taekni-Ah%C3%A6ttumat_ens1199280.pdf/ (accessed on 1 August 2023).
  27. Farrell, M.M.; McGinnity, P.; Poole, W.R.; Rogan, G.; O’Maoileidigh, N.; Bond, N.; Kristjansson, H. A comparison of salmonid census results obtained by the Vaki Riverwatcher and upstream trap on the Burrishoole River system, Western Ireland. May 2017. Annu. Rep. Salmon Res. Agency Irel. 1998, 43, 57–59. [Google Scholar] [CrossRef]
  28. Skaala; Johnsen, G.H.; Lo, H.; Borgstrøm, R.; Wennevik, V.; Hansen, M.M.; Merz, J.E.; Glover, K.A.; Barlaup, B.T. A conservation plan for Atlantic salmon (Salmo salar) and anadromous brown trout (Salmo trutta) in a region with intensive industrial use of aquatic habitats, the Hardangerfjord, western Norway. Mar. Biol. Res. 2014, 10, 308–322. [Google Scholar] [CrossRef]
  29. Holter, T.H.; Myrvold, K.M.; Pulg, U.; Museth, J. Evaluating a fishway reconstruction amidst fluctuating abundances. River Res. Appl. 2020, 36, 1748–1753. [Google Scholar] [CrossRef]
  30. Dębowski, P.; Bernaś, R.; Radtke, G.; Święcki, W. Assessment of the effectiveness of fish passage through the vertical-slot fishway at the main dam on the longest Baltic River. Fish. Aquat. Life 2022, 30, 175–183. [Google Scholar] [CrossRef]
  31. García-Vega, A.; Sanz-Ronda, F.J.; Fuentes-Pérez, J.F. Seasonal and daily upstream movements of brown trout Salmo trutta in an Iberian regulated river. Knowl. Manag. Aquat. Ecosyst. 2017, 418, 9. [Google Scholar] [CrossRef]
  32. Haas, C.; Thumser, P. Riverwatcher Fischzähler am KW Reichenau am Alpenrhein Technischer Bericht und Auswertung der Fischauf-und Abstiege. Technical report. 2021. 66p.. Available online: https://www.gr.ch/DE/institutionen/verwaltung/diem/ajf/fischerei/dokumentation-projekte/Documents/RW_Reichenau_Bericht.pdf (accessed on 1 August 2023).
  33. HELCOM. Salmon and Sea Trout Populations and Rivers in the Baltic Sea—HELCOM assessment of salmon (Salmo salar) and sea trout (Salmo trutta) populations and habitats in rivers flowing to the Baltic Sea. Balt. Sea Environ. Proc. 2011, 126, 82. Available online: https://www.helcom.fi/wp-content/uploads/2019/08/BSEP126A.pdf (accessed on 1 August 2023).
  34. ICES. Baltic Salmon and Trout Assessment Working Group (WGBAST). ICES Sci. Rep. 2021, 3, 331. [Google Scholar] [CrossRef]
  35. Eatherley, D.M.R.; Thorley, J.L.; Stephen, A.B.; Simpson, I.; MacLean, J.C.; Youngson, A.F. Trends in Atlantic salmon: The role of automatic fish counter data in their recording. Scottish Natural Heritage Commissioned Report No. 100 (ROAME No. F01NB02). 2005. Available online: https://www.researchgate.net/publication/282251586_Trends_in_Atlantic_Salmon_the_role_of_automatic_fish_counter_data_in_their_recording (accessed on 1 August 2023).
  36. Chariskos, D. Analysis of the Run of Two Salmonid Species, by Using Data from a Vaki Riverwatcher Counter, at the River Dullan in 2007; University of Aberdeen: Aberdeen, Scotland, 2007; p. 54. [Google Scholar]
  37. Fisheries Management Scotland. 2019 Annual Review, 44. p. 2019. Available online: https://fms.scot/wp-content/uploads/2019/03/FMS-2019.pdf (accessed on 1 August 2023).
  38. Cowan, W.R.; Rankin, D.E.; Gard, M. Evaluation of Central Valley Spring-Run Chinook Salmon Passage Through Lower Butte Creek Using Hydraulic Modelling Techniques. River Res. Appl. 2016, 33, 328–340. [Google Scholar] [CrossRef]
  39. Peterson, M.L.; Fuller, A.N.; Demko, D. Environmental factors associated with the upstream migratory activity of fall-run Chinook salmon in a regulated river. North Am. J. Fish. Manag. 2017, 37, 78–93. [Google Scholar] [CrossRef]
  40. Mockenhaupt, B.; Scholten, M. Large automatic fish counter—An option to register migrating fishes in a technical fishway quantitatively? In Proceedings of the 9th International Symposium on Ecohydraulics 2012, Vienna, Austria, 17–21 September 2012; 2012. [Google Scholar]
  41. Haas, C.; Thumser, P.; Mannfeld, M. Technischer Bericht und Auswertung der Fischauf-und abstiege Umgehungsgerinne Zugwiesen, Neckar. Technical report. 65p. 2017.
  42. Cuthbert, R. “Going Beyond Visible Light; Monitoring Adult Fish Passage in Turbid Conditions with Technological Advancements and Sense of Public Outreach”. International Conference on Engineering and Ecohydrology for Fish Passage. 12. 2017. Available online: https://scholarworks.umass.edu/fishpassage_conference/2017/June21/12 (accessed on 1 August 2023).
  43. Kiffney, P.M.; Lisi, P.J.; Liermann, M.; Naman, S.M.; Anderson, J.H.; Bond, M.H.; Pess, G.R.; Koehler, M.E.; Buhle, E.R.; Buehrens, T.W.; et al. Colonization of a temperate river by mobile fish following habitat reconnection. Ecosphere 2023, 14, e4336. [Google Scholar] [CrossRef]
  44. Bergman, J.M.; Nielson, R.M.; Low, A. Central Valley in-River Chinook Salmon Escapement Monitoring Plan; Fisheries Branch Administrative Report Number: 2012-1; California Department of Fish and Game: Sacramento, CA, USA, 2012. Available online: https://nrm.dfg.ca.gov/FileHandler.ashx?DocumentID=42213&inline=1 (accessed on 1 March 2018).
  45. Groß, J. Ökologische Durchgängigkeit der Mosel—Neubau einer Fischwechselanlage mit Monitoringstation sowie eines Besucher-Informationszentrums “Mosellum” an der Moselstaustufe in Koblenz. Korresp. Wasserwirtsch. 2014, 7, 107–112. [Google Scholar]
  46. Orell, P.; Jaukkuri, M.; Huusko, R.; Mäki-Petäys, A. VAKI-Kalalaskurin Luotettavuus ja Hyödyntämismahdollisuudet Kalateiden Seurannassa; Riista—Ja kalatalouden tutkimuslaitos: Helsinki, Finland, 2012; p. 27. [Google Scholar]
  47. Haberbosch, R. Umgehungsgerinne und Neckarseitenarm in Ludwigsburg—Gewann Zugwiesen Monitoring 2013–2014. Internal report; 2015. [Google Scholar]
  48. Adam, B.; Lehmann, B. Ethohydraulik: Grundlagen, Methoden und Erkenntnisse; Springer: Berlin/Heidelberg, Germany, 2011. [Google Scholar]
  49. Schmidt, M.B.; Tuhtan, J.A.; Schletterer, M. Hydroacoustic and Pressure Turbulence Analysis for the Assessment of Fish Presence and Behavior Upstream of a Vertical Trash Rack at a Run-of-River Hydropower Plant. Appl. Sci. 2018, 8, 1723. [Google Scholar] [CrossRef]
  50. Soom, J.; Pattanaik, V.; Leier, M.; Tuhtan, J.A. Environmentally adaptive fish or no-fish classification for river video fish counters using high-performance desktop and embedded hardware. Ecol. Informatics 2022, 72, 101817. [Google Scholar] [CrossRef]
  51. Thorstad, E.B.; Økland, F.; Aarestrup, K.; Heggberget, T.G. Factors affecting the within-river spawning migration of Atlantic salmon, with emphasis on human impacts. Rev. Fish Biol. Fish. 2008, 18, 345–371. [Google Scholar] [CrossRef]
  52. Lucas, M.C.; Baras, E. Migration of Freshwater Fishes; Blackwell Science: Hoboken, NJ, USA, 2001; ISBN 0-632-05754-8. [Google Scholar]
Figure 1. (A) Functionality of the Riverwatcher scanner with two sets of infrared light barriers [22], (B) example of a count in the Winari 5.01 software version, including the silhouette and a corresponding video, (C) camera tunnel (gas-filled camera cone to improve visibility in turbid conditions) with artificial substrate, which increases bottom roughness.
Water 16 00477 g001
Figure 2. Different chute and fyke constructions to guide fish through the counter. (A,B) Installation of a fyke in resting pool of a vertical-slot fishway on the Inn River (bar diameter 8 mm, spacing 20 mm). (C) Installation in a nature-like fishway on the Neckar River, with guidance structures made from horizontal round bars (bar diameter 8 mm, spacing 30 mm).
Water 16 00477 g002
Figure 3. A VAKI Riverwatcher used in conjunction with a portable resistance board weir (A) in the Stanislaus River, California, to enumerate escapement of (B) Chinook salmon and (C) steelhead. Information is also collected on other species, such as (D) striped bass and (E) river otters.
Water 16 00477 g003
Figure 4. Migration patterns of fish (all species combined) at the installation in Neckar River in the first monitoring season 2016 (50). (A) Size distribution of all recorded fish from 17 different species. (B) Diurnal distribution of all fish passages.
Water 16 00477 g004
Table 1. Selected Riverwatcher installations conducted and/or operated by the authors in Europe and North America, their configuration, and target fish species.
LocationTarget
Species
VersionInstallation (Since)Type
of Fishway
Scanner
Width
Scanner HeightReference
Lachsbach River, GermanyAtlantic salmon (Salmo salar)Scanner2006Vertical
slot
40 cmsingle[11]
Moselle River, GermanySpecies assembly 30+Scanner, camera, and motion detection2011Vertical
slot
45 cmDouble[40]
Aare River,
Switzerland
Salmonids, including brown trout (Salmo trutta f. fario), grayling (Thymallus thymallus), lake trout (Salmo trutta lacustris)Scanner and camera2015Vertical
slot
40 cm Single[n/a]
Neckar River,
Germany
Species assembly 30+Scanner and camera2016Nature-like fishway40 cmSingle[41]
Inn River,
Austria
Salmonids, including brown trout (Salmo trutta f. fario), grayling (Thymallus thymallus), and Huchen (Hucho hucho)Scanner and camera2015Vertical
slot
35 cmSingle[22]
Pitze River,
Austria
Brown trout (Salmo trutta f. fario)Scanner2014Vertical slot20 cmSingle[4,21]
Rhine River,
Switzerland
Lake trout (Salmo trutta lacustris)Scanner and camera2017Vertical slot40 cmDouble[32]
Stanislaus River, CaliforniaChinook salmon (Oncorhynchus tshawytscha) and steelhead (Oncorhynchus mykiss)Scanner and camera2004Resistance board weir; in-river40 cmSingle[39]
Tuolumne River, CaliforniaChinook salmon (Oncorhynchus tshawytscha) and steelhead (Oncorhynchus mykiss)Scanner and camera2009Resistance board weir; in-river40 cmSingle[15]
Salinas River, CaliforniaSteelhead (Oncorhynchus mykiss)Scanner and camera2010Resistance board weir; in-river30–40 cmSingle[42]
Cedar River, WashingtonSalmonids, including Chinook salmon (Oncorhynchus tshawytscha), coho salmon (Oncorhynchus kisutch), and sockeye salmon (Oncorhynchus nerka)Scanner and camera2014Pool and weir fishway40 cmSingle[43]
Mahagony Creek, NevadaCutthroat trout (Oncorhynchus clarki)Scanner2011Rigid weir; in-river40 cmSingle[n/a]
Truckee River,
Nevada
Cutthroat trout (Oncorhynchus clarki henshawi), Cui-ui (Chasmistes cujus)Scanner2011Nature-like fishway40 cmSingle[n/a]
Credit River,
Ontario
Steelhead (Oncorhynchus mykiss)Scanner and camera2016Pool and weir fishway40 cmSingle[n/a]
Disclaimer/Publisher’s Note: The statements, opinions and data contained in all publications are solely those of the individual author(s) and contributor(s) and not of MDPI and/or the editor(s). MDPI and/or the editor(s) disclaim responsibility for any injury to people or property resulting from any ideas, methods, instructions or products referred to in the content.

