1. Introduction
Energy is a crucial component of human social development, and its consumption is closely tied to a country’s economic progress. Since the last century, energy demand in China has grown steadily, leading to intensified environmental challenges, such as air pollution and urban heat islands [
1]. To address these issues, China has established the goal of reaching peak carbon dioxide emissions by 2030 and achieving carbon dioxide emissions neutrality by 2060 [
2]. Achieving this objective requires China to transition away from traditional energy structures and prioritize the development and utilization of clean, renewable energy sources while minimizing greenhouse gas emissions.
Heat pumps are becoming increasingly important as efficient and clean renewable energy devices in the face of the global energy crisis. At the same time, it allows thermal energy to be converted through heat pumps, enabling the effective application of low-temperature heat [
3]. These systems have been successfully used in a wide range of locations around the world, from the Parliament House in Zurich, Switzerland, to numerous installations across Japan, the United States, Sweden, and South Korea [
4,
5,
6,
7,
8].
WSHP technology has been a topic of study in China for several years, but adoption has been slow [
9,
10]. Nevertheless, as of the end of 2020, China had achieved a hydrothermal geothermal energy supply area of 580 million square meters, making it one of the top developing countries in this area [
11,
12]. The China Energy Administration’s Comprehensive Department’s Opinions on Promoting the Development and Utilization of Geothermal Energy [
13] emphasize the need for the development of surface WSHP technology in regions with significant water resources, like the middle and lower reaches of the Yangtze River, to provide heating and cooling solutions for urban areas.
Despite WSHPs as a clean source having lots of benefits, its warm and cold water drainage can have negative impacts on the surrounding water and ecosystem. It was found that the discharge of cold water also impacts the aquatic environment, primarily affecting the reproduction of fish. However, compared with cold water discharge, the environmental impact caused by warm water discharge is more severe. Different from the chemical pollution introduced into the water body, warm water discharge is indirect cooling water, which transfers heat to the water and exerts physical effects. Elevated water temperatures resulting from warm water drainage can cause changes in water density; sediment deposition; a decrease in oxygen content; and harm to aquatic plants and animals, including a large number of fish deaths due to cyanobacteria blooms [
14]. Examining the effects of warm water drainage on surrounding ecosystems is a critical research subject for scholars, both domestically and abroad. Zhao et al. [
15] analyzed animal samples from the subtropical Daye Bay and evaluated the stability of animal communities under varied water temperature conditions. Piotrowski et al. [
16] employed four empirical or semiempirical models to research the impact of climate change on water temperature or aquatic ecosystems.
Therefore, while developing and utilizing hydrothermal resources, it is necessary to study the thermal potential performance of river ecosystems. Sayegh M A et al. [
17] presented a statistical analysis of the average water temperature and the flow rate of the Oder River. The results show the relation between the average air temperature in Wroclaw and Oder River’s average water temperature for the two analyzed locations. This proposition was the first step for wider analysis in order to identify the thermal potential of the Oder River water as a heat source for heat pumps. Additionally, by studying climate change in the Yangtze River basin, Xiao et al. [
18] analyzed the ecological effects of increasing water temperatures in the area in recent years. Tao et al. [
19] used regression methods to reconstruct the framework of river flow and temperature changes in the middle reaches of the Yangtze River in order to study the impact of hydropower station construction on the Yangtze River. Peng et al. [
20] used regression analysis to investigate the specific causes and driving mechanisms of surface water temperature change for six significant lakes in China, providing evidence for water environmental protection. These studies suggest that human activities, including hydropower stations, water source heat pumps, sewage treatment plants, etc., as the primary drivers of changes in surface water temperature. Controlling surface water temperature within a certain range can mitigate environmental harm and support the health of water ecosystems.
In terms of research methods, with the advancement of CFD software, scholars can now use acknowledged turbulence models, such as the
k-
ε model, RNG model, large-eddy model, and algebraic Reynolds stress model, to validate warm water drainage system regulations [
21]. Prior research that explored heat diffusion patterns mainly focused on power plants and examined the temperature and flow fields of warm water drainage. Most of these studies used numerical simulation techniques to analyze the water temperature shifts caused by power plants’ inlet and outlet waters [
22,
23,
24]. Nevertheless, the impact of WSHP tail drainage on the water environment has not been sufficiently examined. Only a small number of domestic scholars have investigated this area. Chen and Zhang [
25], for example, developed a water temperature model grounded on the heat balance equation to standardize designs of lake WSHP units and address thermal pollution from lake WSHP, using the Hunan University of Science and Technology’s Moon Lake WSHP system as their research object. To fully comprehend the impact of WSHP on the environment in the future, it is vital to scientifically simulate and analyze the warm water drainage process of WSHP units and regulate its impact on local water bodies while still taking advantage of WSHP systems’ energy-saving potential.
Based on the above literature, most of the research on the impact of water temperature in the Yangtze River was based on hydropower projects. At present, there has been little research on the impact of WSHP drainage temperature in the Yangtze River. With the development of more and more WSHP projects, rigorous scientific studies about the impact of water temperature are needed. Therefore, this study filled the gap in this field, and the applied research models and methods provide a reference for the study of similar problems. The research results show that ecological protection and economic and social development in the Yangtze River Basin can be synchronized. It also has significant application value. In this study, we developed a three-dimensional model of the river channel of the River Water Source and Energy Station in the Wuhan Hankou Binjiang International Business District using the water quality and temperature data from the five years prior to project approval. We constructed a governing equation of temperature and drainage during the project using the Reynolds mean equation method and applied FLUENT software for computational fluid dynamics (CFD) simulations. This approach provides an efficient evaluation of the potential impact of warm water drainage on the surrounding aquatic environment and will be helpful when considering WSHP projects in similar environments.
It is important to note that different WSHP energy stations exhibit varying technical challenges, such as building type, water intake distance, and source water quality. Therefore, our method serves as a valuable reference for evaluating warm water drainage during WSHP projects in the middle and lower reaches of the Yangtze River and can be applied to other WSHP projects facing similar environmental challenges around the world.
2. Materials and Methods
2.1. Numerical Simulation Model and Solution Method
In this study, the control equations used the Reynolds mean equations, which take the following forms:
where
denotes the Cartesian coordinate and
is the velocity component along direction
.
is the mass force along direction
.
is the pressure,
T is the time-averaged temperature,
is the gas density, and
. To close the equations, a turbulence model should be introduced.
To select the optimal turbulence model for the flow problems involved in this project, the preliminary calculations of the simulations were carefully compared between the laminar model, Spalart–Allmaras model, and standard k-ε model by considering the flow problems involved in this project. In a practical flow situation, when the turbulence intensity is high, the convergence performances of laminar and SA models are poor. In contrast, the standard k-ε model exhibits the best characteristics of convergence during calculations. It can significantly shorten the convergence process and generate a more realistic flow field structure that can effectively reflect the flow field state.
The standard
k-
ε model [
26] has been adopted by many experts and scholars for its notable applicability and acceptable computational accuracy in engineering and is more widely employed in engineering applications, especially in the field of hydrodynamics [
27,
28,
29]. Consequently, the standard
k-
ε model was adopted in this study. In the model, we used the following equations:
where
is the turbulent kinetic energy,
is the dissipation rate, and
is the turbulent viscosity. The constants involved in the model were
,
,
,
, and
= 0.09.
The analysis revealed that the standard k-ε model yielded the best convergence properties in the calculation process, which could significantly shorten the convergence process, and the obtained flow field structure was more realistic and reflected the flow state well. Therefore, in this project, we adopted the standard k-ε model.
Due to the temperature difference between backwater and river water, the water density changes, resulting in the thermal buoyancy effect. To account for this effect, additional models were needed to describe the density change with temperature. There are currently three commonly used models, namely, the Boussinesq approximation (BA), polynomial linear density (PLD), and nonlinear density (NLD) models.
Since the temperature difference in this project was small and the water density did not significantly change, the BA model was adopted, as it yields better calculation accuracy and stability. In this model, it is assumed that the density of the water body has a linear relationship with the temperature within a certain range, expressed as follows:
Since the temperature difference in this project was relatively low, there was not much change in density. In order to make the research more scientific, the variable representing density is still retained in the formula. In this formula,
and
represents the initial and final density of the water.
is the difference between the initial and final temperature of the water.
is the coefficient of thermal expansion. This model achieves better convergence and consumes fewer computational resources but is only suitable for cases where the temperature does not notably vary [
30,
31,
32,
33].
2.2. Energy Station’s Basic Water Temperature Conditions
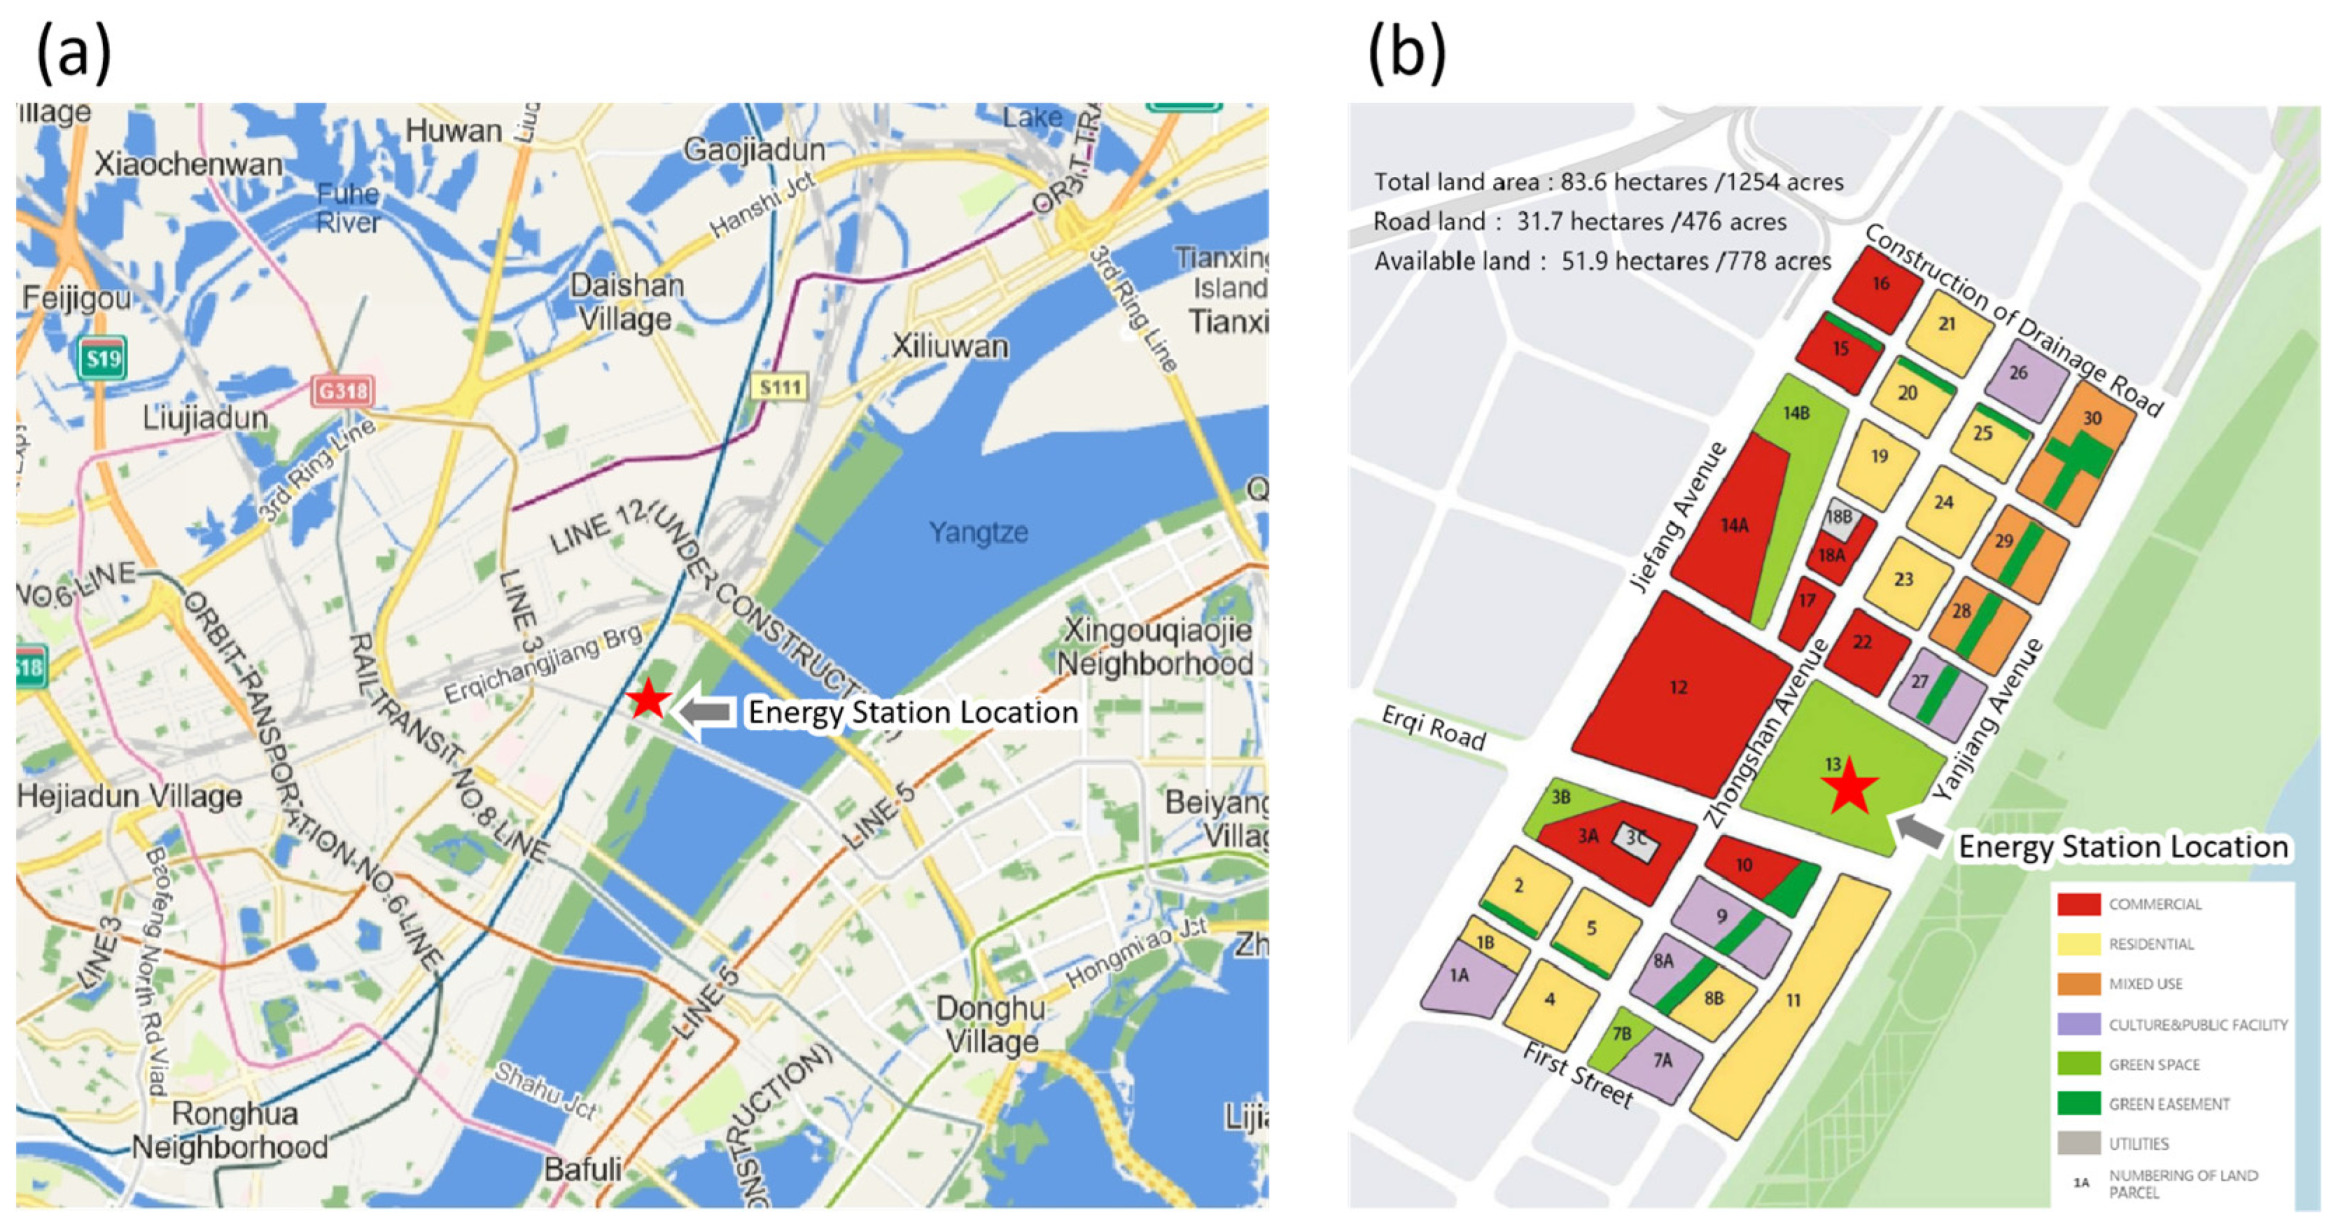
In this study, we took the river water source renewable energy station located in the Hankou Binjiang International Business District as an example to analyze the impact of warm water drainage on the Yangtze River basin. The overall spatial location and planning of the project are displayed in
Figure 1.
The project was situated in the central park green space of Plot No. 13, Hankou Binjiang International Business District, Jiangan District, Wuhan City, Hubei Province. It had a total designed energy capacity of 2.11 million m
2 and used river water from the Wuhan Yangtze River section as a cold and heat source. The river water had an average daily temperature range of 23~28 °C in summer and 7~14 °C in winter. The average annual runoff reached 714.4 billion m
3 (23,500 m
3 per second). The water quality was good, and water was abundant, making it capable of fully meeting the water demand of the project. We show the summer and winter water temperature statistics in the Wuhan Section for the Yangtze River from 2011–2017 in
Table 1. During the summer months, the average daily temperature of the river water in the Yangtze section of Wuhan ranged from 23 to 28 °C, with the highest temperature not exceeding 30 °C often. The water temperature in winter was below 9 °C on several days. The extreme minimum temperatures were between 4.5 °C and 7.2 °C. The relevant data for this project were obtained through feasibility study reports and design blueprints. The water temperature data used for the four extreme conditions of drainage temperature to be elaborated in this study were based on statistical data from recent years.
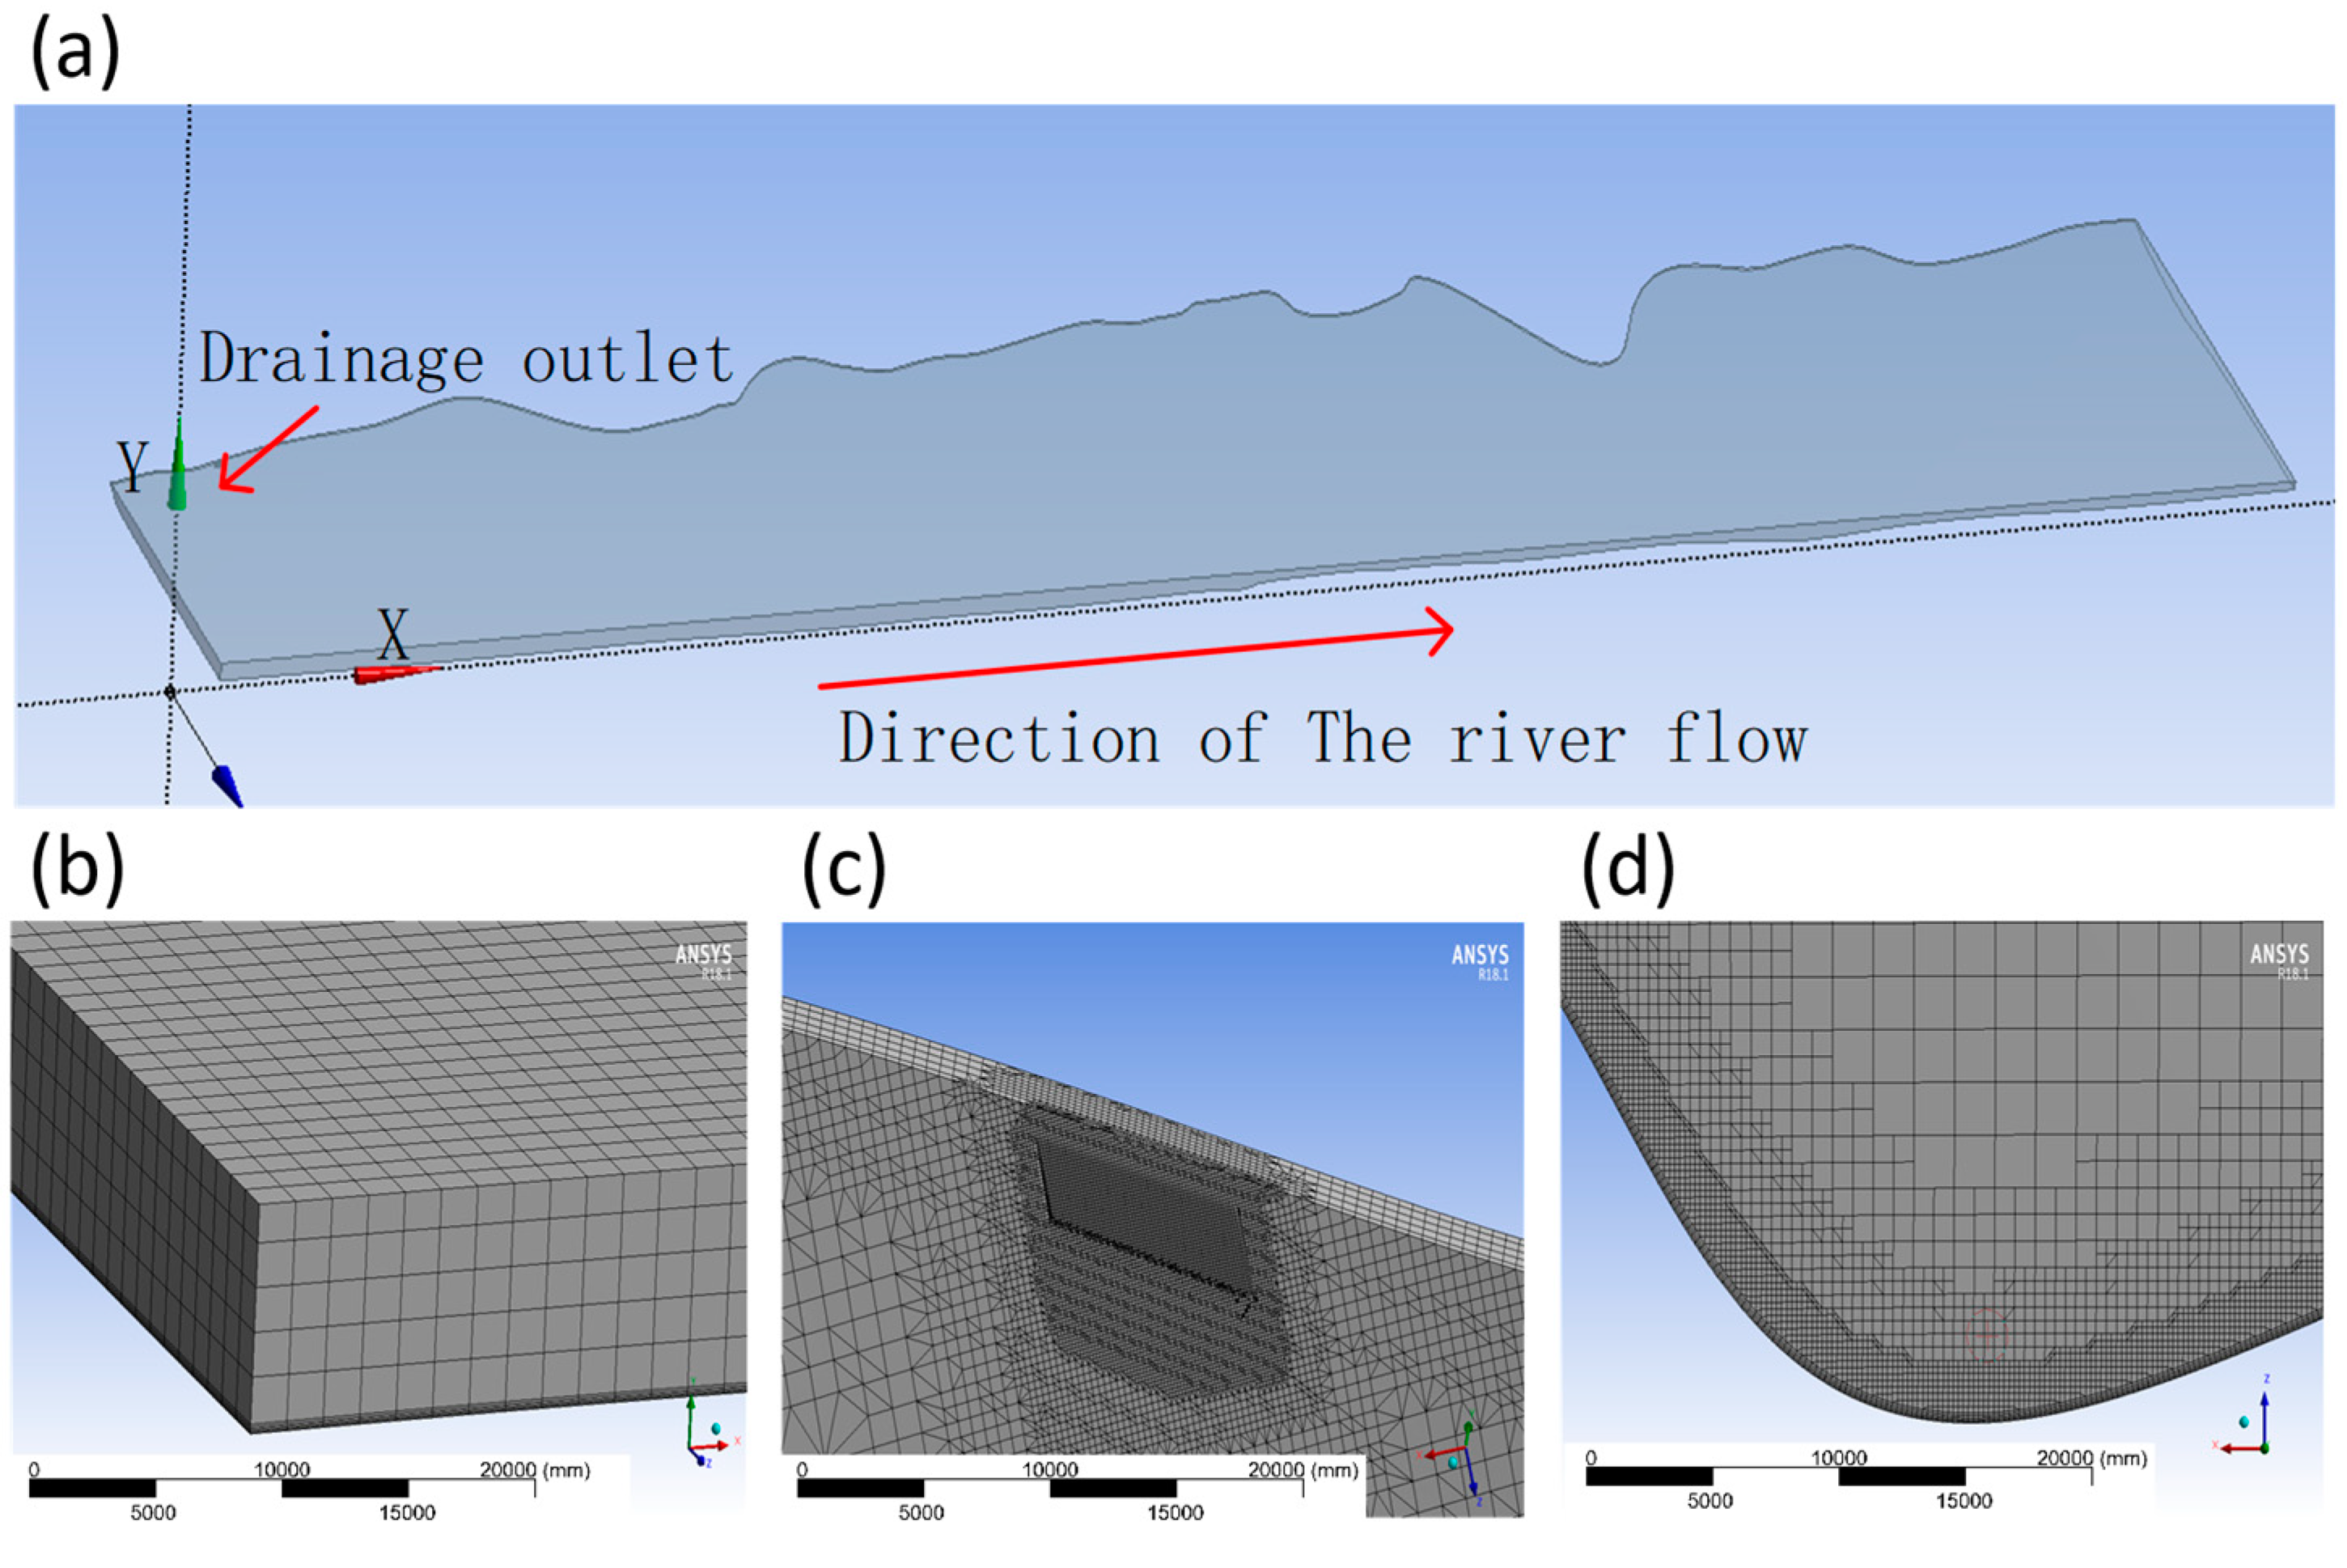
2.3. Three-Dimensional Model Reconstruction of the River Channels
The geometry of the river channel directly impacts the flow of the river at this location. To simulate the river flow as accurately as possible, this research used modeling software like AutoCAD and Solidworks to accurately portray the riverbed in the river model. The riverbed profile of a river section generally converges between 50 m and 100 m. In order to take an accurate value, we extracted the outline of the riverbed within 2000 m of the river section at equal intervals of 50 m. This approach met the accuracy requirements of the river geometry model for these simulations. On the other hand, the research object of this article was the Wuhan section of the Yangtze River Basin, which is an irregular natural river channel. And the shape and size of its cross-sections are different. It was not necessary to consider the issue of obtaining water surface profiles.
2.4. Calculation Domain and Grid Division
Based on this model, the water body model was obtained for both seasons. This research used cut-cell grid generation algorithms to mesh the computational domain finely. The algorithm combines the benefits of traditional structured meshing methods and unstructured mesh generation algorithms, ensuring that most meshes within the computational domain are standard square cells and that meshes are generated automatically. By using different grid numbers and conducting calculations under the same operating condition, we compared and analyzed the impact of drainage temperature changes by selecting the vicinity of the centerline of the drainage outlet as an observation point and checked whether the calculation changed with grid density. If the calculation result remained unchanged after multiple rounds of iterations, it was considered that the number of grids had reached the critical value, thus completing the grid independence verification.
Figure 2 illustrates the grid division at several typical locations. It can be observed that the grid divisions in this simulation exhibited good orthogonality, which significantly promoted the accuracy and convergence of flow problem simulations.
2.5. Boundary Conditions and Return Water Outlet
Based on the design documents, the inlet of river water was placed 115 m upstream of the recession inlet to account for boundary conditions. This location was determined after preliminary calculations to eliminate the inlet boundary’s significant influence. If the inlet boundary was set farther away from the drainage outlet, the calculated results were similar to those at 115 m upstream of the drainage outlet because the water inlet temperature was basically constant. If the inlet boundary was set too close to the outlet, the temperature influence range of the outlet would not be fully covered. To reflect the velocity distribution in the inlet section as accurately as possible, a mass flow inlet was established as the inlet boundary for the river. Additionally, the classical rigid cover assumption was used in the CFD simulations to better represent the flow situation at the river surface. This approach achieves a favorable balance between computational accuracy and efficiency and is widely used in hydraulic engineering to address river surface flow.
To simulate the temperature field more accurately, a nonstationary solver was used in this study to calculate and determine the river water velocity and temperature distributions over 7 days. However, it should be noted that the actual contact of the recession inlet with the river body varied significantly due to changes in the water level. During the summer months, the high water level reached approximately 25 m, while in winter, the water level dropped to only 15 m, and water was then drained via the drop bucket. The outlet should be rectangular with a width of 7.2 m, and the height can be chosen as 0.3 m based on parameters such as the outlet discharge and the gradient of the drop bucket.
3. Results and Discussion
This study involved referring to a significant amount of hydrological data for river water from previous years. The river water flow information was comprehensively compared between the wet season of the wet years (W1), the dry season of the wet years (W2), the wet season of the dry years (S1), and the dry season of the dry years (S2) to determine four possible adverse situations, which were primarily calculated and analyzed.
Table 2 lists the relevant parameters of the working conditions that were considered.
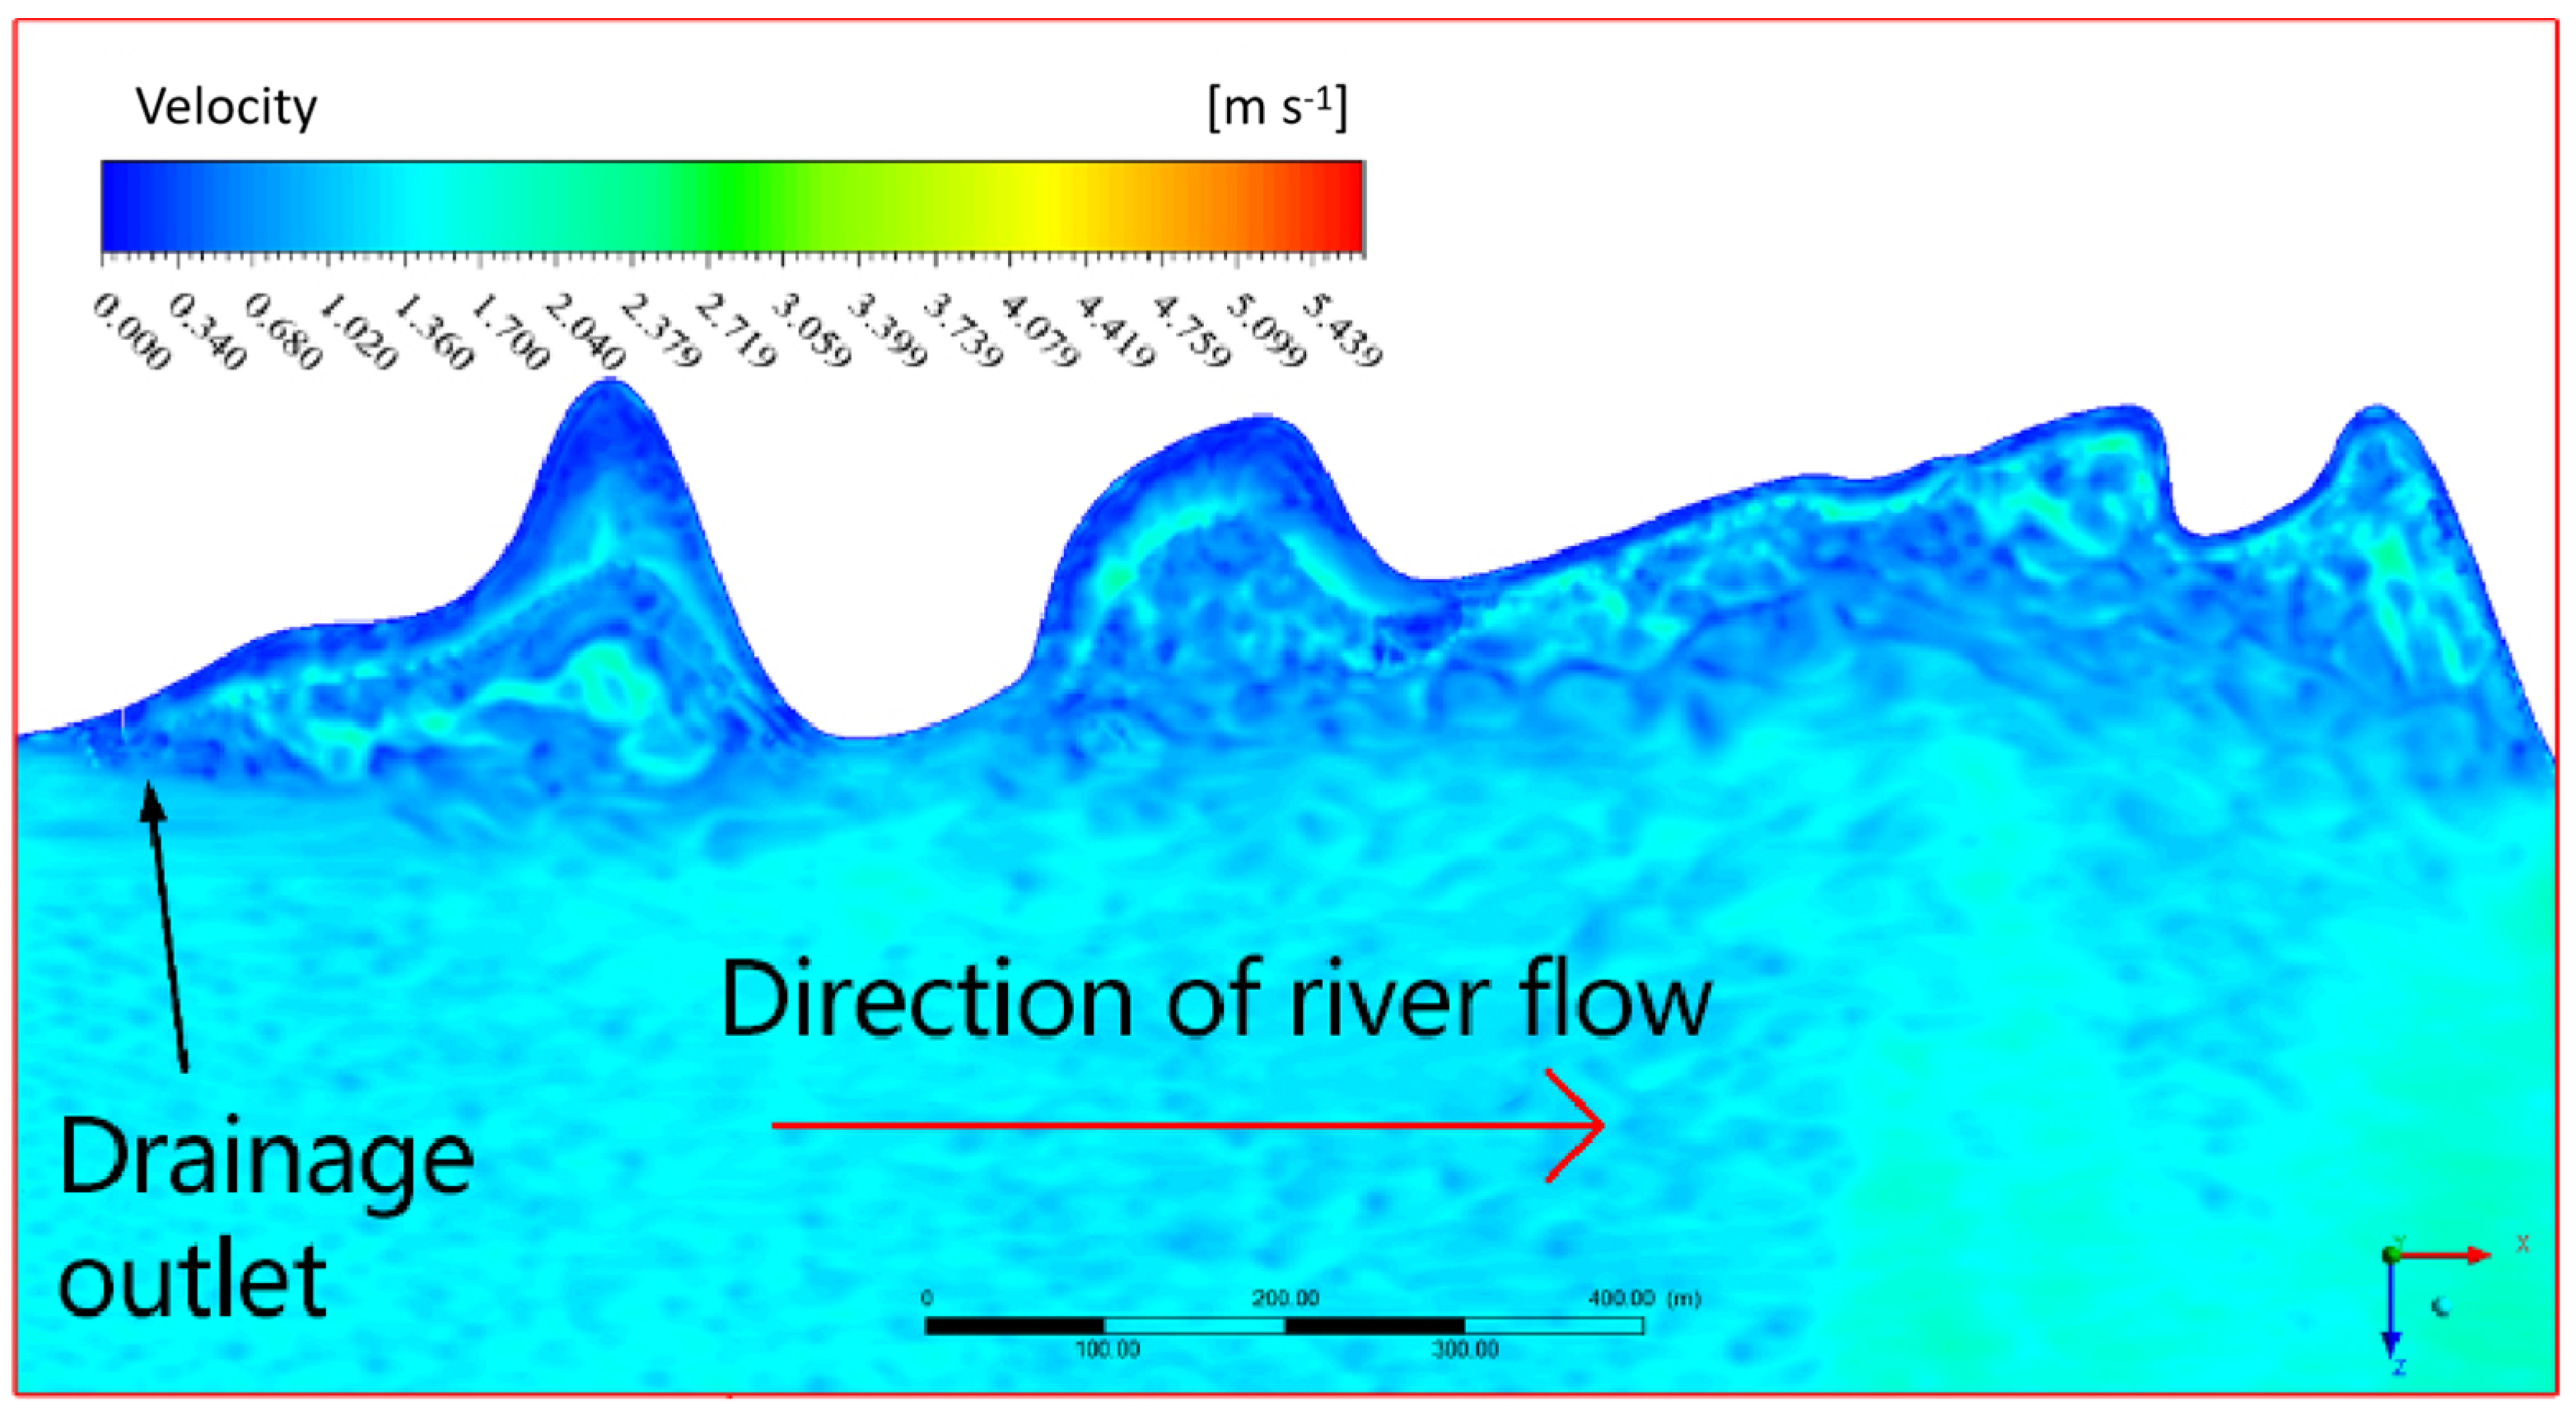
Figure 3 shows the distribution of river flow velocity on the horizontal plane at the center of the outlet (working condition S1). It can be seen that the velocity of the water in the center of the Yangtze River was around 1.3 m/s. In the nearshore area, due to the influence of the riverbank, the river water flow rate was relatively low. There was backflow in some areas, which is highly consistent with the actual situation. In addition, the fine turbulent structure of river water was well predicted. And the simulation result of the river velocity distribution was accurate and reliable for engineering precision.
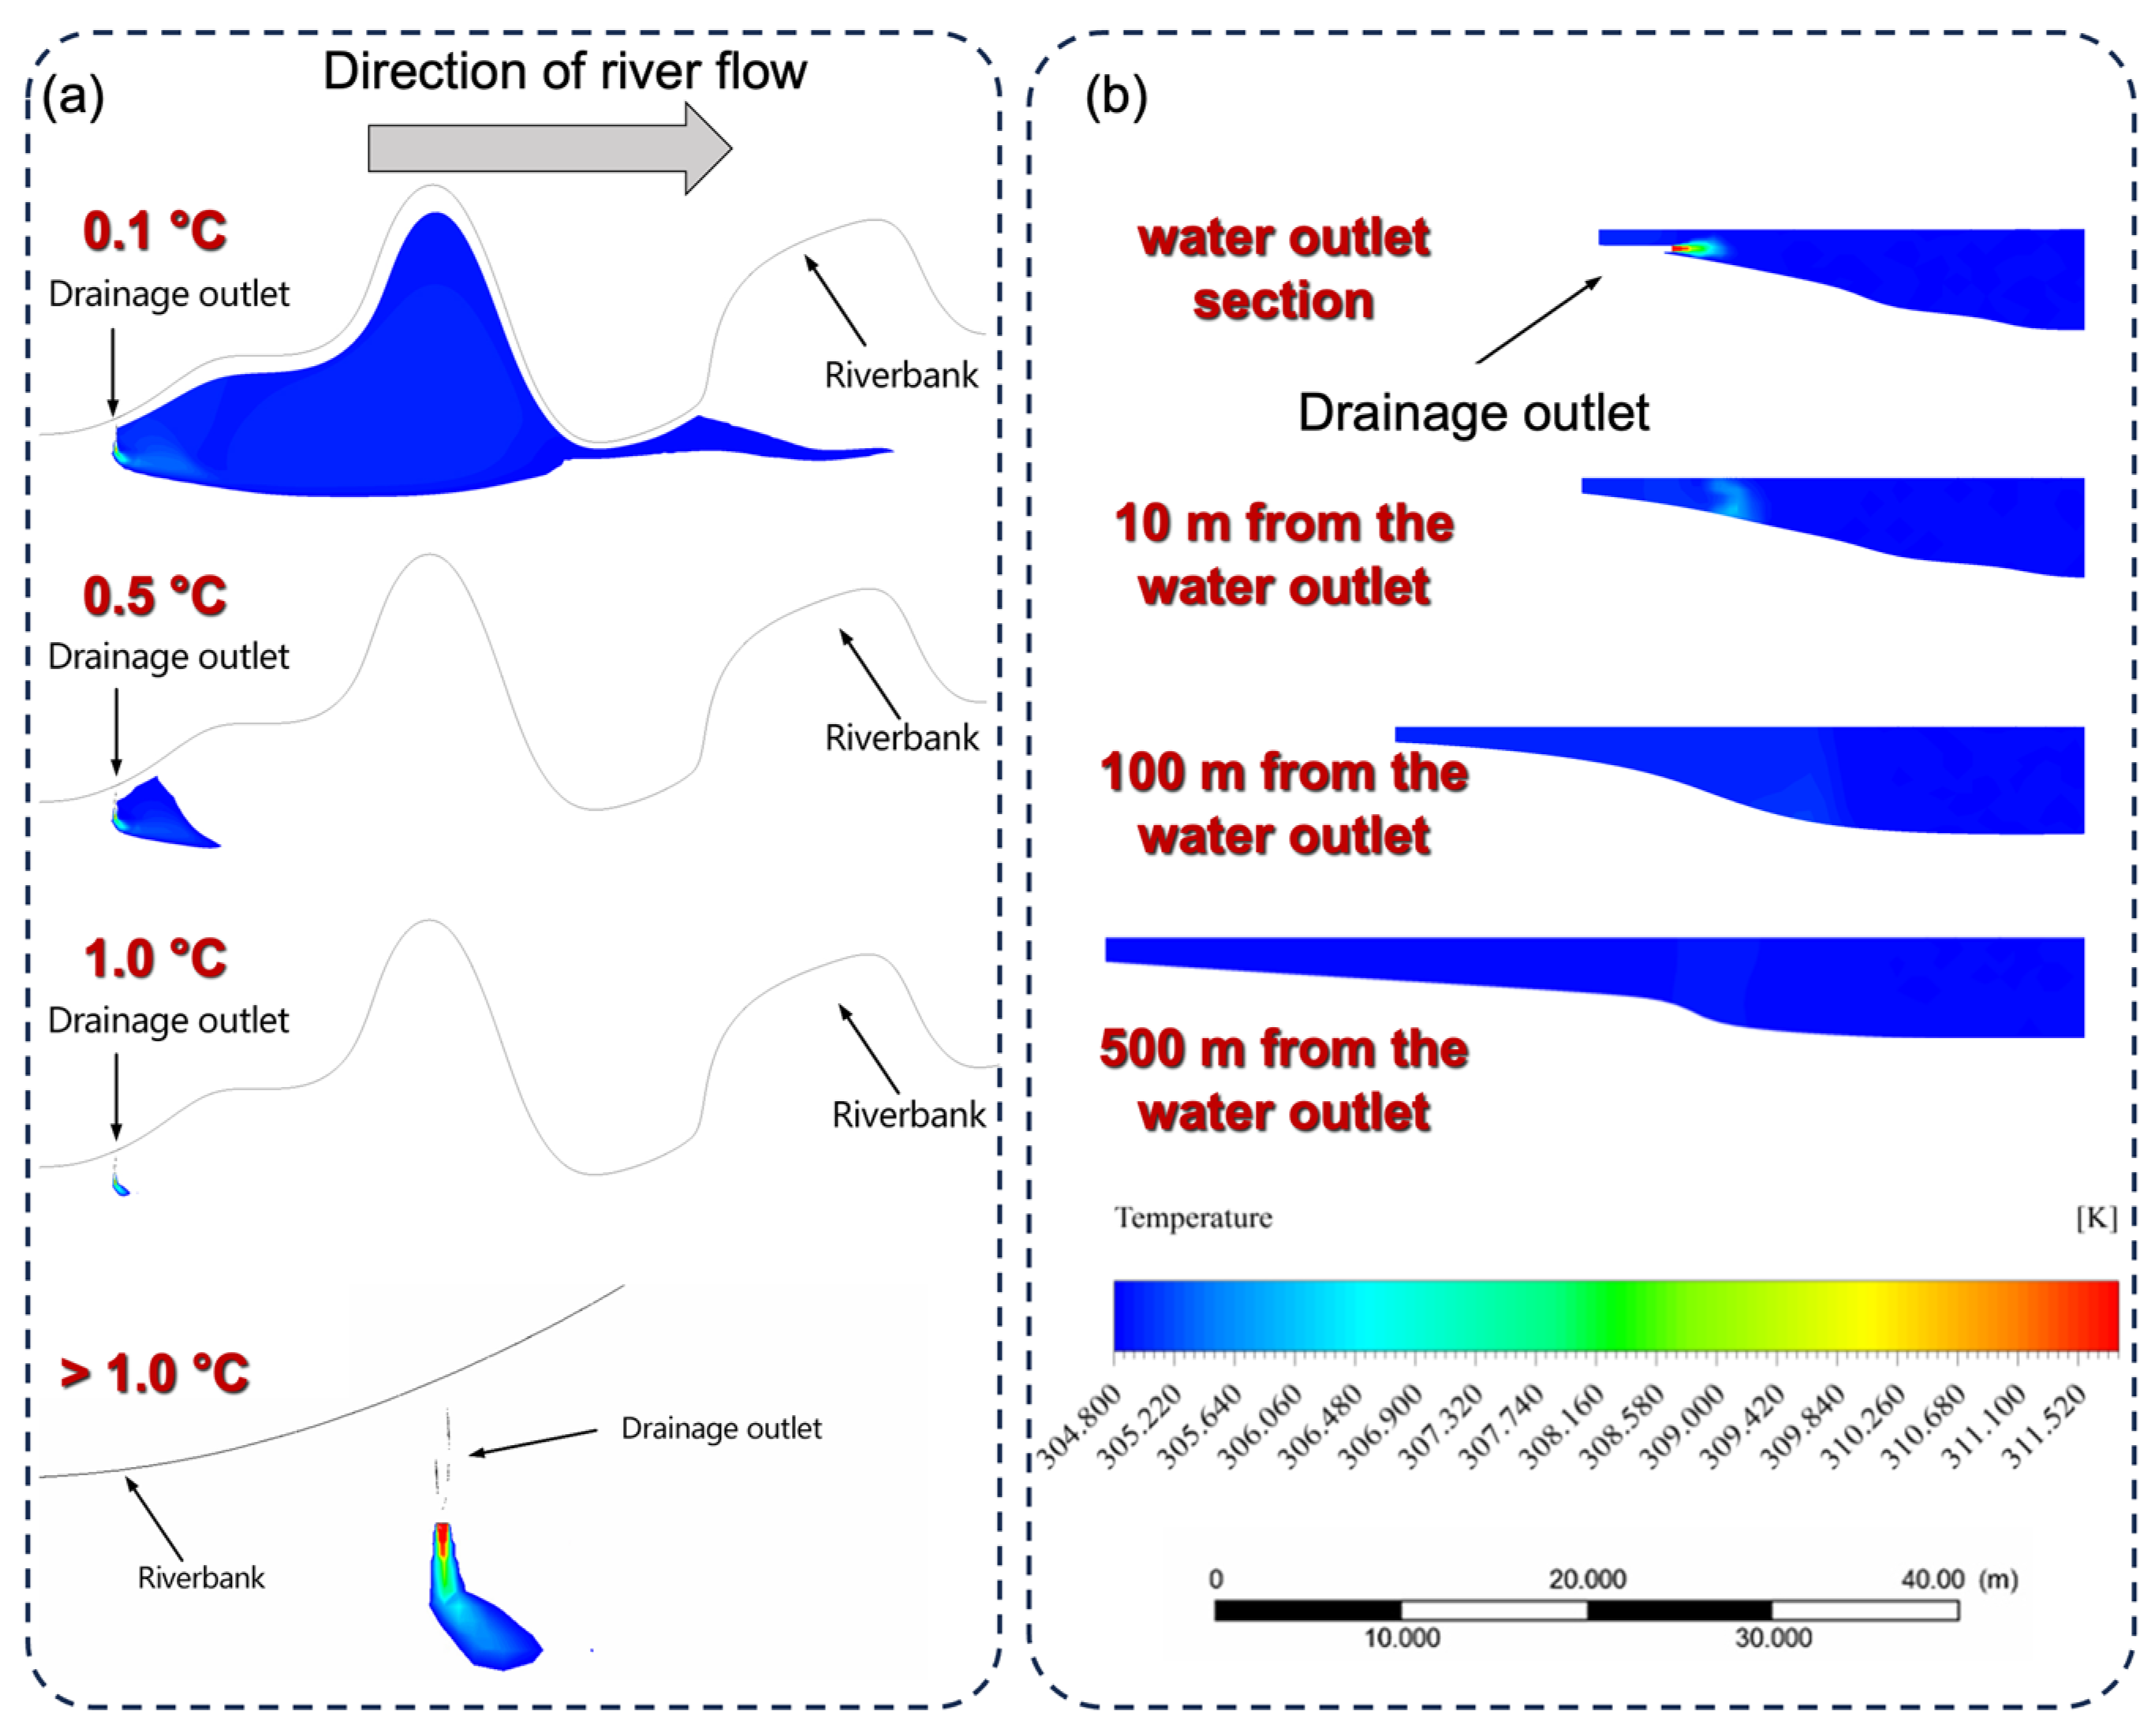
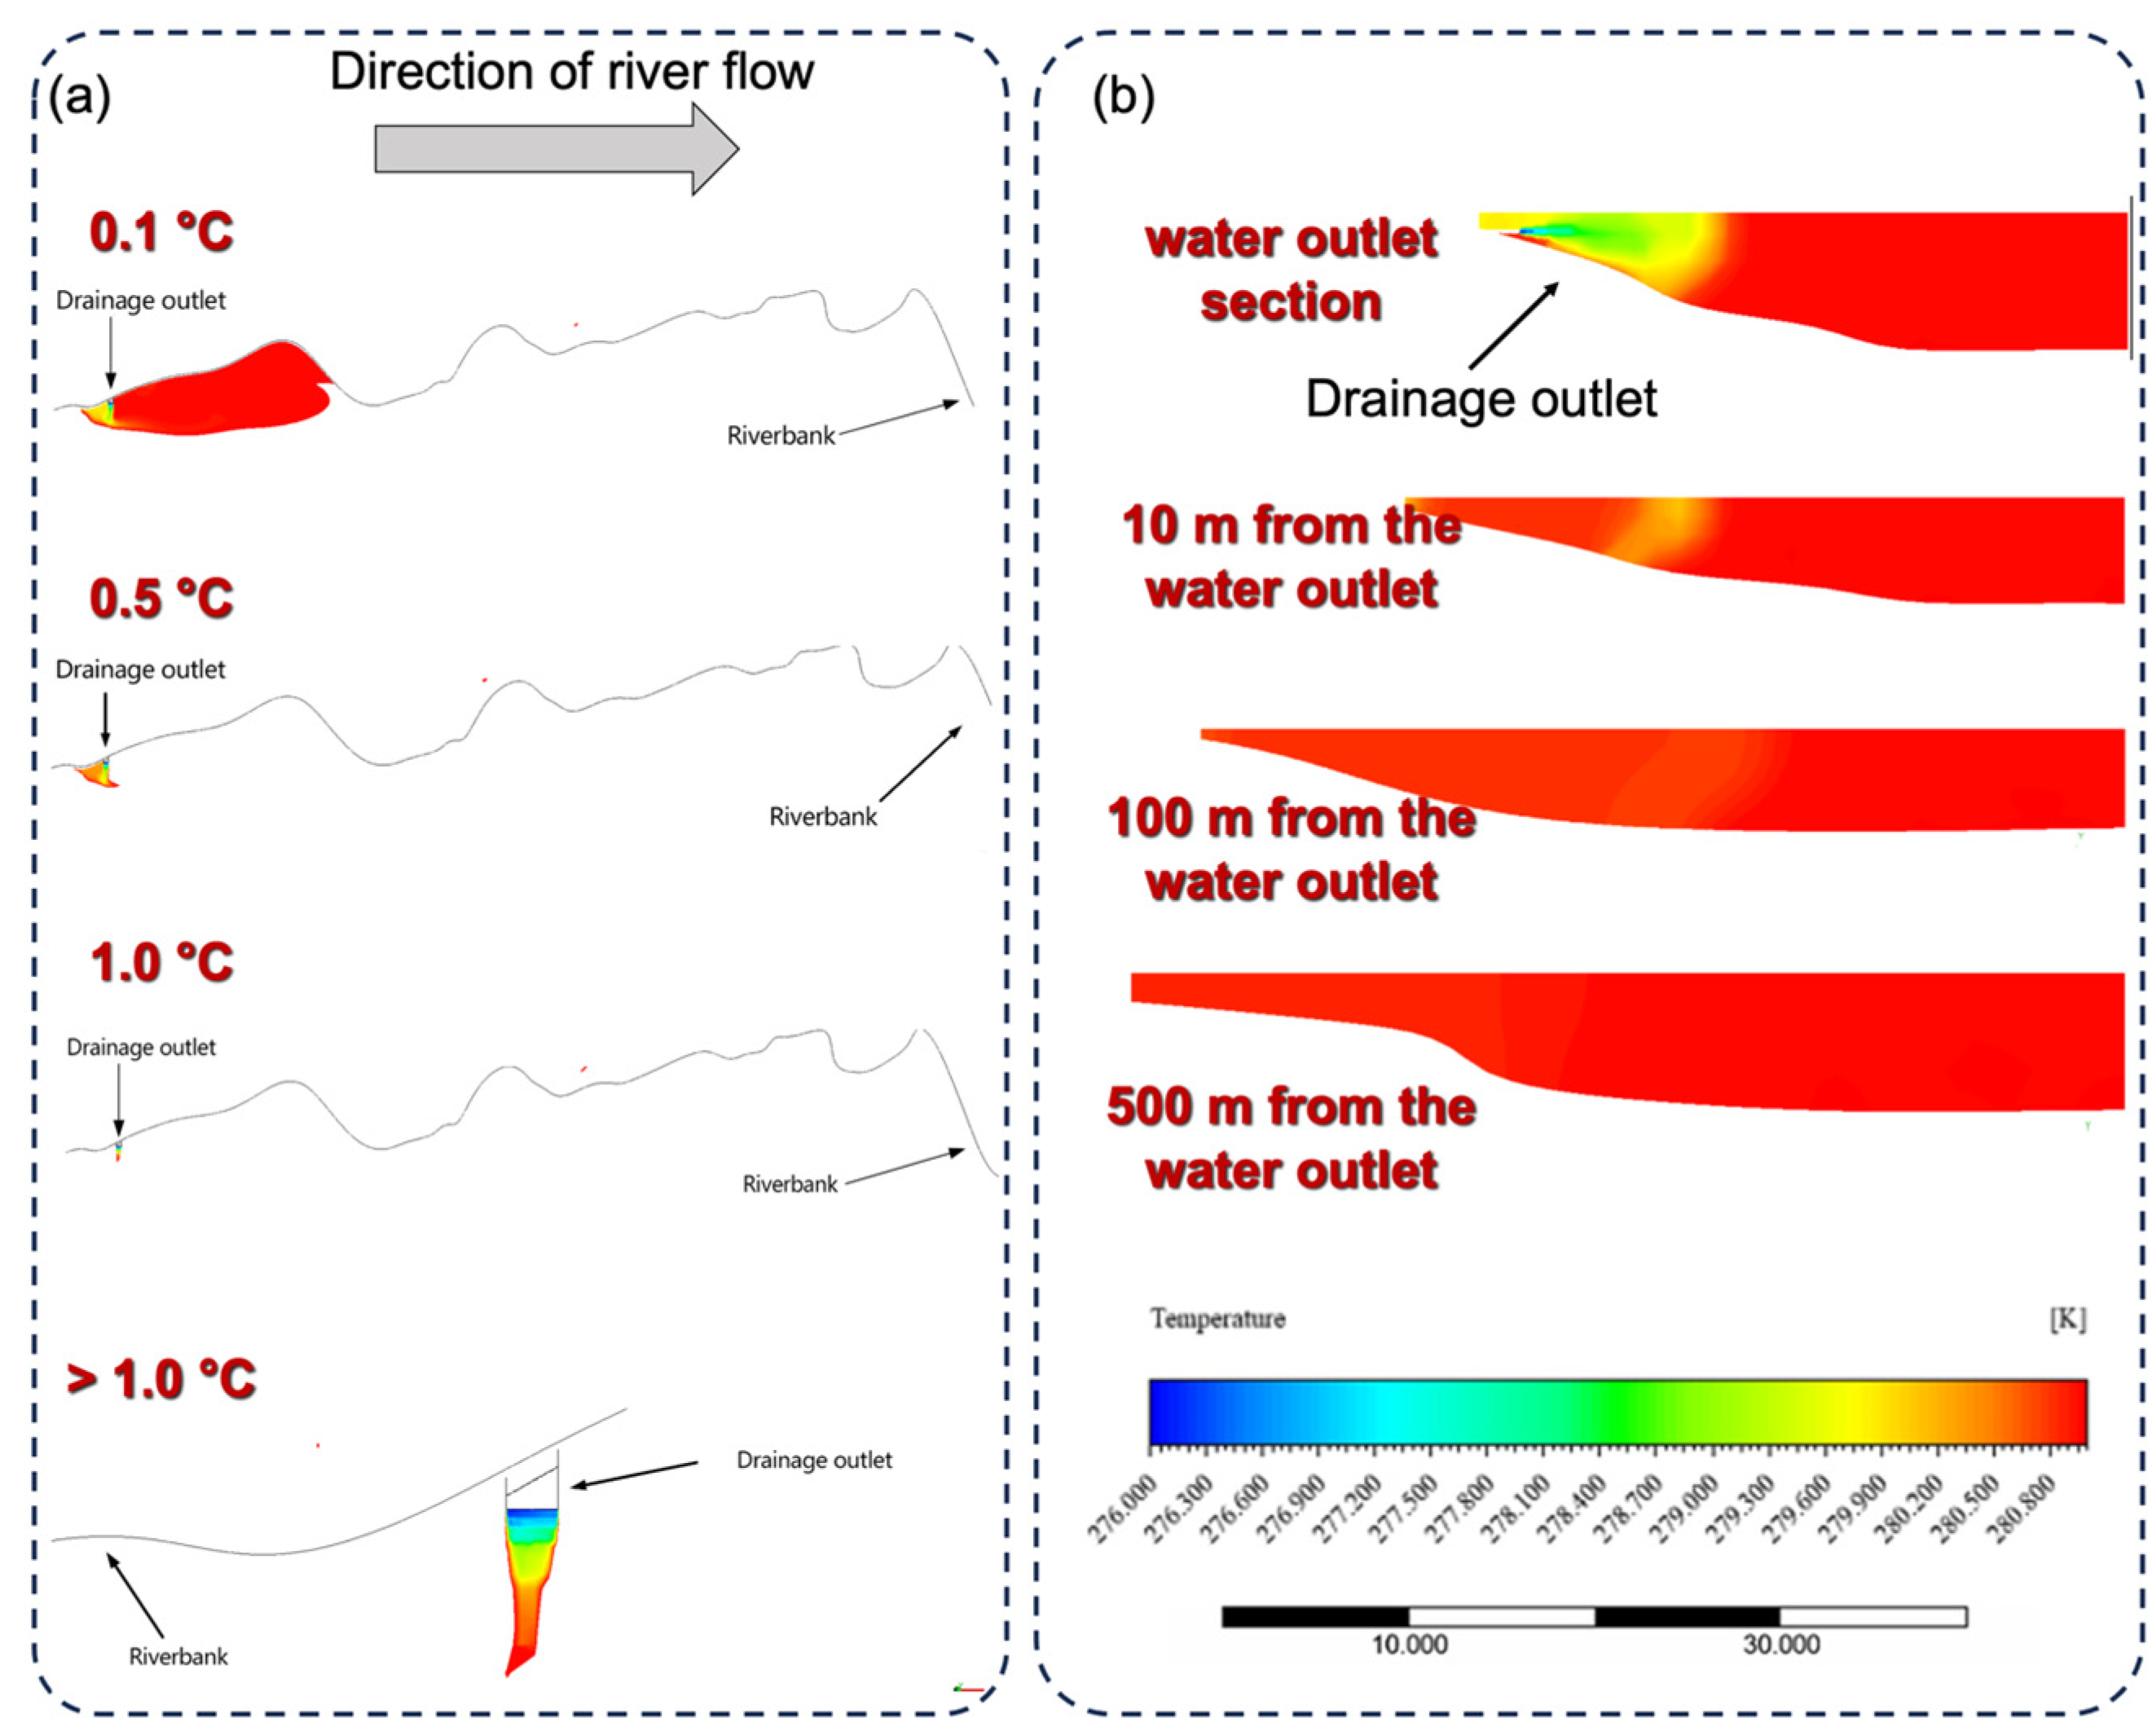
Figure 4 illustrates the temperature changes under unfavorable working condition S1 during the summer season. Specifically,
Figure 4a shows the influence range of different temperatures in the horizontal section passing through the center of the outlet. When the river temperature difference was over 1 °C, the water temperature near the outlet is shown at the end of
Figure 4a.
Figure 4a shows the drainage area with temperature differences of 0.1 °C, 0.5 °C, 1 °C, and greater than 1 °C from top to bottom in summer. The blue area in the figure represents the range of influence of different degrees of temperature rise on the horizontal section passing through the center of the outlet. It can be seen that the watershed area with a difference of 0.1 °C or more between the drainage temperature and the river water temperature difference was the largest, and the watershed area with a difference of 1 °C or more was the smallest. In order to more intuitively display the temperature influence above 1 °C at the drainage outlet, the last image in
Figure 4a was enlarged.
In
Figure 4b, the temperature downstream of the Yangtze River from the outlet is depicted.
Figure 4b shows the temperature variation profiles of the water at distances of 10 m, 100 m, and 500 m from the outlet of the drainage outlet, from top to bottom. The red color represents the temperature drainage in summer, and the area from red to blue represents the gradual change in temperature drainage in the middle of the Yangtze River. Because the drainage pipeline extends from the shore to the center of the river for a certain distance, a gap is presented in the first image of
Figure 4b to indicate the position of the drainage pipeline in the river. In the second to fourth images of
Figure 4b, due to the increasing distance from the water outlet, the position of the drainage pipeline is difficult to see. Warm water drainage contributed to variations in the water temperature. However, the increase in temperature caused by drainage temperature mainly occurred in the area within 700 m downstream of the outlet. The maximum width of the affected area was about 260 m, which was smaller compared with the width of the river channel.
In order to meet the energy usage demands, the drainage velocity of the WSHP energy station should reach up to 3.97 m3/s. As previously mentioned, the average velocity of the Yangtze River is about 1.3 m3/s. Because the drainage velocity of the WSHP energy station is much larger than the real velocity of the river, it can cause a change in the river’s temperature when they are mixed. However, the Yangtze River has a huge flow, with about 7144 million m3 per year. The upper and lower layers of the river could form a strong convection current, and thus, heat exchange continuously occurred in the Yangtze River. Moreover, it could not form the temperature stratification in the direction of the water depth. The temperature of the water in a small area did not change by more than 3%. Under the most unfavorable working conditions (8 °C temperature difference), the change in water temperature did not exceed 0.3 °C. Therefore, the change in the river’s temperature was very small, which would not affect the organisms in the Yangtze River basin.
Furthermore,
Supplementary Figure S1 presents the temperature changes experienced under adverse working condition S2 during the summer season. The S2 condition was also simulated and analyzed to find that the range of the temperature rise for different horizontal sections passing through the center of the water outlet was basically the same as under the S1 condition. Further explanation is not necessary here.
Figure 5 depicts the temperature changes under unfavorable working condition W1 during the winter season.
Figure 5a illustrates the influence ranges of different degrees of temperature decline on the horizontal section through the center of the outlet and a local magnified view of the basin with a temperature variation exceeding 1 °C from the river water near the outlet.
Figure 5a shows the drainage area with temperature differences of 0.1 °C, 0.5 °C, 1 °C, and greater than 1 °C from top to bottom in winter. The red area in the figure represents the range of influence of different degrees of temperature rise on the horizontal section passing through the center of the outlet. It can be seen that the watershed area with a difference of 0.1 °C or more between the drainage temperature and the river water temperature difference was the largest, and the watershed area with a difference of 1 °C or more was the smallest. In order to more intuitively display the temperature influence above 1 °C at the drainage outlet, the last image in
Figure 5a was enlarged.
In
Figure 5b, the temperature in each section of the Yangtze River downstream from the outlet is presented.
Figure 5b shows the temperature variation profiles of the water at distances of 10 m, 100 m, and 500 m from the outlet of the drainage outlet, from top to bottom. The blue color represents the temperature drainage in winter, and the area from blue to red represents the gradual change in temperature drainage in the middle of the Yangtze River. Because the drainage pipeline extends from the shore to the center of the river for a certain distance, a gap is presented in the first image of
Figure 5b to indicate the position of the drainage pipeline in the river. In the second to fourth images of
Figure 5b, due to the distance from the water outlet, the position of the drainage pipeline is not easily visible. Cold water drainage also caused varying degrees of groundwater temperature drop from the outlet to the center of the Yangtze River. However, the temperature drop attributed to cold water drainage was largely concentrated in the area within 460 m downstream of the outlet, with the maximum affected area width of approximately 150 m, which was narrower than the river channel. The water temperature decline outside this range was relatively limited. Similarly,
Supplementary Figure S2 describes the temperature changes under adverse working condition W2 during the winter season. Simulation analysis shows that under the W2 condition, the temperature drop caused by cold discharged water mainly concentrated within an area of 1500 m downstream from the water outlet, with a maximum width of about 100 m. The temperature drop in the water outside this area was relatively weak.
It should be noted that under working conditions W1 and W2, a small area upstream of the outlet was also affected by drainage from the outlet, which was mainly due to the low river water inflow during the winter dry season and the resultant backflow upstream of the outlet. In order to reflect the temperature changes of river water more clearly, this study selected a typical streamline starting from the water outlet and presented the specific temperature variations along the streamline under four different conditions, namely, S1, S2, W1, and W2, as shown in
Figure 6. It can be seen that although the warm or cold discharged water caused certain temperature changes near the water outlet, its impact rapidly decreased as the discharged water mixed with the river water. In other similar projects, mechanical disturbance devices or heating and cooling equipment can be added to the drainage outlet to ensure that the drainage temperature is as consistent as possible with the river temperature.
To compare the influence of backwater on the temperature of the river water under different working conditions,
Table 3 summarizes the isosurface area, wrapped volume, length, depth, and width of the affected area within various temperature difference ranges. The results indicate that the four parameters, namely, the isosurface area, volume, length, and width of the affected area, were significantly affected by the temperature difference. As the temperature difference increased from 0.1 °C to 1 °C, these parameters rapidly decreased, implying that the backwater’s influence on the river water temperature rapidly attenuated, and the actual impact scope was minimal. It should be noted that as the riverside riverbed was relatively high, the depth of the affected area was slightly correlated with the temperature difference, as the influence of warm water drainage on the temperature of the river water could range from the riverbed to the river surface. Overall, the impact of water withdrawal on the temperature distribution of the river water was relatively minimal.
Under working conditions S1, S2, and W1, the influence range remained within 700 m in the flow direction and 250 m in the width direction. This range was limited compared with the entire river body and met the relevant standards in China. Under working condition W2, although the influence range extended a long distance along the upstream direction, it mainly occurred in the coastal area, with minimal impact on the river’s main body. Additionally, it should be noted that during the winter dry season, backflow phenomena may occur on the shore, causing limited impacts on the water body upstream of the outlet in terms of scope and degree.
However, the construction of this project has not been completed yet. It is not possible to collect the actual water temperature of the drainage outlet for comparison with the simulation results. It is necessary to continue the research on this topic by collecting the drainage temperature data after the project is completed to validate the reliability and accuracy of the model. Furthermore, this study did not discuss the impact of warm drainage on aquatic ecology. It will systematically analyze the potential impact of drainage temperature on various aspects of aquatic ecosystems in future research.


 ,
, 

