Abstract
Extreme rainfall events cause immense damage in cities where drainage networks are nonexistent or deficient and thus unable to transport rainwater. Infrastructure adaptations can reduce flooding and help the population avoid the associated negative consequences. Consequently, it is imperative to develop suitable mathematical models rooted in a thorough understanding of the system. Additionally, the utilization of efficient computational search techniques is crucial when applying these methods to real-world problems. In this study, we propose a novel iterative search space reduction methodology coupled with a multiobjective algorithm (NSGA-II) for urban drainage network rehabilitation and flood mitigation. This approach considers the replacement of pipes and the installation of storm tanks (STs) in drainage networks. Additionally, NSGA-II is integrated with the Storm Water Management Model (SWMM) to achieve multiobjective optimization. To demonstrate the advantages of using this technique, two case study networks are presented. After three iterations, 90% of the decision variables are eliminated from the process in the E-Chicó case, and 76% are eliminated in the Ayurá case. The primary outcome of this study is that the proposed methodology yields reductions in rehabilitation costs and flood levels. Additionally, the application of NSGA-II to the reduced-dimension model of the network yields a superior Pareto front compared to that of the original network.
1. Introduction
The purpose of drainage networks is to remove rainwater, but adequately doing so has become difficult. Drainage networks are not prepared to face new challenges, such as climate change-induced intense rains and urbanization-induced modifications to the area and shape of hydrographic basins and to the nature and porosity of the soils [1,2]. Since these challenges are new, they have attracted much attention. Several studies related to climate change have been carried out; some have focused on the effects of climate change [3,4,5,6], while others have focused on adaptations to climate change [7,8,9,10,11]. Other studies related to the mechanisms and effects of urbanization have evaluated the effects of urbanization on runoff [3,12] and studied the infiltration capacity of soils and the corresponding effects on runoff [13,14,15,16]. Rapid urbanization affects hydrological processes by reducing the infiltration capacity of soils, which causes an increase in runoff. Therefore, urbanized areas are vulnerable to extreme rainfall events [13,17]. When extreme rainfall events occur in urbanized areas, floods often occur [18].
To mitigate flooding, several authors have proposed the implementation of low-impact development (LID) techniques, the replacement of pipes, and the installation of storm tanks (STs). For example, Ebrahimi et al. [19] used SWMM to study floods in the city center of Ardabil. They evaluated the efficiency of four LID techniques (rain barriers, green roofs, porous asphalt, and infiltration trenches) for reducing flooding in mountainous areas. Their results showed that rain barriers were difficult to install and that the subsequent runoff reduction rate was low; infiltration trenches, however, were recommended due to their ability to be installed everywhere, even in small spaces. Olivares-Cerpa et al. [20] proposed the implementation of permeable pavements in bicycle lanes in the city of Barcelona as a measure to reduce surface runoff in a climate change scenario. Their results showed that proper implementation of permeable pavements reduced the flow of surface runoff by between 44 and 92%. Numerous studies focusing on green infrastructure implementation to mitigate the impacts of flooding have been conducted [21,22,23,24,25,26]. However, it is essential to recognize that although Low Impact Development (LID) systems can effectively manage stormwater, their efficacy could be constrained during heavy rainfall events. Moreover, in regions with constrained resources, the adequate implementation and maintenance of LID systems pose notable challenges due to associated costs and a deficit of specialized technical expertise. Hence, while LID systems present substantial environmental advantages, their economic feasibility and sustainability in the long term necessitate meticulous evaluation within the specific context of each country or region.
Enríquez et al. [27] defined storm tanks as structures designed for incorporation into drainage networks to retain rainwater when intense precipitation exceeds the capacity of the drainage system so that flooding is prevented. They compared two methodologies to study the location of storm tanks in drainage networks in a climate change scenario. Ngamalieu et al. [28] proposed a methodology for the rehabilitation of urban drainage networks by combining pipe replacement and the installation of STs. The methodology was based on SWMM and a pseudo-genetic algorithm (PGA). They obtained better results when using a combination of pipe replacement and storm tank installation compared to when implementing either one separately.
All of those previous studies considered a single objective and a single solution. In the real world, there are various criteria used by decision-makers to choose the best solution for drainage network rehabilitation, such as budget availability, contaminant load elimination, risk level, and public regulation. Therefore, some studies considering multiobjective optimization in drainage network rehabilitation have been carried out. Instead of a single solution, a set of nondominated solutions is obtained and presented in Pareto form based on the objectives considered. Saniei et al. [29] proposed a methodology based on the combined use of SWMM and NSGA-II to optimally select and install four types of LID measures, namely, detention ponds, bioretention zones, swale systems, and permeable pavements, which were selected and installed in an urban basin. Their objective was to reduce flooding and the pollutant load. The results showed that permeable pavements are more effective at reducing flooding, while detention ponds are more efficient at reducing pollutant loads. Martínez et al. [30] proposed a multiobjective optimization methodology based on NSGA-II connected to SWMM to optimally select and install green infrastructure measures such as bioretention cells, infiltration trenches, porous pavement, and vegetation swales. They wanted to reduce urban runoff and improve water quality while reducing investment costs. The authors presented different Pareto fronts for flood volumes and pollutant loads plotted against investment costs. Zheng and Guan [31] proposed a methodology based on a multiobjective evolutionary algorithm for rainwater management; this methodology considers both quality and cost minimization for three types of LID techniques. Later, Ngamalieu-Nengoue et al. [32] proposed a multiobjective methodology for the rehabilitation of urban drainage networks that combines the replacement of pipes and the installation of storm tanks. The methodology was based on SWMM and NSGA-II. Instead of a single solution, a set of nondominated solutions represented via Pareto fronts was obtained. The majority of studies considering multiobjective optimization have adopted the combination of SWMM and NSGA-II.
However, optimizing drainage network rehabilitation is currently a challenge worldwide. The search space for finding optimal solutions is extensive and requires considerable exploration time. New challenges in the field of water engineering include reductions in calculation time and the procurement of more effective results. A reduction in the search space can improve the navigability of optimization algorithms. Optimizing rehabilitation is essential for minimizing investments in countries with limited economic means.
Maier et al. [33] highlighted reductions in the search space and calculation time as relevant challenges in water resource management. A few years later, Mala-Jetmarova et al. [34] published a review study that highlighted problems related to the design of water distribution network systems. According to these authors, the key points that should be considered in the future are strengthening existing systems, the expansion and rehabilitation of systems, and uncertainty and performance analyses. Ngamalieu et al. [28] presented an initial methodology based on SWMM and the PGA to reduce the search space, and pipe replacement and storm tank installation were considered for drainage network rehabilitation. Subsequently, Sophocleous et al. [35] proposed a methodology to reduce the search space by locating water leaks in a real distribution network. Soon after, Ngamalieu-Nengoue et al. [18] used SWMM and the PGA to improve upon the approaches in previous studies, such as the one in [28] and presented a global and structured methodology to reduce the search space for the optimal rehabilitation of drainage networks considering pipe replacement and ST installation. The results of this methodology surpassed those obtained in previous works. Then, Ngamalieu-Nengoue et al. [36] proposed an optimal drainage network rehabilitation methodology based on a multiobjective approach that combines pipe replacement and storm tank installation. In this methodology, search space reduction (SSR) was initially performed using SWMM and the PGA.
The present research provides a state-of-the-art approach for reducing the search space for the optimal rehabilitation of drainage networks, and an iterative reduction search space methodology coupled with multiobjective optimization with NSGA-II is established. The multiobjective approach adopted in this article is needed to address the challenges associated with optimizing complex systems, particularly in the context of drainage network rehabilitation. Unlike the majority of previous studies, which have predominantly focused on single-objective analysis, the simultaneous consideration of multiple objectives allows for a more comprehensive and balanced evaluation of solutions, accounting for the interdependencies and inherent trade-offs in real-world situations. This innovative approach not only enhances the understanding of the studied systems but also provides more robust and sustainable solutions, underscoring the relevance and significant contribution of our article to the advancement of the optimization field. The remainder of this paper is organized as follows: The remainder of this paper is organized as follows: In Section 2, the proposed methodology is described. This includes discussing the problem statement and formulation of the iSSR model. Section 3 initially applies the iSSR to two case studies, followed by solving the reduced problem using multiobjective optimization. In Section 4, results and discussion are presented. Initially, we highlight the outcomes obtained by the iSSR methodology, illustrating the reduction in the number of decision variables and corresponding changes in problem size. Subsequently, an overview of the nodes selected for pre-existing STs and the pipes identified for potential replacement in the iSSR process across both case studies is provided. Finally, the conclusions of the research can be found in Section 5.
2. Methodology
The primary aim of this study is to introduce an iterative search space reduction (iSSR) method integrated with a multiobjective optimization approach for the optimal rehabilitation of urban drainage networks. This methodology builds on and improves upon the SSR technique proposed by Ngamalieu-Nengoue et al. [18], which involves a single reduction in the search space, requires a large population size, and results in a long computational time to obtain reasonable results. Essentially, this new approach seeks to diminish the number of decision variables and reduce the computational time and effort compared to those in prior studies. In this research, rehabilitation is conducted incrementally, with the search space progressively reduced at each iteration while preserving solution quality.
The fundamental concept is to systematically narrow the search space by reducing the number of decision variables and the level of detail while maintaining the high quality of the results. The reduced problem after the iSSR process is solved with multiobjective optimization, and Pareto fronts are obtained.
This methodology considers both pipe replacement and storm tank installation and relies on SWMM [37] and the PGA [38] for iSSR on one side and SWMM and NGSA-II [39] for multiobjective optimization on the other. A flow chart of the iterative search space reduction approach coupled with the multiobjective optimization methodology is presented in Figure 1.

Figure 1.
Flowchart of iSSR coupled with a multiobjective optimization methodology (NSGA-II).
2.1. Problem Statement
When drainage networks cannot provide appropriate functions in the context of urbanization and climate change, flood scenarios are likely to occur. Floods are deemed intolerable in every nation globally, given the significant economic, social, and environmental ramifications they entail. While humanity lacks the capacity to directly influence the intensity of rainfall, it possesses the capability to manipulate soil infiltration rates through the augmentation of network capacity, the implementation of impermeable surfaces such as pavements, and the establishment of storage infrastructure such as ponds, infiltration trenches, or storm tanks. In this study, a rehabilitation approach is adopted, involving the substitution of pipes with larger diameters and the incorporation of storm tanks to augment the drainage network capacity. The objective of this process is to minimize the overall investment required for rehabilitation endeavors. Thus, an objective function that represents the cost of rehabilitation of the drainage network is optimized. The objective function is composed of three cost subfunctions, as presented in Equation (1):
In this equation, CD(Di) represents the cost of replacing the pipes in euros per meter, Li is the length of each pipe replaced, CV(Vi) is the cost of installing the STs, Cy(yi) is the cost of flood damage, m is the number of pipes in the network, and n is the number of nodes in the network.
Equation (2) expresses the replacement cost of the pipes. This equation is based on the current data provided by manufacturers, is expressed in euros per meter for pipe replacement, and depends on the pipe diameter. Equation (2) is presented in the form of a second-degree polynomial, where α and β are adjustment coefficients selected and used for the proposed project because they provide the best correspondence with the second-degree polynomial curve.
The installation of STs increases the storage capacity of a network and the holding time of water. The cost of installing an ST is based on the volume of water it should hold to prevent flooding. Its main function is to retain excess water that cannot matriculate normally through the drainage network during heavy rain events. The cost of installing a storm tank is defined in Equation (3). In this equation, the first term Sfix is fixed and represents the basic cost of a node without any modification, and the second term is variable and depends on the volume of the ST to be installed. It represents the cost of the supplementary volume stored at the new node. Svar is an adjustment coefficient, and n is an exponent. Therefore, the base area of the ST is divided into N sections. If at the end of a simulation a genome is equal to 0, the volume of the node does not need to be modified.
Equation (4) represents the cost of flood damage. A flood is defined based on the maximum height reached by the water in the flooded area. The damage function is expressed as a function of height and flood level, as detailed in a previous study [18]. It is presented in Equation (4).
In this equation, Ω represents the maximum cost per square meter when the maximum flood level ymax is reached. The level at which the maximum economic damage occurs is denoted by ymax, where y represents the flooding level at a specific node and ɛ and ν are the adjustment coefficients of the curve. The adjustment coefficients were obtained after a sensitivity analysis of floods in different areas of the city of Bogota, Columbia.
2.2. Iterative Search Space Reduction (iSSR)
To optimally rehabilitate drainage networks, an exploration of adequate and satisfactory solutions in a wide search space is needed. The hydraulic analysis model employed in this study is based on the dynamic wave model, requiring an extended analysis duration characterized by small calculation intervals. Consequently, this results in an elongation of the simulation period, a substantial computational workload, and an extensive computation timeframe for the rehabilitation of drainage networks. In this work, an iterative methodology for reducing the search space is proposed, as illustrated in Figure 2. The methodology facilitates a step-by-step optimization of the drainage network, with the primary aim of reducing computational time. By employing a reduced population size, it is evident that this approach can achieve a greater level of efficiency than the previously proposed methods.
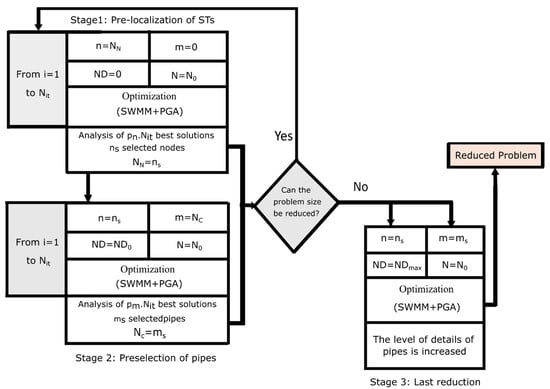
Figure 2.
Iterative search space reduction flowchart.
In the first stage, the number of nodes is reduced. Nit simulations are performed with n = NN nodes in the network and m = 0 pipes. The configuration in this phase is as follows: ND = 0 for the candidate diameter and N = N0 divisions in the base area of the ST. The solutions obtained after the Nit simulations are ranked according to the results of the objective function. The percentage Pn is defined and applied to the Nit simulations to select only some of the best solutions. The best solutions are analyzed, and ns are selected to create the new reduced problem.
In the second stage, the number of pipes is reduced. Nit simulations were performed with n = ns nodes in the network. The configuration at this stage is as follows: ND = ND0 candidate diameters and N = N0 divisions in the base area of the ST. The solutions obtained after the N simulations are ranked according to the result of the objective function. A percentage Pm is applied to the Nit simulations to select only some of the best solutions. The best solutions are analyzed, and ms pipes and ns nodes are selected to form the new reduced problem. The first and second stages are repeated until the size of the problem cannot be further reduced. More details about the specific stages 1 and 2 can be found in reference [18].
The third stage of the methodology is the last reduction step. Nit1 simulations are performed with n = ns nodes in the network and m= ms pipes. The configuration at this stage is as follows: ND = NDmax candidate diameters and N = N0 divisions of the base area of the ST. At this stage of the methodology, the full range of diameters is used to further reduce the number of decision variables and the size of the problem. The obtained solutions are ranked in terms of the objective function value. The best solution is examined, and ns nodes and ms pipes are selected to form the reduced problem. The reduced problem is solved with NSGA-II, which yields Pareto fronts as the final optimal outcome.
2.3. Multiobjective Optimization Algorithm: NSGA-II
The investment cost and flood damage cost functions are the two conflicting objective functions that should be minimized. The two objective functions are linked such that the flood damage cost is reduced if more investment is made, and vice versa.
The investment cost (F1) function accounts for both pipe substitution costs and storm tank installation costs, as expressed in Equation (5). The flood damage cost (F2) function is given in Equation (6). Both functions express hydraulic values in monetary units and have been defined previously.
The choice to incorporate NSGA-II [39] into this research is justified by its proven effectiveness in solving multiobjective optimization problems, especially considering the inherent complexity of urban drainage network rehabilitation. The NSGA-II method uses a fast, nondominated sorting approach to rank solutions through an implicit elitist selection method based on the Pareto dominance and crowding distance concepts. In this work, an additional elitist aspect is added. The best individual for every generation and every objective is selected for the next generation. This allows the zero-flooding individual at the end of the optimization process to be included in the Pareto front.
3. Case Studies
Two drainage networks were selected to test the application of the methodology and to analyze the behavior of the selected multiobjective algorithm. Notably, the E-Chicó and Ayurá networks were tested in previous works. Consequently, many solutions are available in the literature, which allows the results to be compared and the conclusions to be extended to networks with a search space of the same order of magnitude. A brief description of each case study is provided below. Additionally, SWMM files (.inp) and designed rainfalls (IDF curves) are provided in the Supplementary Material.
3.1. Details of the Case Studies and Initial Conditions
The E-Chicó drainage network [18] is part of the drainage network of the city of Bogota. The network is depicted in Figure 3 and comprises 35 watersheds that cover a total of 51 hectares. The network has 35 circular pipes with diameters that vary between 0.3 m and 1.4 m. The total length of the network is 5 km. The difference in height between the highest point and the lowest point of the network is 39.28 m. The network is entirely gravity-fed.
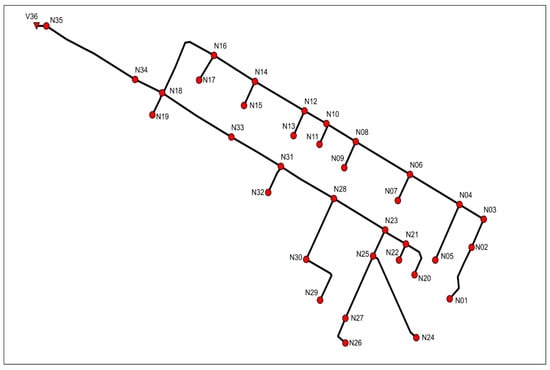
Figure 3.
E-Chicó drainage network representation.
An IDF curve with a return period of 10 years and a duration of 55 min, obtained by applying a climate change scenario based on the CMIP3 and CMIP5 global climate models, was used to generate a rain event based on alternating blocks with intervals of 5 min. This rain event was used in all analyses and evaluations. The maximum intensity recorded was 118 mm/h for a duration of 10 min. The analysis of the application of rain to the E-Chicó network revealed that 11 nodes in the network were flooded. The total volume of the flood reached 3833 m3, which represents 18% of the total runoff of 21,233 m3. The total cost of damage in this study area was approximately €5,240,000, which indicates the urgency of rehabilitating the network and applying the proposed methodology.
On the other hand, the Ayurá district serves as a catchment area within the drainage network of Medellin in Colombia. The Ayurá network’s outfall is linked to the Medellin River, which courses through the city from south to north. A total of 83 hydrological subcatchments with 73 nodes and 86 circular conduits ranging from 200 mm to 1050 mm in diameter were identified, and the network spanned 22.5 hectares. The elevation drop from the highest to the lowest point in the network is 15.61 m. The terrain profile is conducive to rainwater drainage, with an entirely gravity-fed network. Ayurá was chosen for this study due to the corresponding mesh network structure and the significant number of decision variables. Figure 4 provides an illustration of the Ayurá network.
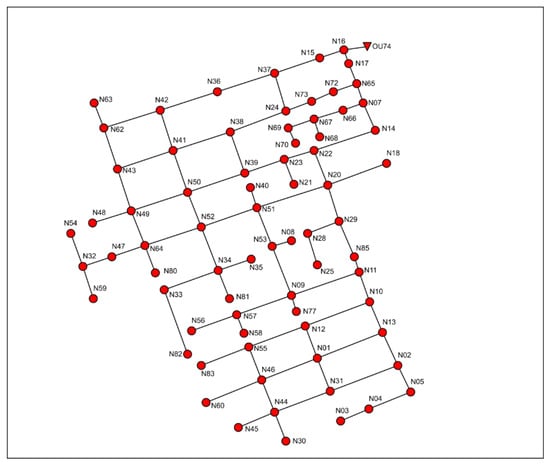
Figure 4.
Ayurá drainage network representation.
An IDF curve with a return period of 10 years was derived through the application of the Pulgarin equation [1] to determine event intensity for short durations, utilizing the available daily precipitation data for Colombia. The IDF curve, incorporating the effects of climate change on rainfall, was used to generate a rain event with alternating blocks at 5 min intervals. The initial hydraulic analysis in SWMM revealed a total flood volume of approximately 4271 m3 within the network, representing 27.14% of the generated runoff (15,735 m3) for the selected rainfall event. In summary, the preliminary network analysis indicated a suboptimal drainage capacity for the studied rainfall event. Consequently, the Ayurá drainage network was considered suitable for the application of the proposed rehabilitation methodology in this study.
3.2. Application of iSSR
To apply the iSSR approach in case studies, it is essential to establish the numerical values of the constants of the problem. Table 1 shows the numerical values of the adjustment coefficients for the cost functions [18]. These coefficients are necessary for implementing the different cost functions and solving the objective function of the problem. These steps were the same for both case studies.

Table 1.
Numerical values of the constants in the cost functions.
According to the step-by-step methodology presented in Section 2.2, it is necessary to define, at every stage, the number of simulations (Nit) and the number of divisions (N). In the first stage of the methodology, which involves a reduction in the number of nodes, the values considered were Nit = 10 simulations and N = N0 = 10 divisions for both study cases. In the second stage, which involves the reduction of pipes, the same steps were repeated for the number of simulations (Nit = 10) and the number of divisions (N = N0 = 10). In this stage, the number of candidate diameters (ND) was also needed, where ND0 is the reduced range and NDmax is the full range. ND = ND0 = 10 candidate diameters were considered in this stage. Table 2 shows the reduced range of candidate diameters used in the second part of the methodology.

Table 2.
Reduced range of candidate diameters.
Note that only nine candidate diameters are presented; the tenth value, 0, indicates that no action should be taken or that the pipe should not be modified after the simulation. The reduced range of candidate diameters is obtained after considering the full range of candidate diameters.
The third stage of the methodology is the final reduction step. The number of simulations Nit1, the number of divisions N, and the number of candidate diameters ND are needed. The specific values used were Nit1 = 10, N = N0 = 10 divisions, and ND = NDmax = 25. Table 3 includes the full range of candidate diameters used in this stage and in multiobjective optimization.

Table 3.
Full range of candidate diameters.
The table above shows 24 candidate diameters, with the 25th value being 0, which indicates that no action should be taken or that the pipe should not be modified after the simulation. From the calibration result, simulations were carried out to assess the iterative reduction methodology in the search space.
Ultimately, concerning PGA optimization, utilizing iSSR for case studies requires defining genetic parameters for the proper execution of each simulation at every stage. Table 4 outlines all the genetic parameters utilized for the pre-location of STs and preselection of pipes at each iteration, as well as those employed for the final reduction in the E-Chicó network. Table 5 provides the algorithm configuration for Ayurá.

Table 4.
Numerical values of genetic parameters used in iSSR for the E-Chicó network.

Table 5.
Numerical values of genetic parameters used in iSSR analysis for the Ayurá network.
On the one hand, the initial columns in both Table 4 and Table 5 illustrate the diminished size of the problem after each stage and iteration. Specifically, the iSSR technique implemented in the E-Chicó case enabled the transition from the original problem size of 35T35C to a reduced problem size of 3T3C after three iterations and the final reduction step. Similarly, for the Ayurá case, the reduction in the solution space was from 73T86C to 8T30C.
On the other hand, it is evident that the definition of the population is contingent on the size of the problem. A larger problem size necessitates a larger population, while a smaller problem size warrants a reduced population. Determination of the population size is critical for preventing premature convergence; however, the algorithm must not run indefinitely. Therefore, in this instance, the number of generations without any change in the objective function value is specified as Ngen = 20 generations.
Finally, the crossover rate remains consistent at 80% for all the scenarios in both case studies. The mutation rate is inversely proportional to the size of the problem. Given the proven effectiveness of SSR methods in prior studies, conducting an extensive number of simulations is unnecessary. Therefore, for both case studies, Nit = 10 simulations per scenario is deemed sufficient to achieve a satisfactory reduction in the problem size. The percentages Pn and Pm, which represent the proportions of the best solutions based on the objective function results, were set to 30%.
3.3. Application of Multiobjective Optimization
Based on multiobjective optimization with the reduced network resulting from iSSR in the E-Chicó case, calibration was conducted with N = Nmax = 40 divisions and ND = NDmax = 25 candidate diameters. The adjustment coefficients from Table 1 were utilized for the multiobjective optimization of the reduced network. Parameters such as a population size of Npop = 20 individuals, a crossover rate of 80%, a mutation rate of 16.7%, and a predetermined number of generations of Ngen = 1000 were chosen based on the 3T3C scenario and the reduced network. The required population size in optimization problems is influenced by the number of decision variables, and for scenarios with a limited number of variables, a small population size is sufficient while still maintaining diversity.
Similarly, for the application of multiobjective optimization to the reduced network obtained in the Ayurá case, calibration was performed with N = Nmax = 40 divisions and ND = NDmax = 25 candidate diameters, utilizing the adjustment coefficients from Table 1. The selected parameters, such as a population size of Npop = 100 individuals, a crossover rate of 80%, a mutation rate of 2.7%, and a fixed number of generations at Ngen = 1000, were based on the 8T30C scenario and the reduced network.
The fourth section provides a comparison of the performance of the multiobjective algorithm in two contexts: one with the full search space and the other with the reduced space achieved through iSSR.
4. Results and Discussion
This section includes two subsections. First, in Section 4.1, we highlight the outcomes obtained by the iSSR methodology, illustrating the reduction in the number of decision variables and corresponding changes in problem size. Subsequently, we provide an overview of the nodes selected for pre-existing STs and the pipes identified for potential replacement in the iSSR process across both case studies. Once the original networks are reduced through iSSR, a multiobjective optimization of the reduced networks is performed with NSGA-II. Section 4.2 presents the results, and the Pareto fronts derived from diverse search space approaches in the two case studies are analyzed.
4.1. Iterative Search Space Reduction
It is crucial to emphasize that the core concept of the proposed methodology is to streamline the optimization algorithm by decreasing the number of decision variables. Table 6 outlines the evolution of the number of decision variables and the corresponding changes in the problem size following each iteration for both case studies.

Table 6.
E-Chicó optimization results using the iterative search space reduction methodology.
In the case of the E-Chicó network, the number of decision variables was reduced from 70 to 7, with the preselected nodes for ST placement and the preselected pipes for potential changes in pipe diameter identified. For the Ayurá network, the original problem was reduced from 159 decision variables to 38. These outcomes signify noteworthy reductions in decision variables of 90% and 76.1%, respectively.
By reducing the number of decision variables, the search space of the algorithm is considerably reduced, increasing its efficiency in finding more and better solutions. In this regard, the importance of the last reduction step becomes evident. In this part of the methodology, the size of the problem is decreased from 1.4·1034 to 1·1031 for the E-Chicó network and from 9.3·1083 to 1·1073 for the Ayurá network. The findings highlight a correlation between network size and the magnitude of the SSR in this concluding phase of the iSSR method. In addressing real-world challenges, it is imperative to recognize the presence of numerous local minima to which solutions may converge.
The final reduction step in the optimization algorithm is instrumental in facilitating the escape from such local minima, thereby enhancing the solution. Moreover, a reduction in the number of decision variables plays a pivotal role in enabling the optimization algorithm to utilize smaller population sizes or less stringent stopping criteria (number of generations without change). This also increases the speed of the algorithm.
The scenario resulting from the final reduction step represents the reduced problem set used in multiobjective optimization with NSGA-II. The application of the iSSR methodology facilitates a transition from the complete search space (35T35C for E-Chicó and 73T86C for Ayurá) to the reduced search space (3T3C for E-Chicó and 8T30C for Ayurá).
Specifically, Figure 5 and Figure 6 depict the nodes chosen for prelocated STs and the pipes selected for potential replacement during the iSSR process for the E-Chicó and Ayurá networks, respectively.
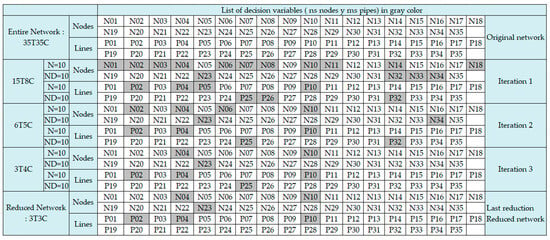
Figure 5.
List of nodes and pipes selected in the iterative search space reduction process for E-Chico.
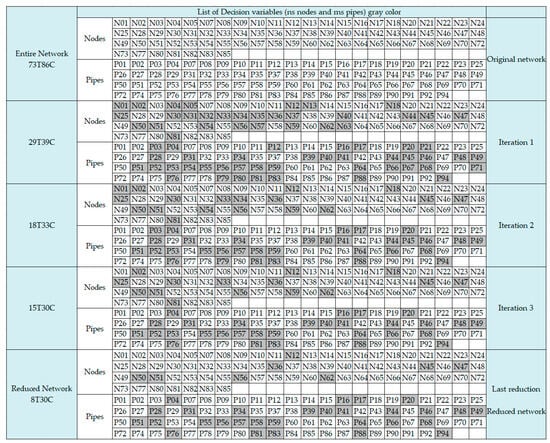
Figure 6.
List of nodes and pipes selected in the iterative search space reduction process for Ayurá.
4.2. Multiobjective Optimization: NSGA-II with the Reduced Network Obtained for E-Chicó
After the original networks are reduced with iSSR, multiobjective optimization of the reduced networks is performed with NSGA-II. The genetic parameters used in NSGA-II are presented in Table 7 and Table 8.

Table 7.
Genetic parameters for the application of NSGA-II on E-Chico.

Table 8.
Genetic parameters used in the application of NSGA-II to Ayurá.
In this section, we explore the Pareto fronts generated from different search space approaches for the two case studies. On the one hand, we examine the Pareto front derived from a reduced search space obtained through the application of the iSSR methodology. On the other hand, this result is compared with the Pareto front resulting from an exhaustive exploration of the complete search space. The aim of this study is to assess and discern the advantages and disadvantages of each approach in obtaining optimal solutions for multiobjective optimization problems. Both case studies are analyzed in detail.
To observe the impact of the iterative search space reduction, Figure 7 represents the Pareto fronts of the 2 scenarios for E-Chicó: the original network (35T35C) and the reduced network (3T3C). The focus is on exploring solutions under the assumption of an unlimited budget. This choice is justified by recognizing that the best rehabilitation solution depends on various parameters, such as budget, risk, and public regulations.
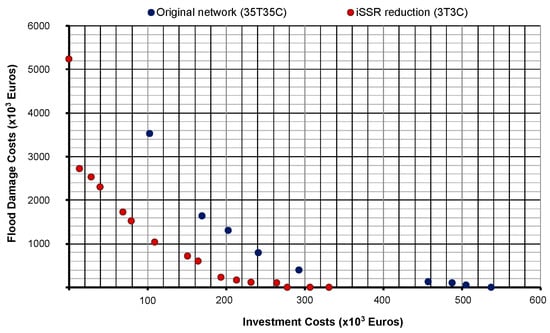
Figure 7.
Pareto front representation for two scenarios.
In the case of E-Chicó, Figure 7 illustrates a range of feasible solutions for optimal rehabilitation, considering different investment scenarios. Notably, the absence of budget constraints allows for solutions representing zero-flooding scenarios. In particular, the solution for zero flooding requires an investment of €517,559 for the original network (35T35C) and an investment of €330,801 for the reduced network (3T3C). The graph demonstrates that reducing the problem size, as exemplified by the reduced network (3T3C), leads to more favorable results. All points in the Pareto front of the reduced network lie to the left of those for the entire network, indicating proximity to the origin of the axis. This finding implies that the reduced network provides a Pareto front closer to the optimal solution.
The final solution for achieving zero flooding in the E-Chicó network is presented in Figure 8, detailing the locations at which storm tanks are to be installed and pipes to be substituted. The areas of the base of the storm tanks to be installed are specified as A (N04) = 1350 m2, A (N10) = 1950 m2, and A (N23) = 1950 m2. The diameters of the new pipes used to rehabilitate the network are D (P02) = 1.8 m, D (P04) = 0.3 m, and D (P10) = 0.3 m, as determined through the multiobjective optimization process.
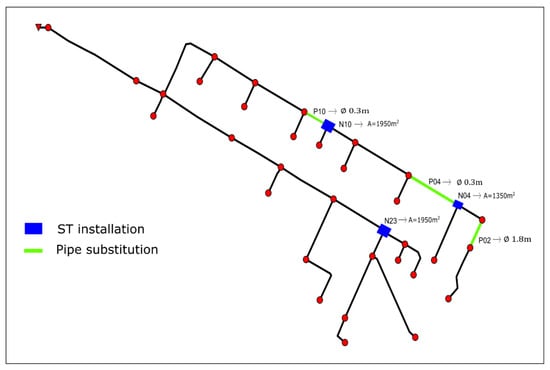
Figure 8.
Locations of storm tanks to be installed and pipes to be replaced according to the results of the multiobjective optimization of Scenario 2: 3T3C for zero flooding.
The analysis is extended to the rehabilitation of Ayurá, as presented in Figure 9. In this instance, three scenarios are considered: the original network (73T86C), a reduced network obtained after the application of SSR (29T39C) [24], and the reduced network after the application of iSSR (8T30C).
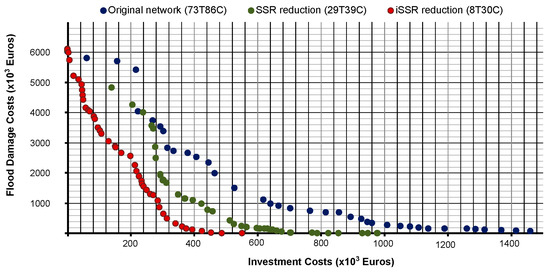
Figure 9.
Pareto front representation for the three scenarios.
The approach involves an unlimited budget, resulting in solutions for zero-flooding scenarios. Once again, the reduced networks obtained with SSR and iSSR demonstrate superior performance, with the Pareto front positioned to the left of the full-network Pareto front. Specifically, the solution for zero flooding requires an investment of €2,269,492 for the original network (73T86C), an investment of €1,183,541 for the reduced network obtained with SSR (29T39C), and an investment of €552,611 for the reduced network obtained with iSSR (8T30C). This finding further underscores the advantage of reducing the problem size to achieve better results.
Figure 10 provides an overview of the ST installation locations and the pipes to be substituted in the Ayurá network. Table 9 details the list of pipes to be replaced, along with their corresponding diameters. Furthermore, Table 10 specifies the nodes at which storm tanks should be installed, along with their corresponding base areas, contributing to the comprehensive solution for achieving zero flooding in the reduced network (8T30C).
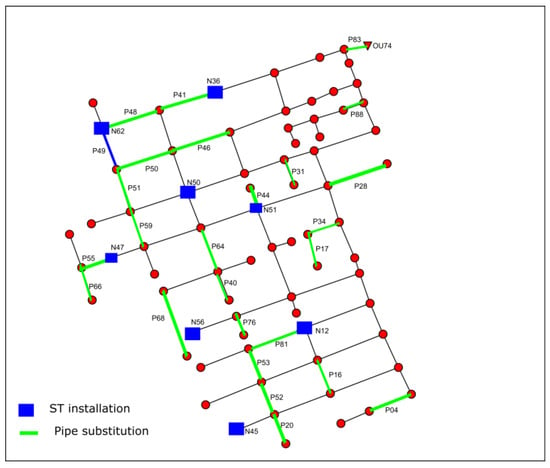
Figure 10.
Representation of storm tanks installed and pipes to replace for scenario 8T30C with a zero-flooding solution.

Table 9.
New pipe diameters based on the zero-flooding solution for scenario 8T30C.

Table 10.
New storm tank areas based on the zero-flooding solution for scenario 8T30C.
In conclusion, the analysis of the results suggests that a reduced network not only yields better solutions but does so with less computational effort. Figure 7 and Figure 9 highlight that the reduced network outperforms the entire network in terms of the optimization results, emphasizing the efficiency gained through search space reduction. The iterative reduction of the search space is specifically effective for providing superior outcomes, with enhanced exploration capacity for the optimization algorithm when the problem size is reduced. In summary, both cases emphasize the effectiveness of the iSSR approach. Similarly, reducing the problem size, especially through iterative approaches, contributes to obtaining more efficient and effective solutions.
5. Conclusions
Climate change has led to an increase in extreme rainfall events, a phenomenon exacerbated by urbanization, leading to heightened flood risks due to inadequate drainage networks. In the literature, several strategies have been proposed to address this issue, such as the replacement of pipes and the installation of storm tanks within networks. These measures aim to extend the retention time of networks, thereby mitigating the occurrence of flooding. Nevertheless, the optimization of rehabilitation strategies for drainage networks is a significant global challenge. The vast search space required to identify optimal solutions demands substantial exploration time. Contemporary challenges in water engineering underscore the need for reducing calculation times while obtaining optimal results.
The proposed methodology, centered around the iSSR technique, demonstrated efficacy in accelerating the optimization process by significantly reducing the number of decision variables in water distribution network rehabilitation. According to the results, the following conclusions can be drawn:
- Through successive iterations, the number of decision variables for the E-Chicó network decreased from 70 to 7, and that for the Ayurá network decreased from 159 to 38, representing reductions of 90% and 76.1%, respectively. These reductions critically contribute to the efficiency of the optimization algorithm, as evidenced by the substantial decrease in problem size from 2.3·10100 to 1·1031 for E-Chicó and from 7.8·10122 to 1·1073 for Ayurá.
- The final reduction step, a crucial component of the iSSR methodology, not only aids in escaping local minima but also enables the optimization algorithm to function with smaller populations and faster convergence rates.
- The Pareto fronts obtained for the reduced networks consistently outperform those from the exhaustive exploration of the complete search space, demonstrating the effectiveness of the iSSR approach.
- This study emphasizes the practical significance of reduced network solutions, particularly in zero-flooding scenarios. The obtained optimal solutions demonstrate superior performance in terms of both solution quality and computational efficiency. Notably, the reduced network solutions are superior to the entire network solutions, indicating the efficiency gained through search space reduction.
The conclusions drawn from this study have significant practical implications for addressing the challenges posed by extreme rainfall events and urbanization-related flood risks. By demonstrating the efficacy of the iSSR technique in accelerating the optimization process for water distribution network rehabilitation, this research highlights a promising approach to mitigate flooding occurrences. The substantial reductions in decision variables achieved through successive iterations of the iSSR methodology translate to improved computational efficiency and faster convergence rates, crucial factors in addressing contemporary challenges in water engineering. Furthermore, the superior performance of the reduced network solutions, particularly in zero-flooding scenarios, underscores their practical significance in achieving optimal solutions with enhanced computational efficiency. Overall, these findings contribute valuable insights for researchers and practitioners seeking efficient and robust optimization strategies for managing water infrastructure in the face of climate change and urbanization challenges.
Finally, future research directions could include exploring the application of alternative optimization algorithms and comparing the results obtained to further enhance the understanding of their efficacy in urban drainage network rehabilitation. Additionally, investigating the modification of conduit slopes could provide valuable insights into optimizing the hydraulic performance of the network. These potential research directions aim to broaden the scope of inquiry and contribute to the ongoing development of effective strategies for urban drainage network rehabilitation.
Supplementary Materials
The following supporting information can be downloaded from https://www.mdpi.com/article/10.3390/w16030458/s1: SM1. Presentation of designed rainfall for E-Chicó network; SM2. Presentation of designed rainfall for Ayurá network; SM3. E-Chicó network (SWMM file); SM4. Ayurá network (SWMM file).
Author Contributions
All authors contributed extensively to the work presented in this paper. Conceptualization, U.A.N.-N., P.L.I.-R. and F.J.M.-S.; data curation, U.A.N.-N. and D.M.-M.; formal analysis, U.A.N.-N., P.L.I.-R., F.J.M.-S. and D.M.-M.; funding acquisition D.M.-M.; investigation, U.A.N.-N., P.L.I.-R., F.J.M.-S. and D.M.-M.; methodology U.A.N.-N., P.L.I.-R. F.J.M.-S. and D.M.-M.; project administration P.L.I.-R., D.M.-M. and F.J.M.-S.; resources, U.A.N.-N., P.L.I.-R., F.J.M.-S. and D.M.-M.; software, U.A.N.-N., P.L.I.-R. and F.J.M.-S.; supervision, P.L.I.-R., F.J.M.-S. and D.M.-M.; validation, U.A.N.-N., P.L.I.-R., F.J.M.-S. and D.M.-M.; visualization, U.A.N.-N., P.L.I.-R., F.J.M.-S. and D.M.-M.; writing—original draft, U.A.N.-N. and D.M.-M.; writing—review and editing, P.L.I.-R., F.J.M.-S. and D.M.-M. All authors have read and agreed to the published version of the manuscript.
Funding
This research was funded by the Program Fondecyt Regular, grant number 1210410.
Data Availability Statement
Data is contained within the article or supplementary material.
Acknowledgments
This work was supported by the Program Fondecyt Regular (project 1210410) of the Agencia Nacional de Investigación y Desarrollo (ANID), Chile. It was also supported by the Ministry of Universities (Spain) and the Program European Union–Next Generation EU.
Conflicts of Interest
The authors declare no conflicts of interest.
References
- Saldarriaga, J.; Salcedo, C.; Solarte, L.; Pulgarin, L.; Rivera, M.L.; Camacho, M.; Iglesias-Rey, P.L.; Martinez-Solano, F.J.; Cunha, M. Reducing Flood Risk in Changing Environments: Optimal Location and Sizing of Stormwater Tanks Considering Climate Change. Water 2020, 12, 2491. [Google Scholar] [CrossRef]
- Baudhanwala, D.; Kantharia, V.; Patel, D.; Mehta, D.; Waikhom, S. Applicability of SWMM for urban flood forecasting a case study of the western zone of Surat City. Larhyss J. 2023, 54, 71–83. [Google Scholar]
- Hassan, B.T.; Yassine, M.; Amin, D. Comparison of Urbanization, Climate Change, and Drainage Design Impacts on Urban Flashfloods in an Arid Region: Case Study, New Cairo, Egypt. Water 2015, 14, 2430. [Google Scholar] [CrossRef]
- Zahmatkesh, Z.; Burian, S.J.; Karamouz, M.; Tavakol-Davani, H.; Goharian, E. Low-impact development practices to mitigate climate change effects on urban stormwater runoff: Case study of New York City. J. Irrig. Drain. Eng. 2015, 141, 04014043. [Google Scholar] [CrossRef]
- Doumounia, A.; Zeba, A.; Damiba, L.; Zougmore, F.; Nikiema, M. Climate variability analysis in the Nouhao Sub-Basin in eastern center of Burkina Faso. Larhyss J. 2020, 41, 57–69. (In French) [Google Scholar]
- Fiorillo, D.; De Paola, F.; Ascione, G.; Giugni, M. Drainage Systems Optimization Under Climate Change Scenarios. Water Resour. Manag. 2023, 37, 2465–2482. [Google Scholar] [CrossRef]
- Kirshen, P.; Caputo, L.; Vogel, R.M.; Mathisen, P.; Rosner, A.; Renaud, T. Adapting urban infrastructure to climate change: A drainage case study. J. Water Resour. Plan. Manag. 2015, 141, 04014064. [Google Scholar] [CrossRef]
- Quinn, A.D.; Ferranti, E.J.S.; Hodgkinson, S.P.; Jack, A.C.R.; Beckford, J.; Dora, J.M. Adaptation Becoming Business as Usual: A Framework for Climate-Change-Ready Transport. Infrastructures 2018, 3, 10. [Google Scholar] [CrossRef]
- Mertz, O.; Halshaes, K.; Olesen, J.E.; Rasmussen, K. Adaptation to climate change in developing countries. Environ. Manag. 2009, 43, 743–752. [Google Scholar] [CrossRef]
- Ayers, J.; Forsyth, T. Community-based adaptation to climate change. Environ. Sci. Pol. Sustain. Dev. 2009, 51, 22–31. [Google Scholar] [CrossRef]
- Berrang-Ford, L.; Ford, J.D.; Paterson, J. Are we adapting to climate change? Glob. Environ. Chang. 2011, 21, 25–33. [Google Scholar] [CrossRef]
- Hafnaoui, M.A.; Madi, M.; Ben Said, M.; Benmalek, A. Floods in El Bayadh City: Causes and factors. Larhyss J. 2022, 51, 97–113. [Google Scholar]
- Janicka, E.; Kanclerz, J. Assessing the Effects of Urbanization on Water Flow and Flood Events Using the HEC-HMS Model in the Wirynka River Catchment, Poland. Water 2023, 15, 86. [Google Scholar] [CrossRef]
- Diamond, J.; Shanley, T. Infiltration rate assessment of some major soils. Ir. Geogr. 2003, 36, 32–46. [Google Scholar] [CrossRef]
- Yimer, F.; Messing, I.; Ledin, S.; Abdelkadir, A. Effects of different land use types on infiltration capacity in a catchment in the highlands of Ethiopia. Soil Use Manag. 2008, 24, 344–349. [Google Scholar] [CrossRef]
- Sun, D.; Yang, H.; Guan, D.; Yang, M.; Wu, J.; Yuan, F.; Zhang, Y. The effects of land use change on soil infiltration capacity in China: A meta-analysis. Sci. Total Environ. 2018, 626, 1394–1401. [Google Scholar] [CrossRef] [PubMed]
- Song, X.; Qi, J.; Zou, X.; Zhang, J.; Liu, C. Potential Effects of Urbanization on Precipitation Extremes in the Pearl River Delta Region, China. Water 2022, 14, 2466. [Google Scholar] [CrossRef]
- Ngamalieu-Nengoue, U.A.; Iglesias-Rey, P.L.; Martínez-Solano, F.J.; Mora-Meliá, D.; Saldarriaga Valderrama, J.G. Urban Drainage Network Rehabilitation Considering Storm Tank Installation and Pipe Substitution. Water 2019, 11, 515. [Google Scholar] [CrossRef]
- Ebrahimi, F.; Feizi, A.; Talari, T.B. Investigation of the Potential Threat of Urban Flood at Mountainous Areas through Low Impact Development Techniques (Case Study: Ardabil City). J. Hydr. Struct. 2022, 8, 52–67. [Google Scholar]
- Olivares-Cerpa, G.; Russo, B.; Martínez-Puentes, M.; Bladé, E.; Sanz-Ramos, M. “SUDS-linear” to reduce flood risk considering Climate Change scenarios. Ing. Del Agua 2022, 26, 77–90. [Google Scholar] [CrossRef]
- Carson, T.B.; Marasco, D.E.; Culligan, P.J.; McGillis, W.R. Hydrological performance of extensive green roofs in New York City: Observations and multi-year modeling of three full-scale systems. Environ. Res. Lett. 2013, 8, 13. [Google Scholar]
- Schubert, J.E.; Burns, M.J.; Fletcher, T.D.; Sanders, B.F. A framework for the case-specific assessment of green infrastructure in mitigating urban flood hazards. Adv. Water Resour. 2017, 108, 55–68. [Google Scholar] [CrossRef]
- Zamani, M.G.; Saniei, K.; Nematollahi, B.; Zahmatkesh, Z.; Poor, M.M.; Nikoo, M.R. Developing sustainable strategies by LID optimization in response to annual climate change impacts. J. Clean. Prod. 2023, 416, 137931. [Google Scholar] [CrossRef]
- Weggemans, J.; Santos, M.L.; Ferreira, F.; Moreno, G.D.; Matos, J.S. Modeling the hydraulic performance of pilot green roofsusing the storm water management model: How important is calibration? Sustainability 2023, 15, 14421. [Google Scholar] [CrossRef]
- MacKinnon, M.; Pedersen Zari, M.; Brown, D.K.; Benavidez, R.; Jackson, B. Urban biomimicry for flood mitigation using an ecosystem service assessment tool in central Wellington, New Zealand. Biomimetics 2023, 8, 9. [Google Scholar] [CrossRef]
- Ou, J.; Li, J.; Li, X.; Zhang, J. Planning and design strategies for green stormwater infrastructure from an urban design perspective. Water 2024, 16, 29. [Google Scholar] [CrossRef]
- Enríquez, L.; Pulgarín, L.; Garzón, J.A.; Velásquez, D.; Saldarriaga, V.J.G. Comparison of storm tanks optimal location methodologies considering Climate Change. Case studies: Bogotá and Medellín, Colombia. Ing. Del Agua 2022, 26, 139–155. [Google Scholar] [CrossRef]
- Ngamalieu, U.; Iglesias-Rey, P.L.; Martínez-Solano, F.J.; Saldarriaga, V.J.G. Rehabilitation of Drainage Networks through the Combination of Retention Tanks and Replacement of Pipelines. SSRN Electron. J. 2017, 186, 617–625. [Google Scholar]
- Saniei, K.; Yazdi, J.; Majdzadehtabatabei, M.R. Optimal size, type and location of low impact developments (LIDs) for urban stormwater control. Urban Water J. 2021, 18, 585–597. [Google Scholar] [CrossRef]
- Martínez, C.; Sanchez, A.; Galindo, R.; Mulugeta, A.; Vojinovic, Z.; Galvis, A. Configuring Green Infrastructure for Urban Runoff and Pollutant Reduction Using an Optimal Number of Units. Water 2018, 10, 1528. [Google Scholar] [CrossRef]
- Zheng, K.; Guan, Y. Multiobjective Spatial Optimization Model of LID Based on Catchment Landuse Type. Water 2022, 14, 1944. [Google Scholar] [CrossRef]
- Ngamalieu-Nengoue, U.A.; Iglesias-Rey, P.L.; Martínez-Solano, F.J.; Mora-Meliá, D. Multi-Objective Optimization for Urban Drainage or Sewer Networks Rehabilitation through Pipes Substitution and Storage Tanks Installation. Water 2019, 11, 935. [Google Scholar] [CrossRef]
- Maier, H.R.; Kapelan, Z.; Kasprzyk, J.; Kollat, J.; Matott, L.S.; Cunha, M.C.; Ostfeld, A. Evolutionary algorithms and other metaheuristics in water resources: Current status, research challenges and future directions. Environ. Model. Soft. 2014, 62, 271–299. [Google Scholar] [CrossRef]
- Mala-Jetmarova, H.; Sultanova, N.; Savic, D. Lost in Optimisation of Water Distribution Systems? A Literature Review of System Design. Water 2018, 10, 307. [Google Scholar] [CrossRef]
- Sophocleous, S.; Savić, D.; Kapelan, Z. Leak Localization in a Real Water Distribution Network Based on Search-Space Reduction. J. Water Resour. Plan. Manag. 2019, 145, 04019024. [Google Scholar] [CrossRef]
- Ngamalieu-Nengoue, U.A.; Iglesias-Rey, P.L.; Martínez-Solano, F.J. Urban Drainage Networks Rehabilitation Using Multi-Objective Model and Search Space Reduction Methodology. Infrastructures 2019, 4, 35. [Google Scholar] [CrossRef]
- Rossman, L.A. Storm Water Management Model User’s Manual; U.S. Environmental Protection Agency: Cincinnati, OH, USA, 2015.
- Mora-Meliá, D.; Iglesias-Rey, P.L.; Martinez-Solano, F.J.; Ballesteros-Pérez, P. Efficiency of Evolutionary Algorithms in Water Network Pipe Sizing. Water Resour. Manag. 2015, 29, 4817–4831. [Google Scholar] [CrossRef]
- Deb, K.; Pratap, A.; Agarwal, S.; Meyarivan, T. A fast and elitist multiobjective genetic algorithm: NSGA-II. IEEE Trans. Evol. Comput. 2002, 6, 182–197. [Google Scholar] [CrossRef]
Disclaimer/Publisher’s Note: The statements, opinions and data contained in all publications are solely those of the individual author(s) and contributor(s) and not of MDPI and/or the editor(s). MDPI and/or the editor(s) disclaim responsibility for any injury to people or property resulting from any ideas, methods, instructions or products referred to in the content. |
© 2024 by the authors. Licensee MDPI, Basel, Switzerland. This article is an open access article distributed under the terms and conditions of the Creative Commons Attribution (CC BY) license (https://creativecommons.org/licenses/by/4.0/).