Mapping Water Bodies and Wetlands from Multispectral and SAR Data for the Cross-Border River Basins of the Polish–Ukrainian Border
Abstract
1. Introduction
2. Study Area
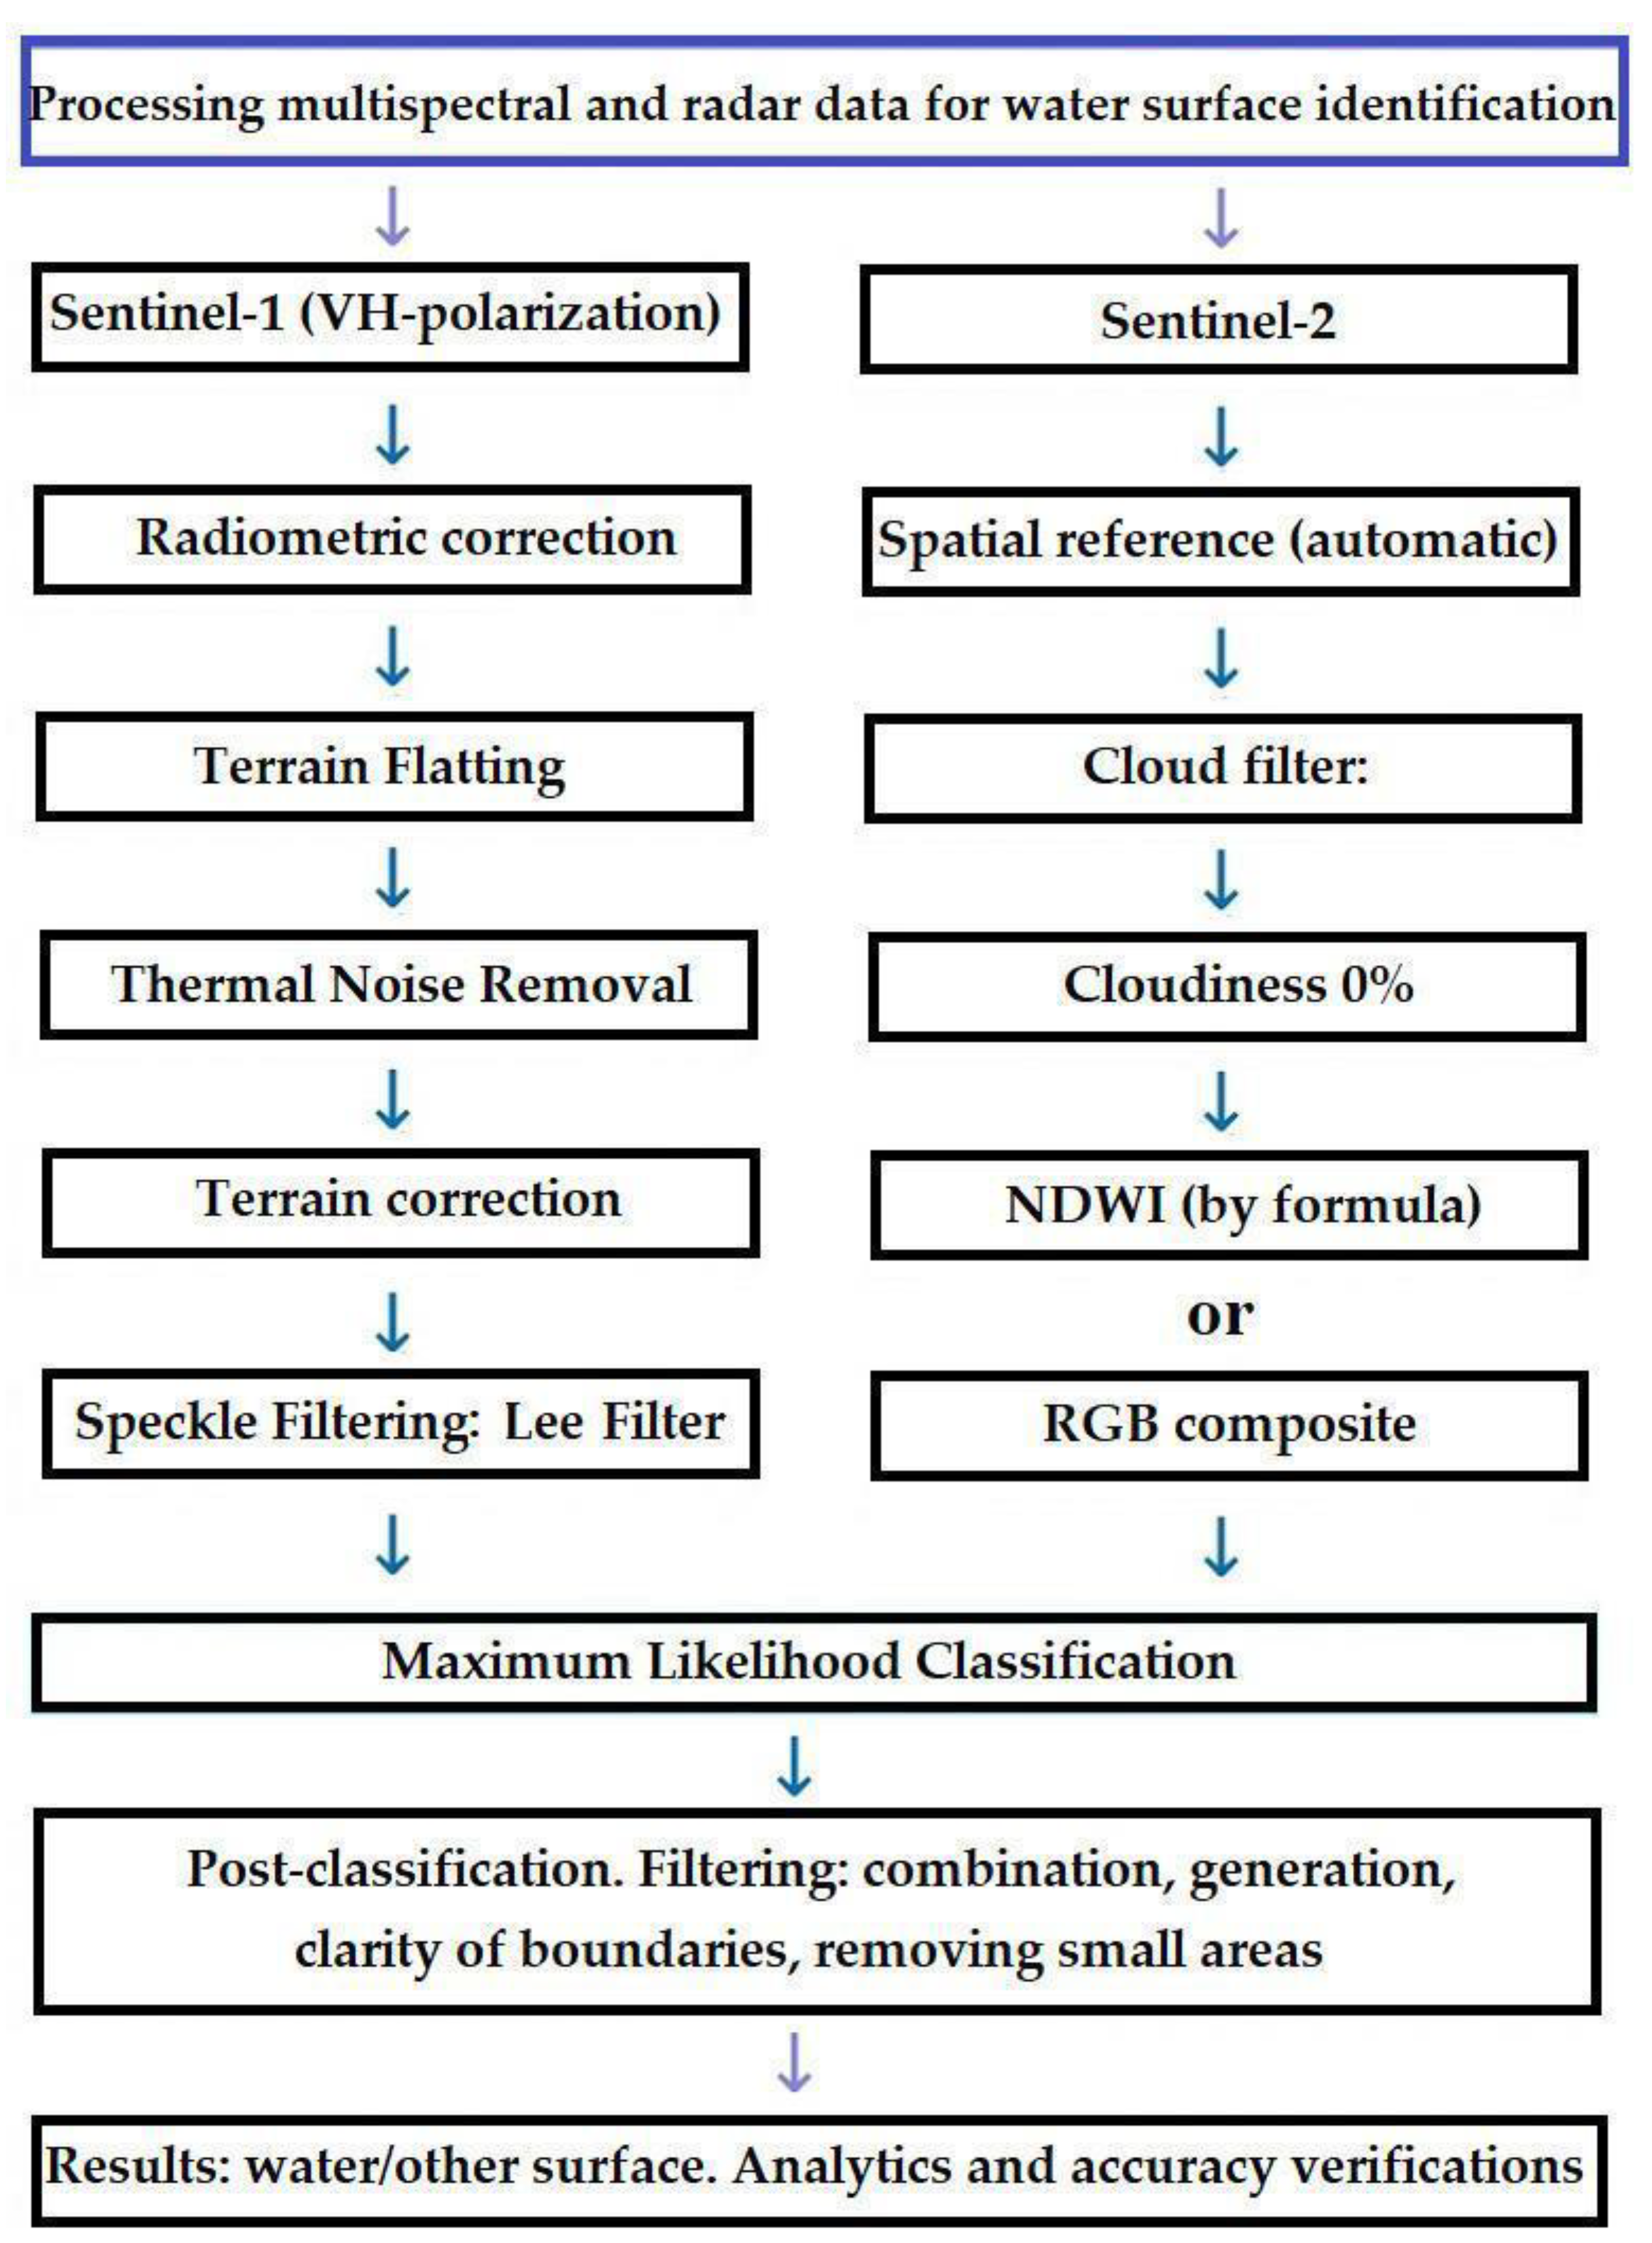
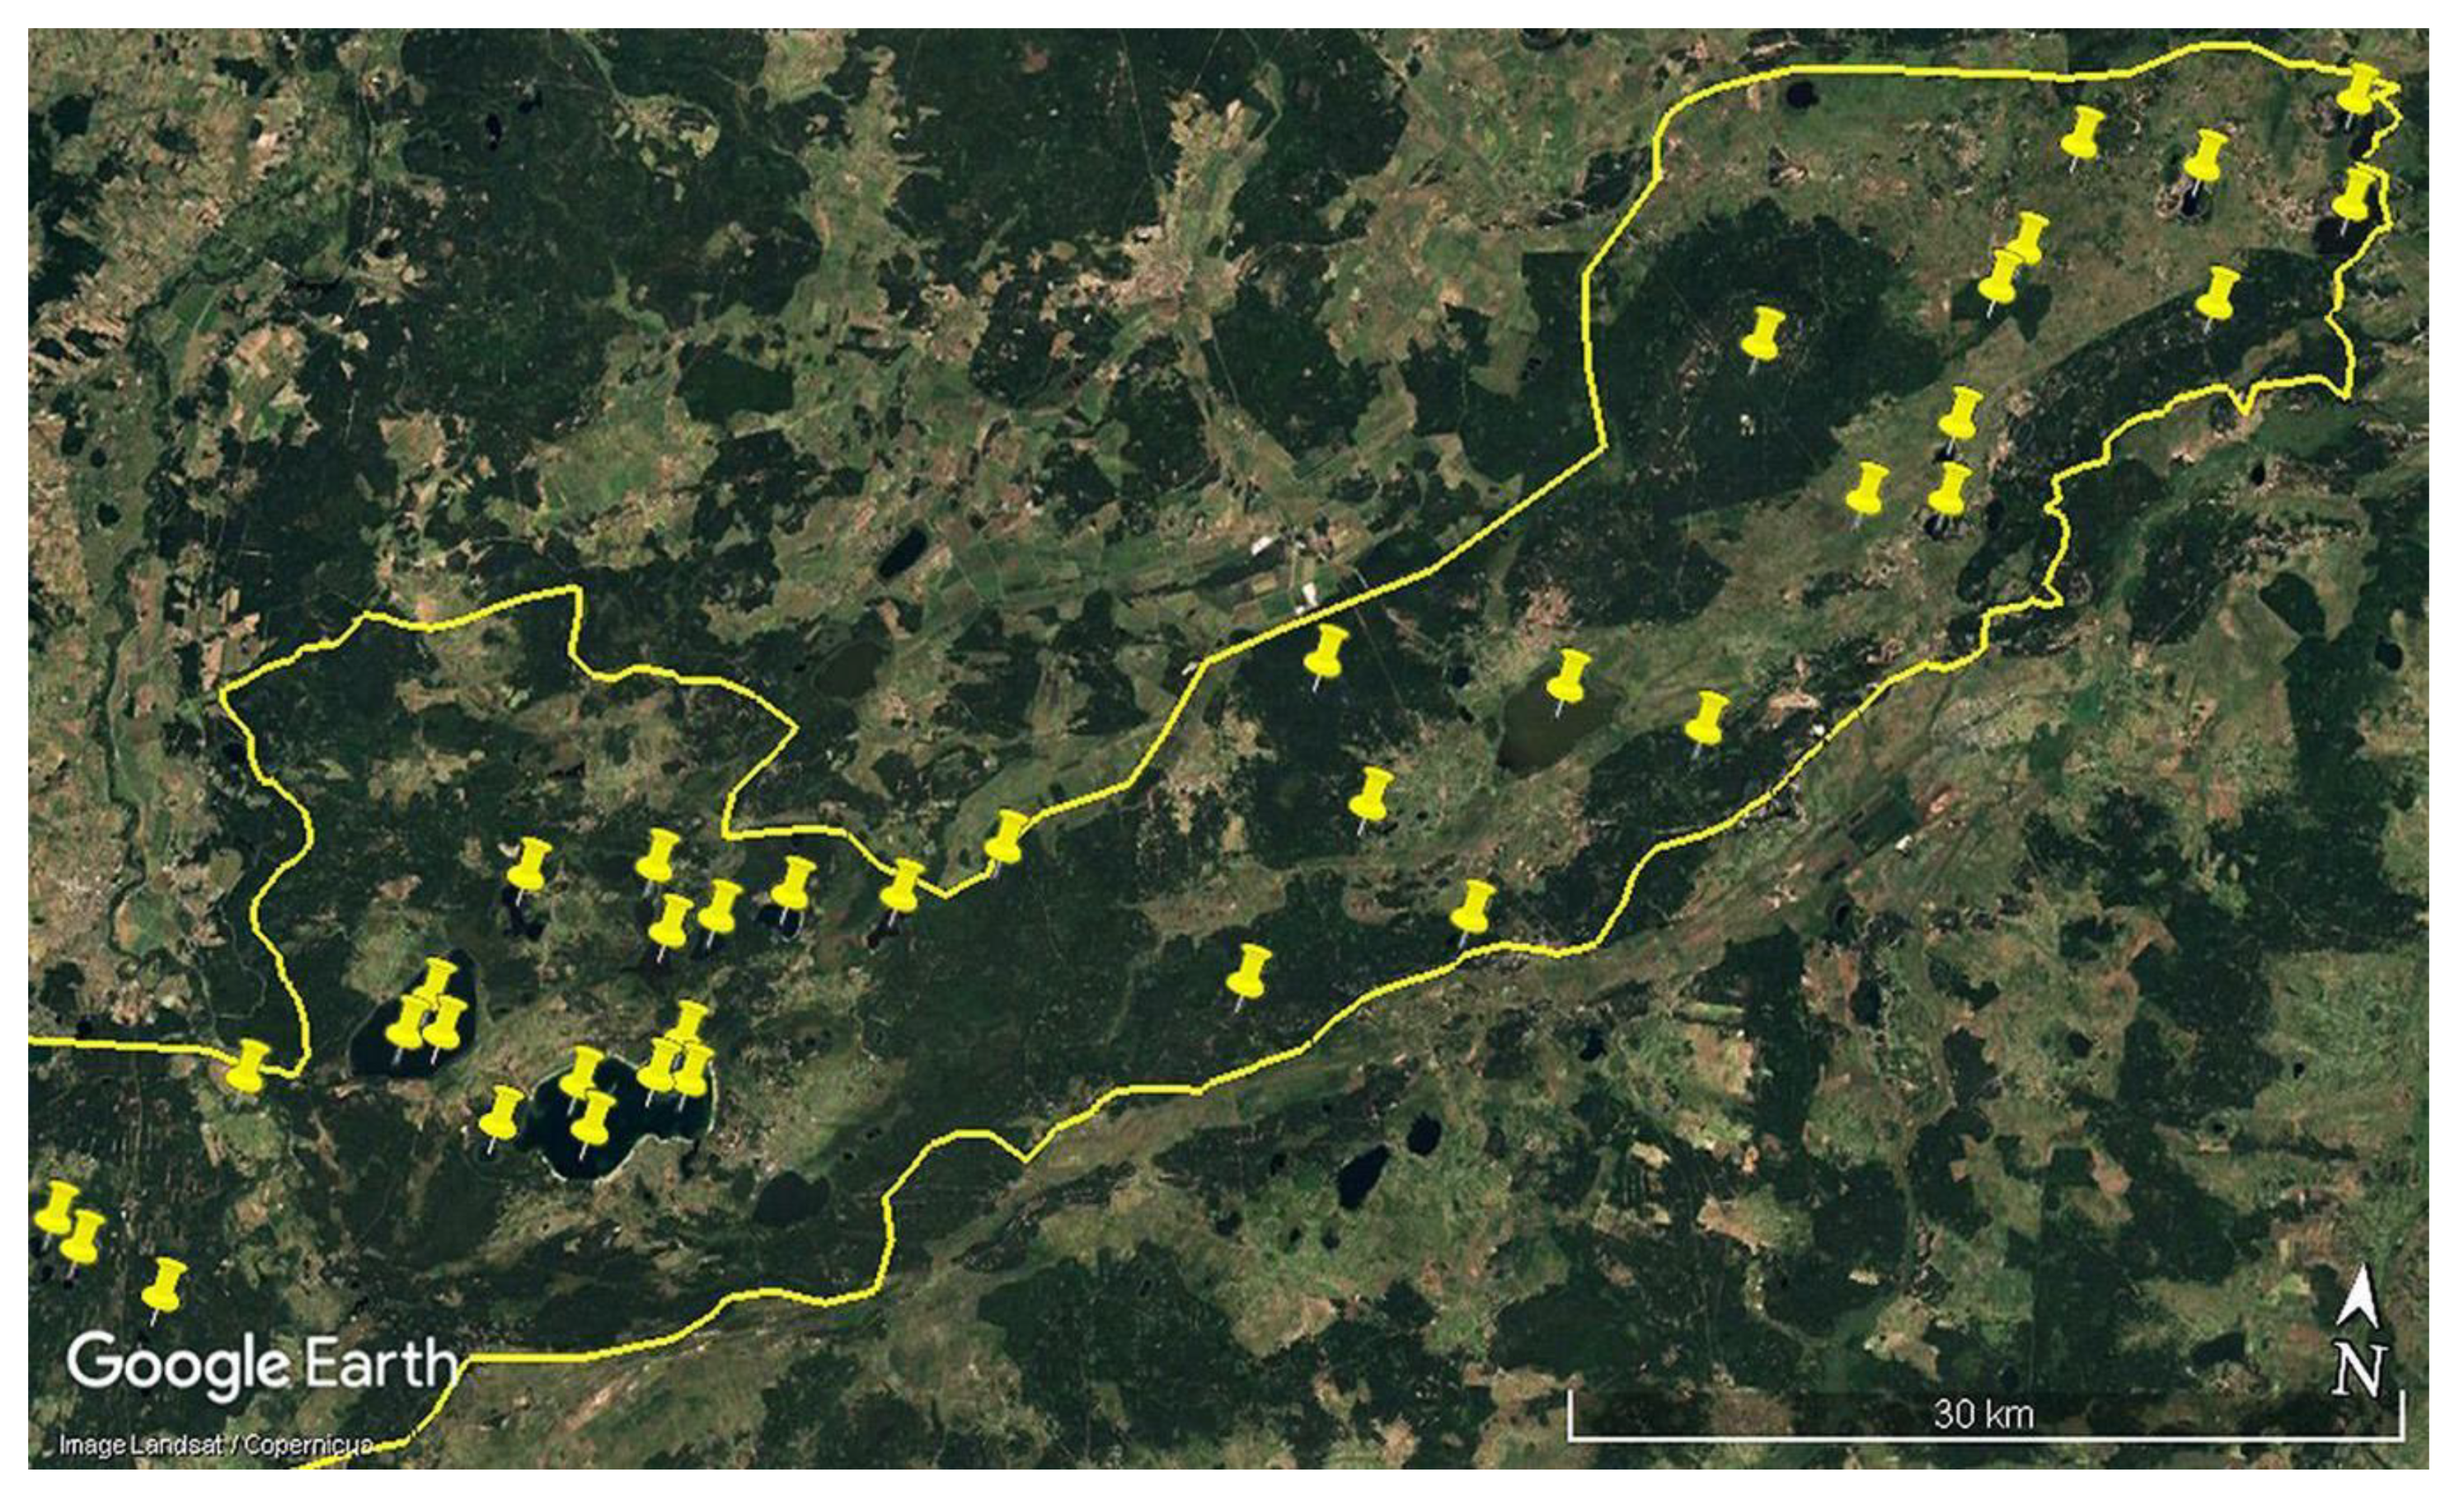
3. Materials and Methods
- (1)
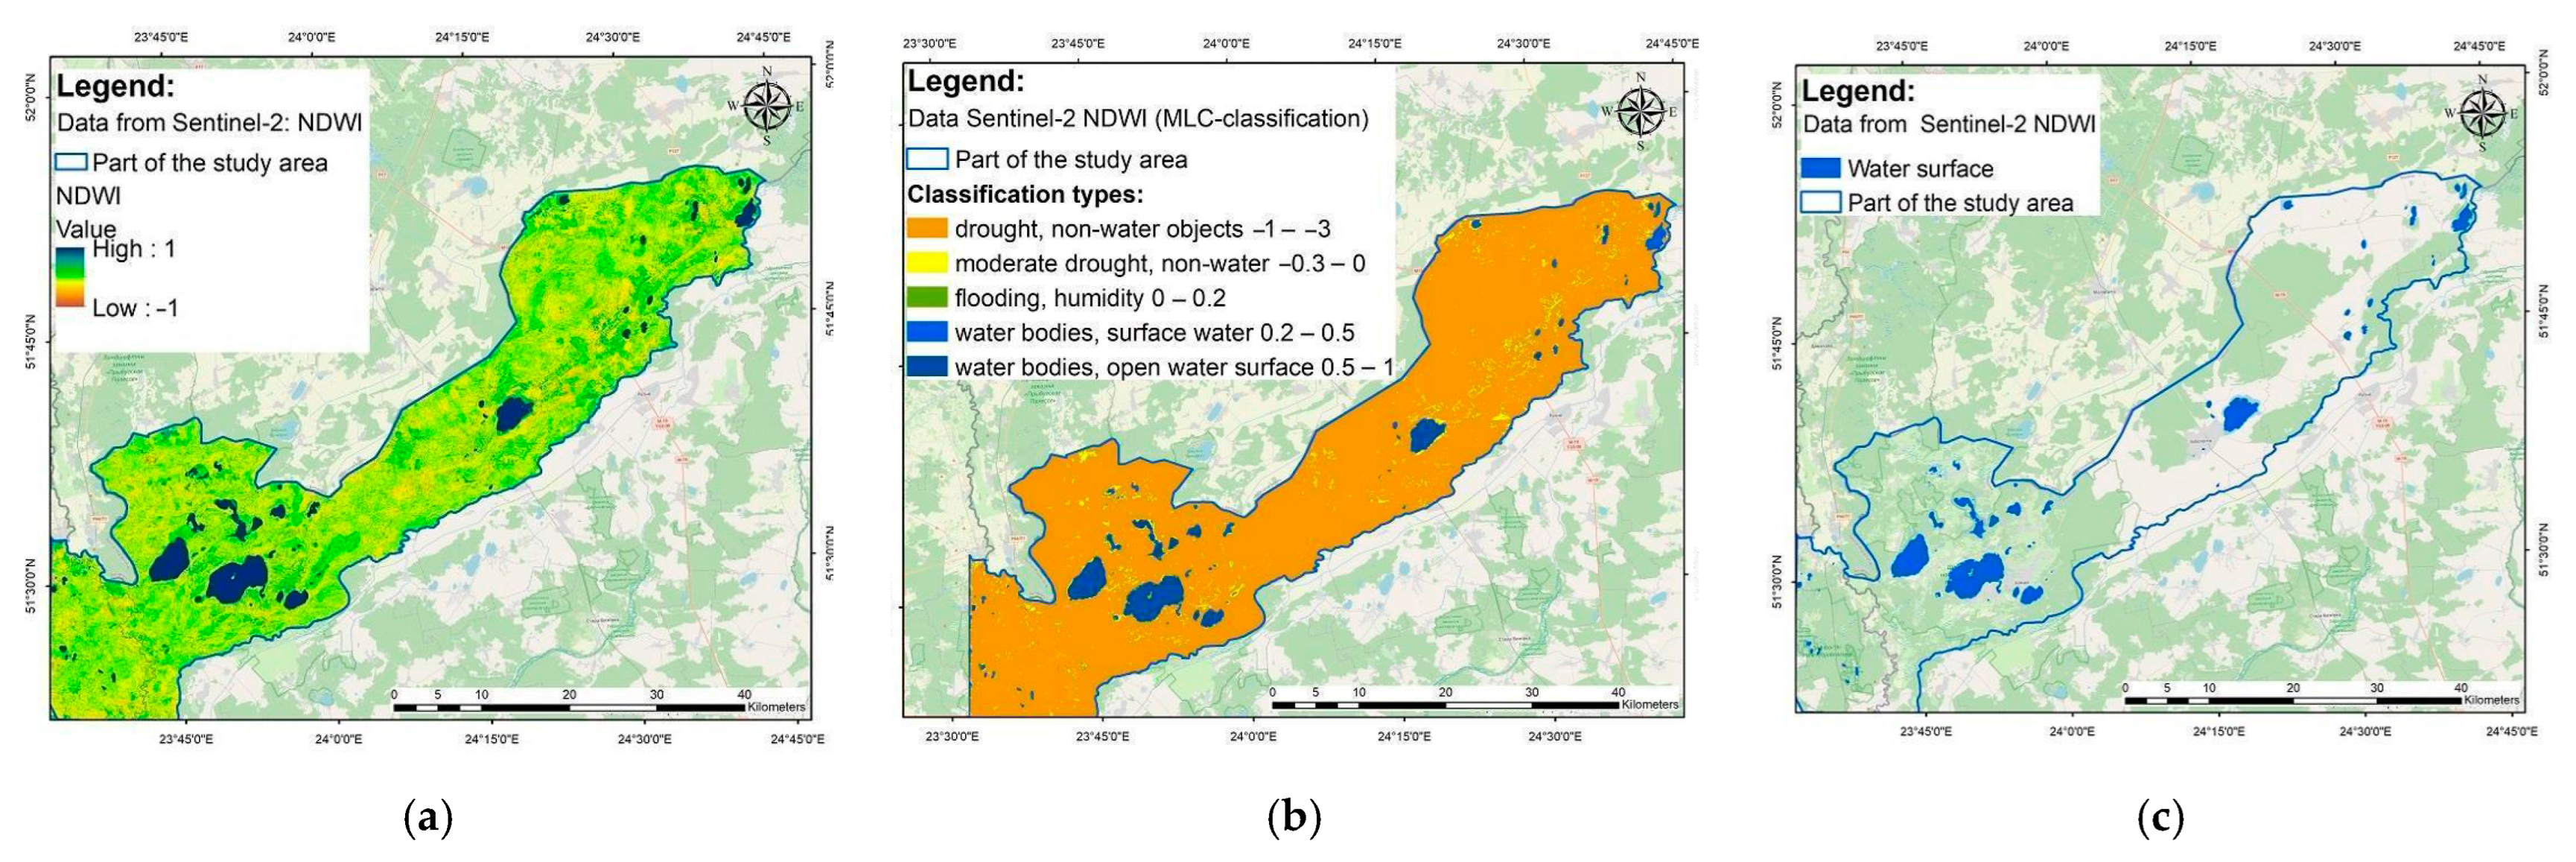
- Water bodies (open water surface) with a range of NDWI values from 0.5 to 1;
- (2)
- Water bodies, surface water (NDWI from 0.2 to 0.5), and flooding;
- (3)
- Humidity—NDWI from 0 to 0.2;
- (4)
- Moderate drought, non-water objects—NDWI from −0.3 to 0;
- (5)
- Drought, non-water objects—NDWI from −1 to −0.3.
Classification Accuracy Evaluation—Kappa Coefficient
4. Results
4.1. Identification of the Water Surface and Wetlands of the Bug River Basin Using Remote Sensing Data
4.1.1. The Identification of the Water Surface and Wetlands of the Bug River basin Using Multispectral Data: RGB Composite with MLC Classification
4.1.2. The Identification of the Water Surface of the Bug River Basin Using Multispectral Data: NDWI with MLC Classification
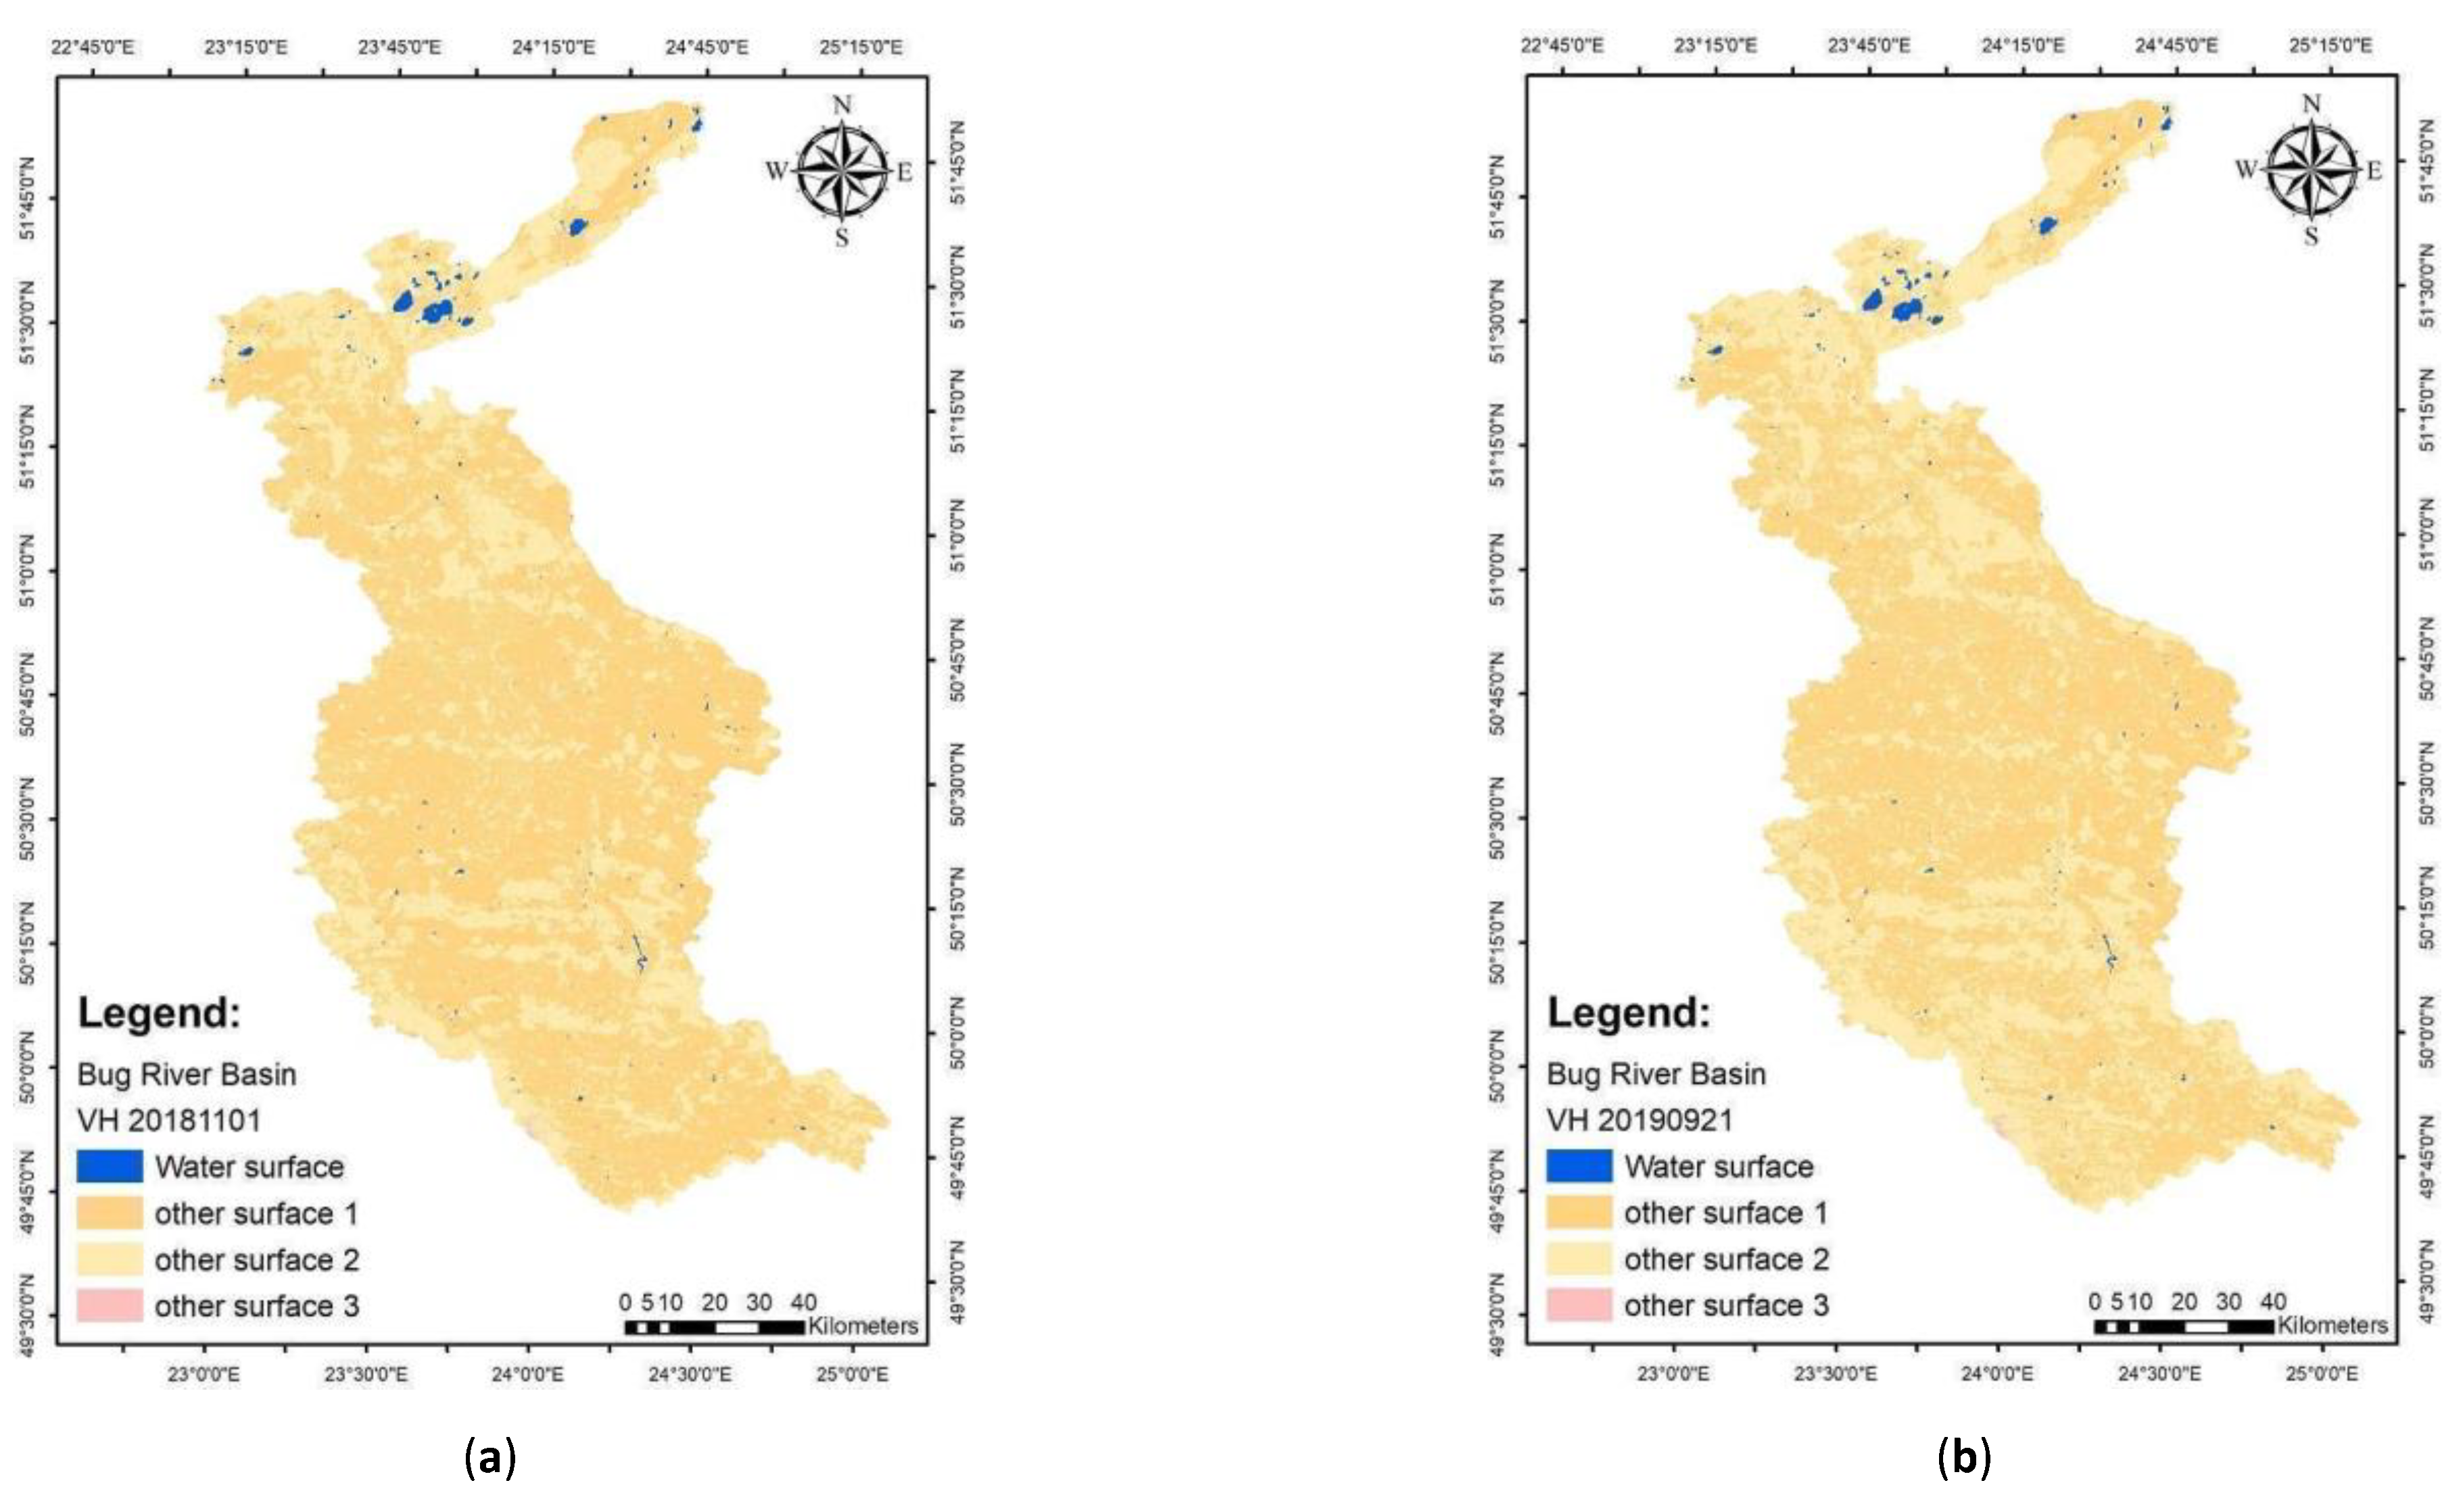
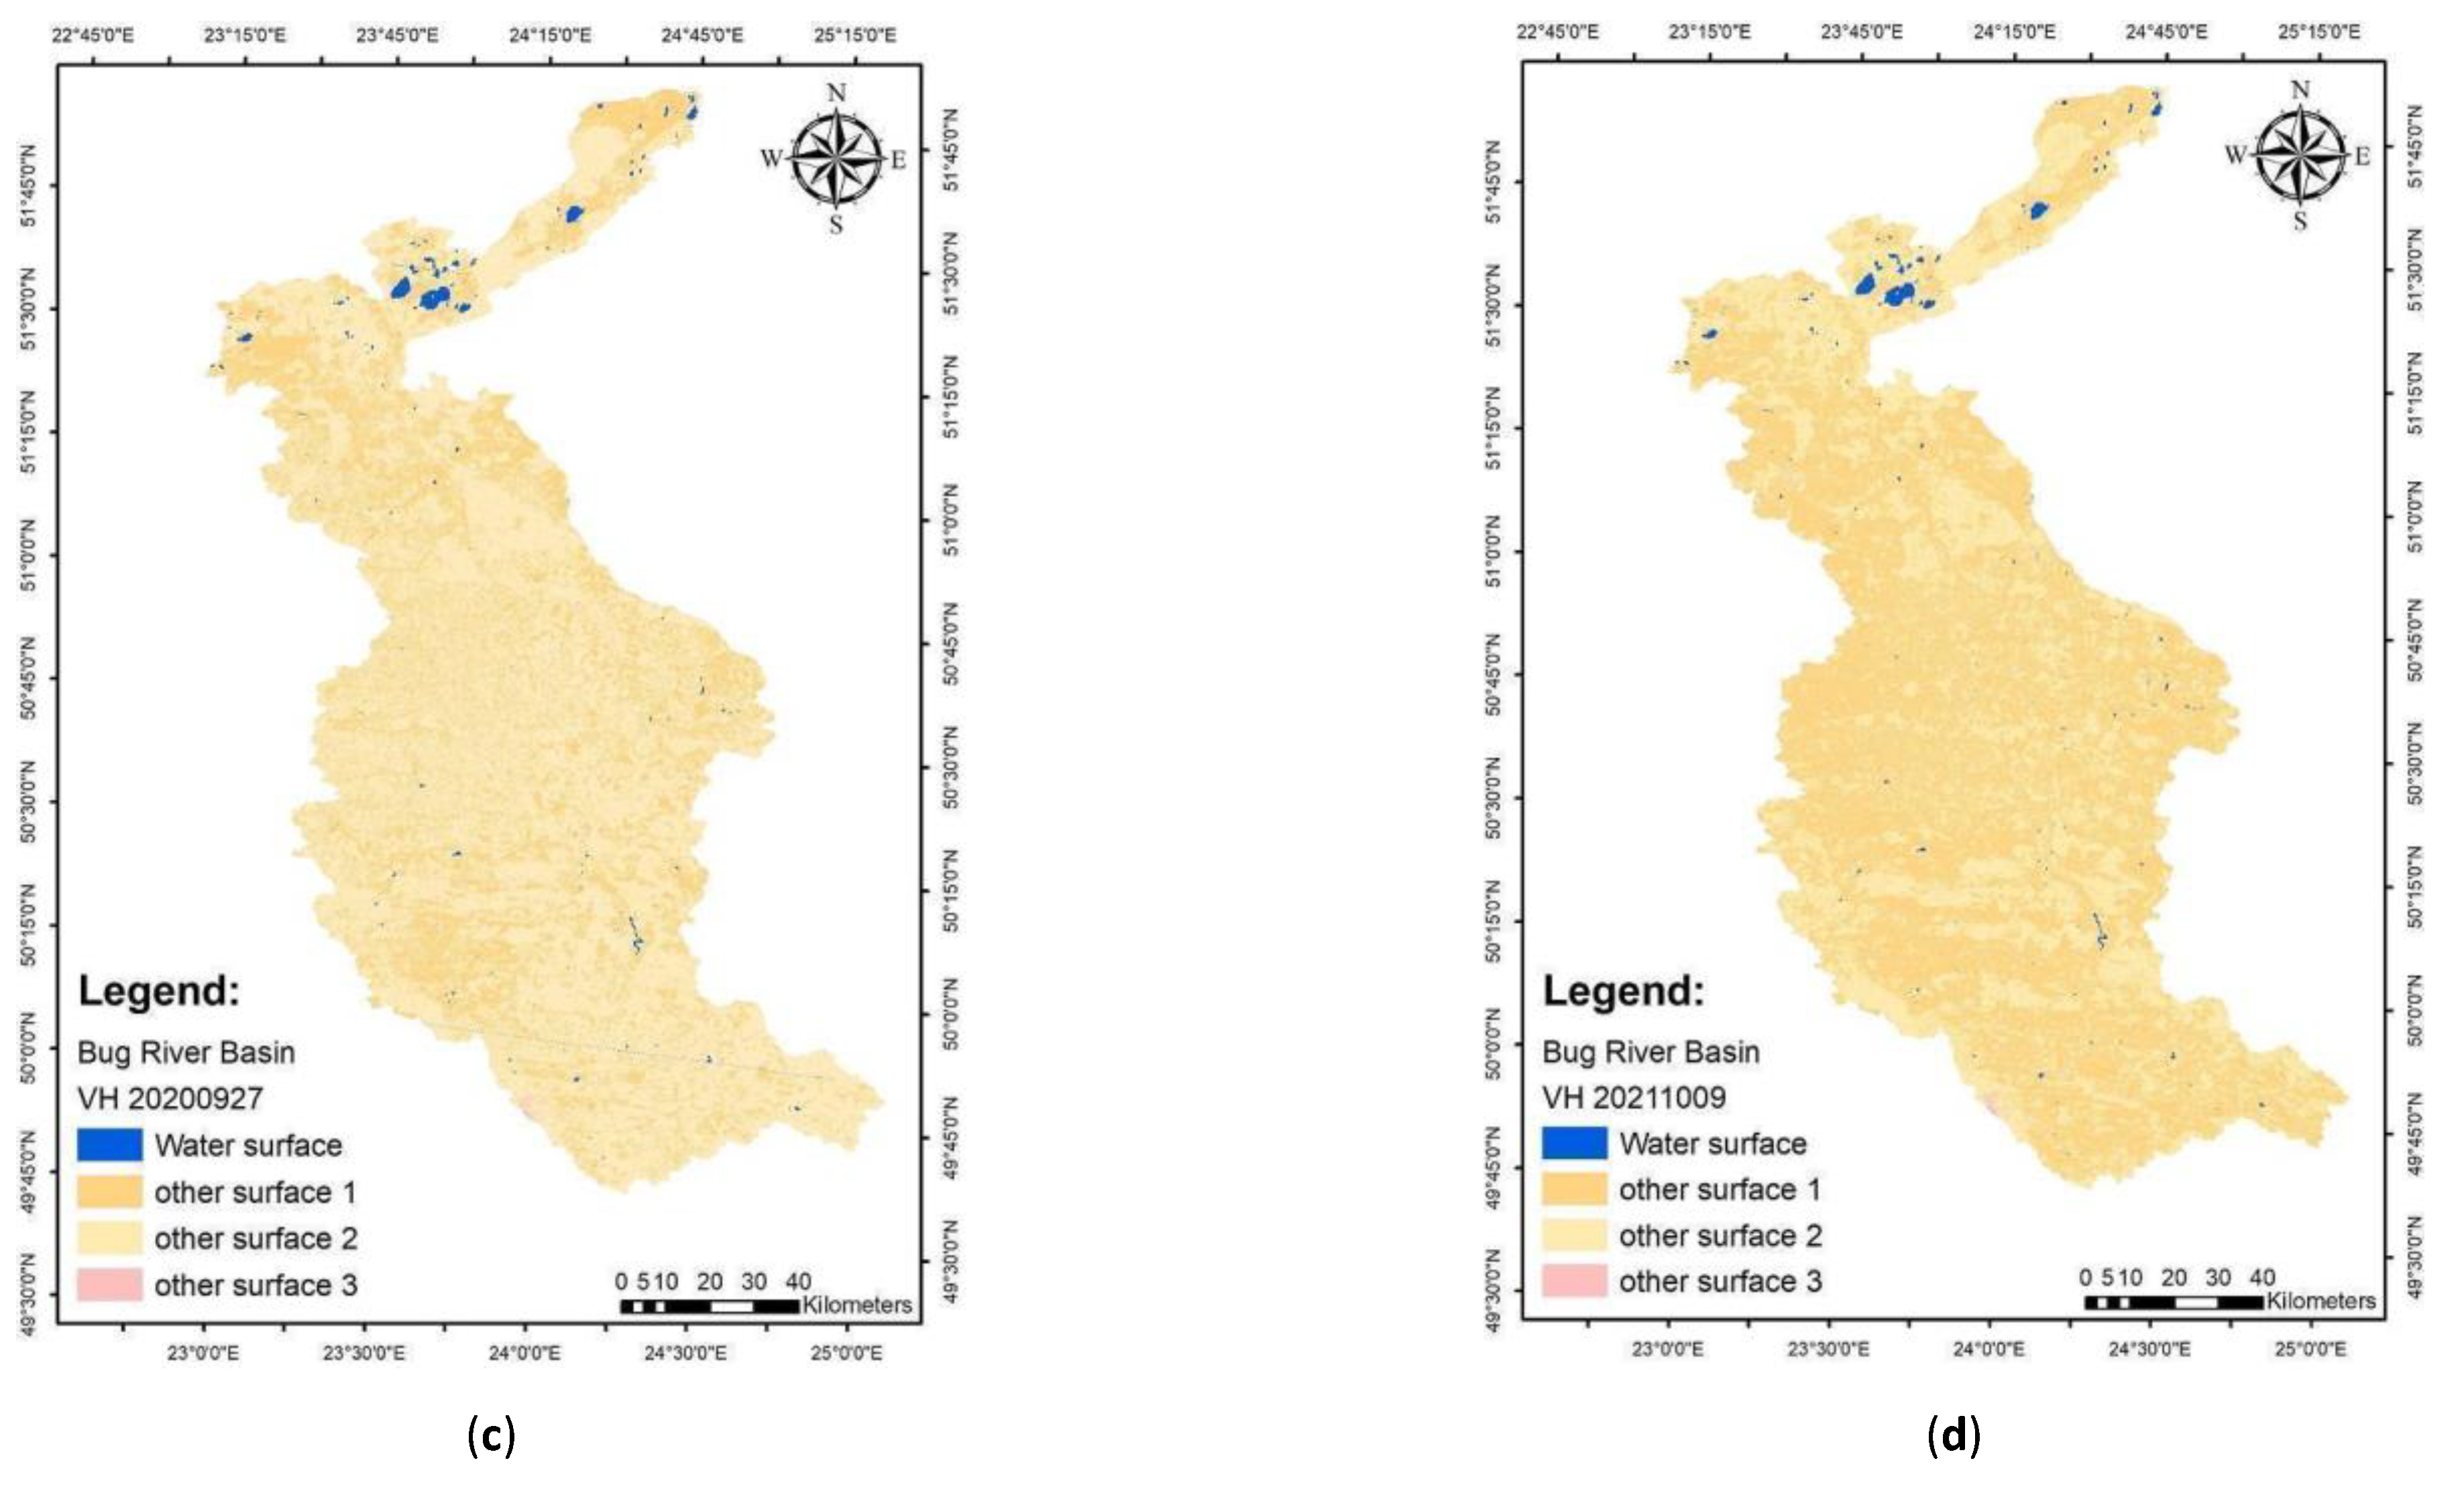
4.1.3. The Identification of the Water Surface of the Bug River Basin Using SAR Data: VH Polarization with MLC Classification
4.2. The Identification of the Water Surface and Wetlands of the Dniester River Basin Using Remote Sensing Data
4.2.1. The Identification of the Water Surface and Wetlands of the Dniester River Basin Using Multispectral Data: RGB Composite with MLC Classification
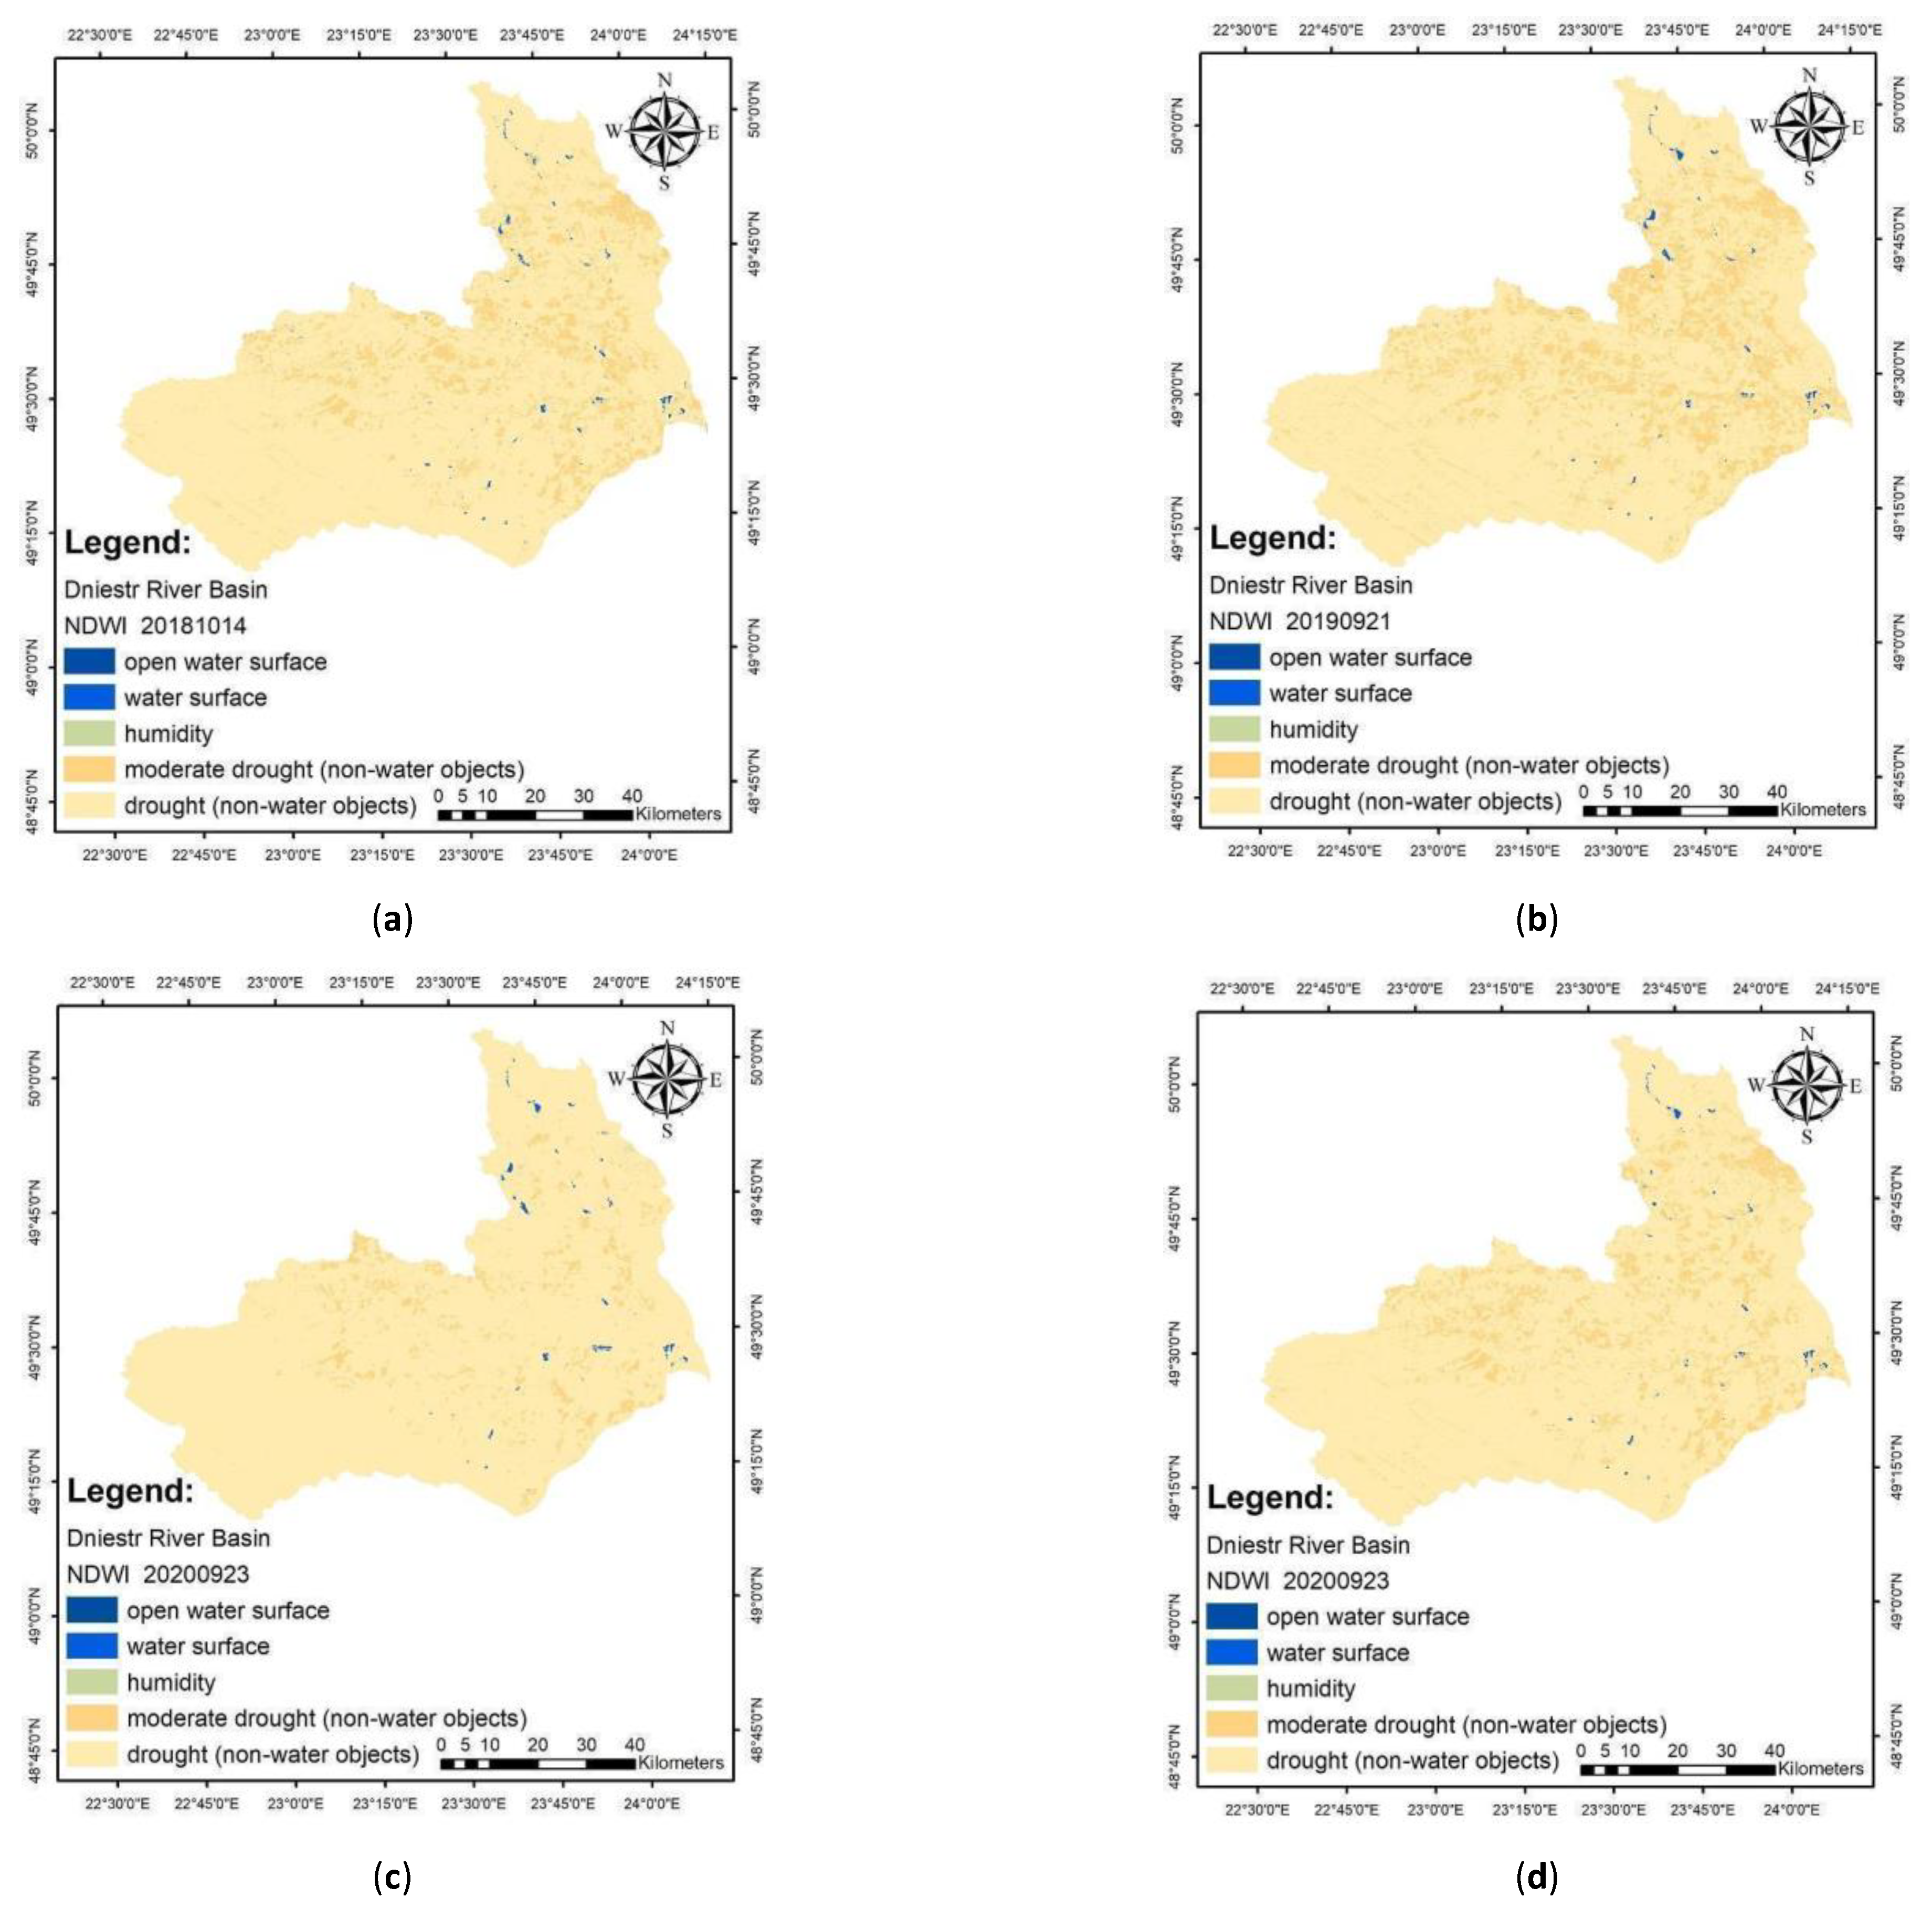
4.2.2. The Identification of the Water Surface of the Dniester River Basin Using NDWI, Composite with MLC Classification
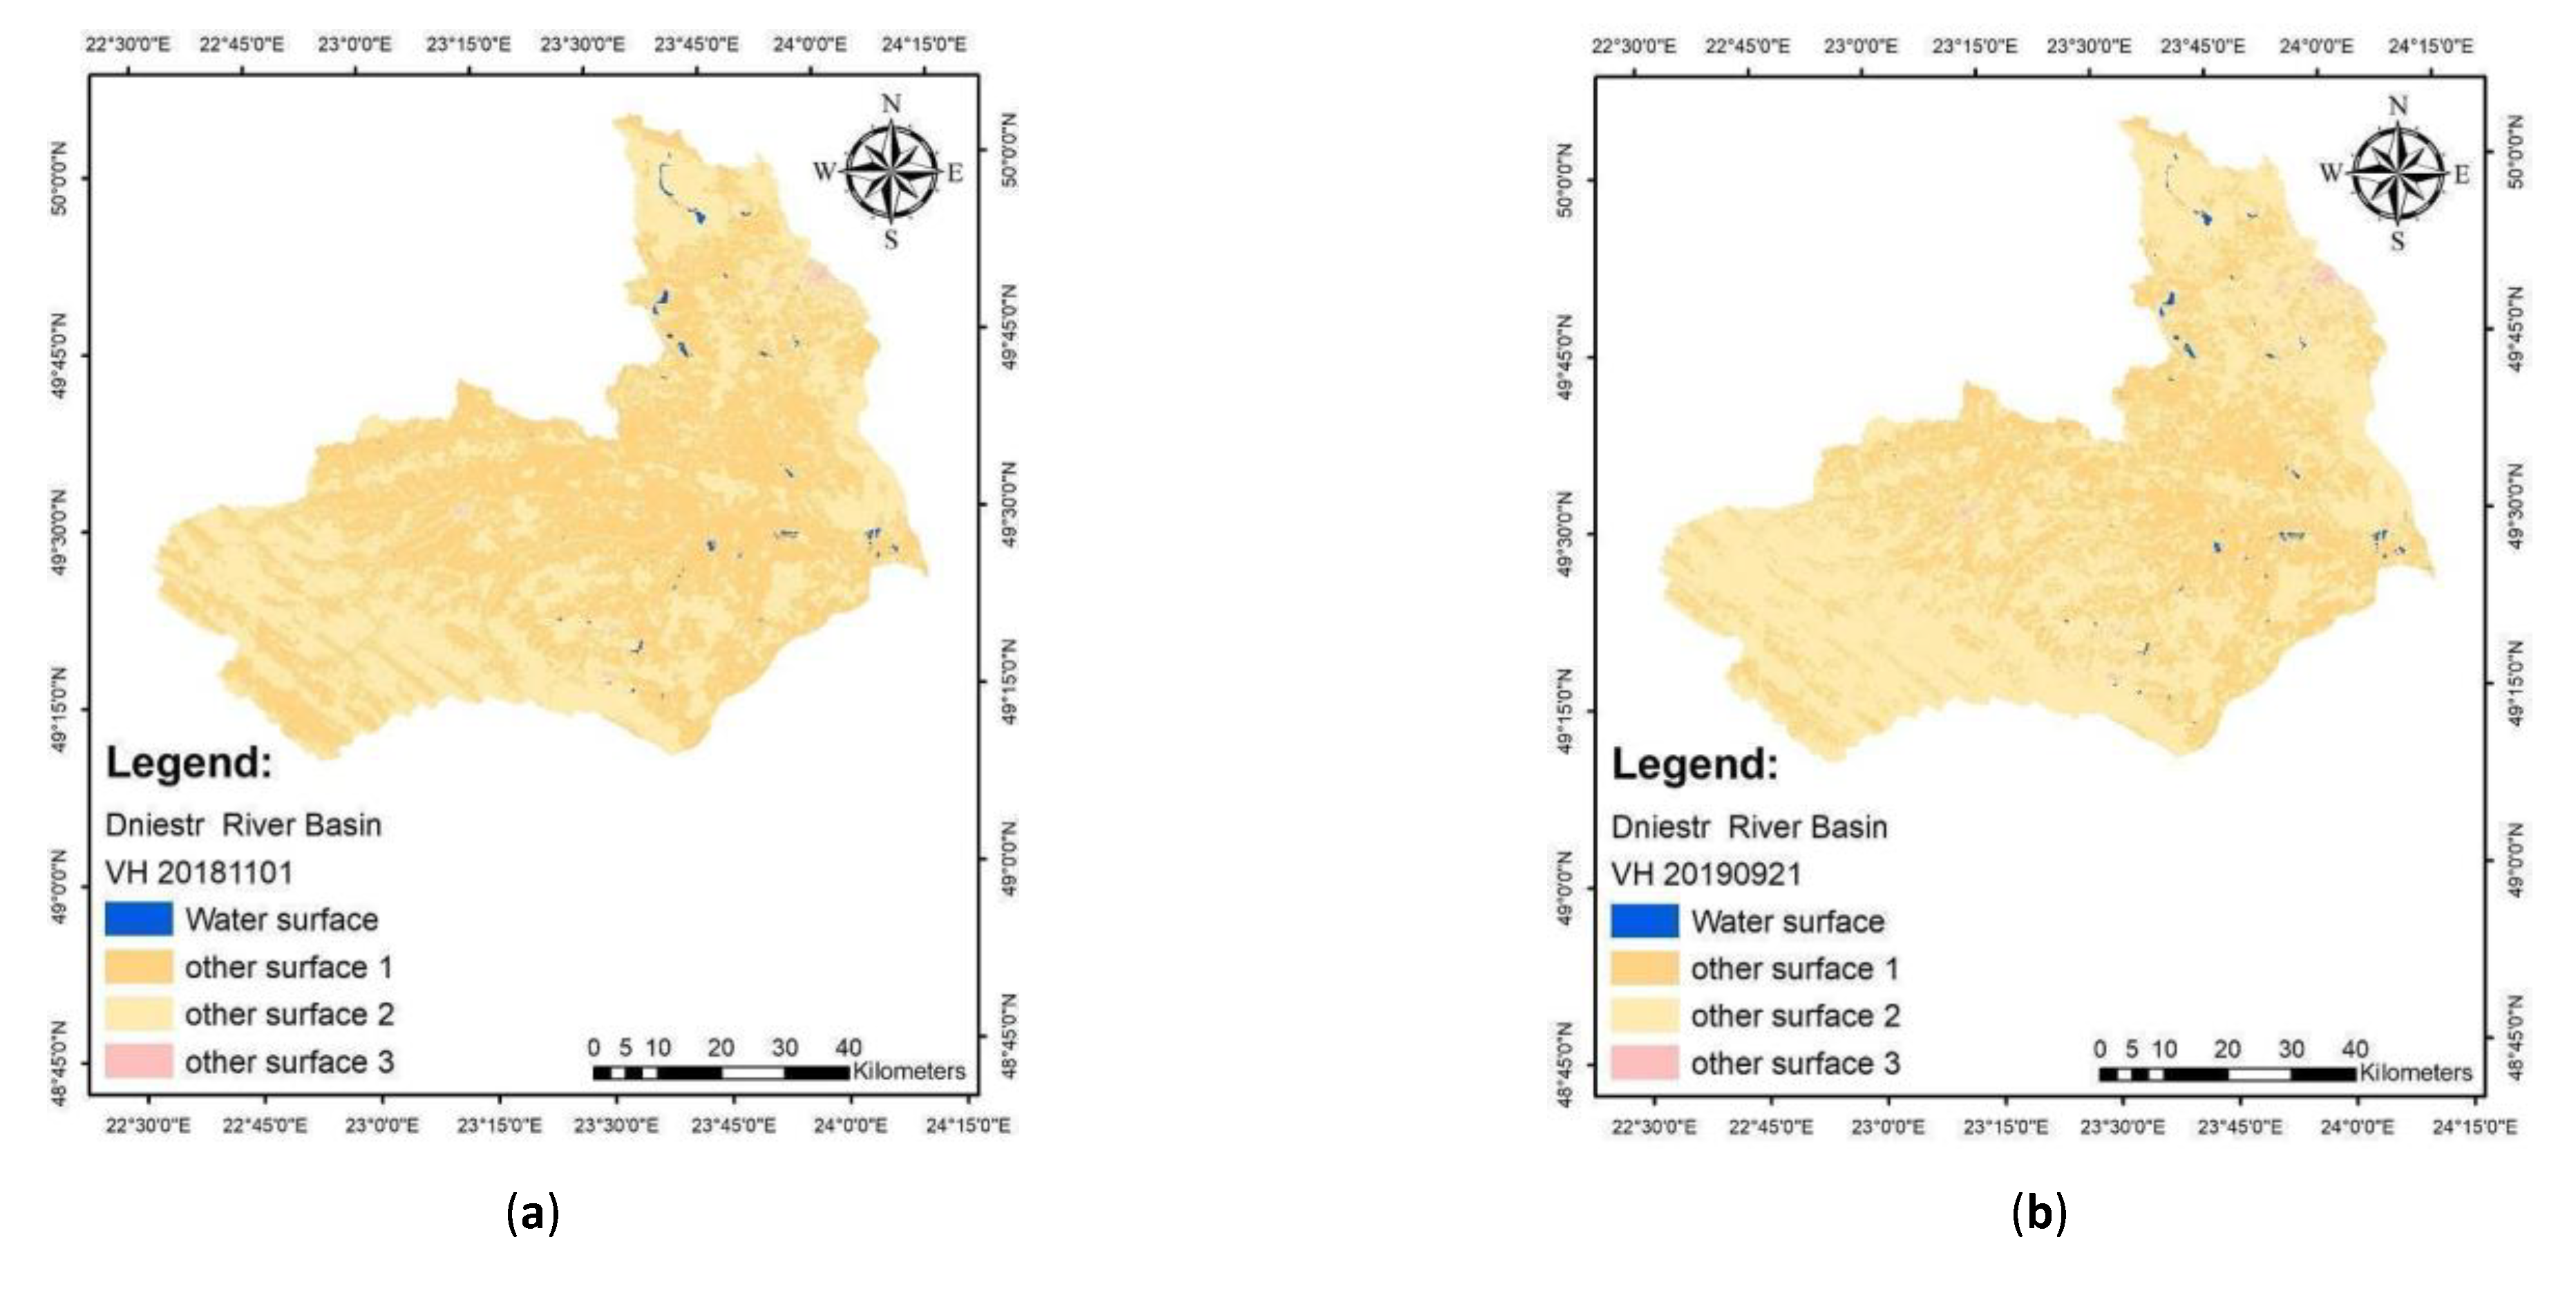
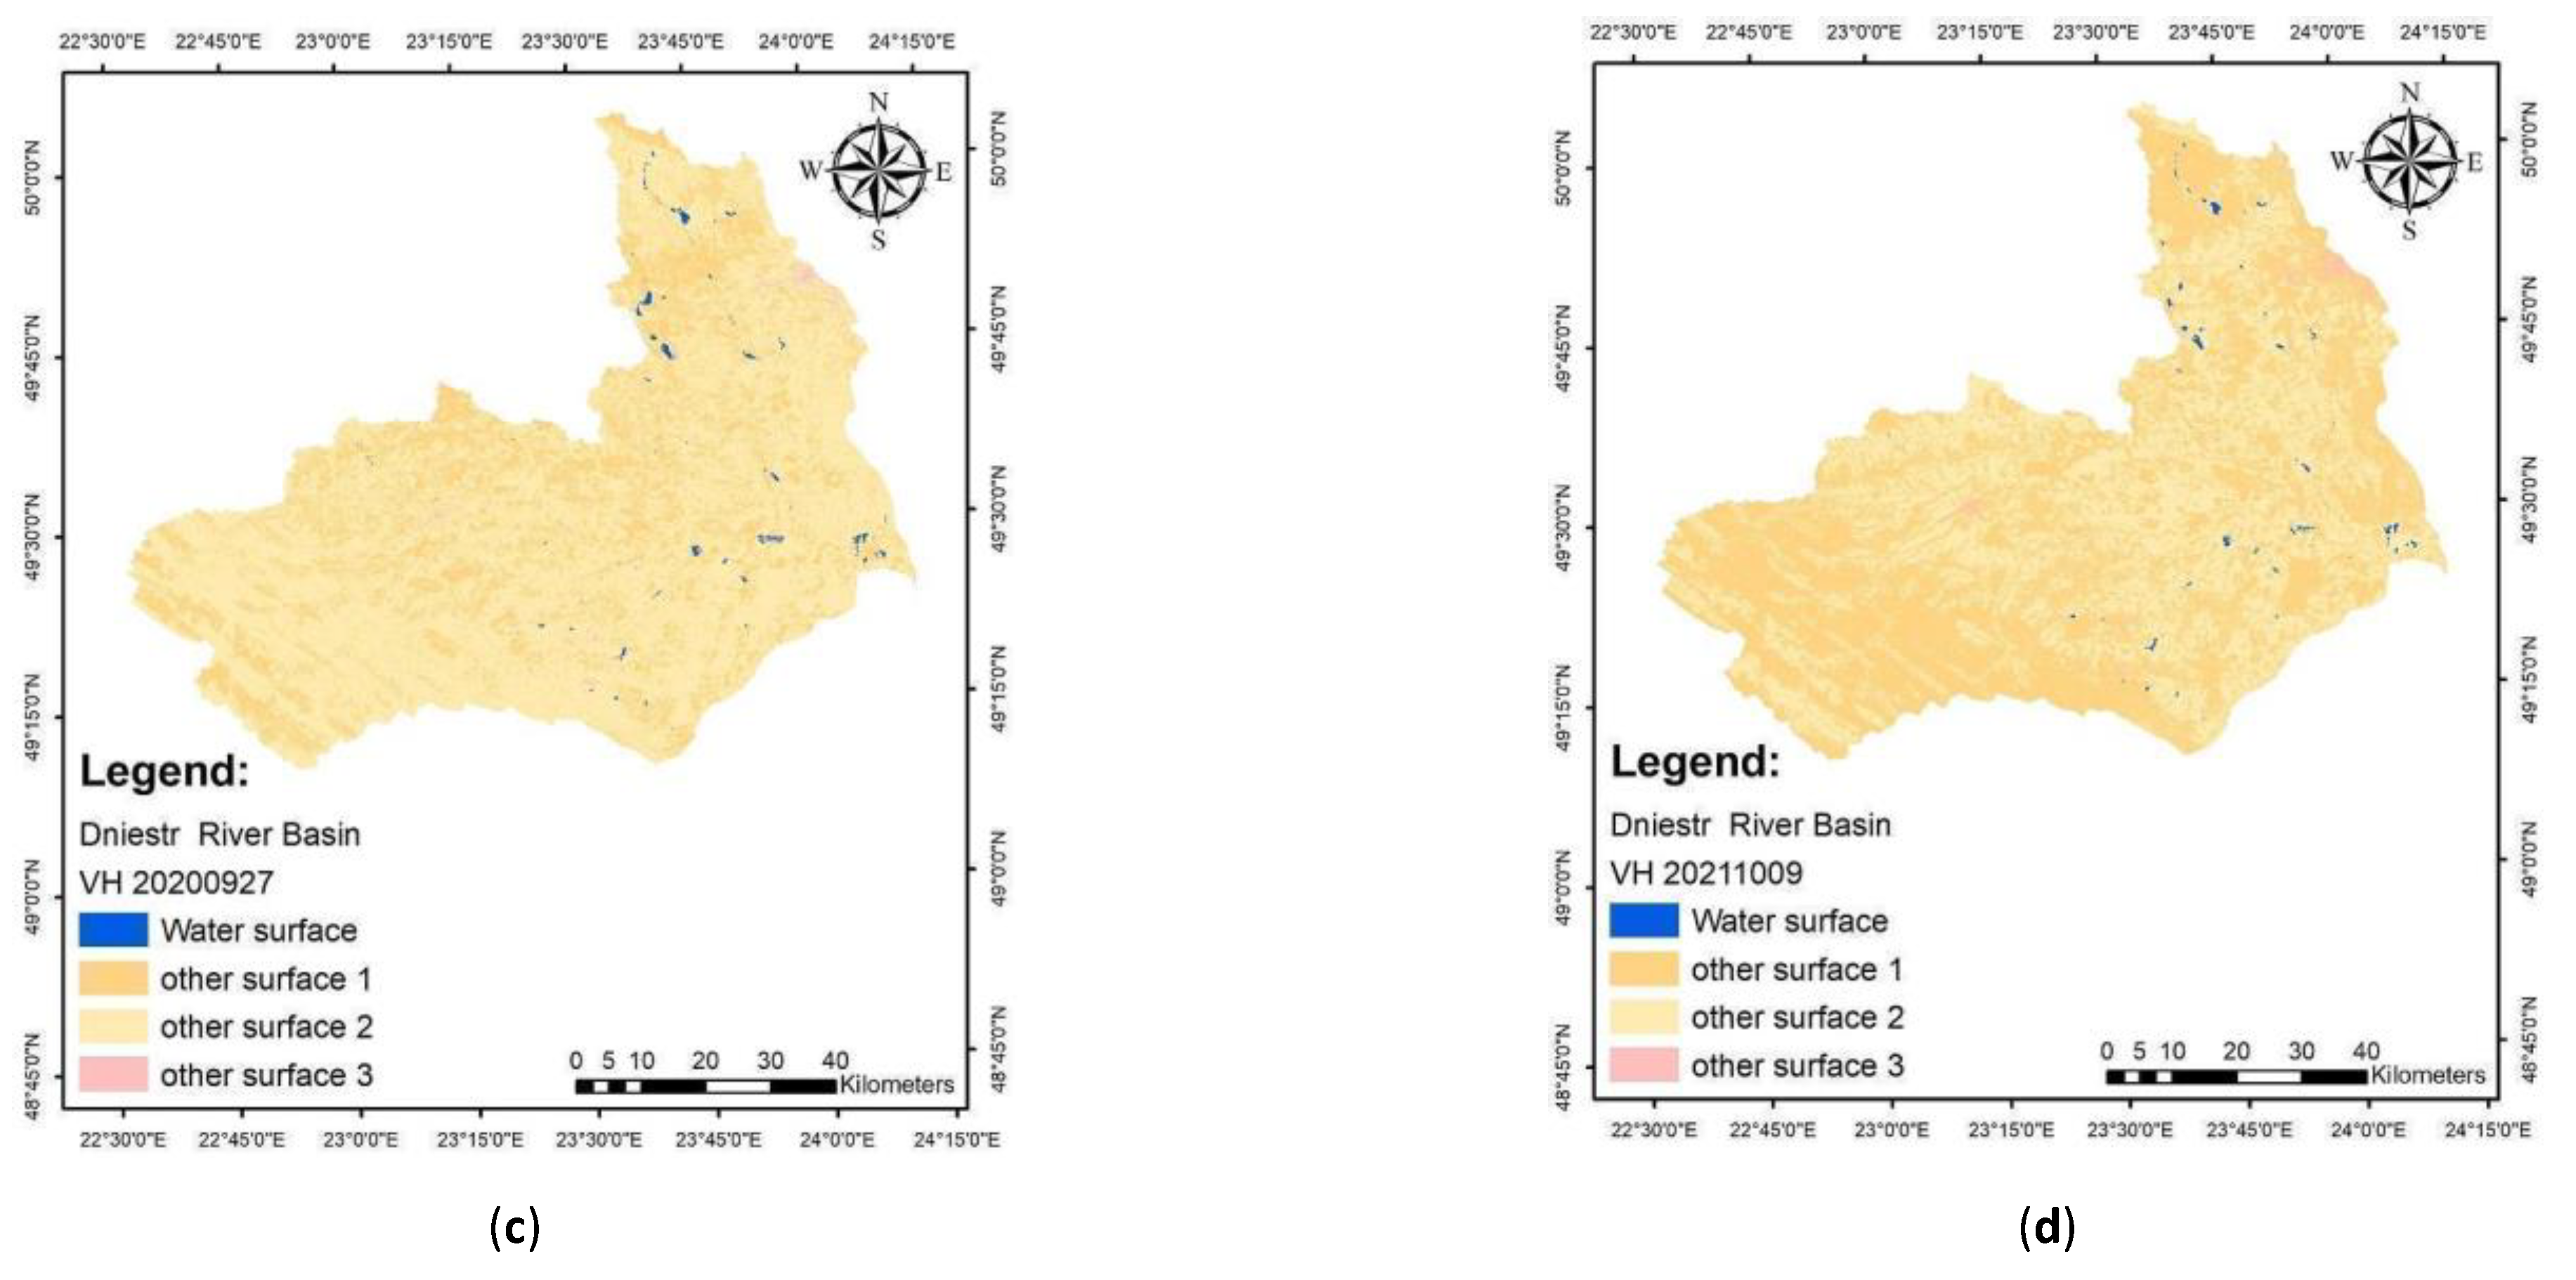
4.2.3. The Identification of the Water Surface of the Dniester River Basin Using SAR Data: VH Polarization with MLC Classification
4.3. The Identification of the Water Surface and Wetlands of the San River Basin Using Remote Sensing Data
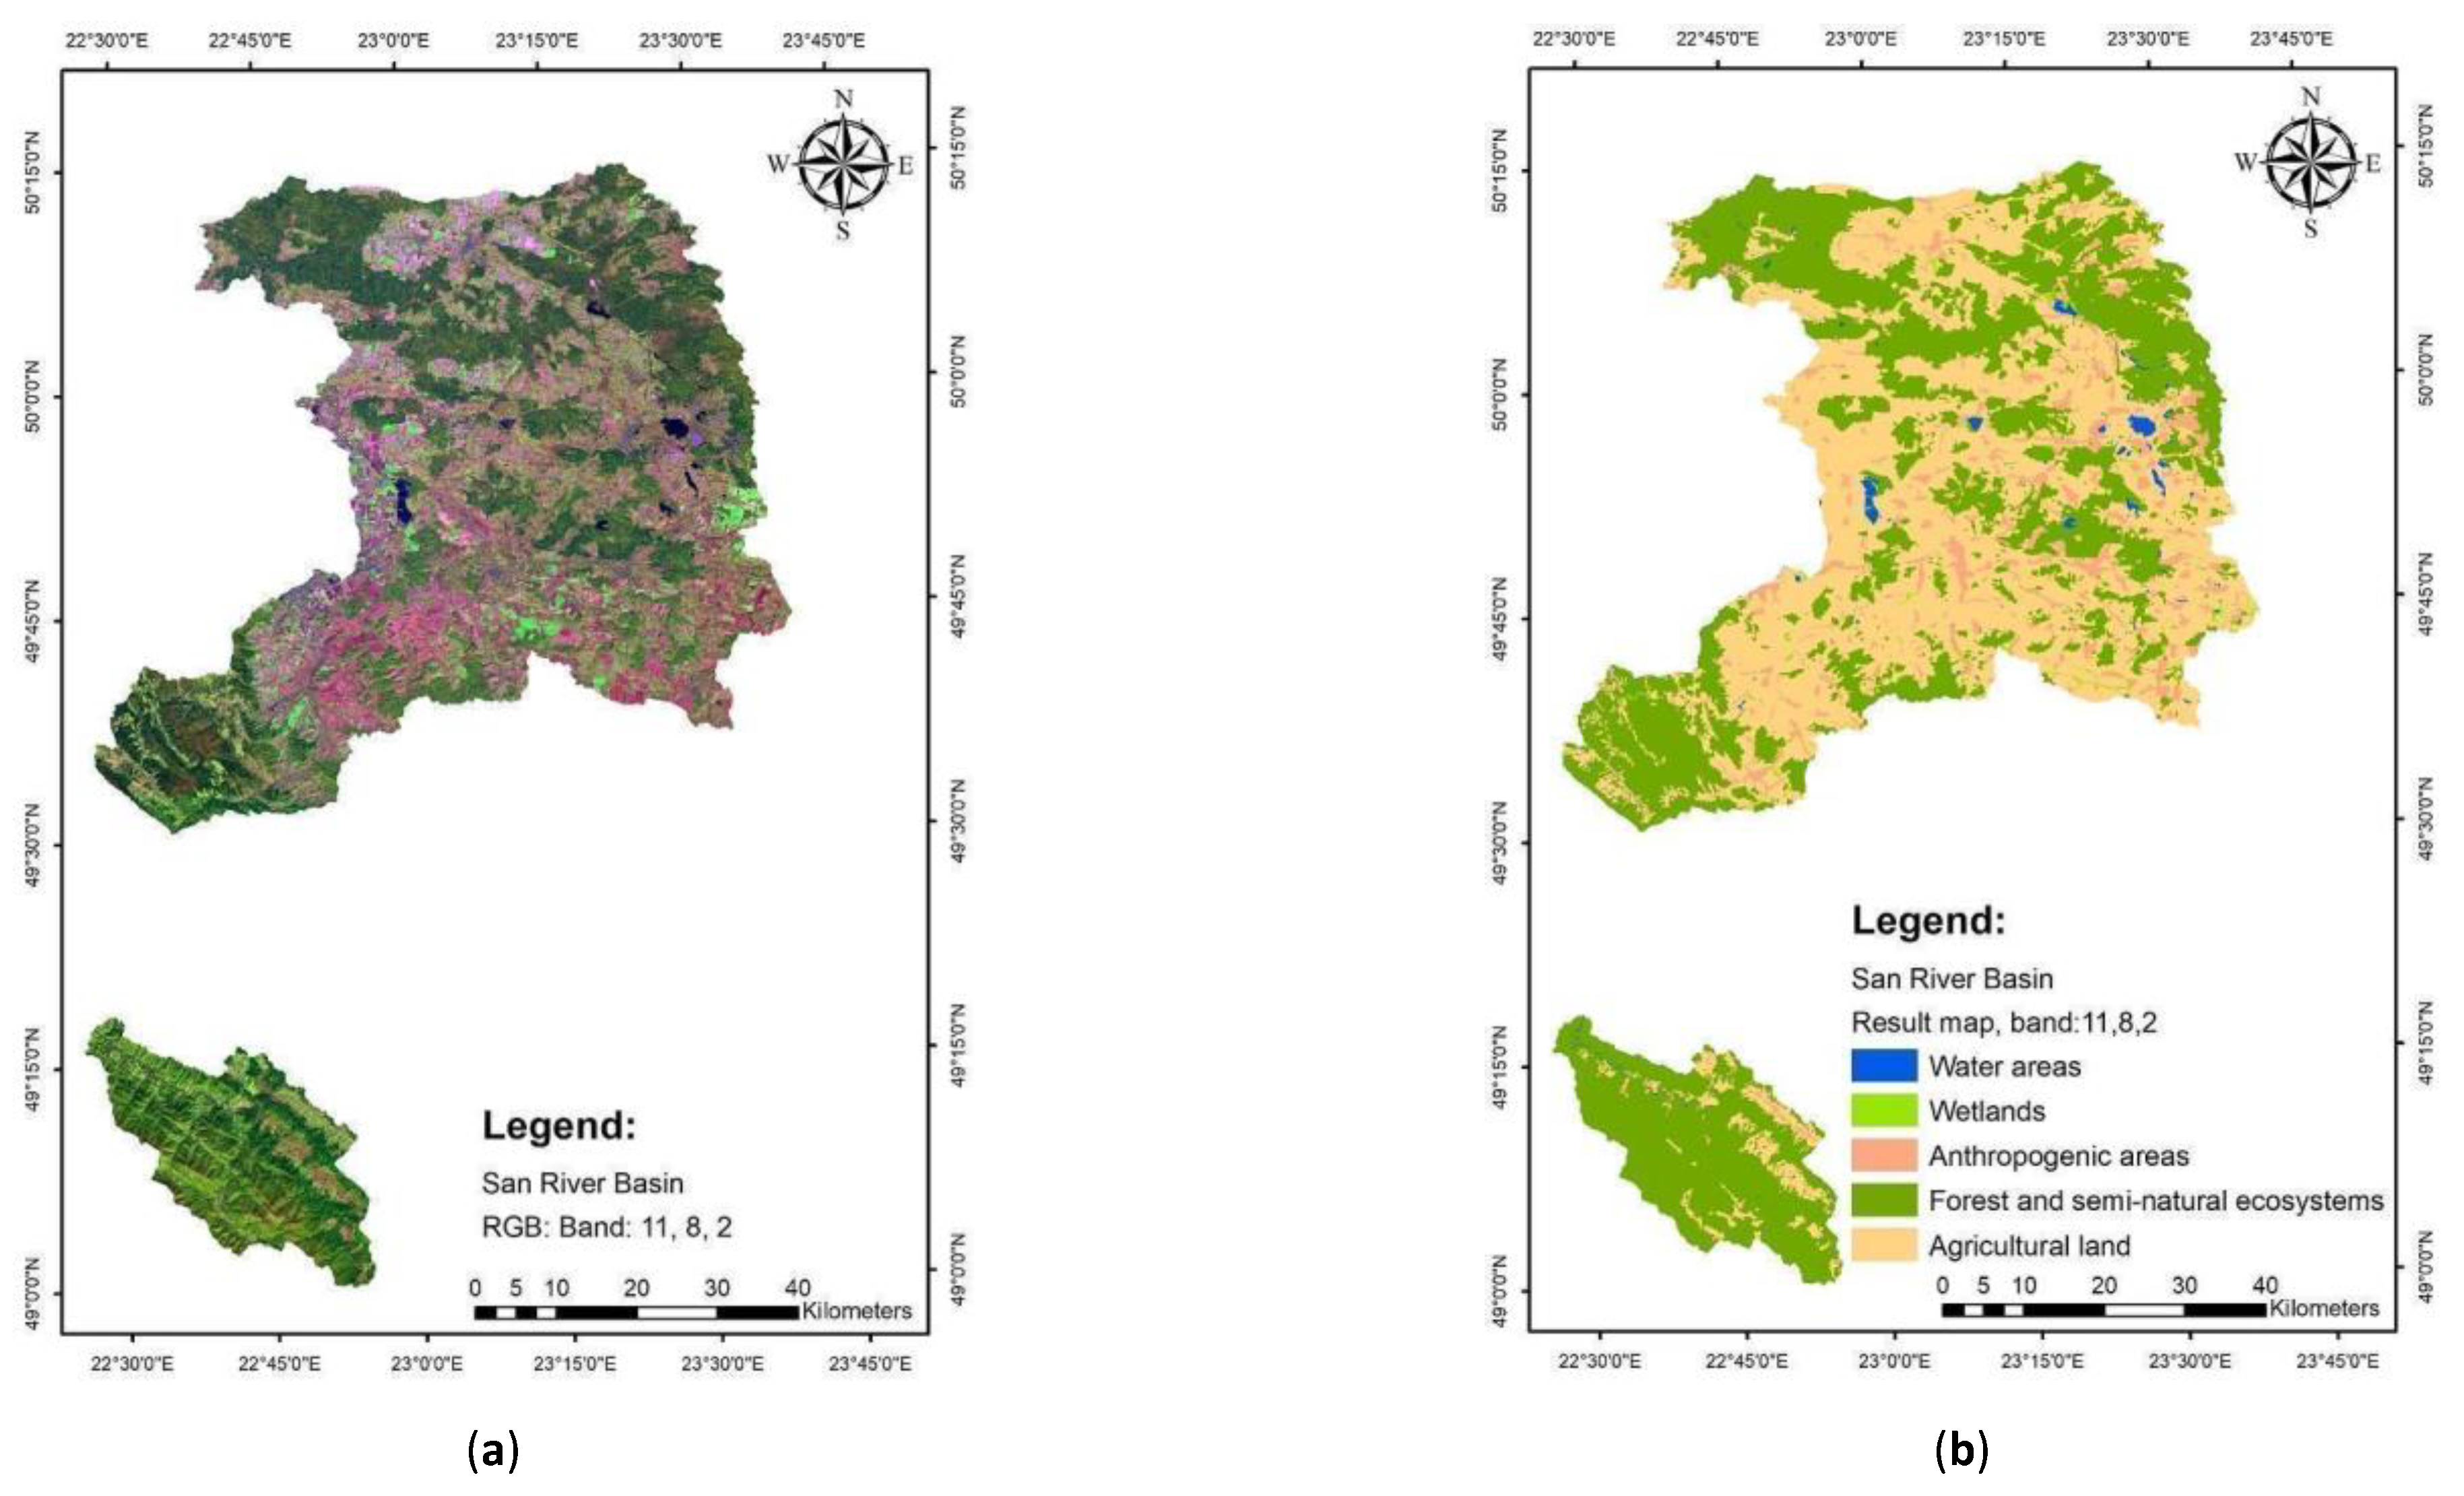
4.3.1. The Identification of the Water Surface and Wetlands of the San River Basin Using Multispectral Data: RGB Composite with MLC Classification
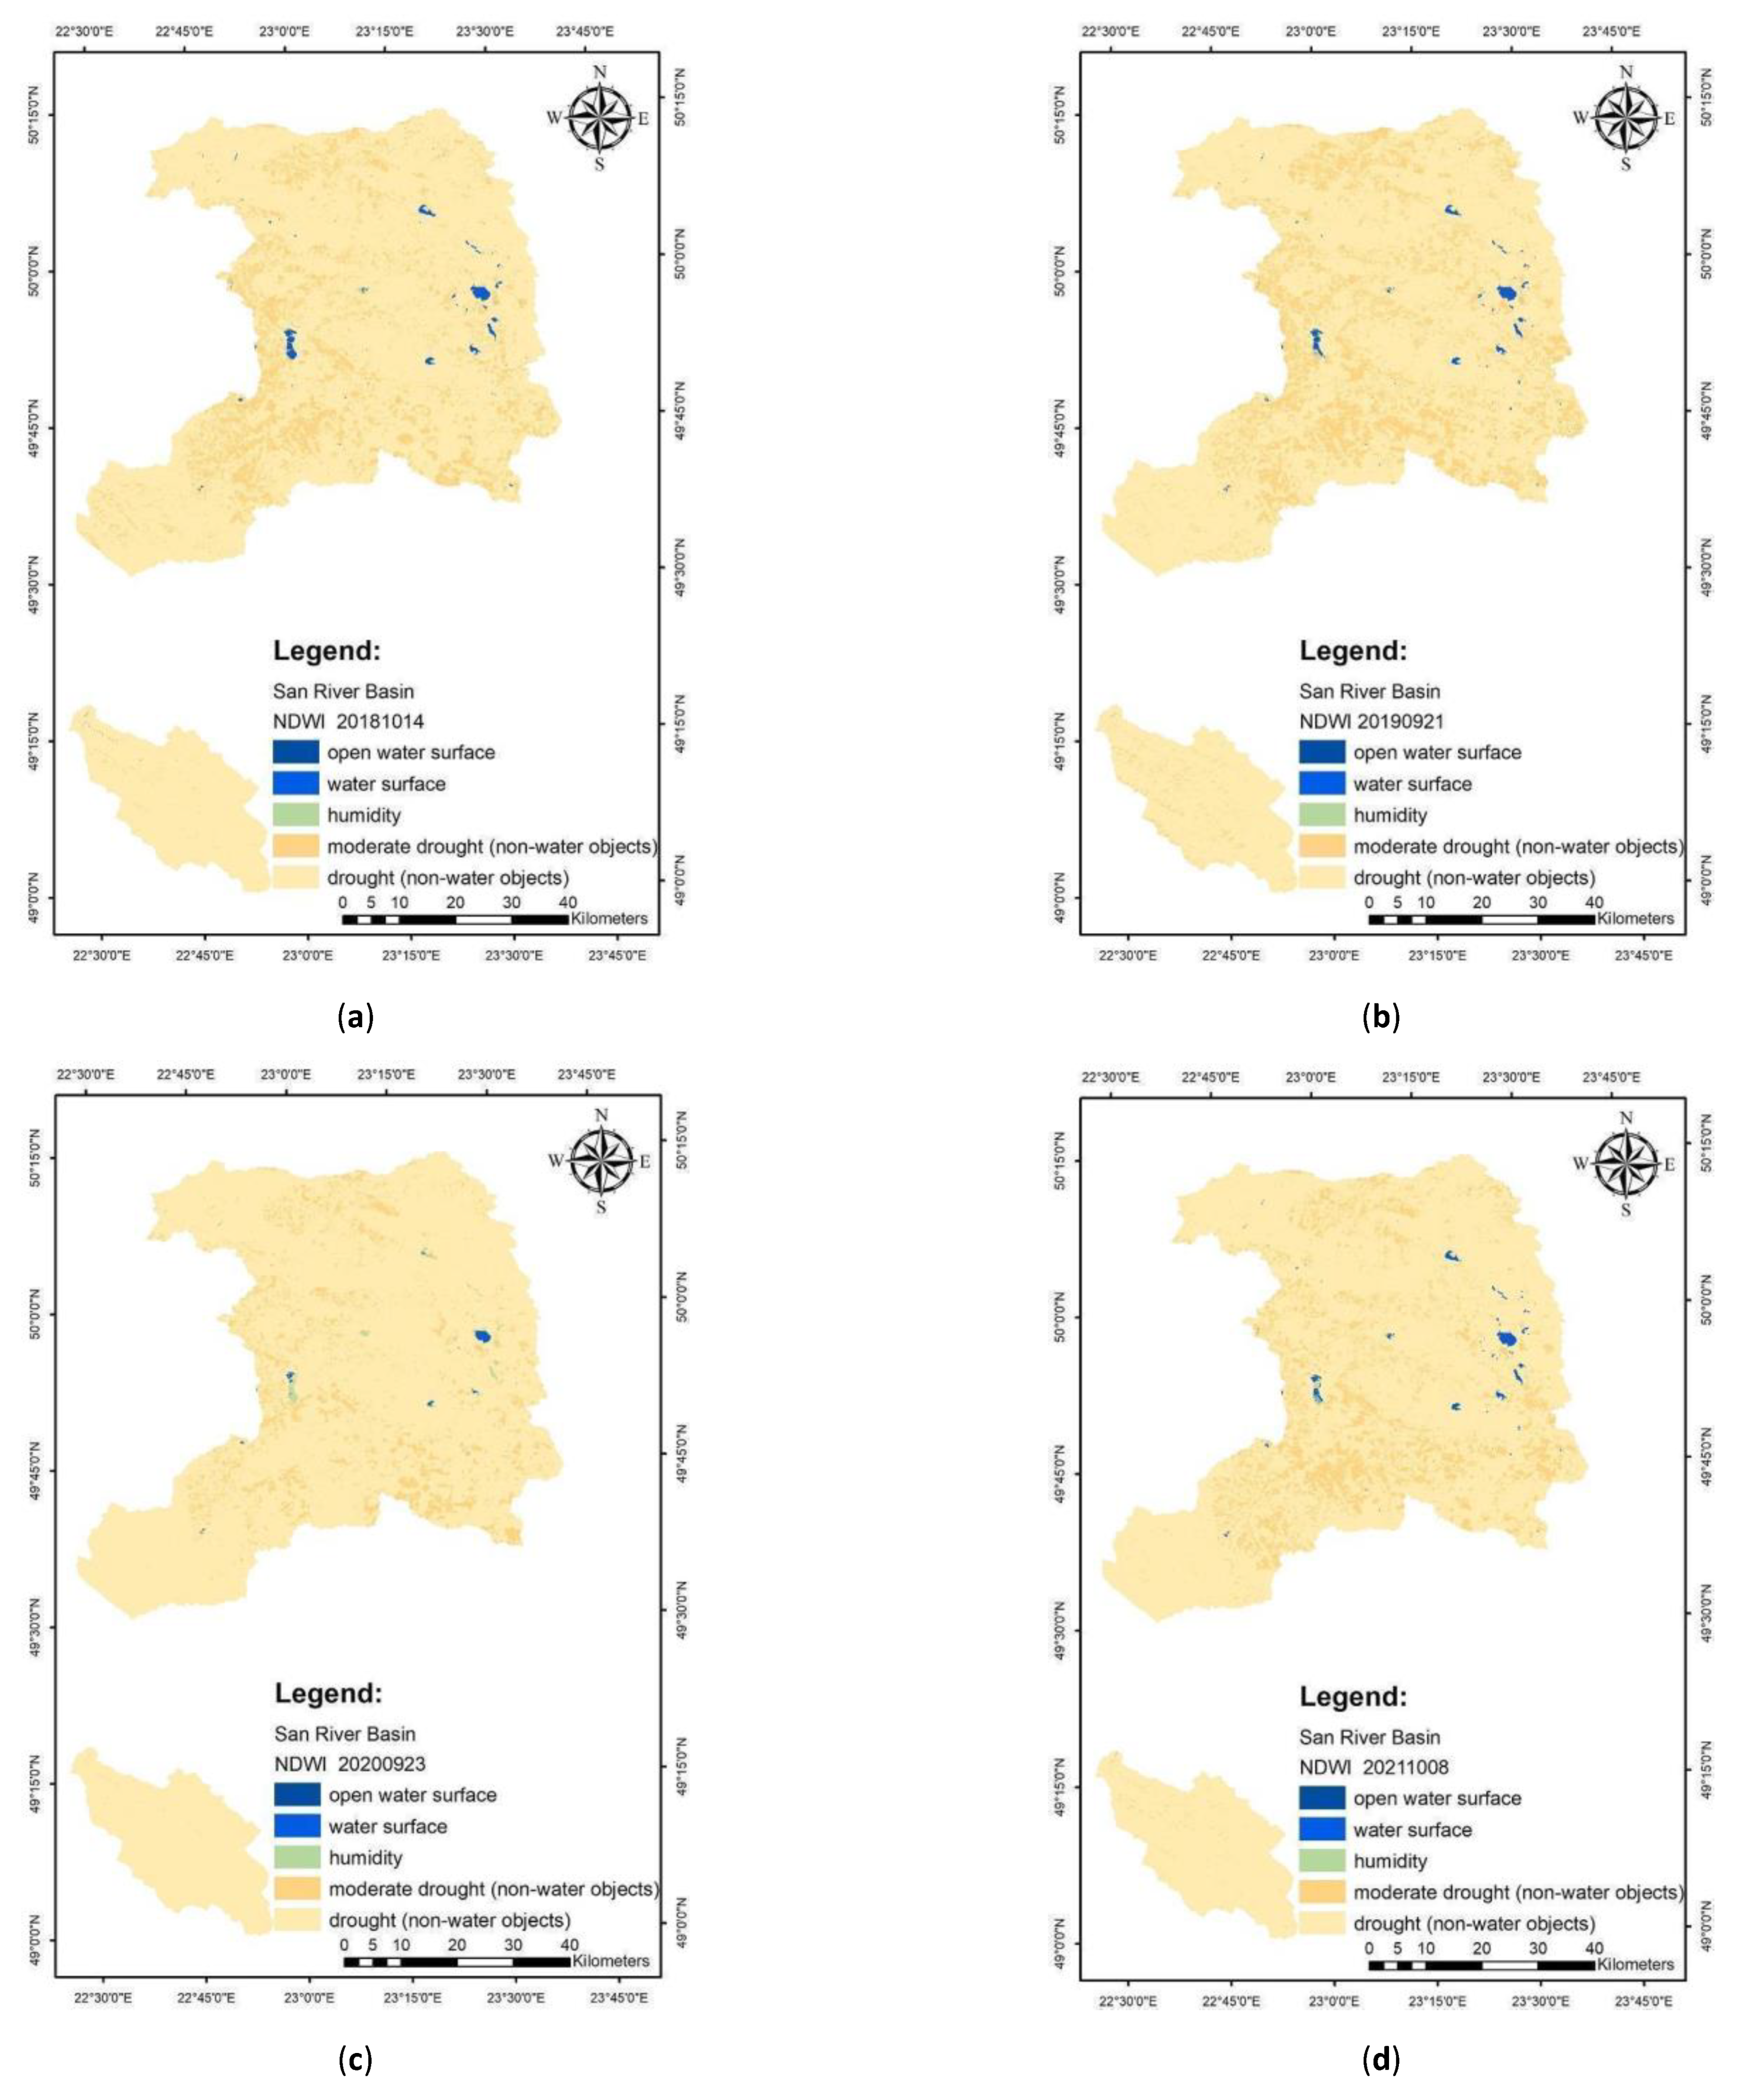
4.3.2. The Identification of the Water Surface of the San River Basin Using Multispectral Data: NDWI with MLC Classification
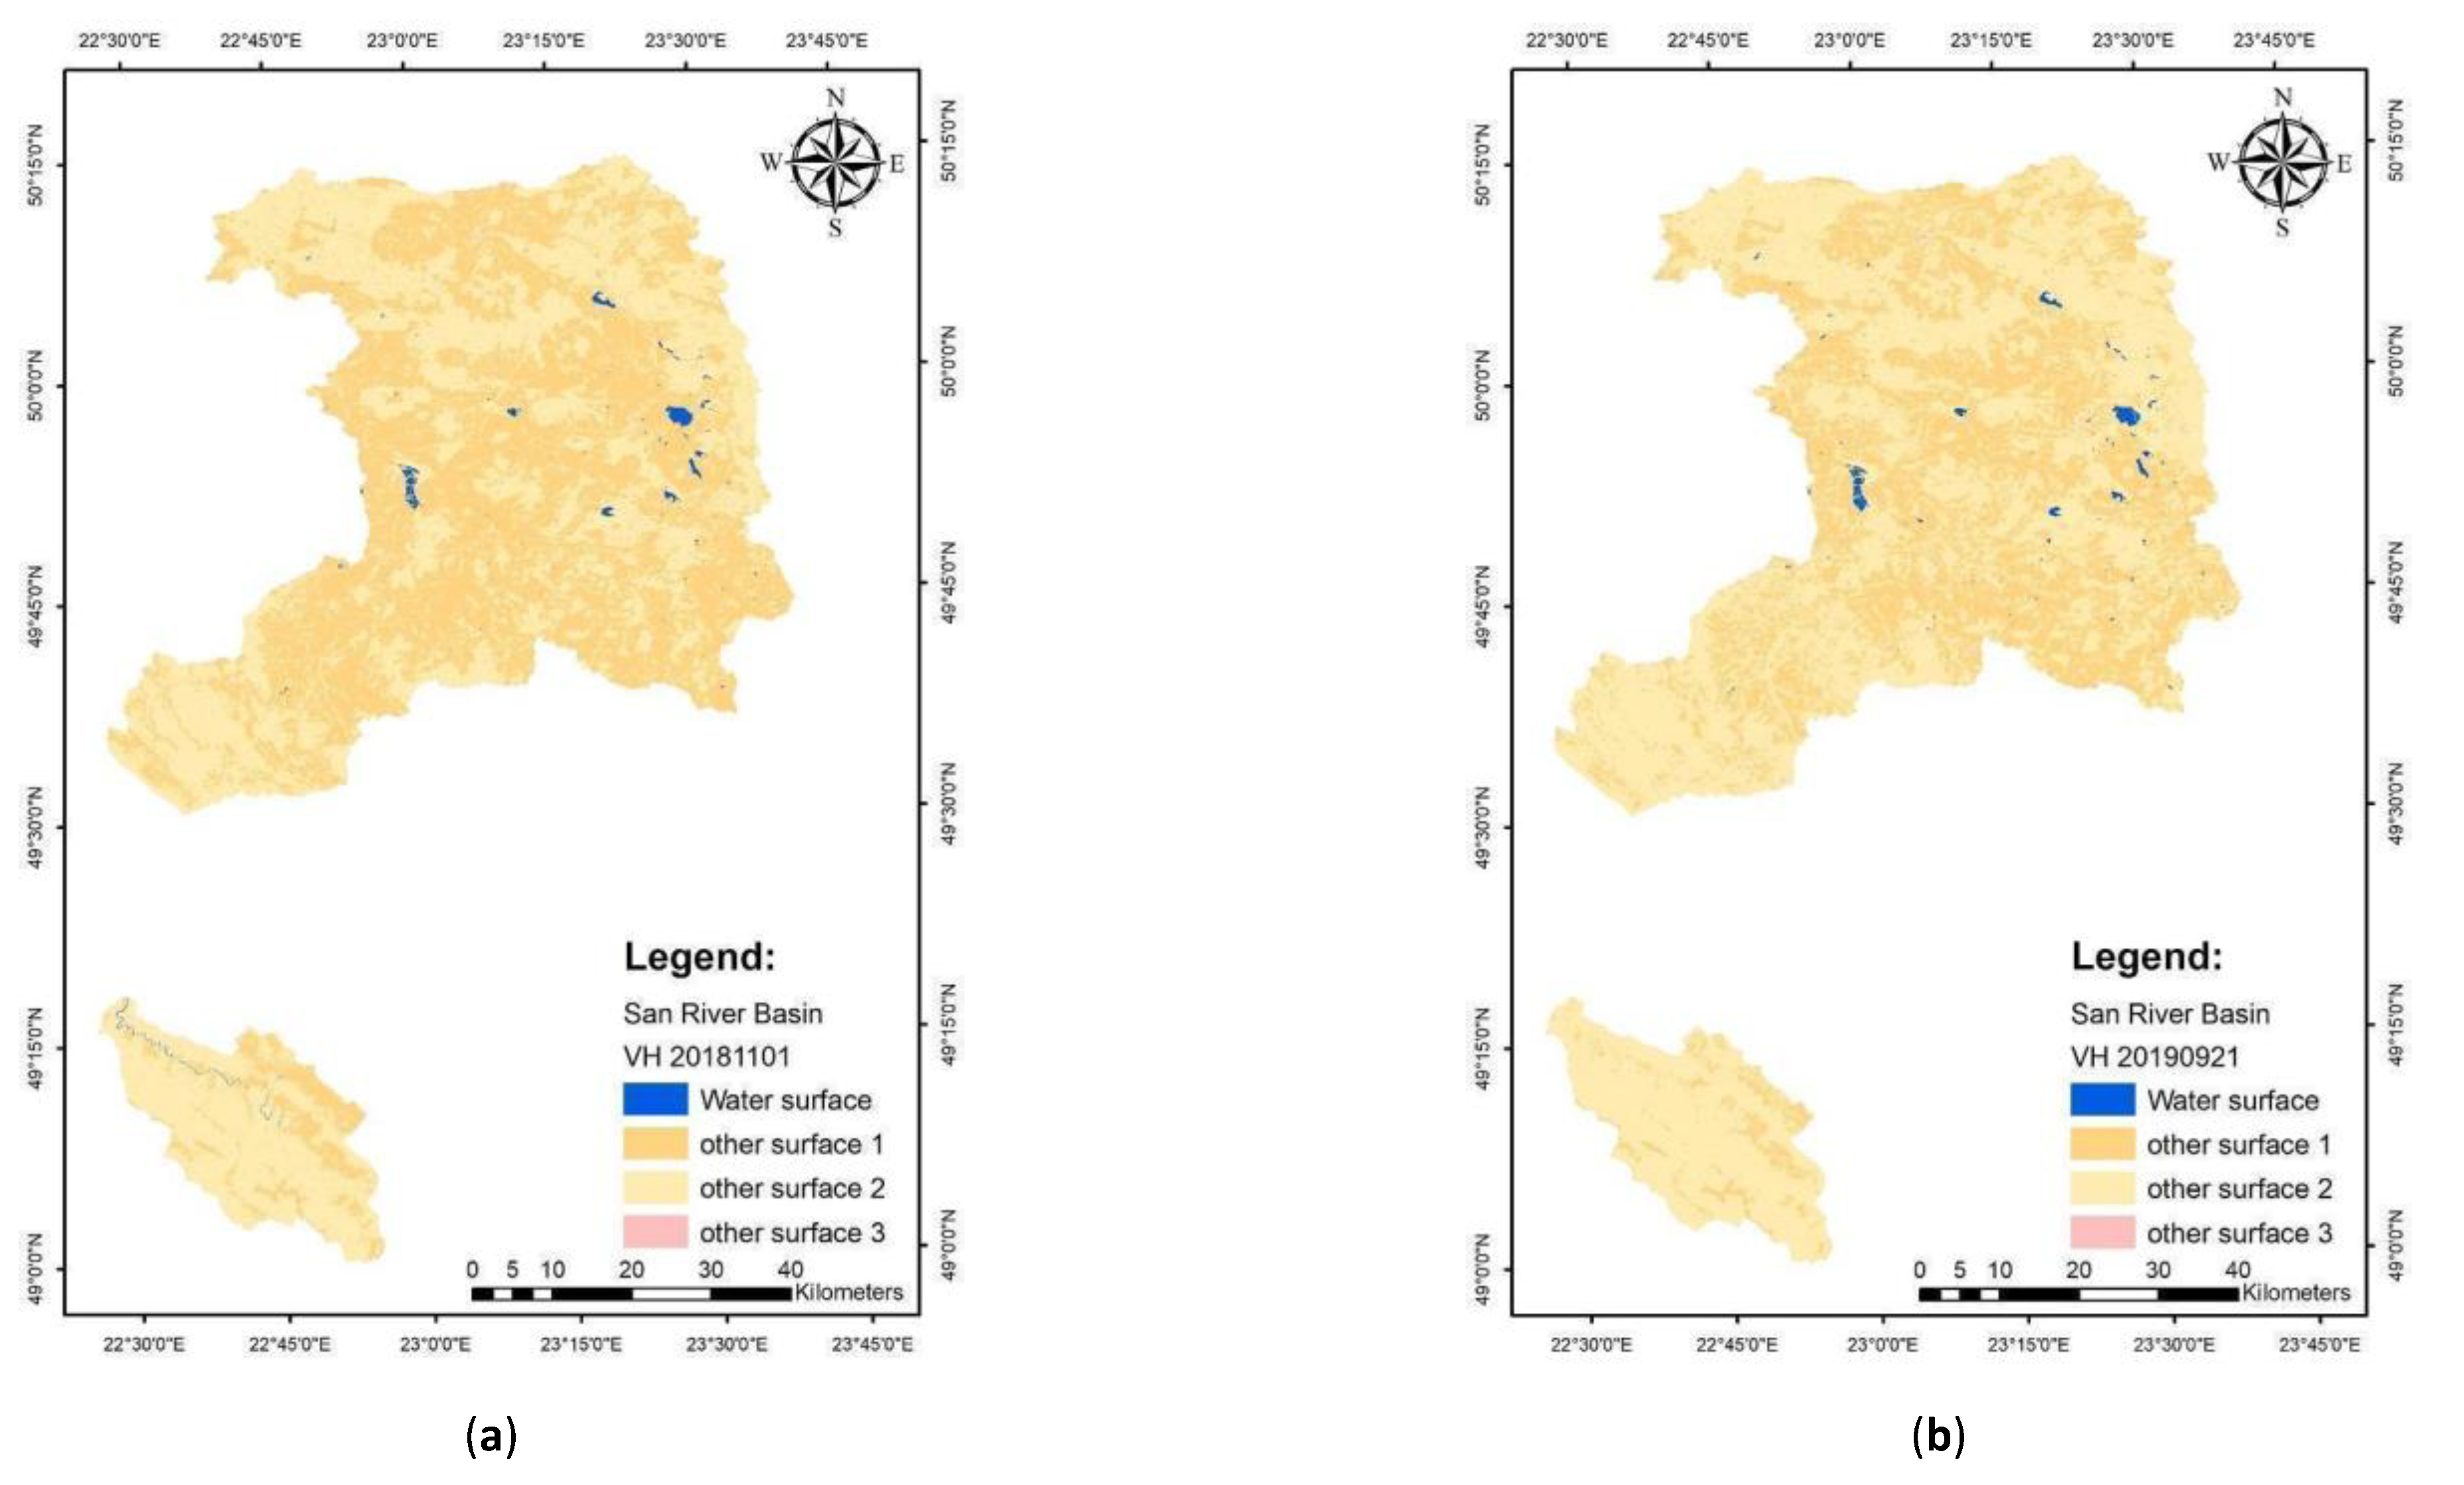
4.3.3. The Identification of the Water Surface of the San River Basin Using SAR Data: VH Polarization with MLC Classification
5. Discussion
6. Conclusions
Author Contributions
Funding
Data Availability Statement
Conflicts of Interest
References
- Marzi, D.; Gamba, P. Inland water body mapping using multitemporal Sentinel-1 SAR data. IEEE J. Sel. Top. Appl. Earth Obs. Remote Sens. 2021, 14, 11789–11799. [Google Scholar] [CrossRef]
- Jiang, H.; Wang, M.; Hu, H.; Xu, J. Evaluating the performance of Sentinel-1A and Sentinel-2 in small waterbody mapping over urban and mountainous regions. Water 2021, 13, 945–960. [Google Scholar] [CrossRef]
- Kseˇnak, L’.; Pukanská, K.; Bartoš, K.; Blišt’an, P. Assessment of the usability of SAR and optical satellite data for monitoring spatio-temporal changes in surface water: Bodrog river case study. Water 2022, 14, 299. [Google Scholar] [CrossRef]
- Shen, G.; Fu, W.; Guo, H.; Liao, J. Water body mapping using long time series Sentinel-1 SAR data in Poyang Lake. Water 2022, 14, 1902. [Google Scholar] [CrossRef]
- Tian, H.; Li, W.; Wu, M.; Huang, N.; Li, G.; Li, X.; Niu, Z. Dynamic monitoring of the largest Freshwater Lake in China using a new water index derived from high spatiotemporal resolution Sentinel-1A data. Remote Sens. 2017, 9, 521–528. [Google Scholar] [CrossRef]
- Kumar, D. Urban objects detection from C-band synthetic aperture radar (SAR) satellite images through simulating filter properties. Sci. Rep. 2021, 11, 1–24. [Google Scholar] [CrossRef] [PubMed]
- Abdikan, S.; Sanli, F.B.; Ustuner, M.; Calò, F. Land cover mapping using Sentinel-1 SAR data. In Proceedings of the International Archives of the Photogrammetry, Remote Sensing and Spatial Information Sciences, XXIII ISPRS Congress, Prague, Czech Republic, 12–19 July 2016. [Google Scholar] [CrossRef]
- Yesou, H.; Pottier, E.; Mercier, G.; Grizonnet, M.; Haouet, S.; Giros, A.; Faivre, R.; Huber, C.; Michel, J. Synergy of Sentinel-1 and Sentinel-2 imagery for wetland monitoring information extraction from continuous flow of sentinel images applied to water bodies and vegetation mapping and monitoring. In Proceedings of the Conference: IGARSS 2016—IEEE International Geoscience and Remote Sensing, Beijing, China, 10–15 July 2016. [Google Scholar] [CrossRef]
- Luca, G.D.; Silva, J.M.N.; Fazio, S.D.; Modica, G. Integrated use of Sentinel-1 and Sentinel-2 data and open-source machine learning algorithms for land cover mapping in a Mediterranean region. Eur. J. Remote Sens. 2022, 55, 52–70. [Google Scholar] [CrossRef]
- Souza, W.d.O.; Reis, L.G.d.M.; Ruiz-Armenteros, A.M.; Veleda, D.; Ribeiro Neto, A.; Fragoso, C.R., Jr.; Cabral, J.J.d.S.P.; Montenegro, S.M.G.L. Analysis of environmental and atmospheric influences in the use of SAR and optical imagery from Sentinel-1, Landsat-8, and Sentinel-2 in the operational monitoring of reservoir water level. Remote Sens. 2022, 14, 2218–2245. [Google Scholar] [CrossRef]
- Jiakun, T.; Shaoxia, X.; Yu, L.; Xiubo, Y.; Houlang, D.; Han, X.; Chuanpeng, Z. Assessing habitat suitability for wintering geese by using Normalized Difference Water Index (NDWI) in a large floodplain wetland, China. Ecol. Indic. 2021, 122, 107260–107268. [Google Scholar] [CrossRef]
- Pal, S.; Sarda, R. Measuring the degree of hydrological variability of riparian wetland using hydrological attributes integration (HAI) histogram comparison approach (HCA) and range of variability approach (RVA). Ecol. Indic. 2021, 120, 106966–106979. [Google Scholar] [CrossRef]
- Khatun, R.; Talukdar, S.; Pal, S.; Kundu, S. Measuring dam induced alteration in water richness and eco-hydrological deficit in flood plain wetland. J. Environ. Manag. 2021, 285, 112157–1121727. [Google Scholar] [CrossRef]
- Kwang, C.; Osei Jnr, M.E.; Sarpong, A.A. Comparing of Landsat 8 and Sentinel 2A using Water Extraction Indexes over Volta River. JGG 2018, 10, 1–7. [Google Scholar] [CrossRef]
- Harapenta Surbakti, A.F.; Oktarina, M.; Putri Firdaus, T.; Ibrahim, M.M. Preliminary investigation of geothermal potential with remote sensing based on satellite imagery: Case study in Air Putih area, Lebong regency, Bengkulu. In Proceedings of the 10th ITB International Geothermal Workshop, Bandung Institute of Technology, Kota Bandung, Indonesia, 26–29 July 2021. [Google Scholar]
- Sekertekin, A. A Survey on global thresholding methods for mapping open water body using Sentinel-2 satellite imagery and Normalized Difference Water Index. Arch. Comput. Method Eng. 2019, 13, 1335–1347. [Google Scholar] [CrossRef]
- Jiang, W.; Ni, Y.; Pang, Z.; Li, X.; Ju, H.; He, G.; Lv, J.; Yang, K.; Fu, J.; Qin, X. An effective water body extraction method with new water index for Sentinel-2 imagery. Water 2021, 13, 1647. [Google Scholar] [CrossRef]
- Du, Y.; Zhang, Y.; Ling, F.; Wang, Q.; Li, W.; Li, X. Water bodies’ mapping from Sentinel-2 imagery with Modified Normalized Difference Water Index at 10-m spatial resolution produced by sharpening the SWIR Band. Remote Sens. 2016, 8, 354–372. [Google Scholar] [CrossRef]
- Kati, I.E.; Nakhcha, C.; Bakhchouch, O.E.; Tabyaoui, H. Application of Aster and Sentinel-2A images for geological mapping in Arid Regions: The Safsafate area in the Neogen Guercif basin, Northern Morocco. IJARSG 2018, 7, 2782–2792. [Google Scholar] [CrossRef]
- Yang, X.; Zhao, S.; Qin, X.; Zhao, N.; Liang, L. Mapping of urban surface water bodies from Sentinel-2 MSI imagery at 10 m resolution via NDWI-based image sharpening. Remote Sens. 2017, 9, 596–614. [Google Scholar] [CrossRef]
- Enea, A.; Urzica, A.; Breaban, I.G. Remote sensing, GIS and HEC-RAS techniques, applied for flood extent validation, based on Landsat imagery, Lidar and hydrological data. Case study: Baseu River, Romania. J. Environ. Prot. Ecol. 2018, 19, 1091–1101. [Google Scholar]
- Vera-Herrera, L.; Soria, J.; Pérez, J.; Romo, S. Long-term hydrological regime monitoring of a mediterranean agro-ecological wetland using Landsat imagery: Correlation with the water renewal rate of a Shallow Lake. J. Hydrol. 2021, 172, 1–21. [Google Scholar] [CrossRef]
- Das, S. Characterization of surface geological material in Northwest India and adjoining areas of Pakistan using Normalized Difference Water Index, land surface temperature and silica index. J. Indian Soc. Remote Sens. 2018, 46, 1645–1656. [Google Scholar] [CrossRef]
- Ji, L.; Zhang, L.; Wylie, B. Analysis of dynamic thresholds for the Normalized Difference Water Index. Photogramm. Eng. Remote Sens. 2009, 75, 1307–1317. [Google Scholar] [CrossRef]
- Ali, M.I.; Dirawan, G.D.; Hasim, A.H.; Abidin, M.R. Detection of changes in surface water bodies urban area with NDWI and MNDWI methods. Int. J. Adv. Sci. Eng. Inf. Technol. 2019, 9, 946–951. [Google Scholar] [CrossRef]
- Feyisa, G.L.; Meilby, H.; Fensholt, R.; Proud, S.R. Automated Water Extraction Index: A new technique for surface water mapping using Landsat imagery. Remote Sens. Enivon. 2014, 140, 23–35. [Google Scholar] [CrossRef]
- Rokni, K.; Ahmad, A.; Selamat, A.; Hazini, S. Water feature extraction and change detection using multitemporal landsat imagery. Remote Sens. 2014, 6, 4173–4189. [Google Scholar] [CrossRef]
- Ko, B.C.; Kim, H.H.; Nam, J.Y. Classification of potential water bodies using landsat 8 OLI and a combination of two boosted random forest classifiers. Sensors 2015, 15, 13763–13777. [Google Scholar] [CrossRef] [PubMed]
- Dash, P.; Sar, J. Identification and validation of potential flood hazard area using GIS-based multi-criteria analysis and satellite data-derived water index. J. Flood Risk Manag. 2020, 13, 1–14. [Google Scholar] [CrossRef]
- Reshitnyk, L.; Costa, M.; Robinson, C.; Dearden, P. Evaluation of WorldView-2 and acoustic remote sensing for mapping benthic habitats in temperate coastal Pacific waters. Remote Sens. 2014, 153, 7–23. [Google Scholar] [CrossRef]
- Sunder, S.; Ramsankaran, R.; Ramakrishnan, B. Inter-comparison of remote sensing sensing-based shoreline mapping techniques at different coastal stretches of India. Environ. Monit. Assess. 2017, 189, 290–302. [Google Scholar] [CrossRef] [PubMed]
- Mustafa, M.T.; Hassoon, K.I.; Hussain, H.M.; Modher, H. Using water indices (NDWI, MNDWI, NDMI, WRI AND AWEI) to detect physical and chemical parameters by apply remote sensing and Gis techniques. Int. J. Res. Granthaalayah 2017, 5, 117–128. [Google Scholar] [CrossRef]
- Lai, X.; Shankman, D.; Huber, C.; Yesou, H.; Huang, Q.; Jiang, J. Sand mining and increasing Poyang Lake’s discharge ability: A reassessment of causes for lake decline in China. J. Hydrol. 2014, 519, 1698–1706. [Google Scholar] [CrossRef]
- Tran, H.; Nguyen, P.; Ombadi, M.; Hsu, K.; Sorooshian, S.; Andreadis, K. Improving hydrologic modeling using cloud-free MODIS flood maps. J. Hydrometeorol. 2019, 20, 2203–2214. [Google Scholar] [CrossRef]
- Hancock, S.; Baxter, R.; Evans, J.; Huntley, B. Evaluating global snow water equivalent products for testing land surface models. Remote Sens. 2013, 128, 107–117. [Google Scholar] [CrossRef]
- Lee, H.; Yuan, T.; Jung, H.C.; Beighley, E. Mapping wetland water depths over the central Congo Basin using PALSAR ScanSAR, Envisat altimetry, and MODIS VCF data. Remote Sens. 2015, 159, 70–79. [Google Scholar] [CrossRef]
- Feng, L.; Hu, C.; Chen, X.; Cai, X.; Tian, L.; Gan, W. Assessment of inundation changes of Poyang Lake using MODIS observations between 2000 and 2010. Remote Sens. 2012, 121, 80–92. [Google Scholar] [CrossRef]
- Wu, G.; Liu, Y. Capturing variations in inundation with satellite remote sensing in a morphologically complex, large lake. J. Hydrol. 2015, 523, 14–23. [Google Scholar] [CrossRef]
- Feng, L.; Hub, C.; Chen, X.; Song, Q. Influence of the Three Gorges Dam on total suspended matters in the Yangtze Estuary and its adjacent coastal waters: Observations from MODIS. Remote Sens. 2014, 140, 779–788. [Google Scholar] [CrossRef]
- Melnichenko, T. Remote research of geotectonic processes using the satellites MODIS (Aqua/Terra) images in the GIS program (for example, the Black Sea). In Proceedings of the 17th International Conference on Geoinformatics—Theoretical and Applied Aspects, EAGE, Kiev, Ukraine, 14–17 May 2018. [Google Scholar] [CrossRef]
- Melnichenko, T. Estimation of activity the methane seepage from the Black Sea floor using MODIS images and geosciences data. J. Geol. Geogr. Geoecology 2018, 26, 135–142. [Google Scholar] [CrossRef]
- Hou, X.; Feng, L.; Duan, H.; Chen, X.; Sunc, D.; Shi, K. Fifteen-year monitoring of the turbidity dynamics in large lakes and reservoirs in the middle and lower basin of the Yangtze River, China. Remote Sens. 2017, 190, 107–121. [Google Scholar] [CrossRef]
- Gu, Y.; Brown, J.F.; Verdin, J.P.; Wardlow, B. A five-year analysis of MODIS NDVI and NDWI for grassland drought assessment over the central Great Plains of the United States. Geophys. Res. Lett. 2007, 34, 407–412. [Google Scholar] [CrossRef]
- Chen, F.; Chen, X.; Van de Voorde, T.; Roberts, D.; Jiang, H.; Xu, W. Open water detection in urban environments using high spatial resolution remote sensing imagery. Remote Sens. 2020, 242, 111706–111722. [Google Scholar] [CrossRef]
- Rahman, M.R.; Thakur, P.K. Detecting, mapping and analysing of flood water propagation using synthetic aperture radar (SAR) satellite data and GIS: A case study from the Kendrapara District of Orissa State of India. Egypt. J. Remote Sens. Space Sci. 2018, 21, 37–41. [Google Scholar] [CrossRef]
- Chapman, B.; McDonald, K.; Shimada, M.; Rosenqvist, A.; Schroeder, R.; Hess, L. Mapping regional inundation with spaceborne L-Band SAR. Remote Sens. 2015, 7, 5440–5470. [Google Scholar] [CrossRef]
- Bolanos, S.; Stiff, D.; Brisco, B.; Pietroniro, A. Operational surface water detection and monitoring using Radarsat 2. Remote Sens. 2016, 8, 285–302. [Google Scholar] [CrossRef]
- Evans, T.L.; Costa, M. Landcover classification of the Lower Nhecolândia subregion of the Brazilian Pantanal Wetlands using ALOS/PALSAR, RADARSAT-2 and ENVISAT/ASAR imagery. Remote Sens. 2013, 128, 118–137. [Google Scholar] [CrossRef]
- Scott, K.A.; Buehner, M.; Caya, A.; Carrieres, T. A preliminary evaluation of the impact of assimilating AVHRR data on sea iceconcentration analyses. Remote Sens. 2013, 128, 212–223. [Google Scholar] [CrossRef]
- Szombara, S.; Lewi´nska, P.; Zadło, A.; Róg, M.; Maciuk, K. Analyses of the pradnik riverbed shape based on archival and contemporary data sets—Old maps, LiDAR, DTMs, orthophotomaps and cross-sectional profile measurements. Remote Sens. 2020, 12, 2208–2237. [Google Scholar] [CrossRef]
- Dronova, I.; Gong, P.; Wang, L.; Zhong, L. Mapping dynamic cover types in a large seasonally floodedwetland using extended principal component analysis and object-based classification. Remote Sens. 2015, 158, 193–206. [Google Scholar] [CrossRef]
- Wilusz, D.C.; Zaitchik, B.F.; Andersonc, M.C.; Hain, C.R.; Yilmaz, M.T.; Mladenova, I.E. Monthly flooded area classification using low resolution SAR imagery in the Sudd wetland from 2007 to 2011. Remote Sens. 2017, 194, 205–218. [Google Scholar] [CrossRef]
- Gao, B.-C. NDWI—A normalized difference water index for remote sensing of vegetation liquid water from space. Remote Sens. Enivon. 1996, 58, 257–266. [Google Scholar] [CrossRef]
- Solovey, T.; Janica, R.; Przygodzka, M.; Harasymchuk, V.; Medvid, H. Geological and hydrogeological conditions of the PL-UA borderland. In Assessment of the Resources of Transboundary Groundwater Reservoirs for the 2 Pilot Areas; Solovey, T., Harasymchuk, V., Eds.; PGI-NRI: Warsaw, Poland, 2021; pp. 28–36. (In Polish) [Google Scholar] [CrossRef]
- Solovey, T.; Janica, R.; Harasymchuk, V.; Przychodzka, M.; Medvid, H.; Yanush, L. Transboundary groundwater flows between Poland and Ukraine: The role of join assessments and international frameworks on water resources management. Ecohydrol. Hydrobiol. 2022; in print. [Google Scholar]







| Band | Description | Resolution (m) | Central Wavelength (µm) | Wavelength (µm) |
|---|---|---|---|---|
| Band 1 | Coastal Aerosol | 60 | 0.443 | 0.433–0.453 |
| Band 2 | Blue | 10 | 0.490 | 0.4575–0.5225 |
| Band 3 | Green | 10 | 0.560 | 0.5425–0.5775 |
| Band 4 | Red | 10 | 0.665 | 0.65–0.68 |
| Band 5 | Vegetation Red Edge | 20 | 0.705 | 0.6975–0.7125 |
| Band 6 | Vegetation Red Edge | 20 | 0.705 | 0.7325–0.7475 |
| Band 7 | Vegetation Red Edge | 20 | 0.783 | 0.773–0.793 |
| Band 8 | NIR | 10 | 0.842 | 0.7845–0.8995 |
| Band 8-А | Narrow NIR | 20 | 0.865 | 0.855–0.875 |
| Band 9 | Water Vapor | 60 | 0.945 | 0.935–0.955 |
| Band 10 | SWIR-Cirrus | 60 | 1.380 | 1.36–1.39 |
| Band 11 | SWIR | 20 | 1.610 | 1.565–1.655 |
| Band 12 | SWIR | 20 | 2.190 | 2.1–2.28 |
| Data Product (Sensing Date) | Processing Data | Spatial Resolution | S Water Surface, Thousand km2 | PA Water Surface | UA Water Surface | OA | Kappa % |
|---|---|---|---|---|---|---|---|
| S2B_MSIL1C 2018.10.14 | RGB:11, 8, 2 + MLC | 20 m | 92.56 | 1.0 | 0.84 | 0.88 | 84.95 |
| S2B_MSIL1C 2018.10.14 | NDWI + MLC | 10 m | 76.45 | 0.87 | 1.0 | 0.90 | 85.88 |
| S1B_IW_GRDH_1SDV 2018.10.11 | VH + Filters + MLC | 10 m | 76.78 | 1.0 | 0.94 | 0.94 | 88.84 |
| Product Data (Sensing Date) | Spatial Resolution | S Water Surface, thousand km2 | PA Water Surface | UA Water Surface | OA | Kappa % |
|---|---|---|---|---|---|---|
| S2B_MSIL1C_ 2018.10.14 | 10 m | 102.24 | 0.87 | 1.0 | 0.91 | 85.88 |
| S2B_MSIL1C_ 2019.09.24. | 10 m | 99.82 | 0.73 | 0.96 | 0.9 | 79.54 |
| S2B_MSIL1C_ 2020.09.23. | 10 m | 98.38 | 0.72 | 1.0 | 0.84 | 76.71 |
| S2B_MSIL1C_ 2021.10.05. | 10 m | 102.58 | 0.75 | 0.92 | 0.86 | 79.86 |
| Product Data (Sensing Date) | Spatial Resolution | S Water Surface, thousand km2 | PA Water Surface | UA Water Surface | OA | Kappa % |
|---|---|---|---|---|---|---|
| S1B_IW_GRDH_1SDV_ 2018.10.11 | 10 m | 109.31 | 1.0 | 0.93 | 0.95 | 93.37 |
| S1B_IW_GRDH_1SDV_ 2019.09.21. | 10 m | 107.41 | 1.0 | 0.87 | 0.93 | 90.52 |
| S1B_IW_GRDH_1SDV_ 2020.09.27. | 10 m | 107.01 | 0.94 | 1.0 | 0.91 | 87.61 |
| S1B_IW_GRDH_1SDV_ 2021.10.04. | 10 m | 108.37 | 1.0 | 0.94 | 0.95 | 93.43 |
| Product Data (Sensing Date) | Spatial Resolution | S Water Surface, thousand km2 | PA Water Surface | UA Water Surface | OA | Kappa % |
|---|---|---|---|---|---|---|
| S2B_MSIL1C_ 2018.10.14. | 10 m | 21.05 | 0.9 | 1.0 | 0.91 | 87.25 |
| S2B_MSIL1C_ 2019.10.14. | 10 m | 19.72 | 0.8 | 0.8 | 0.88 | 83.03 |
| S2B_MSIL1C_ 2020.09.10. | 10 m | 18.18 | 0.8 | 1.0 | 0.85 | 79.76 |
| S2B_MSIL1C_ 2021.08.10. | 10 m | 19.46 | 0.86 | 1.0 | 0.88 | 82.61 |
| Product Data (Sensing Date) | Spatial Resolution | S Water Surface, thousand km2 | PA Water Surface | UA Water Surface | OA | Kappa % |
|---|---|---|---|---|---|---|
| S1B_IW_GRDH_1SDV_ 2018.10.16. | 10 m | 20.75 | 1.0 | 0.94 | 0.98 | 97.18 |
| S1B_IW_GRDH_1SDV_ 2019.09.21. | 10 m | 20.52 | 1.0 | 1.0 | 0.96 | 94.9 |
| S1B_IW_GRDH_1SDV_ 2020.09.27. | 10 m | 22.86 | 1.0 | 1.0 | 0.93 | 91.41 |
| S1B_IW_GRDH_1SDV_ 2021.10.04. | 10 m | 19.17 | 0.88 | 1.0 | 0.96 | 95.17 |
| Product Data (Sensing Date) | Spatial Resolution | S Water Surface, thousand km2 | PA Water Surface | UA Water Surface | OA | Kappa % |
|---|---|---|---|---|---|---|
| S2B_MSIL1C_ 2018.10.14. | 10 m | 24.59 | 0.7 | 1.0 | 0.82 | 77.05 |
| S2B_MSIL1C_ 2019.10.14. | 10 m | 22.42 | 0.7 | 1.0 | 0.82 | 84.15 |
| S2B_MSIL1C_ 2020.09.21. | 10 m | 20.67 | 0.92 | 1.0 | 0.91 | 88.65 |
| S2B_MSIL1C_ 2021.10.08. | 10 m | 20.47 | 0.83 | 1.0 | 0.82 | 76.28 |
| Product Data (Sensing Date) | Spatial Resolution | S Water Surface, thousand km2 | PA Water Surface | UA Water Surface | OA | Kappa % |
|---|---|---|---|---|---|---|
| S1B_IW_GRDH_1SDV_ 2018.10.16. | 10 m | 23.62 | 1.0 | 1.0 | 0.94 | 92.43 |
| S1B_IW_GRDH_1SDV_ 2019.09.21. | 10 m | 23.14 | 0.98 | 0.93 | 0.94 | 92.87 |
| S1B_IW_GRDH_1SDV_ 2020.09.27. | 10 m | 25.55 | 0.8 | 0.93 | 0.95 | 92.27 |
| S1B_IW_GRDH_1SDV_ 2021.10.04. | 10 m | 25.51 | 1.0 | 0.9 | 0.94 | 91.84 |
Disclaimer/Publisher’s Note: The statements, opinions and data contained in all publications are solely those of the individual author(s) and contributor(s) and not of MDPI and/or the editor(s). MDPI and/or the editor(s) disclaim responsibility for any injury to people or property resulting from any ideas, methods, instructions or products referred to in the content. |
© 2024 by the authors. Licensee MDPI, Basel, Switzerland. This article is an open access article distributed under the terms and conditions of the Creative Commons Attribution (CC BY) license (https://creativecommons.org/licenses/by/4.0/).
Share and Cite
Melnychenko, T.; Solovey, T. Mapping Water Bodies and Wetlands from Multispectral and SAR Data for the Cross-Border River Basins of the Polish–Ukrainian Border. Water 2024, 16, 407. https://doi.org/10.3390/w16030407
Melnychenko T, Solovey T. Mapping Water Bodies and Wetlands from Multispectral and SAR Data for the Cross-Border River Basins of the Polish–Ukrainian Border. Water. 2024; 16(3):407. https://doi.org/10.3390/w16030407
Chicago/Turabian StyleMelnychenko, Tetiana, and Tatiana Solovey. 2024. "Mapping Water Bodies and Wetlands from Multispectral and SAR Data for the Cross-Border River Basins of the Polish–Ukrainian Border" Water 16, no. 3: 407. https://doi.org/10.3390/w16030407
APA StyleMelnychenko, T., & Solovey, T. (2024). Mapping Water Bodies and Wetlands from Multispectral and SAR Data for the Cross-Border River Basins of the Polish–Ukrainian Border. Water, 16(3), 407. https://doi.org/10.3390/w16030407


