Abstract
Land use changes, specifically the growth of impervious areas due to urbanization, exacerbate non-point-source pollutants in stormwater runoff, surpassing discharge from point sources in Korea. The application of nature-based solutions, such as constructed wetlands (CWs), is becoming popular for stormwater treatment, but challenges arise when background concentrations are overlooked, leading to reduced pollutant removal efficiency. This study aims to propose a plan for the sustainability of CWs by evaluating design appropriateness and utilizing existing monitoring results. The evaluation of 63 CWs reveals that meteorological factors, specifically antecedent dry days and rainfall depth, have significant impacts on urban stormwater runoff quality in various land uses, affecting the performance of CWs. Designing CWs considering land use is crucial due to the considerable concentration variations across different land uses. Improving CW performance requires proper maintenance strategies to ensure effective pollutant removal mechanisms, especially for poorly degradable organic substances post treatment. Rainfall characteristics play a pivotal role in CW design and operation, affecting capacity, efficiency estimation, and maintenance frequency. Considering various factors such as land use, watershed characteristics, and ease of maintenance is essential when utilizing CWs. This study’s findings contribute to the design and operation of future CWs, emphasizing the need for continuous performance analyses through long-term monitoring.
1. Introduction
Land use and land use changes resulting in increases in impervious areas due to urbanization have amplified the runoff of non-point-source (NPS) pollutants from stormwater into rivers during storm events, leading to water quality deterioration [1,2,3,4]. Unlike point source pollution, NPS pollution varies depending on diverse land characteristics, land use, and land cover affected by different anthropogenic activities, resulting in difficulty in managing NPS pollution due to its unidentified pathways. In Korea, the volumes of the national discharge of water pollutants recorded in 2020 were 1035 tons (67.7% of the total national discharge) and 73.1 tons (72.1% of the total national discharge) for biochemical oxygen demand (BOD) and total phosphorus (TP), respectively, and amounts of NPS pollutants were found to be two times more than point sources [5]. Developed countries are promoting different NPS pollution management policies by establishing comprehensive measures to solve the emerging problem brought by NPS pollutants. These measures include the application of NPS management methods and technologies since the type of pollutant varies depending on land use type.
Pollutants, including organic and inorganic fertilizers, pesticides, and herbicides, generated in rural and livestock areas are emitted by different agricultural activities [6,7,8,9]. NPS pollutants are discharged through pesticide residues, excess fertilizers, and livestock manure used for agricultural activities. Particularly, nitrogen (N) and phosphorus (P) emissions from pesticides in agricultural areas are bio-toxic when exposed and bioaccumulate in the environment, affecting humans [10,11].
Previous studies revealed that N and P from agricultural runoff ae bio-toxic when exposed to the environment and harmful to humans after bioaccumulation [12,13]. Nitrogen and phosphorus come from agricultural fertilizers, human and livestock waste, and synthetic detergents. When such pollutants enter waterways, including rivers and dams, in large quantities, they cause eutrophication, coastal red tides, fish toxins from ammonia, and dissolved oxygen deficiency in water. In urban areas, NPS pollutants are commonly emitted by human activities (transportation, housing, etc.). Emissions of heavy metals such as lead, zinc, cadmium, copper, and arsenic from automobile activities (brake pads, self-corrosion, part wear, etc.) were noted in high amounts by previous studies and were found to be detrimental to ecosystem health [14,15,16].
To address the negative impacts of land use changes and various NPS pollutants on runoff quality, stormwater treatment technologies have been developed in urban and rural areas. However, there has recently been a growing interest in the application of nature-based solutions (NbSs) to mitigate stormwater pollution in cities. The application of NbSs is expanding in various regions and sectors due to their low cost and sustainability. Conventional sewage treatment systems have very high treatment efficiencies, but the cost of operating and maintaining these facilities is also very high, making it difficult to establish small-scale facilities in terms of sustainability and cost. Constructed wetlands (CWs) contribute to water management by using ecosystem services, particularly preserving and improving ecosystems and transforming artificial ecosystems into natural ecosystems [17]. Therefore, CWs, as NbSs in the water and wastewater sectors, are gaining ground due to their sustainability and adaptability to various land uses [18,19,20].
CWs are nature-based solutions that can provide various ecosystem service effects such as NPS pollution reduction, carbon sequestration, and green space expansion through biological, chemical, and physical removal mechanisms. In addition, CWs provide ecosystem services through their regulatory (climate change, flood reduction, water quality improvement, etc.), cultural (leisure space, aesthetic stability, ecotourism, ecological education, etc.), and support functions (water cycle, material cycle, etc.) [21,22,23,24].
Recently, different CW mechanisms with various types of vegetation have been applied. However, in general, NbSs are applied without considering the background concentration when constructing CWs. In such cases, discharges containing high concentrations result in low pollutant reduction efficiencies and difficulties in operation for CWs [25,26,27]. To ensure the sustainability of these CWs, it is essential to evaluate the appropriateness of the design of the facilities.
Despite the efforts of the Korean Ministry of Environment to consistently conducting annual rainfall monitoring and field surveys for CWs, there has been a lack of research in establishing a groundwork for maintenance through a suitability assessment of design and operation. Therefore, this study aims to propose a plan to secure the sustainability of the CW performance by utilizing the monitoring results for CWs and reviewing the appropriateness of their design.
2. Materials and Methods
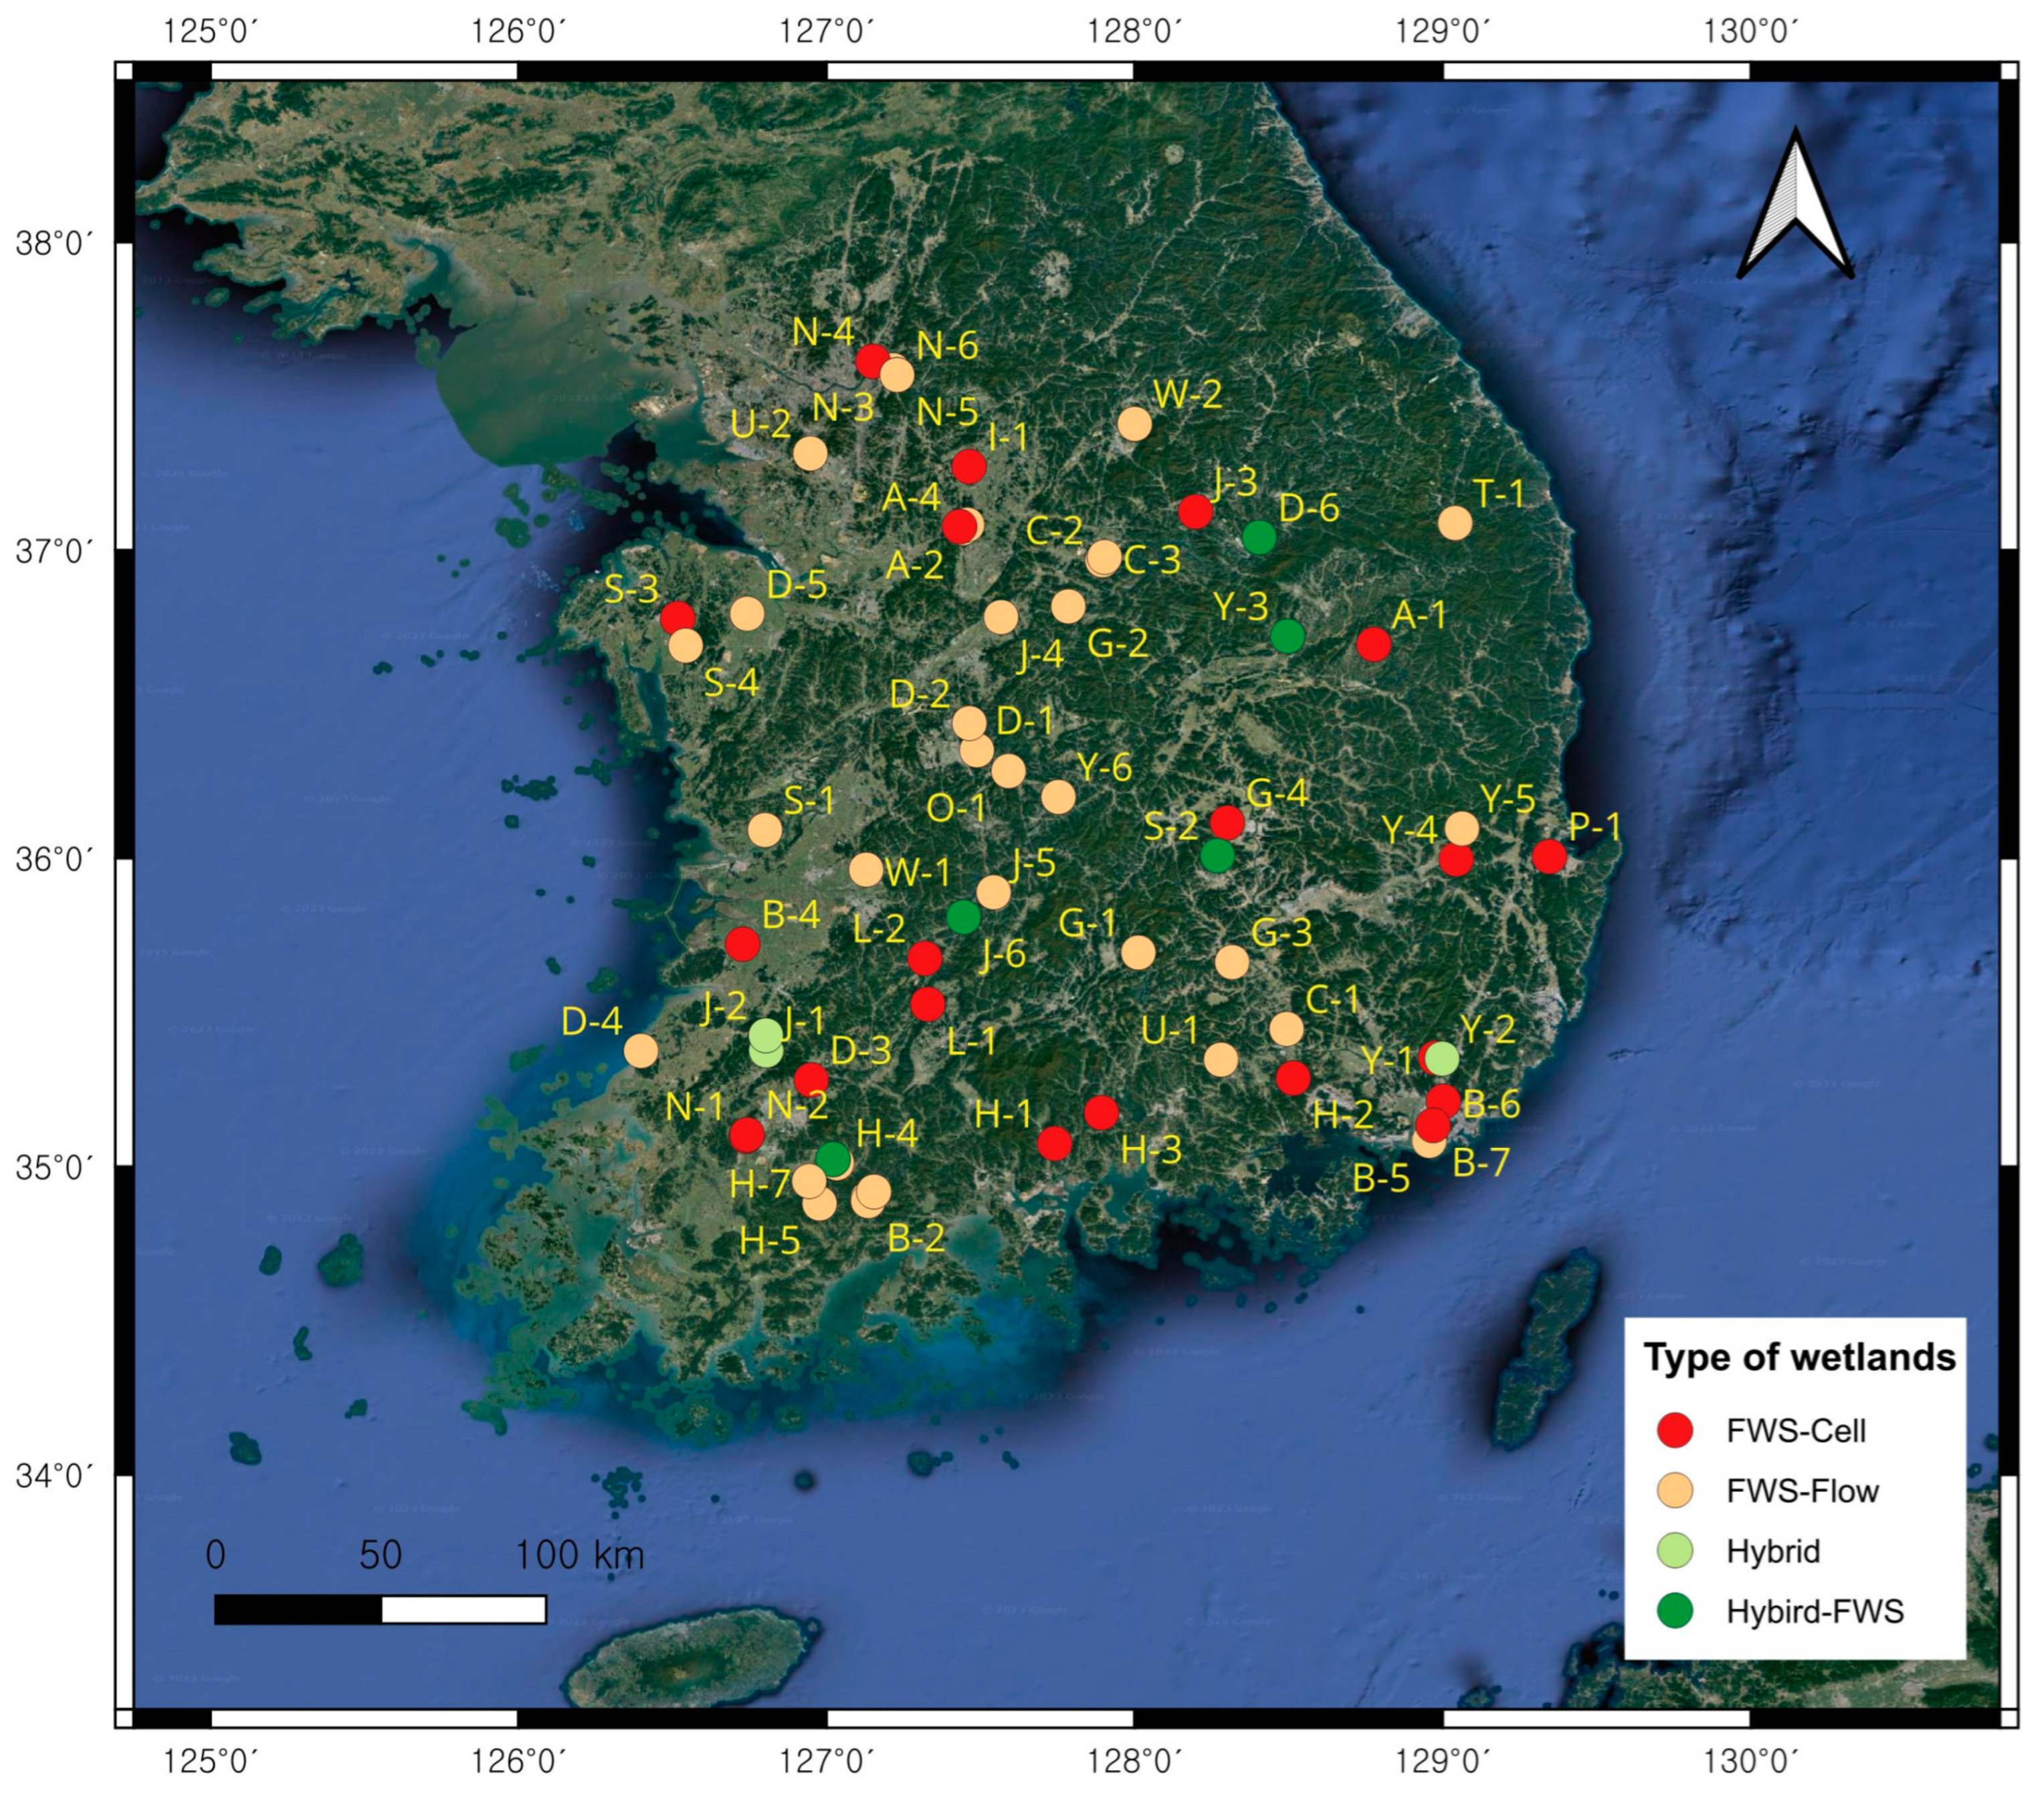
2.1. Site Description
A total of 63 CWs monitored from 2016 to 2022 were analyzed in this study to identify proper measures for improving the management of different CWs in Korea. Korea has a total land area of 1,061,089 km2, 46.5% and 16.6% of which are agricultural and urban areas, respectively Among the monitored CWs, 35, 15, and 13 CWs were developed to manage NPS pollutants from agricultural, urban, and livestock areas, respectively, as exhibited in Figure 1. Detailed characteristics of the CWs monitored in this study are listed in Table 1. These CWs were constructed from 2010 to 2022 with an average catchment area of 4.731 to 6005 ha and an average volume capacity per day ranging from 198 to 60,000 m3/day, designed to treat NPS pollutants from various land use types. Different types of constructed wetlands, including combined cell-type free-water surfaces (Cell-FWSs), flow-type free-water surfaces (Flow-FWSs), hybrid type free-water surfaces (Hybrid-FWSs) and hybrid constructed wetlands (Hybrids), were designed in different parts of Korea. The configuration and description of the CWs monitored in this study were described by Choi et al., 2021 [5].
Figure 1.
Locations of the constructed wetlands monitored in this study.
Table 1.
Summary of constructed wetland characteristics in this study.
2.2. Monitoring and Data Analyses
2.2.1. Water Quality and Hydrologic Characteristics Monitoring
Long term and short-term monitoring were conducted in the CWs to properly assess the operation and performance of these technologies. For this study, the CWs were monitored on rainy days at least twice a year from 2016 to 2022. Wet monitoring was conducted by observing at least three (3) days of antecedent dry days (ADDs) for storm events with a rainfall depth of at least 10 mm using the grab sampling method. Water samples were collected at intervals of one (1) hour at the inlet and at intervals of one (1) to two (2) hours at the outlet, observing the hydraulic retention time of the CWs. The water samples were analytically analyzed for biochemical oxygen demand (BOD), chemical oxygen demand (COD), total organic carbon (TOC), total suspended solids (TSS), total nitrogen (TN), and total phosphorus (TP) according to the standard methods for testing water and wastewater [28].
2.2.2. Calculations and Data Analyses
Since the characteristics of NPS pollutants vary depending on the climatic, hydrological, geological, and ecological factors unique to each watershed, the concentration prior to storm events, also known as the background concentration, also varies [29,30]. In most cases, the total load generated by rainfall is more important than the individual concentrations and peak loads because stormwater runoff volumes are relatively small and disturbances in stormwater runoff are dependent on the amount and intensity of rainfall [31,32]. This implies that pollutant concentrations respond to the total load rather than to changes in concentration in individual samples due to rainfall [33]. Therefore, for the calculation of NPS pollutants, the flow-weighted event mean concentration (EMC) shown in Equation (1) was used, considering the runoff flow rate for an accurate load calculation as the simple arithmetic mean concentration may show a large difference from the actual concentration [34,35,36]. The efficiency evaluation of NPS management technologies was based on the ratio of the sum of the inflow load to the sum of the outflow load, and the summation of loads method was used to calculate the removal efficiency by the total inflow load and the total outflow load, as shown in Equations (2) and (3). All parameters were measured in triplicate (three independent samples), and the mean and standard deviation were calculated for each treatment. Significant differences between treatments were evaluated using Student’s t-test for a 95% confidence level.
where C(t) = pollutant concentration; and Q(t) = runoff flow rate discharged at time t.
where C(t) = pollutant concentration at inflow or outflow; and q(t) = corresponding inflow and outflow runoff flow rates discharged at time t.
3. Results and Discussion
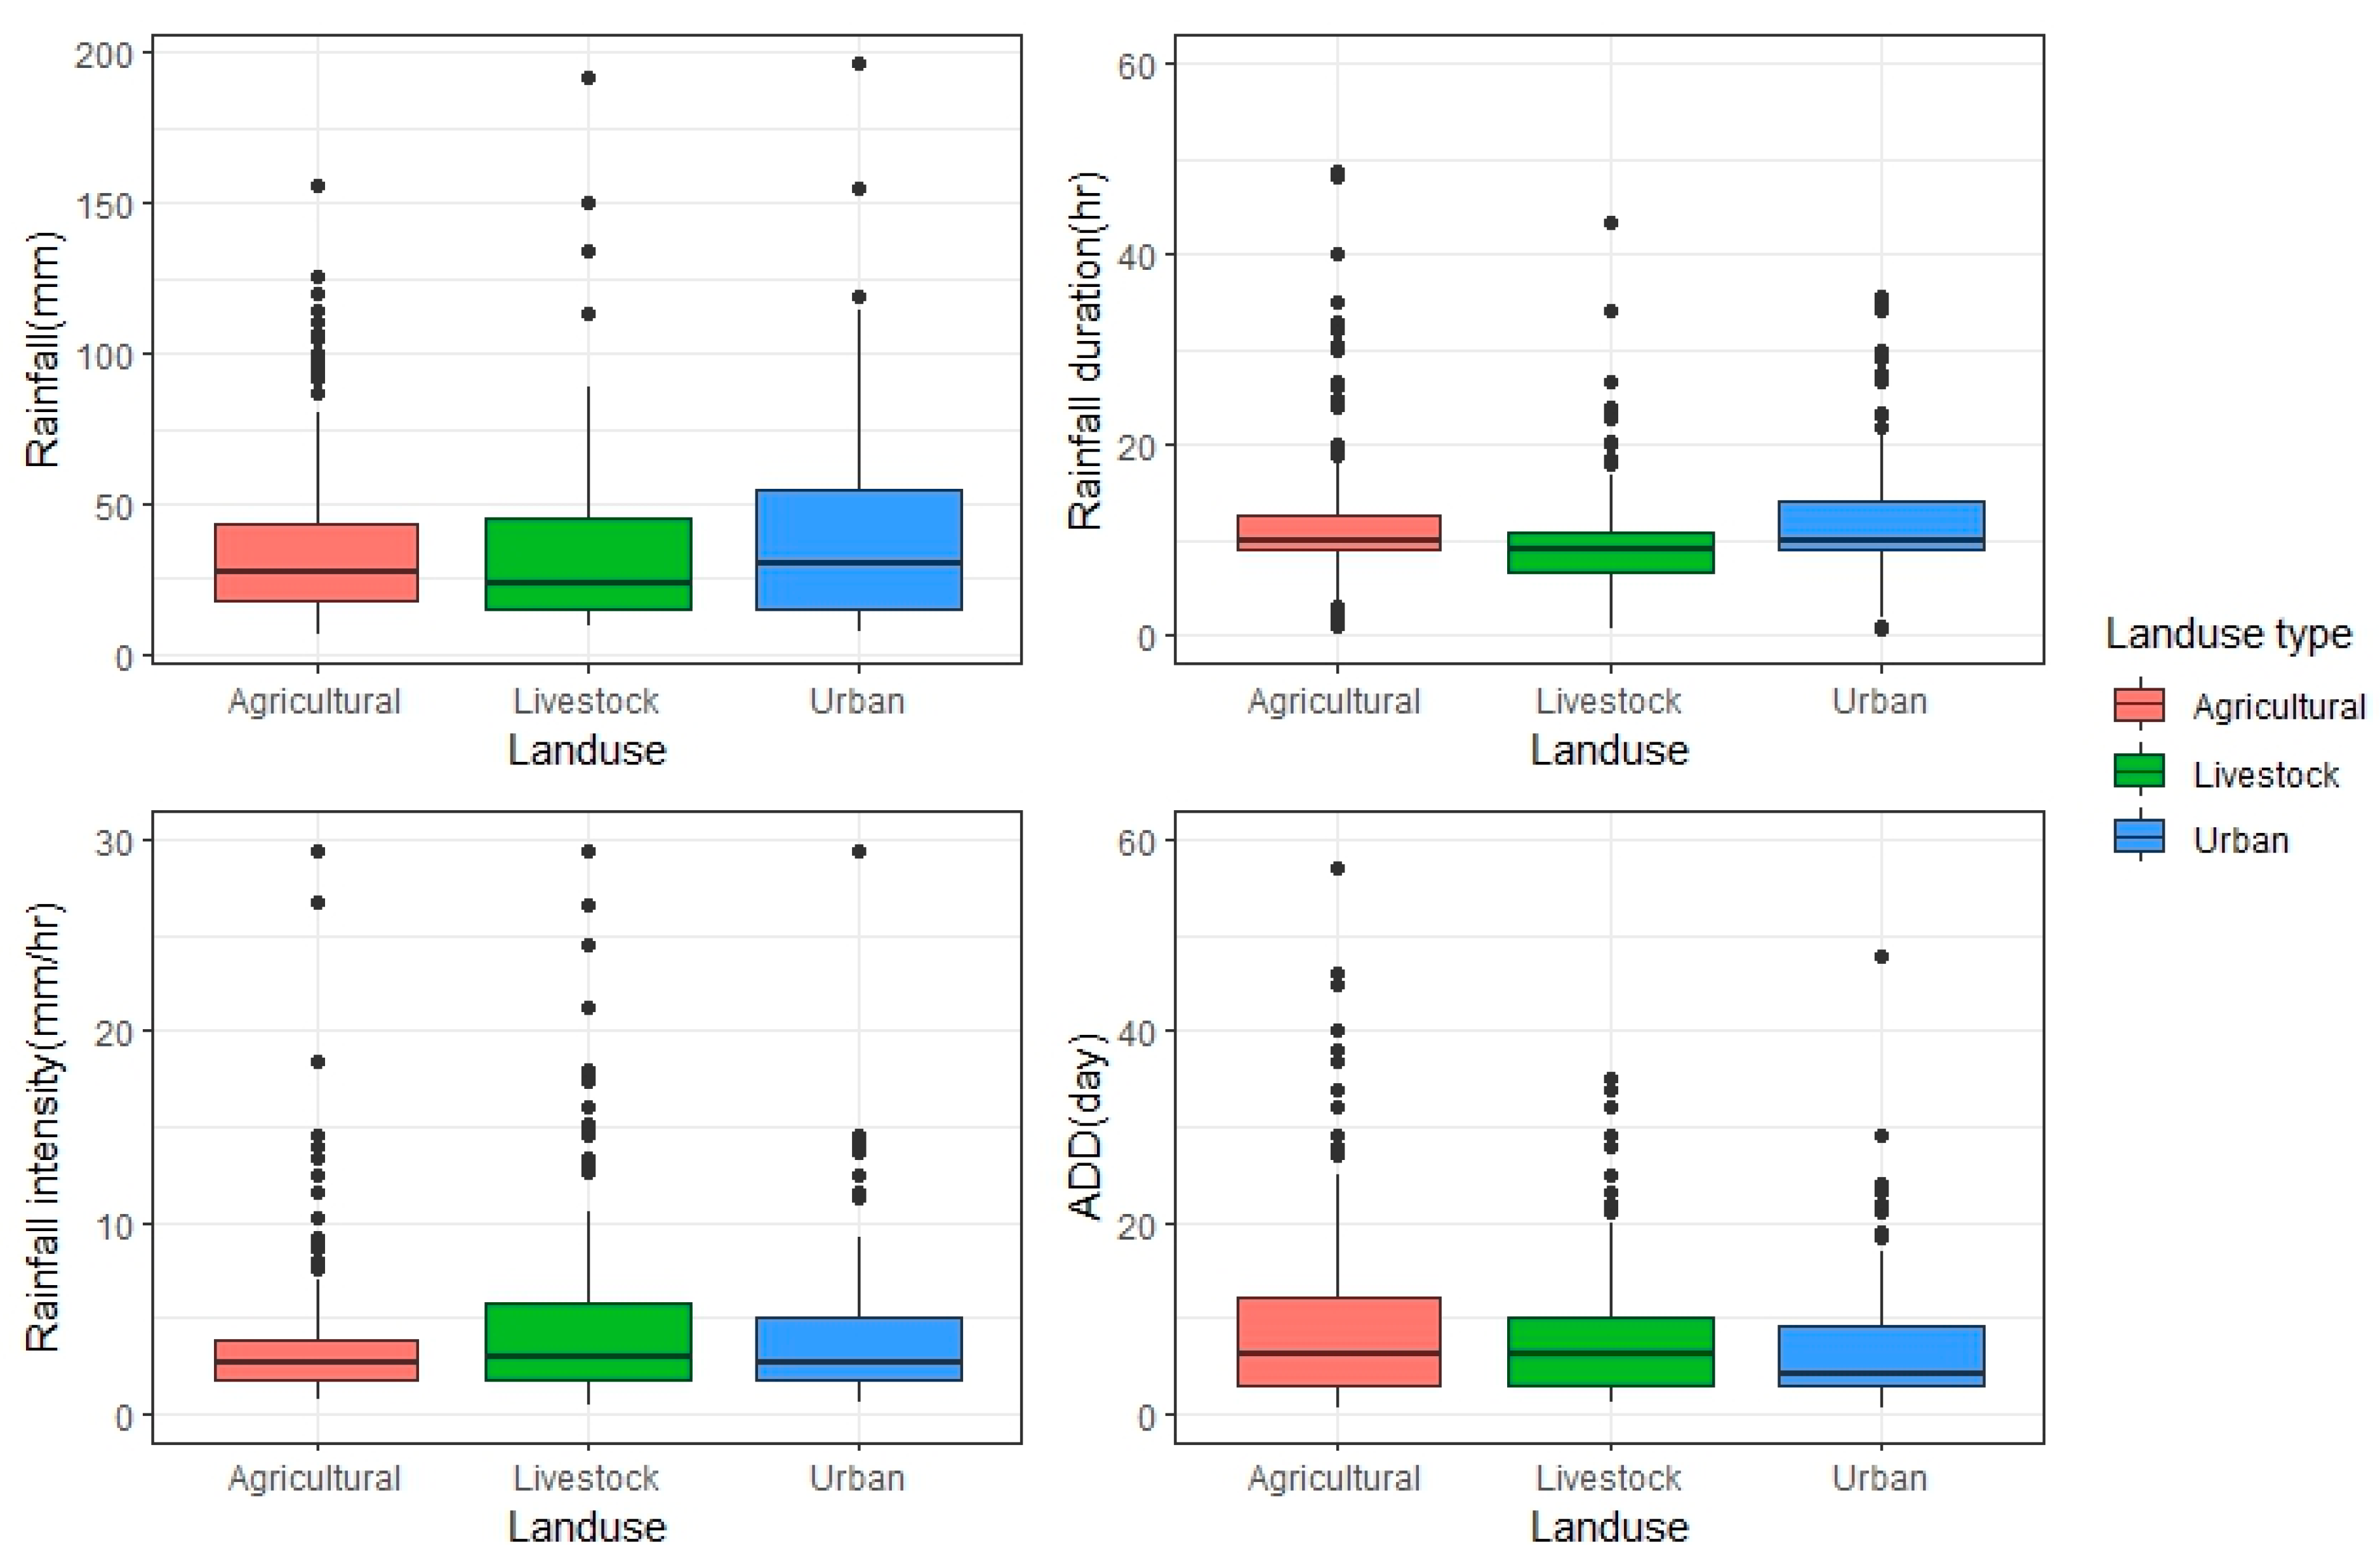
3.1. Runoff Characteristics at the CWs Sites
Figure 2 shows the hydrometeorological characteristics of monitored storm events for CWs constructed in different land use areas. The monitored meteorological characteristics are expressed as mean ± standard deviation values. Among the land uses monitored, urban areas had the greatest rainfall, amounting to 39.4 ± 31.5 mm, followed by 34.4 ± 24.9 mm and 33.7 ± 27.8 mm in agricultural and livestock areas, respectively. Apparently, rainfall intensity was found to be the highest in the livestock areas, amounting to 5.1 ± 5.6 mm/hr, followed by 3.7 ± 3.4 mm/hr in urban areas and 3.4 ± 3.0 mm/hr in rural areas. During the monitoring period, the longest ADD was found to be 9.7 ± 10.9 days in agricultural areas, followed by 8.5 ± 7.5 days and 6.8 ± 7.2 days for livestock areas and for urban areas, respectively. Storm event monitoring was conducted for various rainfall durations of 0.7 to 72.4 hr, with total rainfall ranging from 6.0 to 196.5 mm. The total rainfall intensity ranged from 0.44 to 29.5 mm/hr, and the number of ADDs ranged from 1 to 76 days. In Korea, 70–80% of the annual rainfall events occur with 10 mm of rainfall or less, implying that the monitoring conducted in this study fits Korean climate characteristics [37]. Initial rainfall runoff concentrations are affected by various factors such as land use type, catchment area (CA), rainfall intensity, rainfall duration, land use status, and number of ADDs and show different trends depending on water quality factors [38,39,40,41]. These meteorological factors of ADDs and rainfall were found to be important determinants of urban storm water runoff generation. In a study by Soltaninia et al. (2022), differences in ADD were analyzed as a factor that may influence the occurrence of pollutant loads from land use, as differences in pollutant levels are significantly increased in mixed-land-use areas compared to single-land-use areas [42].
Figure 2.
Boxplots of hydrometeorological characteristics of monitored storm events in different CWs.
3.2. Changes in the Water Quality Characteristics from Different Land Use Types
3.2.1. Total Suspended Solids (TSS)
In the design of CWs, to remove pollutants with large particle sizes in the first flush of stormwater runoff, a CW pre-treatment tank (sedimentation tank) is constructed to reduce turbidity via physical treatment mechanisms such as sedimentation and filtration. Due to the influx of large particulate matter contained in stormwater runoff, a sedimentation basin is installed before entering the CW to reduce turbidity through physical sedimentation. This is essential for extending the life of a CW and improving its treatment efficiency [43,44]. Particulate matter removal depends on several environmental, design, and management factors such as climate, hydrologic loading rate, pollutant loading rate, hydrologic retention time, water depth, size, age, vegetation (type and density), and vegetation management [45,46,47].
Figure 3 shows the pollutant concentrations generated by each land use type and the ef-fluent TSS concentrations after CW treatment. The average TSS concentrations of influents and effluents after passing through the CWs were found to be the highest in livestock land use areas, followed by urban land use and agricultural land use areas. The influent TSS EMC in the agricultural area was 55.6 ± 88.1 mg/L, and it was reduced to 17.6 ± 15.2 mg/L in the effluent after passing through the CWs. In the livestock area, the influent TSS EMC was 93.8 ± 16.0 mg/L, which increased to 251.4 ± 27.3 mg/L in the effluent, while the influent TSS EMC of the urban area amounting to 61.6 ± 122.8 mg/L was reduced to an effluent TSS EMC of 18.2 ± 28.0 mg/L. Rozema et al. (2016) reported averages of 1153 ± 237 mg/L and 157 ± 55 mg/L in stormwater runoff from agricultural areas in northeastern North America, which were found to be 3.1 to 5.8 times greater after treatment with CWs [48]. In comparison, the TSS concentrations of stormwater runoff from agricultural areas in Korea are relatively somewhat lower compared to a study by Rozema et al. (2016) [48]. In the case of livestock areas, Dunne et al. (2005) showed concentrations ranging from 941 mg/L to 1078 mg/L, and Cao, 2021, showed a range of 76.5 ± 219.8 mg/L, indicating severe deviations depending on land use, region, and other factors [49,50]. Considering urban areas, a comparison of various related studies showed that TSS concentrations in urban stormwater runoff ranged from 64.4 to 476.0 mg/L, indicating a similar concentration pattern [51,52,53,54,55]. Effluent TSS concentrations in CWs are strongly influenced by CW treatment performance, and concentration deviations from various land uses are significant; as such, it is necessary to design CWs considering the land use of the pollutant source. In addition, various types of solids generated in the watershed must pass through a pretreatment facility to prevent a decrease in the treatment efficiency of the CW. Thus, it is necessary to design the facility and create environmental conditions to prevent a decrease in treatment efficiency.
Figure 3.
Comparison of influent and effluent TSS concentrations.
3.2.2. Nutrients (Total Nitrogen and Total Phosphorus)
The treatment of N and P in addition to the removal of organic matter from sewage and livestock wastewater is increasingly emphasized, as the most fundamental solution is to prevent high nutrient inputs into water bodies. The N removal processes in CWs are complex and diverse, including assimilation by plants and microorganisms, adsorption by substrates, the precipitation of organic nitrogen, ammonia volatilization, ammonification, nitrification, and denitrification [56,57,58,59]. The P removal mechanism mainly involves adsorption or precipitation in the substrate medium and is highly dependent on the chemical, physical, and hydrologic properties of the substrate material [60,61,62]. Considering phosphorus removal, filter materials with high nutrient-binding properties are highly favored in CWs. Various studies need to be evaluated to improve the performance of CWs for phosphorus removal.
Figure 4 shows a comparison between influent and effluent TN and TP concentrations in CWs treating different land uses. The greatest influent TN concentration was 15.35 ± 33.71 mg/L, which was reduced to 7.60 ± 17.64 mg/L in the effluent after treatment in a CW for livestock land use. The influent TN concentration in agricultural areas was 7.43 ± 11.69 mg/L, while the effluent TP concentration was 3.45 ± 5.28 mg/L. Lastly, the influent TN concentration in an urban area was found to be 5.40 ± 5.76 mg/L and was reduced to 2.79 ± 2.53 mg/L after treatment through a CW. The highest TN concentrations in livestock areas were attributed to feed inputs, livestock manure inputs, and fixed runoff and soil leaching in forested areas [63,64]. On the other hand, influent TP concentrations amounting to 1.23 ± 2.95 mg/L, 1.05 ± 1.57 mg/L, and 0.59 ± 0.69 mg/L were reduced to 0.43 ± 1.20 mg/L, 0.48 ± 1.29 mg/L, and 0.26 ± 0.33 mg/L after treatment in CWs for agricultural, livestock, and urban land uses, respectively. Compared to TN, TP was generated more in agricultural areas because TP inflow in rural areas comes from chemical fertilizer use and is distributed to water bodies through the water flow of irrigation. The application of CWs to reduce pollutants from these sources is considered an efficient way to manage and reduce nutrient loads and prevent eutrophication. In addition, N is generated by fuels used by businesses in urban areas, including automobile usage, power plants, and other human activities, causing wastewater production. It is suggested that proper management is necessary to ensure that the treatment mechanism incorporated in the CWs is well implemented considering the pollution source. A proper basin management plan to reduce NPS pollution is needed to ensure nutrient management in large basins.
Figure 4.
Comparison of influent and effluent nutrient concentration.
3.2.3. Organic Matter (BOD and COD)
NPS pollutants entering CWs are mostly due to suspended organic matter, and the types and the amounts of pollutants discharged vary depending on the sources distributed in the watershed, so pollutant-specific transport may differ depending on watershed characteristics. The main organic matter removal pathways are the sedimentation and filtration of colloidal organic matter and biological degradation by microorganisms under aerobic and anaerobic conditions [65,66,67]. The BOD, COD, and TOC are methods for measuring the oxygen-consuming organic matter content in water, and CWs can effectively utilize carbon components in the influent, but they will maintain a certain level of background concentration depending on their condition.
Figure 5 shows ae comparison of influent and effluent concentrations of the BOD, COD, and TOC in the CWs constructed in each land use type. Influent BOD, COD, and TOC concentrations in agricultural areas were 11.0 ± 14.7 mg/L, 17.5 ± 14.6 mg/L, and 7.42 ± 10.26 mg/L, which were reduced by CWs to 5.03 ± 5.92 mg/L, 8.6 ± 6.7 mg/L, and 4.37 ± 5.33 mg/L in the effluent, respectively. The influent BOD, COD, and TOC concentrations from the livestock area amounting to 19.3 ± 45.3 mg/L, 25.2 ± 32.2 mg/L, and 13.6 ± 21.2 mg/L were reduced by the CWs to 6.8 ± 11.2 mg/L, 10.6 ± 10.0 mg/L, and 11.3 ± 19.6 mg/L, respectively. Lastly, the influent BOD, COD, and TOC concentrations found in urban areas amounting to 13.6 ± 15.9 mg/L, 22.3 ± 20.3 mg/L, and 6.49 ± 5.6 mg/L were reduced to 6.15 ± 8.80 mg/L, 9.82 ± 8.74 mg/L, and 4.15 ± 3.29 mg/L, respectively.
Figure 5.
Site locations of quality characteristics from different land uses.
In general, the background concentrations of the BOD and COD in CWs are known to be 1–10 mg/L and 10–100 mg/L, respectively [68]. The pollutant concentrations derived from this study were found to meet the concentrations occurring within the catchment area of the CWs. In addition, according to Salem et al. (2022), CWs can treat NPS pollutants, including a BOD concentration of 383 ± 70 mg/L and a COD concentration of 689 ± 104 mg/L [69]. When operating CWs, challenges such as oxygen depletion, blockage or obstruction due to sediment accumulation, clogging of the filtration layer, difficulty in planting vegetation, and unidirectional circulation or a short-circuited flow may be encountered [70]. Therefore, apart from focusing on pollutant removal efficiency through CWs, it is also suggested to evaluate the effluent concentration to identify if additional management procedures should be performed to meet the target effluent standards in a specific area or locale.
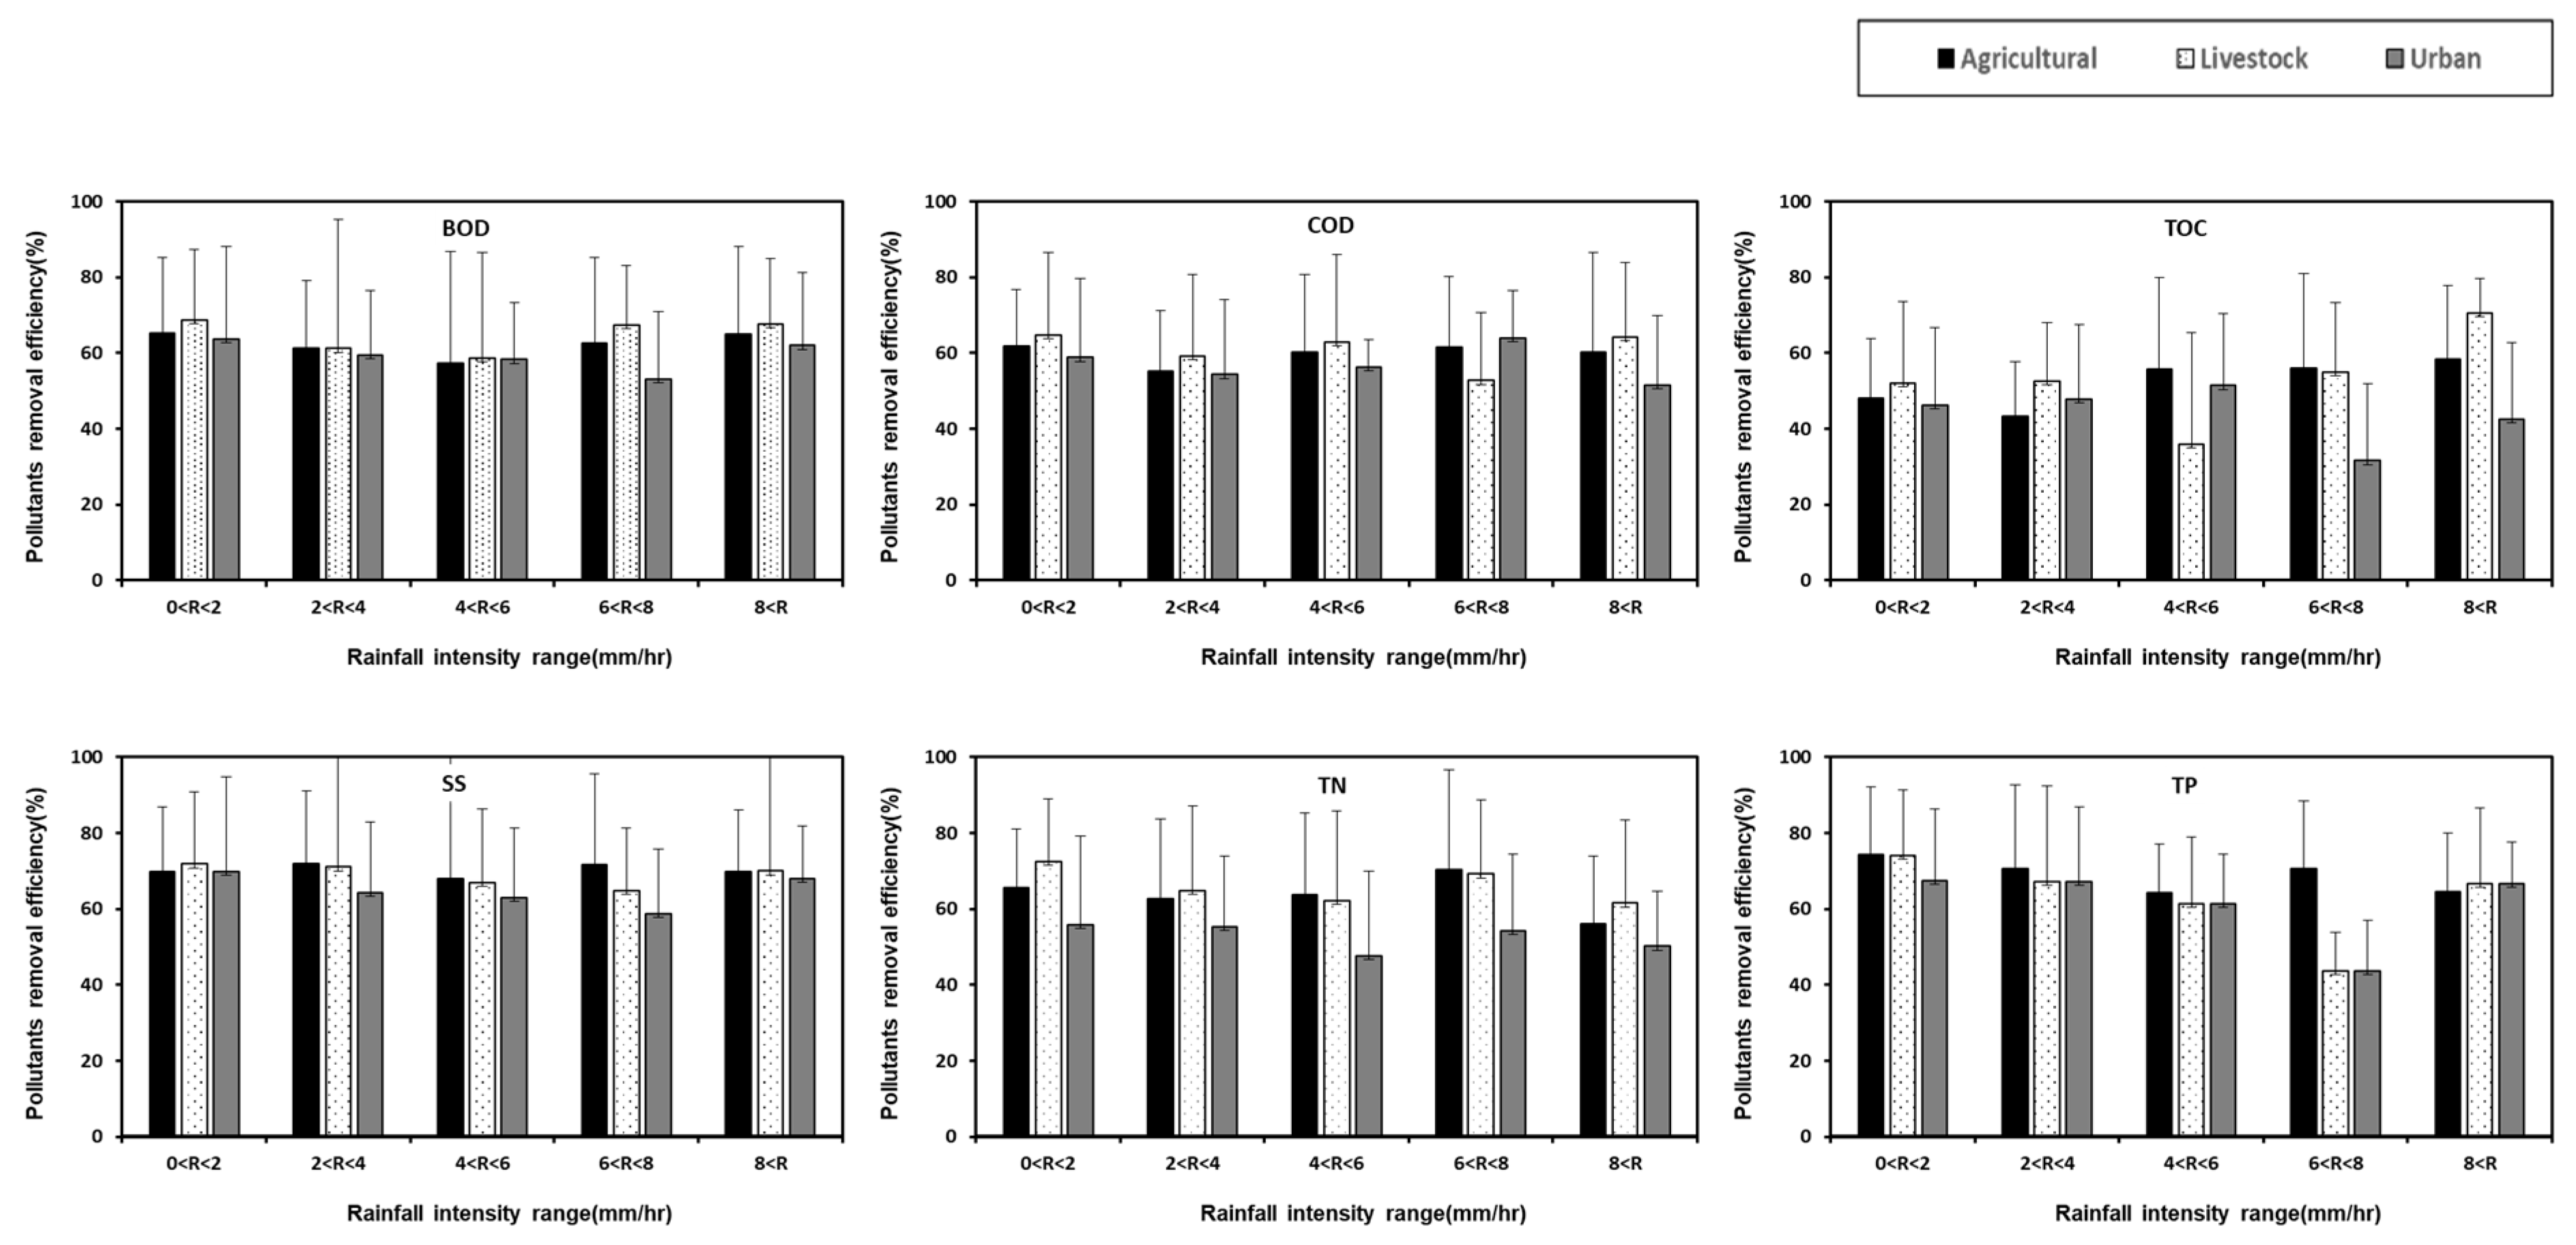
3.3. Constructed Wetlands’ Pollutant Removal Efficiencies Based on Rainfall Characteristics in Different Land Uses
Rainfall characteristics (rainfall amount, rainfall intensity, rainfall duration, etc.) are important for the design and operational management of CWs. Rainfall characteristics affect the capacity calculation, efficiency diagnosis, and maintenance frequency of CWs. Among rainfall characteristics, rainfall intensity has a significant correlation with runoff load [71,72]. In addition, the nature of pollutants entering CWs is a factor influenced by the land use of the watershed, which is important for CW design. Figure 6 shows the NPS pollutant removal efficiency at varying rainfall depth ranges. The average BOD removal efficiency is 62%, with the highest reduction efficiency in the rainfall range of 60 to 80 mm (69%) for agricultural areas, 0 to 20 mm (67%) for livestock areas, and 20 to 40 mm (62%) in urban areas. Considering the COD, the highest removal efficiency was found in agricultural areas between 60 and 80 mm (63%), while 64% and 63% removal efficiencies were found in agricultural and urban CWs for rainfall events below 20 mm. Similar to the COD, the TOC concentration in livestock and urban CWs showed high removal efficiencies under 20 mm, while agricultural CWs were found to have a high removal efficiency under 60 mm of rainfall. Considering the COD and TOC, it was found that the removal efficiency is high even for storm events with high rainfall depths, which is attributed to the flow of substances attached to particulate matter into the facility. The removal of most of these water quality parameters, such as TP, which was associated with particulate matter, was found to be related to the physical removal of particulate contaminants and bound or adsorbed contaminants. In addition, most of the study sites have short HRTs due to the shape and structure of CWs causing limitations in creating a biochemical treatment environment that contributes to the removal of dissolved organic matter and TN. In the case of TSS, the overall removal efficiency was higher than that of other pollutants. It was also found that TSS removal was higher for lower rainfall events for all land uses. This is because the particle load reaches a constant or stable state above the critical load [73,74]. Nutrients such as TN and TP also showed high removal efficiencies at rainfall events below 20 mm. High pollutant-reduction efficiencies were found for low rainfall depths of 20 mm or less because the pollutants that entered the CWs during low rainfall were largely removed by the long HRTs. As rainfall increases, the pollutant reduction effectiveness decreases somewhat because the HRTs in the CWs become shorter, which does not allow adequate time for treatment [28,75].
Figure 6.
Pollutant removal performances of constructed wetlands with respect to rainfall depth.
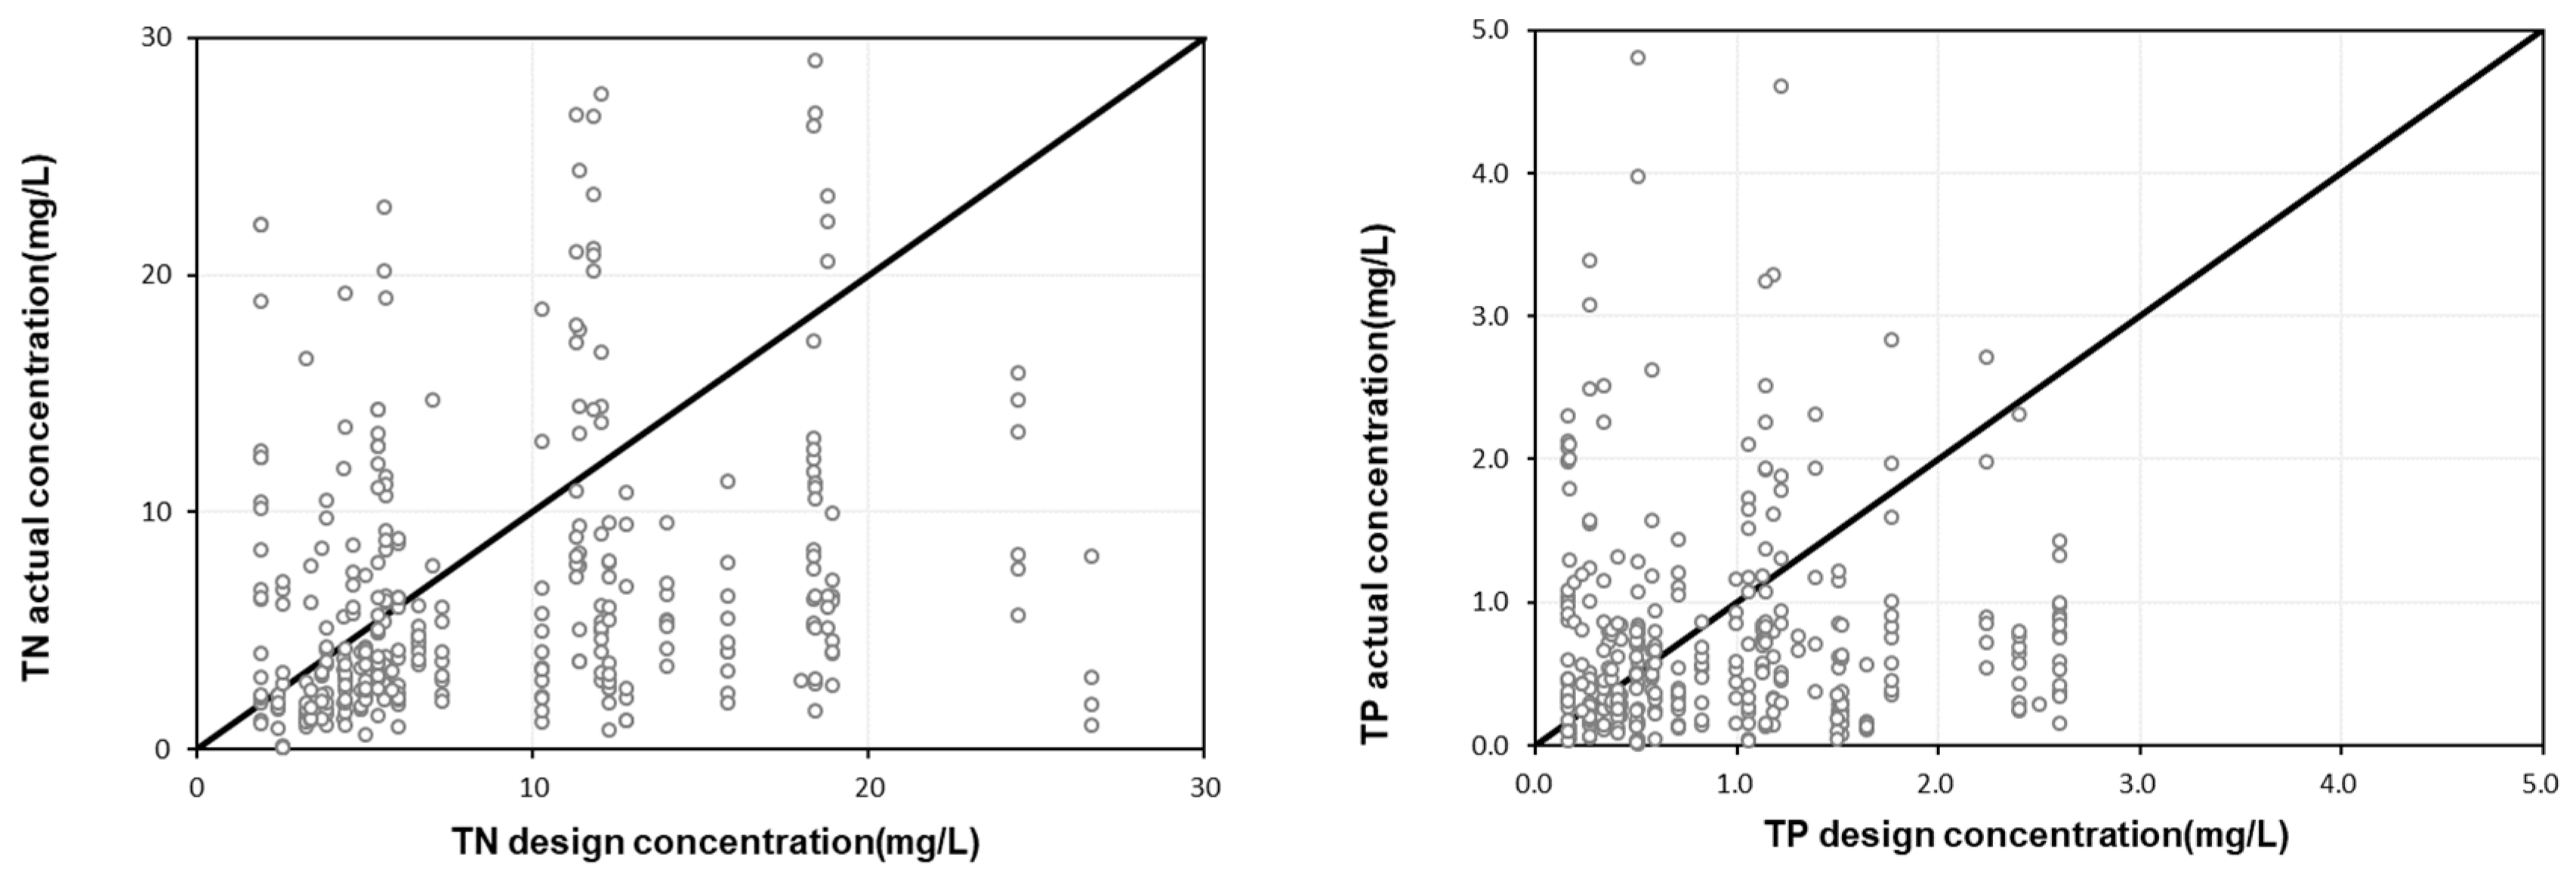
3.4. Comparison of Actual and Design Influent Concentrations and Pollutant Removal Efficiencies of CWs
CWs discharge pollutants in different concentrations and patterns depending on meteorological and watershed characteristics such as rainfall, watershed characteristics, and background concentrations. In addition, the monitoring data available for the design of NPS management technologies is insufficient, and different designers use different monitoring data for each technology, resulting in large deviations in the inflow concentration and mitigation efficiency of technologies after design. Figure 7 shows a comparison of the actual influent concentrations and the design influent concentrations of the monitored CWs. For the comparison of actual and design influent concentrations, the BOD, TSS, TN, and TP were set as design parameters. Considering the overall influent concentrations entering CWs, it was found that 67.5% of the influents were entering at a lower concentration and 28.5% were entering at a higher concentration compared to the design influent concentration. For each target pollutant, 69%, 66%, 71%, and 68% specifically for the BOD, TSS, TN, and TP, respectively, were found to be below the design influent concentration, while about 29% to 35% were above the design influent concentration. This finding was attributed to the varying watershed characteristics and weather characteristics including rainfall and rainfall intensity. In addition, it was found that the actual inflow concentrations of all pollutants except TP were very low compared to the design inflow concentrations. To derive stable CW efficiency, it is important to use appropriate influent design concentrations. Specifically, lower influent design concentrations should be used for the BOD, TSS, and TN, and a slightly higher design concentration for TP is necessary for the design.

Figure 7.
Relationship between design concentration and actual concentration.
A comparison of design efficiency with actual efficiency for target pollutants in CWs is provided in Figure 8. On average, 70.2% of the CWs were found to have a higher efficiency compared to the actual efficiency for all the target parameters, while 29.8% of the CWs were found to have a lower actual efficiency compared to the design efficiency. Considering each target pollutant, 65%, 61%, 78%, and 77% of the CWs were found to have a higher actual removal efficiency compared to the design removal efficiencies for the BOD, TSS, TN, and TP, respectively. Overall, the deviation of the design removal efficiency from the actual removal efficiency was large. Specifically, the BOD was found to have similar design efficiency and actual efficiency values, while TSS were evaluated to have an overestimated design efficiency. For TN and TP, the design efficiencies were either too high or set in a wide range, and the actual efficiencies were more stable than the design efficiencies. However, in the case of TN and TP, it was found that negative efficiencies can occur at low concentrations. Therefore, when designing CWs, the design efficiency should be calculated based on the characteristics of the watershed and the influent pollutants’ characteristics.
Figure 8.
Relationship between design efficiency and actual efficiency.
3.5. Suggestions for Optimized Constructed Wetland Operation
While the efficiency of CWs was found to be high in this study, the deviation in CW performance was also high. As such, it is necessary to establish design and operation management plans to derive stable efficiency. When applying CWs, several factors including land use characteristics, watershed characteristics (land cover, impervious area, etc.), meteorological characteristics in the region of application, ease of maintenance, design and operational characteristics, and other factors (the possibility of acceptance by the local community, the adequacy of cost, etc.) should be considered. Table 2 summarizes the results of the monitoring of 63 artificial wetland sites and the derivation of optimal operational management measures. When designing CWs, a thorough investigation of rainfall-runoff characteristics with respect to land use (point sources) is essential. Given the variations in runoff characteristics and discharge trends in rainfall runoff, it is crucial to assess the characteristics specific to the target watershed before considering management measures. Subsequently, a review of treatment processes (physical, chemical, biological treatment, etc.) is necessary to mitigate identified management factors. An evaluation and estimation of pollutants based on watershed characteristics (rural, livestock, urban areas, etc.) are also required. Pollutants and management considerations differ among rural, livestock, and urban areas across the 63 CWs. Therefore, it is imperative to select target pollutants according to the characteristics of each watershed. It is also recommended to set water quality goals that include the BOD, TN, and TP for agricultural non-point-source management in rural areas, TN and TP for livestock areas with a high proportion of animal waste, and TP and SS for urban areas experiencing first-flush runoff. The scale of CWs should be calculated to achieve appropriate treatment for the targeted pollutants, considering watershed characteristics. Since pollutants exhibit different transport mechanisms based on their inherent properties, the selection of water quality goals is essential.
Table 2.
Summary of management considerations for the optimized performance of constructed wetlands.
An analysis of reduction efficiency trends based on rainfall classes for each pollutant can aid in determining the design rainfall amount for the optimal capacity calculation in future artificial wetland designs. Additionally, monitoring plans reflecting meteorological and regional characteristics can be adjusted and standardized to ensure accurate and consistent measurements of rainfall runoff. Consideration of rainwater runoff characteristics is crucial for selecting management target substances, facilitating pollutant removal in design and operational management and ensuring ease of maintenance. Therefore, setting design concentrations and water quality goals during facility design is vital to prevent over-designing or under-designing CWs. For the stable efficiency of a CW, the design stage, operational management plans (maintenance, design factors, treatment methods, etc.), and environmental characteristics should be carefully considered.
4. Conclusions
This study suggested ways to improve the sustainability of CWs by utilizing the monitoring results of 63 CWs and reviewing the appropriateness of the design of the facilities in Korea. Based on the results of this study, the following conclusions may be derived: Meteorological factors, such as the ADD and rainfall depth, are important factors affecting urban stormwater runoff quality in different land uses. Due to the large variation in concentrations generated by various land uses, it is necessary to design CWs taking into consideration the type of land use to be managed. Improving the performance of CWs requires proper maintenance strategies to ensure that the pollutant removal mechanisms are properly functioning. Rainfall characteristics (rainfall amount, rainfall intensity, rainfall duration, etc.) are important factors that should be considered for the design and operational management of CWs. Rainfall characteristics have been found to affect the capacity efficiency estimation and maintenance frequency of CWs. The overall deviation in the design reduction efficiency from the actual reduction efficiency was found to be large. Therefore, when designing CWs, the design efficiency should be calculated based on the characteristics of the watershed and the influent pollutants’ characteristics. When applying CWs, several factors including land use characteristics, watershed characteristics (land cover, impervious area, etc.), meteorological characteristics in the region of application, ease of maintenance, design and operational characteristics, and other factors (the possibility of acceptance by the local community, the adequacy of cost, etc.) should be considered. The results of this study can be utilized in the design and operation of CWs in the future, and it is necessary to analyze the long-term performance of CWs through continuous monitoring. Lastly, it is suggested to analyze the performance of different CW types to identify which are the appropriate CWs to be designed for specific land use types for future studies.
Author Contributions
H.C.: conceptualization, methodology, software, validation, formal analysis, investigation, resources, data curation, writing—original draft preparation, and visualization, supervision. M.J.: methodology, investigation, writing—review and editing, visualization, and supervision. F.K.G.: methodology, investigation, writing—review, and editing. L.-H.K.: conceptualization, writing—review and editing, project administration, and funding acquisition. J.-H.M.: methodology, investigation, writing—review and editing. All authors have read and agreed to the published version of the manuscript.
Funding
This research received no external funding.
Data Availability Statement
The data presented in this study are available on request from the corresponding author. The data are not publicly available due to data privacy of the project.
Acknowledgments
This research was funded by a grant (NIER-2023-01-01-177) from the National Institute of Environmental Research (NIER).
Conflicts of Interest
The authors declare no conflicts of interest. The funders had no role in the design of the study; in the collection, analyses, or interpretation of data; in the writing of the manuscript; or in the decision to publish the results.
Nomenclature
| Acronym | Definition |
| ADD | Antecedent dry days |
| BOD | Biochemical oxygen demand |
| CA | Catchment area |
| COD | Chemical oxygen demand |
| Cell-FWS | Cell-type free-water surface constructed wetland |
| CWs | Constructed wetlands |
| EMC | Event mean concentration |
| Flow-FWS | Flow-type free-water surface constructed wetland |
| Hybrid-FWS | Hybrid type free-water surface constructed wetland |
| Hybrid | Hybrid constructed wetland |
| N | Nitrogen |
| NbS | Nature-based solutions |
| NPS | Non-point source |
| P | Phosphorus |
| TN | Total nitrogen |
| TOC | Total organic carbon |
| TP | Total phosphorus |
| TSS | Total suspended solids |
References
- Dougherty, M.; Dymond, R.L.; Grizzard, T.J., Jr.; Godrej, A.N.; Zipper, C.E.; Randolph, J. Quantifying long-term NPS pollutant flux in an urbanizing watershed. J. Environ. Eng. 2006, 132, 547–554. [Google Scholar] [CrossRef]
- Geronimo, F.K.F.; Maniquiz-Redillas, M.C.; Kim, L.H. Treatment of parking lot runoff by a tree box filter. Desalin. Water Treat. 2013, 51, 4044–4049. [Google Scholar] [CrossRef]
- Zhi, X.; Chen, L.; Shen, Z. Impacts of urbanization on regional nonpoint source pollution: Case study for Beijing, China. Environ. Sci. Pollut. 2018, 25, 9849–9860. [Google Scholar] [CrossRef] [PubMed]
- Choi, H.; Geronimo, F.K.; Jeon, M.; Kim, L.H. Evaluation of bacterial community in constructed wetlands treating different sources of wastewater. Ecol. Eng. 2022, 182, 106703. [Google Scholar] [CrossRef]
- Choi, H.; Reyes, N.J.D.; Jeon, M.; Kim, L.H. Constructed wetlands in south korea: Current status and performance assessment. Sustainability 2021, 13, 10410. [Google Scholar] [CrossRef]
- Xie, H.; Dong, J.; Shen, Z.; Chen, L.; Lai, X.; Qiu, J.; Wei, G.; Peng, Y.; Chen, X. Intra-and inter-event characteristics and controlling factors of agricultural nonpoint source pollution under different types of rainfall-runoff events. Catena 2019, 182, 104105. [Google Scholar] [CrossRef]
- Xia, Y.; Zhang, M.; Tsang, D.C.; Geng, N.; Lu, D.; Zhu, L.; Igalavithana, A.D.; Dissanayake, P.D.; Rinklebe, J.; Yang, X.; et al. Recent advances in control technologies for non-point source pollution with nitrogen and phosphorous from agricultural runoff: Current practices and future prospects. Appl. Biol. Chem. 2020, 63, 8. [Google Scholar] [CrossRef]
- Pan, D.; Chen, H. Border pollution reduction in China: The role of livestock environmental regulations. China Econ. Rev. 2021, 69, 101681. [Google Scholar] [CrossRef]
- Badrzadeh, N.; Samani, J.M.V.; Mazaheri, M.; Kuriqi, A. Evaluation of management practices on agricultural nonpoint source pollution discharges into the rivers under climate change effects. Sci. Total Environ. 2022, 838, 156643. [Google Scholar] [CrossRef]
- Tudi, M.; Daniel Ruan, H.; Wang, L.; Lyu, J.; Sadler, R.; Connell, D.; Chu, C.; Phung, D.T. Agriculture development, pesticide application and its impact on the environment. Int. J. Environ. Res. Public Health 2021, 18, 1112. [Google Scholar] [CrossRef]
- Liu, J.; Ouyang, X.; Shen, J.; Li, Y.; Sun, W.; Jiang, W.; Wu, J. Nitrogen and phosphorus runoff losses were influenced by chemical fertilization but not by pesticide application in a double rice-cropping system in the subtropical hilly region of China. Sci. Total Environ. 2020, 715, 136852. [Google Scholar] [CrossRef] [PubMed]
- Alengebawy, A.; Abdelkhalek, S.T.; Qureshi, S.R.; Wang, M.Q. Heavy metals and pesticides toxicity in agricultural soil and plants: Ecological risks and human health implications. Toxics 2021, 9, 42. [Google Scholar] [CrossRef] [PubMed]
- Kumar, R.; Sankhla, M.S.; Kumar, R.; Sonone, S.S. Impact of pesticide toxicity in aquatic environment. Biointerface Res. Appl. Chem. 2021, 11, 10131–10140. [Google Scholar]
- Tsihrintzis, V.A.; Hamid, R. Modeling and management of urban stormwater runoff quality: A review. Water Resour. Manag. 1997, 11, 136–164. [Google Scholar] [CrossRef]
- Tang, Z.; Engel, B.A.; Pijanowski, B.C.; Lim, K.J. Forecasting land use change and its environmental impact at a watershed scale. J. Environ. Manag. 2005, 76, 35–45. [Google Scholar] [CrossRef]
- Simpson, I.M.; Winston, R.J.; Dorsey, J.D. Monitoring the effects of urban and forested land uses on runoff quality: Implications for improved stormwater management. Sci. Total Environ. 2023, 862, 160827. [Google Scholar] [CrossRef] [PubMed]
- WWAP (United Nations World Water Assessment Programme)/UN-Water. The United Nations World Water Development Report 2018: Nature-Based Solutions for Water; UNESCO: Paris, France, 2018. [Google Scholar]
- Gutman, J. Commentary: Urban Wetlands Restoration as NBS for Flood Risk Mitigation: From Positive Case to Legitimate Practice, in the View of Evidence-Based Flood Risk Policy Making. Nature-Based Flood Risk Management on Private Land: Disciplinary Perspectives on a Multidisciplinary Challenge; Springer Nature: Cham, Switzerland, 2019; pp. 127–134. [Google Scholar]
- Saquib, S.; Gupta, A.; Joshi, A. Emerging water crisis: Impact of urbanization on water resources and constructed wetlands as a nature-based solution (NbS). Curr. Dir. Water Scarcity Res. 2022, 6, 447–468. [Google Scholar]
- Tsatsou, A.; Frantzeskaki, N.; Malamis, S. Nature-based solutions for circular urban water systems: A scoping literature review and a proposal for urban design and planning. J. Clean. Prod. 2023, 394, 136325. [Google Scholar] [CrossRef]
- Blackwell, M.S.; Pilgrim, E.S. Ecosystem services delivered by small-scale wetlands. Hydrol. Sci. J. 2011, 56, 1467–1484. [Google Scholar] [CrossRef]
- Clarkson, B.R.; Ausseil, A.G.E.; Gerbeaux, P. Wetland Ecosystem Services. Ecosystem Services in New Zealand: Conditions and Trends; Manaaki Whenua Press: Lincoln, RI, USA, 2013; Volume 1, pp. 192–202. [Google Scholar]
- Mitsch, W.J.; Bernal, B.; Hernandez, M.E. Ecosystem services of wetlands. Int. J. Biodivers. Sci. Ecosyst. Serv. Manag. 2015, 11, 1–4. [Google Scholar] [CrossRef]
- Xu, X.; Chen, M.; Yang, G.; Jiang, B.; Zhang, J. Wetland ecosystem services research: A critical review. Glob. Ecol. Conserv. 2020, 22, e01027. [Google Scholar] [CrossRef]
- Raisin, G.W.; Mitchell, D.S. The use of wetlands for the control of non-point source pollution. Water Sci. Technol. 1995, 32, 177–186. [Google Scholar] [CrossRef]
- Haberl, R.; Grego, S.; Langergraber, G.; Kadlec, R.H.; Cicalini, A.R.; Dias, S.M.; Novais, J.M.; Aubert, S.; Gerth, A.; Thomas, H.; et al. Constructed wetlands for the treatment of organic pollutants. J. Soils Sediments. 2003, 3, 109–124. [Google Scholar] [CrossRef]
- Trepel, M. Assessing the cost-effectiveness of the water purification function of wetlands for environmental planning. Ecol. Complex. 2010, 7, 320–326. [Google Scholar] [CrossRef]
- American Water Works Association (AWWA). Water Environment Federation (WEF) and the American Public Health Association (APHA). In Standards Methods for the Examination of Water and Wastewater, 21st ed.; American Public Health Association: Washington, DC, USA, 2005. [Google Scholar]
- Mayer, T.D.; Jarrell, W.M. Assessing Colloidal Forms of Phosphorus and Iron in the Tualatin River Basin; Technical Report; American Society of Agronomy, Crop Science Society of America, and Soil Science Society of America: Madison, WI, USA, 1995; Volume 24, pp. 1117–1124. [Google Scholar]
- Line, D.E.; Osmond, D.L.; Gannon, R.; Gale, J.A.; Arnold, J.A.; Coffey, S.W.; Spooner, J.; Jennings, G.D. Nonpoint sources. Water Environ. Re. 1995, 67, 685–700. [Google Scholar] [CrossRef]
- Bedient, P.B.; Lambert, J.L.; Springer, N.K. Stormwater pollutant load-runoff relationships. J. Water Pollut. Control Fed. 1980, 52, 2396–2404. [Google Scholar]
- Brezonik, P.L.; Stadelmann, T.H. Analysis and predictive models of stormwater runoff volumes, loads, and pollutant concentrations from watersheds in the Twin Cities metropolitan area, Minnesota, USA. Water Res. 2002, 36, 1743–1757. [Google Scholar] [CrossRef]
- Maniquiz, M.C.; Lee, S.; Kim, L.H. Multiple linear regression models of urban runoff pollutant load and event mean concentration considering rainfall variables. J. Environ. Sci. 2010, 22, 946–952. [Google Scholar] [CrossRef]
- Ujević, I.; Odžak, N.; Barić, A. Trace metal accumulation in different grain size fractions of the sediments from a semi-enclosed bay heavily contaminated by urban and industrial wastewaters. Water Res. 2000, 34, 3055–3061. [Google Scholar] [CrossRef]
- Maniquiz, M.C.; Lee, S.Y.; Kim, L.H. Long-term monitoring of infiltration trench for nonpoint source pollution control. Water Air Soil Pollut. 2010, 212, 13–26. [Google Scholar] [CrossRef]
- Choi, H.S.; Reyes, N.J.; Jeon, M.; Kim, L.H. Characterization of pollutants and identification of microbial communities in the filter media of green infrastructures. Ecol. Eng. 2023, 193, 107012. [Google Scholar] [CrossRef]
- Maniquiz, M.C.; Lee, S.; Min, K.S.; Kim, J.H.; Kim, L.H. Diffuse pollutant unit loads of various transportation landuses. Desalination Water Treat. 2012, 38, 222–229. [Google Scholar] [CrossRef]
- Deletic, A.B. The first flush load of urban surface runoff. Water Res. 1998, 32, 2462–2470. [Google Scholar] [CrossRef]
- Deletic, A.B.; Maksimovic, C.T. Evaluation of water quality factors in storm runoff from paved areas. J. Environ. Eng. 1998, 124, 869–879. [Google Scholar] [CrossRef]
- Yuan, Q.; Guerra, H.B.; Kim, Y. An investigation of the relationships between rainfall conditions and pollutant wash-off from the paved road. Water 2017, 9, 232. [Google Scholar] [CrossRef]
- Salim, I.; Paule-Mercado, M.C.; Sajjad, R.U.; Memon, S.A.; Lee, B.Y.; Sukhbaatar, C.; Lee, C.H. Trend analysis of rainfall characteristics and its impact on stormwater runoff quality from urban and agricultural catchment. Membr. Water Treat. 2019, 10, 45–55. [Google Scholar]
- Soltaninia, S.; Taghavi, L.; Hosseini, S.A.; Motamedvaziri, B.; Eslamian, S. The effect of land-use type and climatic conditions on heavy metal pollutants in urban runoff in a semi-arid region. Water Reuse 2022, 12, 384–402. [Google Scholar] [CrossRef]
- Lee, S.; Maniquiz-Redillas, M.C.; Kim, L.H. Settling basin design in a constructed wetland using TSS removal efficiency and hydraulic retention time. J. Environ. Sci. 2014, 26, 1791–1796. [Google Scholar] [CrossRef]
- Justino, S.; Calheiros, C.S.; Castro, P.M.; Gonçalves, D. Constructed Wetlands as Nature-Based Solutions for Wastewater Treatment in the Hospitality Industry: A Review. Hydrology 2023, 10, 153. [Google Scholar] [CrossRef]
- O’geen, A.T.; Budd, R.; Gan, J.; Maynard, J.J.; Parikh, S.J.; Dahlgren, R.A. Mitigating nonpoint source pollution in agriculture with constructed and restored wetlands. Adv. Agron. 2010, 108, 1–76. [Google Scholar]
- Díaz, F.J.; Anthony, T.O.; Dahlgren, R.A. Agricultural pollutant removal by constructed wetlands: Implications for water management and design. Agric. Water Manag. 2012, 104, 171–183. [Google Scholar] [CrossRef]
- Minakshi, D.; Sharma, P.K.; Rani, A. Effect of filter media and hydraulic retention time on the performance of vertical constructed wetland system treating dairy farm wastewater. Environ. Eng. Res. 2022, 27, 200436. [Google Scholar] [CrossRef]
- Rozema, E.R.; VanderZaag, A.C.; Wood, J.D.; Drizo, A.; Zheng, Y.; Madani, A.; Gordon, R.J. Constructed wetlands for agricultural wastewater treatment in Northeastern North America: A review. Water 2016, 8, 173. [Google Scholar] [CrossRef]
- Dunne, E.J.; Culleton, N.; O’Donovan, G.; Harrington, R.; Olsen, A.E. An integrated constructed wetland to treat contaminants and nutrients from dairy farmyard dirty water. Ecol. Eng. 2005, 24, 219–232. [Google Scholar] [CrossRef]
- Cao, S.T.; Tran, H.P.; Le, H.T.T.; Bui, H.P.K.; Nguyen, G.T.H.; Nguyen, L.T.; Nguyen, B.T.; Luong, A.D. Impacts of effluent from different livestock farm types (pig, cow, and poultry) on surrounding water quality: A comprehensive assessment using individual parameter evaluation method and water quality indices. Environ. Sci. Pollut. 2021, 28, 50302–50315. [Google Scholar] [CrossRef] [PubMed]
- Mallin, M.A.; Johnson, V.L.; Ensign, S.H. Comparative impacts of stormwater runoff on water quality of an urban, a suburban, and a rural stream. Environ. Monit. Assess. 2009, 159, 475–491. [Google Scholar] [CrossRef]
- Kayhanian, M.; Fruchtman, B.D.; Gulliver, J.S.; Montanaro, C.; Ranieri, E.; Wuertz, S. Review of highway runoff characteristics: Comparative analysis and universal implications. Water Res. 2012, 46, 6609–6624. [Google Scholar] [CrossRef]
- Huang, J.L.; Du, P.F.; Ao, C.T.; Lei, M.H.; Zhao, D.Q.; Ho, M.H.; Wang, Z.S. Characterization of surface runoff from a subtropics urban catchment. J. Environ. Sci. 2007, 19, 148–152. [Google Scholar] [CrossRef]
- Zhao, H.; Ma, Y.; Fang, J.; Hu, L.; Li, X. Particle size distribution and total suspended solid concentrations in urban surface runoff. Sci. Total Environ. 2022, 815, 152533. [Google Scholar] [CrossRef]
- He, J.; Valeo, C.; Chu, A.; Neumann, N.F. Characterizing physicochemical quality of storm-water runoff from an urban area in Calgary, Alberta. J. Environ. Eng. 2010, 136, 1206–1217. [Google Scholar] [CrossRef]
- Koottatep, T.; Polprasert, C. Role of plant uptake on nitrogen removal in constructed wetlands located in the tropics. Water Sci. Technol. 1997, 36, 1–8. [Google Scholar] [CrossRef]
- Vymazal, J. Removal of nutrients in various types of constructed wetlands. Sci. Total Environ. 2007, 380, 48–65. [Google Scholar] [CrossRef] [PubMed]
- Hu, Y.; He, F.; Ma, L.; Zhang, Y.; Wu, Z. Microbial nitrogen removal pathways in integrated vertical-flow constructed wetland systems. Bioresour. Technol. 2016, 207, 339–345. [Google Scholar] [CrossRef] [PubMed]
- Ilyas, H.; Masih, I. The performance of the intensified constructed wetlands for organic matter and nitrogen removal: A review. J. Environ. Manag. 2017, 198, 372–383. [Google Scholar] [CrossRef] [PubMed]
- Lu, S.Y.; Wu, F.C.; Lu, Y.F.; Xiang, C.S.; Zhang, P.Y.; Jin, C.X. Phosphorus removal from agricultural runoff by constructed wetland. Ecol. Eng. 2009, 35, 402–409. [Google Scholar] [CrossRef]
- Saliu, T.D.; Oladoja, N.A. Assessing the suitability of solid aggregates for nutrient recovery from aqua systems. J. Water Process. Eng. 2020, 33, 101000. [Google Scholar] [CrossRef]
- Wang, S.; Yang, H.; Che, F.; Huang, W.; Yang, D. Removal efficacy of fly ash composite filler on tailwater nitrogen and phosphorus and its application in constructed wetlands. Front. Chem. 2020, 11, 1160489. [Google Scholar] [CrossRef] [PubMed]
- Hooda, P.S.; Edwards, A.C.; Anderson, H.A.; Miller, A. A review of water quality concerns in livestock farming areas. Sci. Total Environ. 2000, 250, 143–167. [Google Scholar] [CrossRef]
- Ghaly, A.E.; Ramakrishnan, V.V. Nitrogen sources and cycling in the ecosystem and its role in air, water and soil pollution: A critical review. J. Ind. Pollut. Control 2015, 3, 1–26. [Google Scholar]
- Vymazal, J.; Kröpfelová, L. Removal of nitrogen in constructed wetlands with horizontal sub-sureface flow: A review. Wetlands 2009, 29, 1114–1124. [Google Scholar] [CrossRef]
- Vymazal, J. Constructed wetlands for treatment of industrial wastewaters: A review. Ecol. Eng. 2014, 73, 724–751. [Google Scholar] [CrossRef]
- Bakhshoodeh, R.; Alavi, N.; Oldham, C.; Santos, R.M.; Babaei, A.A.; Vymazal, J.; Paydary, P. Constructed wetlands for landfill leachate treatment: A review. Ecol. Eng. 2020, 146, 105725. [Google Scholar] [CrossRef]
- Kadlec, R.H.; Wallace, S. Treatment Wetlands; CRC Press: Cleveland, OH, USA, 2008. [Google Scholar]
- Salem, M.; Mohamed, E.L.; Mossad, M.; Mahanna, H. Random Forest modelling and evaluation of the performance of a full-scale subsurface constructed wetland plant in Egypt. Ain Shams Eng. J. 2022, 13, 101778. [Google Scholar] [CrossRef]
- Povilaitis, A. Source apportionment and retention of nutrients and organic matter in the Merkys river basin in southern Lithuania. J. Environ. Eng. Landsc. 2008, 16, 195–204. [Google Scholar] [CrossRef]
- Li, D.; Wan, J.; Ma, Y.; Wang, Y.; Huang, M.; Chen, Y. Stormwater runoff pollutant loading distributions and their correlation with rainfall and catchment characteristics in a rapidly industrialized city. PLoS ONE 2015, 10, e0118776. [Google Scholar] [CrossRef] [PubMed]
- Liu, R.; Wang, J.; Shi, J.; Chen, Y.; Sun, C.; Zhang, P.; Shen, Z. Runoff characteristics and nutrient loss mechanism from plain farmland under simulated rainfall conditions. Sci. Total Environ. 2014, 468, 1069–1077. [Google Scholar] [CrossRef]
- Brodie, I.M.; Egodawatta, P. Relationships between rainfall intensity, duration and suspended particle washoff from an urban road surface. Hydrol. Res. 2011, 42, 239–249. [Google Scholar] [CrossRef]
- Gong, Y.; Fu, H.; Li, H.; Chen, Y.; Zhang, W.; Wu, L.; Li, Y. Influences of time scale on green stormwater infrastructure’s effect on suspended solids in urban rainfall runoff. J. Hydrol. 2021, 598, 126439. [Google Scholar] [CrossRef]
- Kjellin, J.; Wörman, A.; Johansson, H.; Lindahl, A. Controlling factors for water residence time and flow patterns in Ekeby treatment wetland, Sweden. Adv. Water Resour. 2007, 30, 838–850. [Google Scholar] [CrossRef]
Disclaimer/Publisher’s Note: The statements, opinions and data contained in all publications are solely those of the individual author(s) and contributor(s) and not of MDPI and/or the editor(s). MDPI and/or the editor(s) disclaim responsibility for any injury to people or property resulting from any ideas, methods, instructions or products referred to in the content. |
© 2024 by the authors. Licensee MDPI, Basel, Switzerland. This article is an open access article distributed under the terms and conditions of the Creative Commons Attribution (CC BY) license (https://creativecommons.org/licenses/by/4.0/).