Article

Assessment and Prediction of Groundwater Vulnerability Based on Land Use Change—A Case Study of the Central Urban Area of Zhengzhou

1
Technical Centre for Soil, Agriculture and Rural Ecology and Environment, Ministry of Ecology and Environment, Beijing 100012, China
2
School of Chemical & Environmental Engineering, China University of Mining & Technology-Beijing, Beijing 100083, China
3
China Energy Science and Technology Research Institute Co., Ltd., Nanjing 210023, China
*
Authors to whom correspondence should be addressed.
These authors contributed equally to this work.
Water 2024, 16(24), 3716; https://doi.org/10.3390/w16243716
Submission received: 1 December 2024 / Revised: 18 December 2024 / Accepted: 20 December 2024 / Published: 23 December 2024

Abstract

:
Driven by the rapid advancement of the economy and urbanization, substantial alterations in land use patterns have taken place, exerting certain impacts on groundwater. This study examines the land use changes in Zhengzhou’s central urban area from 2000 to 2020 and projects these changes to 2030 using the PLUS model. It optimizes the groundwater vulnerability assessment methodology from two key aspects, namely the evaluation indicators and the associated weights, to enhance its suitability for the study area. This study employs a multi-indicator and dual-method validation approach to verify the groundwater vulnerability assessment results, ensuring the accuracy and reliability of the findings. Urban, rural, and construction lands increased significantly, while paddy fields, drylands, and forests decreased. The 2030 prediction suggests a continuation of these trends. The groundwater vulnerability in 2020 correlated strongly with the groundwater quality, particularly with chloride ions (AUC = 0.804, Spearman’s rho = 0.83). The 2030 projection indicates a minimal change in the vulnerability distribution but anticipates an increase in high- and very-high-vulnerability areas, particularly in regions with land use changes, potentially increasing the groundwater contamination risk. This suggests the need for targeted groundwater protection policies to mitigate contamination risks.

1. Introduction

Water resources are vital for sustaining the currently rapidly developing global economy [1]. Given that groundwater serves as a primary source of drinking water, it is crucial for supporting socioeconomic development [2,3,4]. Therefore, achieving sustainable development of water resources is imperative. Nevertheless, the progression of socioeconomic development, along with increased industrial and agricultural activities and rapid urbanization, has significantly contributed to the degradation of groundwater quality. Many regions globally face the challenge of serious groundwater pollution [5,6,7]. Given that many of these regions, such as those in China, face water scarcity and rely heavily on groundwater as a vital source of drinking water, addressing the issue of groundwater contamination should be considered a critical priority [8,9,10]. Although groundwater monitoring is a critical aspect of managing groundwater quality, conventional monitoring approaches often require substantial labor and resources, making them less efficient [11,12]. Evaluating groundwater vulnerability serves as a fundamental cornerstone of effective groundwater management [13,14].
Previous groundwater vulnerability assessments have applied various methods, including GOD [15], AVI [16], EPIK [17], DRASTIC [18,19], etc. Most of these methods conduct groundwater vulnerability assessment through the overlay of several indicators. DRASTIC, the most widely applied of these, considers multiple factors influencing groundwater vulnerability and simplifies the data acquisition [20,21]. DRASTIC incorporates seven indicators: (1) depth to water (D); (2) net recharge (R); (3) aquifer media (A); (4) soil media (S); (5) topography (T); (6) vacuum zone impact (I); and (7) hydraulic conductivity (C). Although DRASTIC has been widely applied, variations in hydrogeological characteristics across regions often introduce subjectivity into the selection of parameters and the corresponding weights. Nevertheless, several previous studies utilizing DRASTIC for groundwater vulnerability assessment have demonstrated promising outcomes [22,23].
Recently, land use types have been integrated into the DRASTIC framework to account for the influence of human activities [24]. Human activities are increasingly being recognized by scholars as a factor influencing the probability of groundwater contamination [10,25]. Consequently, examining the spatiotemporal dynamics of various land use types and integrating them as an additional factor in groundwater vulnerability assessments can enhance the accuracy of identifying regions at risk of contamination [14,19].
Research has demonstrated a strong correlation between land use types and human activities. With the continuous development of urbanization, urban construction areas have expanded and human activities such as mining and industrial production have exerted certain impacts on the natural environment, leading to various forms of environmental pollution [7,9,25]. These include an increased risk of urban flooding [26], higher greenhouse gas emissions [27], and greater discharge of industrial pollutants [13]. In areas where economic development is prioritized, the shifts in land use patterns are especially pronounced, leading to various ecological and environmental challenges, with notable impacts on groundwater vulnerability, and consequently, on groundwater quality [28]. Different types of land use changes, including industrialization, urbanization, agricultural practices, and deforestation, have adverse effects on groundwater quality [29,30]. Liu et al. [31] investigated the relationship between NO3-N pollution in groundwater and land use types, revealing low NO3-N in forests and natural water bodies and high NO3-N in agricultural fields. The continuous changes in land use types, reflecting the intensification of human activities, lead to an increase in the nitrate content of groundwater due to agricultural irrigation and domestic pollution discharge, while industrial land generates industrial wastewater that increases the metal content of groundwater. Additionally, globally, land changes are also affecting groundwater quality, with negative correlations observed between land use types in Florida and certain indicators of groundwater quality [32]. Furthermore, changes in land use can also impact river transport [33] and regional carbon storage [34], thereby indirectly affecting groundwater quality through their influence on climate change. Consequently, comprehending and evaluating the dynamics and projected trends of land use changes in economically driven areas is essential for formulating effective strategies for future groundwater protection.
Land use simulation models can accurately predict future changes in land use types [35] and provide valuable guidance for land use planning and groundwater protection [36]. Currently, the commonly used land use simulation models include system dynamics models, gray prediction models, and logistic regression models [37]. Nevertheless, the majority of these models primarily emphasize the quantitative transitions between various land use types, often neglecting the intrinsic mechanisms and processes underlying ecosystem functions [35,38]. The patch-generating land use simulation (PLUS) model was developed to address this limitation [39]. It integrates patch-generation strategies with the CA model, preserving the benefits of adaptive inertia competition and roulette-based competition mechanisms [39,40]. This approach enhances understanding of the underlying drivers of land use changes and supports the simulation of land use patch dynamics effectively [39]. Consequently, this study utilizes the PLUS model to simulate the dynamics of land use changes.
The central urban area of Zhengzhou plays a crucial role within the city, making the quality of its groundwater environment a key factor influencing the overall socioeconomic development of the region [41]. Improved management and conservation of groundwater requires the evaluation of groundwater vulnerability. In this study, the land use types were integrated into an improved groundwater vulnerability assessment method. By incorporating changes in land use types, this study aims to evaluate and predict groundwater vulnerability. The objectives of this study are to (1) analyze and predict land use changes; (2) assess groundwater vulnerability using the improved groundwater vulnerability method; and (3) apply the receiver operating characteristic (ROC) curves, Spearman’s correlation coefficient and seven groundwater quality indicators to validate the results of the evaluation results. The results of the current study can help improve groundwater quality management and conservation.

2. Study Area

The mega-city of Zhengzhou is the capital of Henan Province, central China. The city acts as a national transportation hub and a commercial and logistics center and plays an important role in the Central Plains urban agglomeration. Zhengzhou also hosts the headquarters of the Joint Logistics Support Force in Zhengzhou.
The present study focuses on the central urban area of Zhengzhou, covering an area of 1010 km2. The study area falls into a semi-arid temperate climate zone, with a clear continental monsoon climate. The study area has four distinct seasons, characterized by dry and sandy spring conditions, hot and wet summers, a cool and sunny fall, and moderately cold, rainy, and snowy winters. Most of the study area has plain geomorphological characteristics, with loess hilly terrain confined to small areas in the northwest and southwest. The alluvial plain can be subdivided into two secondary geomorphic units: (1) piedmont alluvial plain; and (2) Yellow River alluvial plain.

3. Data and Methods

3.1. Data Preparation

The present study identified the aquifer water production and the lithology of the permeability zone using borehole data and the geological map of Zhengzhou City compiled by the Henan Geological Survey Institute. Groundwater level data were sourced from a past survey of groundwater levels and the monthly report on groundwater dynamics released by China’s Ministry of Water Resources China (http://www.mwr.gov.cn, accessed on 15 October 2023). Land use data were obtained from the Resource and Environmental Science Data Center (RESDC) of the Chinese Academy of Sciences (http://www.resdc.cn, accessed on 15 October 2023). The permeability and rainfall infiltration coefficients were derived from borehole data. Precipitation data for the study area were obtained from the China Meteorological Data Network (http://data.cma.cn, accessed on 15 October 2023). Data for validating the groundwater vulnerability evaluation were obtained by monitoring the quality of shallow groundwater in the central urban area of Zhengzhou in 2020. The groundwater quality is monitored according to the method provided in [42].
Data on the population density, annual mean temperature, annual precipitation, and gross domestic product (GDP) were obtained from the Resource and Environmental Science Data Platform (https://www.resdc.cn, accessed on 15 October 2023). Information regarding the distances to roads and railways was sourced from the National Catalogue Service for Geographic Information (https://www.webmap.cn, accessed on 15 October 2023). The digital elevation model (DEM) data were acquired from the Geospatial Data Cloud (https://www.gscloud.cn, accessed on 15 October 2023), and the slope values were derived from the DEM using appropriate calculations.

3.2. Simulation of Land Use Types

The PLUS model has been increasingly adopted by scholars as the preferred model for predicting land use changes due to its high accuracy in long-term forecasting. In this study, considering the socioeconomic development and natural environment of the study area, four anthropogenic driving factors (population density, distance to the road, distance to the railway, and GDP) and four natural driving factors (annual average temperature, annual precipitation, DEM, and slope) were selected. These eight driving factors were used to simulate th land use changes.
Using land use change data from 2010 as a baseline, we simulated the land use changes for 2020 and subsequently compared the predicted land use patterns for 2020 with the observed land use data for the same year. The accuracy of the prediction was validated using the Kappa coefficient. Following this, we projected the land use changes for 2030, utilizing the predicted land use data for 2030 to further assess the groundwater vulnerability for that year. The detailed calculation and verification process can be found in Sections S1 and S2.

3.3. Groundwater Vulnerability Assessment

3.3.1. DRASTIC Model

The DRASTIC indicator-based model considers factors influencing the hydrogeological properties of a region to characterize the quality of the groundwater environment. In the present study, seven evaluation indicators were considered: (1) depth to water (D); (2) net recharge (R); (3) aquifer media (A); (4) soil media (S); (5) topography (T); (6) vadose zone impact (I); and (7) hydraulic conductivity (C). Since these seven indicators make different contributions to groundwater vulnerability, a weight is assigned to each indicator reflecting its contribution. The groundwater vulnerability was calculated as follows:
D I = D r D w + R r R w + A r A w + S r S w + T r T w + I r I w + C r C w
where DI represents the DRASTIC index value, with the subscripts r and w denoting the rating and weight assigned to each factor, respectively.
DRASTIC is widely used for assessing groundwater vulnerability globally due to its simple calculation and easily accessible input data [43,44]. However, a shortcoming of the model relates to its subjectivity in the selection of model indicators. Consequently, the present study optimized the parameters of the traditional DRASTIC model [45].

3.3.2. Optimization of DRASTIC Model Indicators

This study refined the parameters of the conventional DRASTIC model to better account for the hydrogeological and natural environmental characteristics of the study area. During this process, the aquifer media (A) index was replaced with the aquifer thickness (A) index. The A index regulates the speed at which pollutants enter the groundwater, with the aquifer thickness inversely proportional to this rate and the probability of groundwater contamination [46]. The aquifer thickness is typically derived from borehole data and hydrogeological profile maps. Prior research has also substituted the aquifer media with the aquifer thickness in analogous studies. Since the aquifer permeability coefficient may be related to the aquifer media, the traditional DRASTIC model contains overlapping indicators that reduce its accuracy in reflecting groundwater vulnerability. The present study also incorporated land use indicators (L) into the model as the different types of land use have different impacts on the groundwater quality [25]. For example, the discharge of industrial wastewater and application of agricultural fertilizers have drastically different effects on the groundwater quality [13,47]. The optimized DRASTIC model proposed in the present study is termed DRASTICL, with each letter in the abbreviation representing an indicator. The DRASTICL model was calculated as follows:
D V = D r D w + R r R w + A r A w + S r S w + T r T w + I r I w + C r C w + L r L w
Here, DV denotes the groundwater vulnerability index, with the subscripts r and w representing the factor’s rating and weight, respectively. The value of DV is directly proportional to the groundwater vulnerability.
The present study assigned eight indicators to the DRASTICL model, with scores of between 1 and 10 based on their classification in the study area (Table S1).

3.3.3. DRASTIC Model Indicator Weight Optimization

While previous studies have widely applied AHP in the DRASTIC model [45,48,49], its numerical estimation of the pairwise importance of the indicators increases the subjectivity. Therefore, the present study applied fuzzy AHP to reassign weights to indicators. fuzzy AHP differs from AHP by using triangular fuzzy numbers (TFNs) for pairwise comparisons of various indicators [50]. The use of TFNs avoids ambiguity and increases the precision and certainty of language scales [51,52]. The fuzzy AHP method employs interval values rather than exact numbers to express the comparative intensities between elements. It utilizes fuzzy ratios to define the levels of importance (e.g., equally important, weakly more important, moderately more important, strongly more important, and very strongly more important) for pairwise comparisons among attributes.
The present study applied fuzzy AHP to construct a hierarchical model network for the eight indicators in the optimized DRASTICL model. A subjective ranking of 1–10 was assigned to each DRASTICL parameter based on expert opinion and relevant scientific achievements, with the levels corresponding to the contribution of an indicator to the groundwater vulnerability index. This ranking was further standardized to a scale of 1–9. Fuzzy AHP was used to identify a comprehensive normalized index value as follows:
Step 1: Define the fuzzy comprehensive degree value of the ith object.
S i = j = 1 m M g i j × i = 1 n j = 1 m M g i j 1
An additional fuzzy addition is performed on a specific m analysis value to achieve j = 1 m M g i j , s:
j = 1 m M g i j = j = 1 m l j , j = 1 m m j , j = 1 m u j
Fuzzy addition is applied to M g i j (j=1,2,…,m) to achieve i = 1 n j = 1 m M g i j 1 :
i = 1 n j = 1 m M g i j = i = 1 n l j , i = 1 n m j , i = 1 n u j
i = 1 n j = 1 m M g i j 1 = 1 i = 1 n u 1 , 1 i = 1 n m 1 , 1 i = 1 n l 1
Step 2: Define M 2 = l 2 , m 2 , u 2 M 1 = l 1 , m 1 , u 1
= 1 , m 2 m 1 0 , m 2 < m 1 ,       u 1 l 2 l 1 u 1 m 2 u 2 m 1 u 2 o t h e r w i s e
Step 3: The likelihood of a convex fuzzy number exceeding k convex fuzzy numbers M i ( i = 1,2 , , k ) is calculated as follows:
V = M M 1 , M 2 , , M k = V M M 1   a n d   M M 2   a n d   M M k = m i n V M M i , i = 1,2 , , k
Assume   d 1 A 1 = m i n V S 1 S k
So   W = d A 1 , d A 2 , , d A n T
Step 4: Calculate the normalized weight vector:
W = d A 1 , d A 2 , , d A n T
Assign W as the weight of each indicator in the DRASTICL model.

3.4. Verification of Groundwater Vulnerability Assessment Results

This study employed two approaches to validate the accuracy of the groundwater vulnerability assessment: (1) ROC curve; and (2) Spearman’s correlation coefficient. Prior studies have also utilized the ROC curve to evaluate the accuracy of groundwater vulnerability assessments. The ROC curve depicts the sensitivities across various threshold values and demonstrates both the true and false positive rates. Each point on the curve corresponds to a specific classifier, where the X-axis (1-specificity) indicates the likelihood of misclassification of the groundwater vulnerability levels, and the Y-axis represents the probability of correct classification. The area under the ROC curve (AUC), which ranges from 0 to 1, serves as an indicator of the classifier’s performance. A higher AUC value indicates greater accuracy in the assessment of groundwater vulnerability. Spearman’s correlation is often used to describe the degree and direction of correlation between two variables and is widely used as a validation method in the evaluation of groundwater vulnerability. A Spearman’s correlation coefficient exceeding 0.5 is generally considered to represent a correlation between two variables and is proportional to the strength of the correlation:
ρ = 1 6 i = 1 N d i 2 N ( N 2 1 )
Here, ρ represents the Spearman’s correlation coefficient, N denotes the total number of samples, and d refers to the difference between the rank of the water quality concentration at point i and the rank of the groundwater vulnerability at the same point.
This study verified the outcomes of the groundwater vulnerability assessment through the application of seven specific indicators: total dissolved solids, chloride ions, sulfates, nitrates, ammonia nitrogen, iron ions, and chemical oxygen demand (COD).

4. Results and Discussion

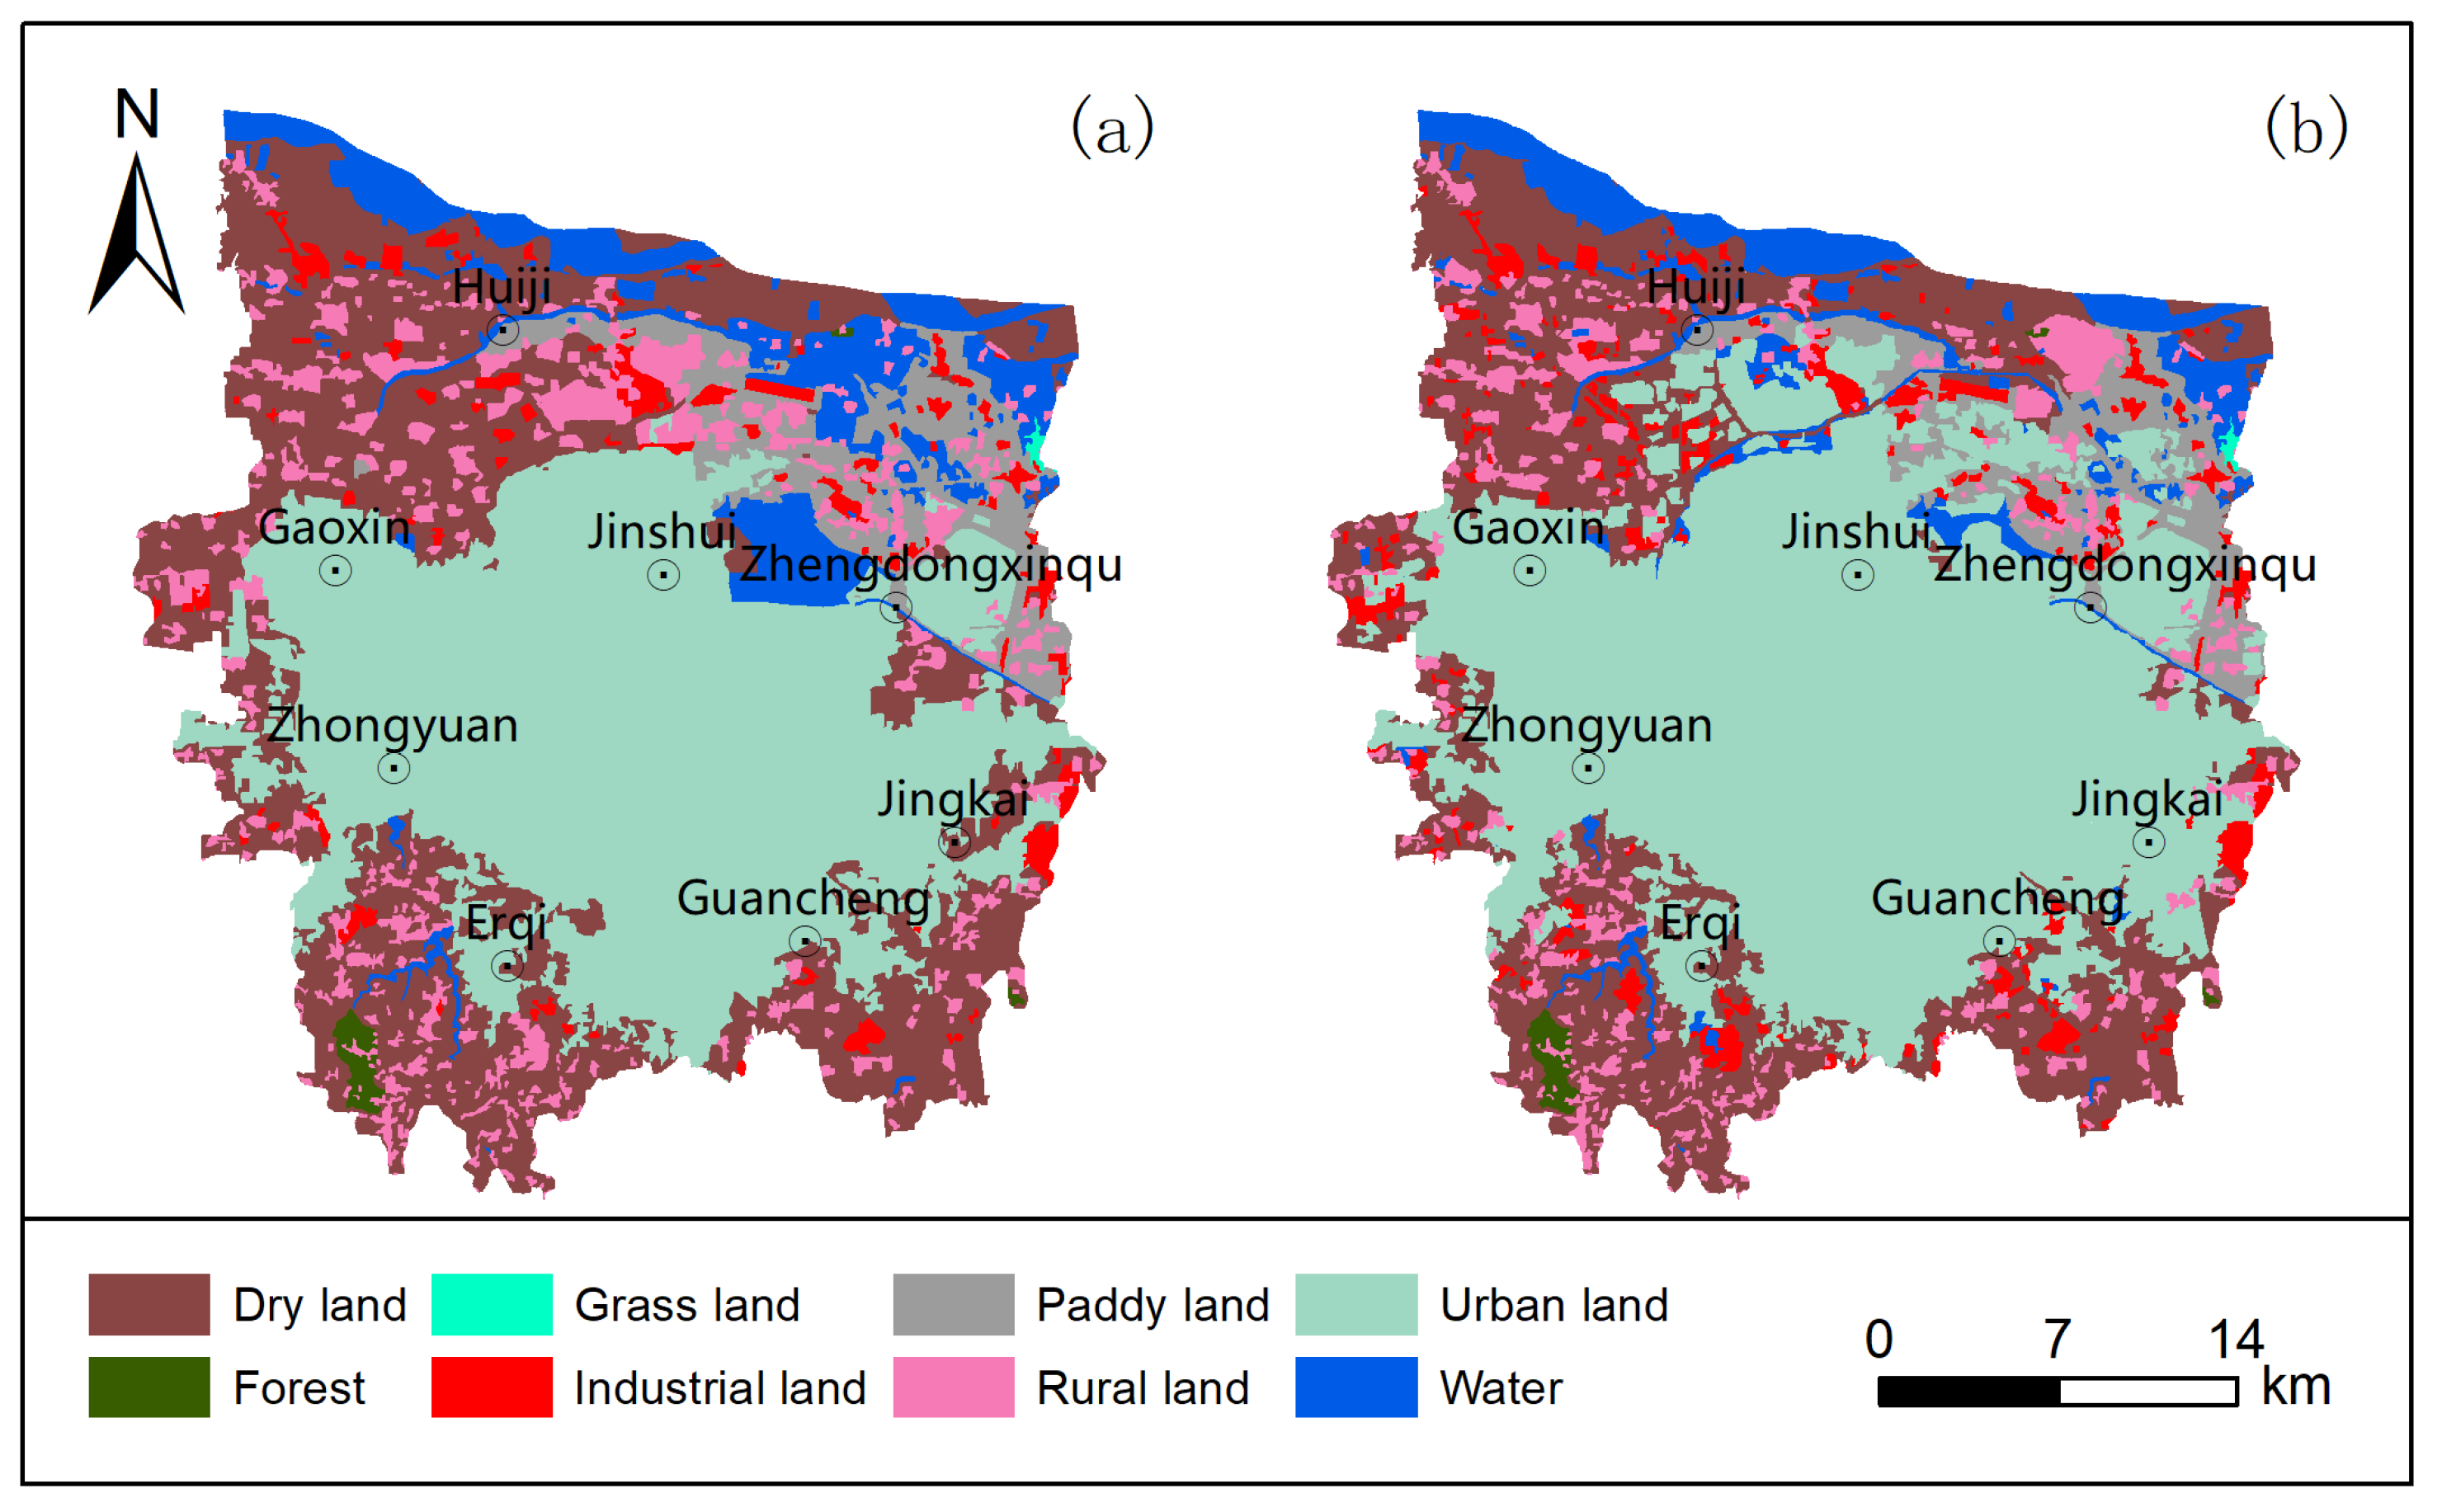
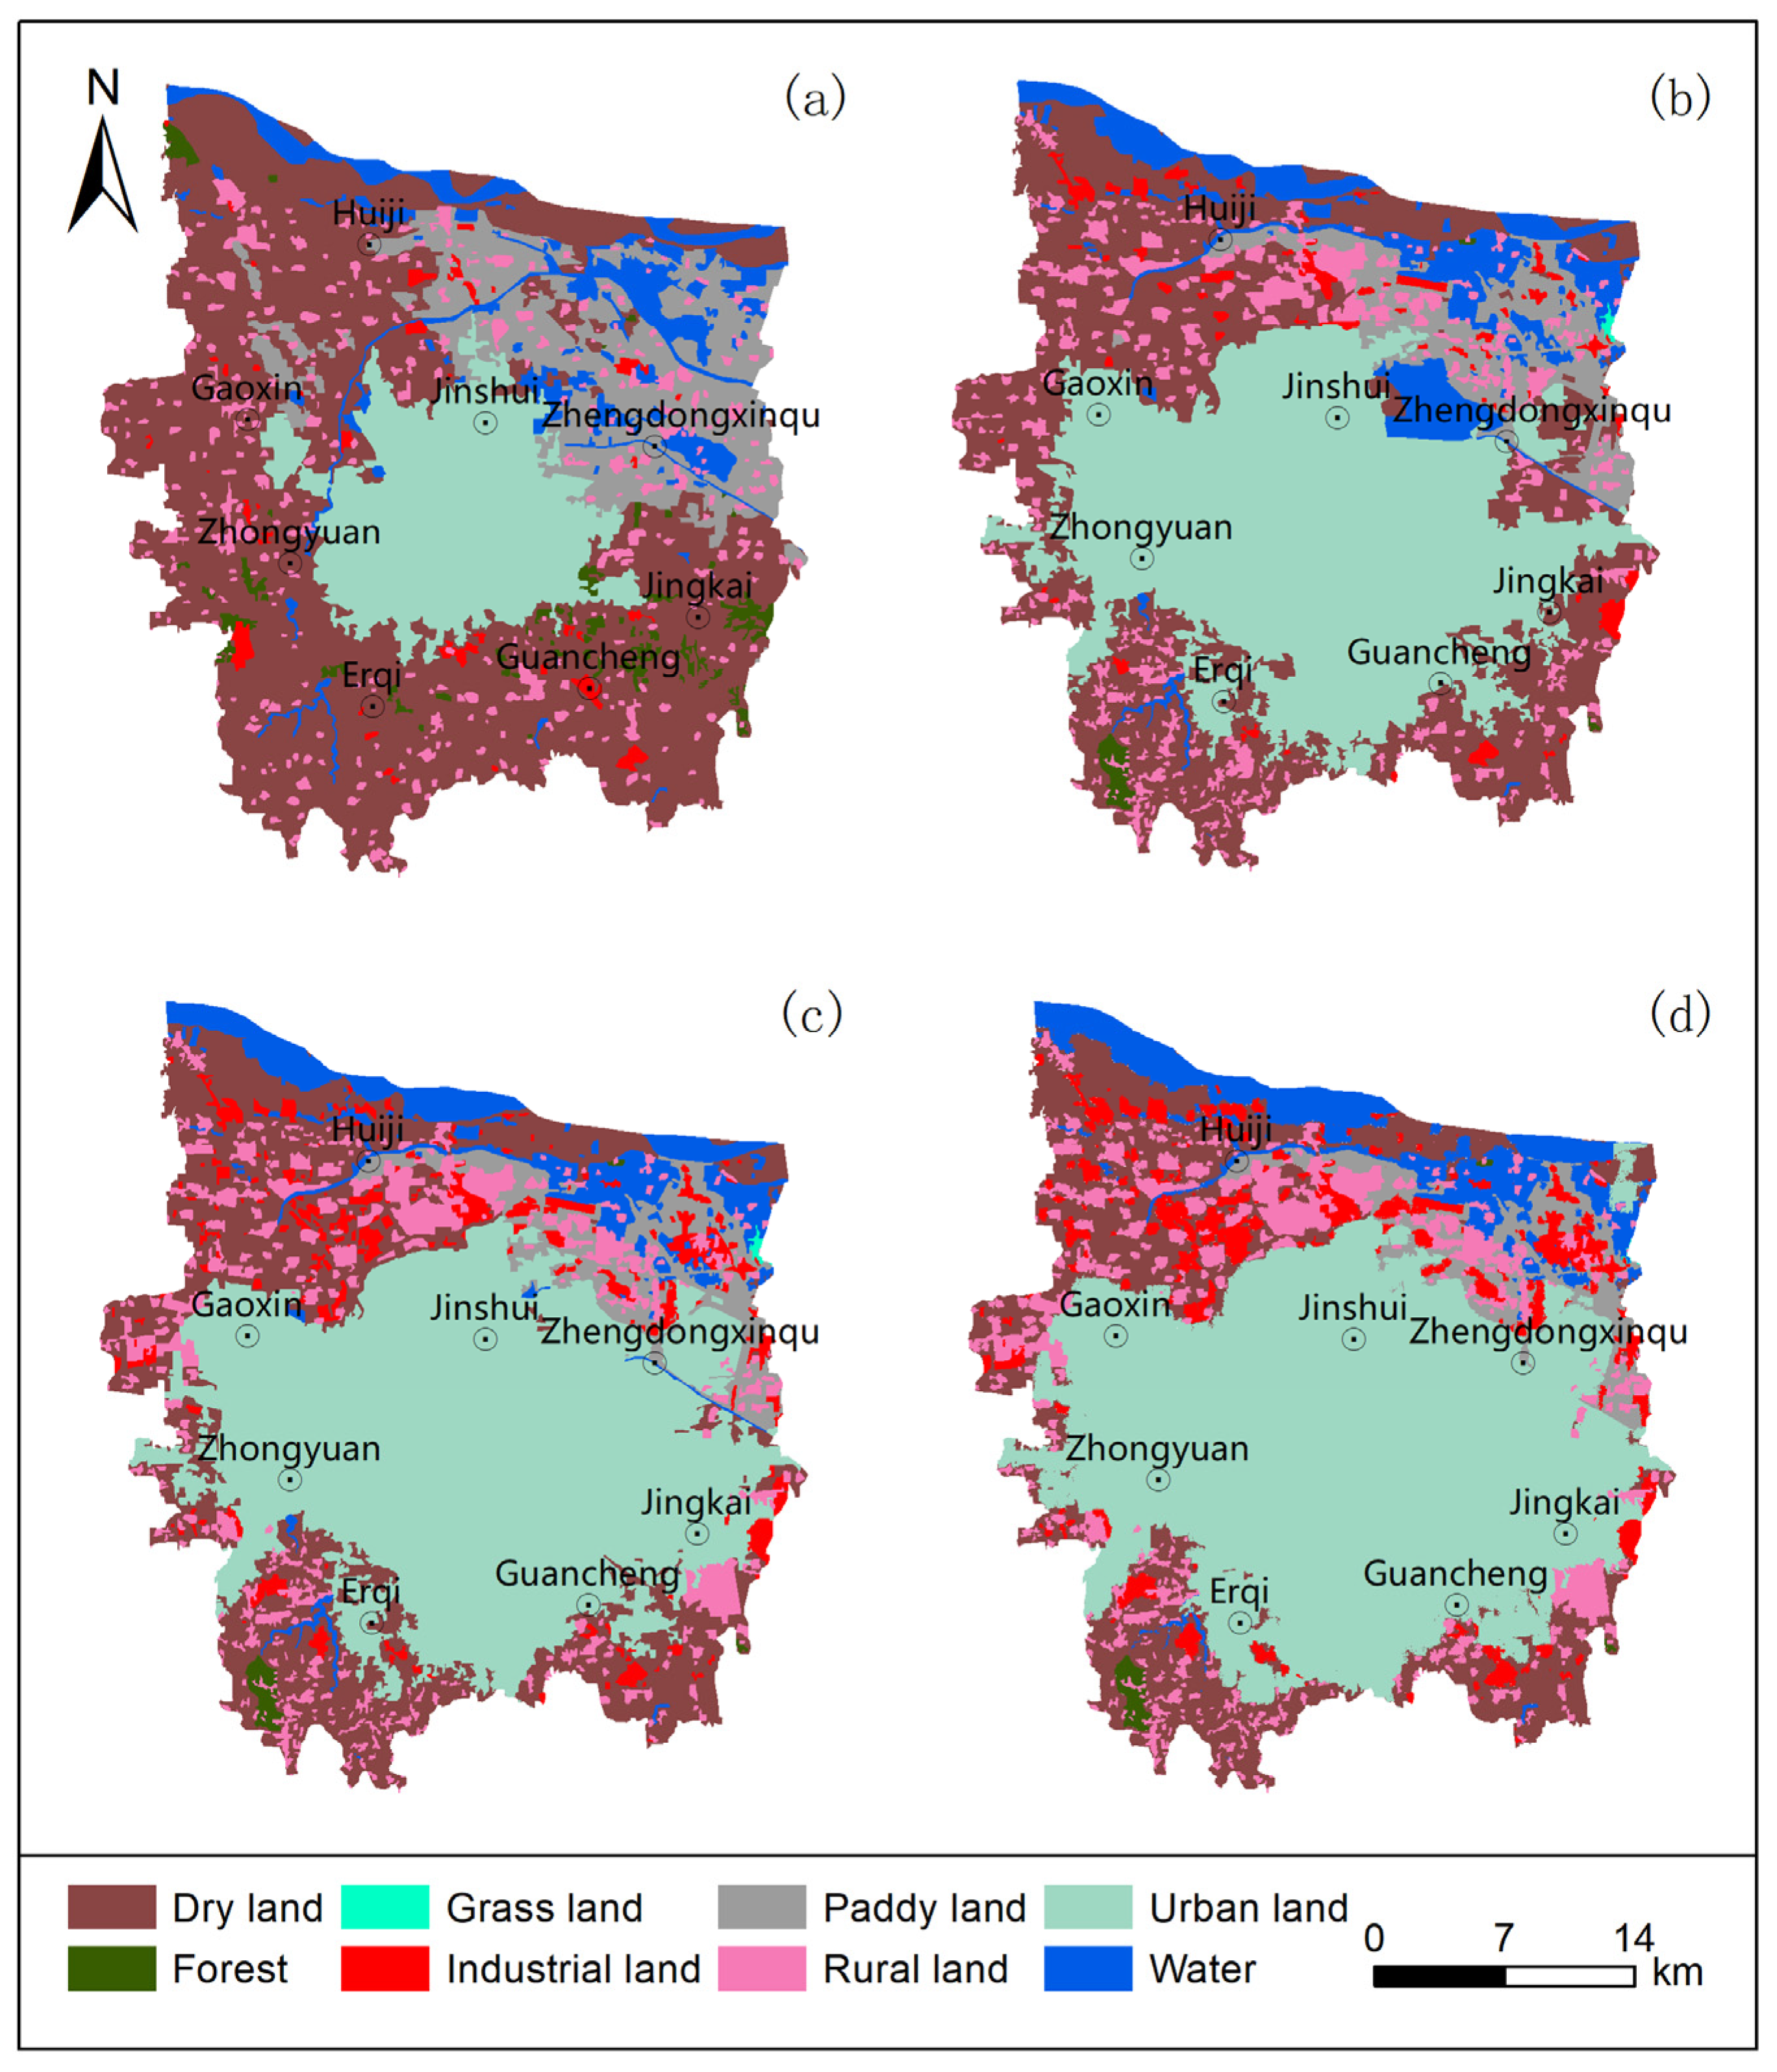
4.1. Temporal and Spatial Variation Characteristics of Land Use from 2000 to 2020

Human activities and urban development have significantly influenced the land use patterns in the central urban area of Zhengzhou (Figure 1). Over the study period, the dominant land use type transitioned from dryland in 2000 to urban land in both 2010 and 2020. Urban land accounted for 52.25%, 40.19%, and 47.46% of the total area in 2000, 2010, and 2020, respectively. Over the past two decades, the dryland area decreased by approximately 332.28 km2, while the urban land increased by approximately 360.42 km2. The most dramatic changes in terms of the dryland reduction and urban land expansion occurred between 2000 and 2010, reflecting the rapid urbanization during this period. Although this urbanization spurred on high economic growth, it also led to a reduction in cropland, which could potentially decrease grain production.
Between 2000 and 2020, forest land exhibited a pattern of rapid decline followed by modest recovery, with its area reducing from 19.37 km2 in 2000 to 4.36 km2 in 2010, and subsequently increasing slightly to 4.37 km2 by 2020. Grassland remained relatively stable, with only a 0.01 km2 reduction over 20 years. The water body area first increased and then decreased, rising from 71.79 km2 in 2000 to 69.31 km2 in 2020, then declining slightly to 70.76 km2. Both rural and construction land exhibited similar growth trends, with increases of 30.21 km2 and 33.81 km2, respectively, over the two decades. Notably, construction land expanded by a factor of two. The extent of the paddy fields was reduced by half, declining from 143.11 km2 in 2000 to 53.03 km2 in 2020 (Table 1).
The land use changes over these two decades indirectly reflect the rapid industrial and economic development in the study area. By 2020, the urban land area was approximately three times larger than that in 2000, and industrial land increased by 2.5 times. These rapid changes in the land use patterns provided the necessary conditions for the study area’s economic growth. Although the central urban area of Zhengzhou only accounts for about 17% of Zhengzhou’s total area, its GDP is nearly half of the city’s total GDP [53,54]. With rapid economic growth, the population influx into the central urban area has accelerated urbanization and expanded urban land. By the end of 2022, the population of the central urban area accounted for about 98% of Zhengzhou’s total permanent population, while the built-up area represented approximately 56% of the entire city’s urban built-up area [55,56].
Regarding the spatial distribution, the water body area in the northern region, predominantly located along the Yellow River, exhibited an initial expansion followed by a subsequent contraction. The urban land in the central part of the study area experienced substantial outward growth, accompanied by a corresponding decline in agricultural land, including paddy fields and dryland. While dryland is dispersed across the study area, paddy fields are primarily concentrated in the northeastern region near the Yellow River.

4.2. Prediction of LULC Changes in 2030 Based on the Markov–PLUS Model

In this study, land use data from 2000 and 2010 were employed to predict the distribution of various land use types in 2020 using the Markov–PLUS model. The predicted land use for 2020 was compared with the observed 2020 land use data for the accuracy evaluation (Figure 2), resulting in a Kappa coefficient of 0.83, which satisfies the accuracy requirements. Based on the actual land use data from 2010 and 2020, the land use in 2030 was predicted (Figure 3), with eight driving factors selected, as shown in Figure S1. Among these, the DEM and average annual temperature had more significant effects on forest and water areas than other natural factors. The GDP and population density were more closely related to changes in urban, rural, and construction land.
By 2030, the areas of urban and construction land are projected to experience substantial growth compared to 2020, whereas grassland and dryland are anticipated to undergo notable reductions. Over the period from 2000 to 2030, rural land, urban land, and construction land demonstrate a consistent upward trend, with their areas increasing by 1.52-fold, 3.20-fold, and 4.81-fold, respectively. These transformations are influenced by a combination of natural and anthropogenic factors. The key natural drivers include the average annual rainfall and temperature, while the GDP and population density represent the dominant human-related factors. On the other hand, forest land, grassland, dryland, and paddy fields are predicted to continue decreasing, with the areas shrinking by 77.54%, 85.50%, 63.17%, and 69.18%, respectively.
The land use changes observed between 2000 and 2030 are consistent with Zhengzhou’s ongoing strategy to promote rapid economic growth. The successive establishment of functional zones in the central urban area, such as the High-Tech Zone, Economic Development Zone, and Zhengdong New District, has led to the continuous expansion of urban and construction land [54]. Nevertheless, this expansion has unavoidably encroached upon other land use categories, leading to a decline in areas such as paddy fields and dryland. With the enforcement of national policies, including the promotion of ecological civilization and the preservation of the arable land redline, there has been a growing focus on monitoring and addressing ecological changes [55]. While the central urban area of Zhengzhou has experienced a decline in paddy fields, dryland, and forested land, the rate of reduction has progressively decelerated. The most pronounced losses were observed during the phase of rapid economic expansion from 2000 to 2010. However, as the city responded to national calls for economic transformation, the rate of reduction in agricultural and forest land has been gradually declining.

4.3. Results of the DRASTICL Model and Verification

4.3.1. Results of the DRASTICL Model
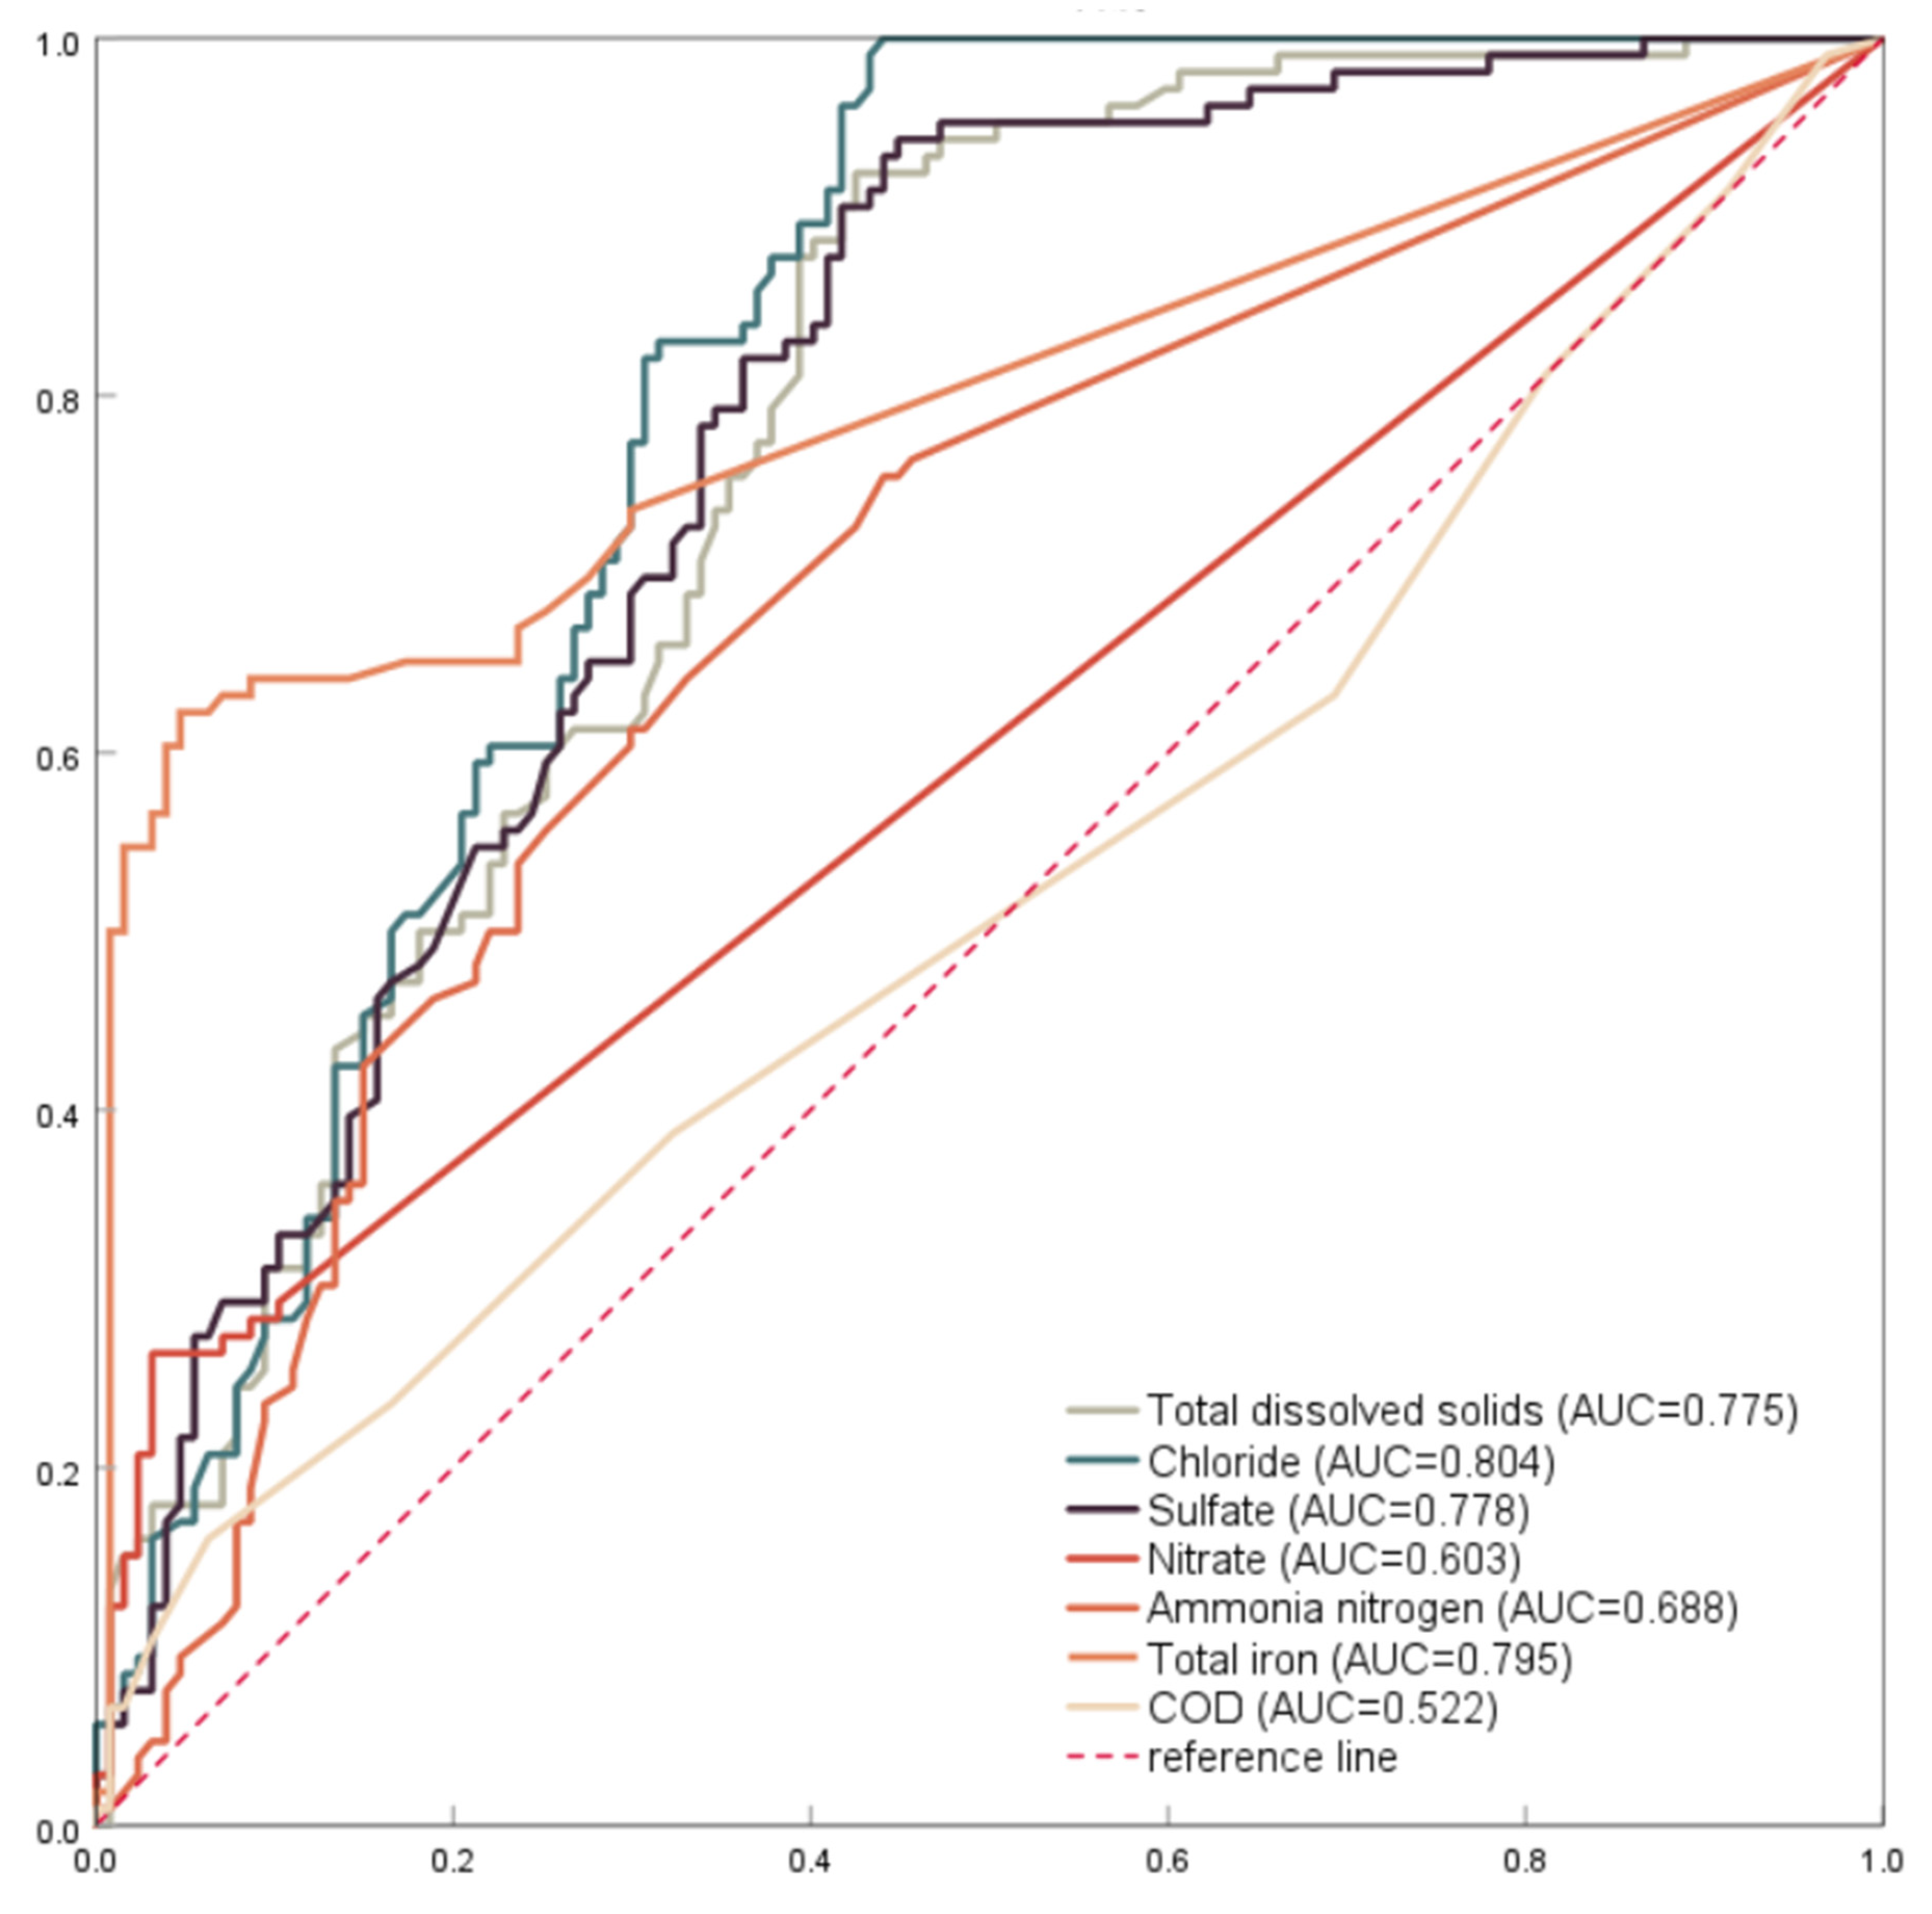
Figure S2 illustrates the indicators incorporated within the DRASTICL model, while Table 2 outlines the weights assigned to these indicators, as determined through fuzzy analysis. The groundwater vulnerability index was calculated using the formula presented in Equation (2). The results of the groundwater vulnerability assessment across the study area are shown in Figure 4 and are categorized into five levels: (1) very low, (2) low, (3) medium, (4) high, and (5) very high. Most of the study area (458.19 km2; 45.47%) had a moderate vulnerability level, followed by low (29.56%), high (19.33%), very high (5.63%), and very low (0.01%).
Regions exhibiting high and very high groundwater vulnerability were predominantly located in Huiji, Guancheng, and Jinshui. These areas are characterized by shallow groundwater levels and a thinner vadose zone, which facilitate the rapid migration of pollutants into the groundwater [56,57,58,59]. The above areas also contain concentrated industrial land, thereby contributing to the vulnerability to groundwater pollution [25]. Ref. [60] indicated that the groundwater level is a critical indicator affecting groundwater vulnerability. A study evaluating groundwater vulnerability in a specific region of Iran highlighted the critical influence of groundwater levels on the overall vulnerability. The dominant topography of Huiji’s floodplain as well as its course soil particles facilitates the infiltration of pollutants into the groundwater [61,62]. This factor could potentially contribute to the region’s high vulnerability. Areas with very low to low vulnerability were predominantly located in the mountainous alluvial plains of Gaoxin and Zhongyuan, as well as in Jinshui and Zhengdongxinqu. These areas are characterized by deep groundwater, mainly clay loam soil, and a wide vadose zone, which work collectively to increase the time required for pollutants to enter the groundwater. Ref. [63] found that different soil types have varying effects on the groundwater vulnerability during their assessment of groundwater vulnerability. The adsorption of pollutants into soil also reduces the pollutant load entering groundwater and greatly reduces the probability of groundwater contamination.

4.3.2. Verification

This study validated the groundwater vulnerability assessment results through the use of water quality indicators. In contrast, prior research has frequently employed the groundwater nitrate as a means to confirm the accuracy of vulnerability evaluations [64,65,66]. This is attributed to the fact that groundwater nitrate serves as an effective indicator of anthropogenic impacts on groundwater systems [67,68]. Human activities represented by different land use types generate various sources of pollution. For example, industries utilizing metals produce large volumes of wastewater containing metals [69,70], whereas the printing and dyeing industries discharge wastewater containing sulfides, chlorides, and cyanide [71,72,73]. Metal-smelting enterprises generate wastewater containing metals, such as iron, during their production processes [26]. Therefore, the present study selected seven indicators to verify the groundwater vulnerability, including the total dissolved solids, chloride ions, sulfates, nitrates, ammonia nitrogen, iron ions, and COD.
Figure S3 illustrates that a total of 233 groundwater monitoring points were established in the study area for this research. The data collected from these points were utilized to validate the groundwater vulnerability assessment results. Table 3 provides an overview of the seven water quality parameters analyzed within the study region. The results of the ROC curve and Spearman’s correlation coefficient methods used in the validation are shown in Figure 5 and Table 3. The water quality indicator showing the strongest relationship to the groundwater vulnerability was chloride ions (AUC = 0.804), which mainly originate from the printing and textile industries. The maximum measured groundwater chloride ions in the study area was 1020 mg/L, far exceeding the prescribed Class V groundwater standard. In contrast, the COD showed the lowest correlation to the groundwater vulnerability (AUC = 0.522). This may be attributed to the fact that domestic wastewater generated by human activities has a lesser impact on groundwater compared to effluents from industrial pollution sources. Similarly, the results of the Spearman’s correlation identified chloride and COD as having the strongest and weakest relationships to groundwater vulnerability (Spearman’s correlation coefficient = 0.83, 0.54), respectively. The groundwater vulnerability assessment results demonstrated strong alignment with the groundwater quality monitoring data in the study area, confirming the robustness and reliability of the evaluation outcomes. Both validation results identified a weak relationship between nitrate and groundwater vulnerability. This result can be attributed to the fact that this study considered the impact of human activities, driven by different land use types, on groundwater. The weak correlation between nitrate and groundwater vulnerability identified in the present study is consistent with the results in [13,14]. Consequently, there is a need to focus on areas with high groundwater vulnerability loads within groundwater management and conservation. Groundwater management can be optimized by implementing control measures in these areas.

4.4. Changes in Groundwater Vulnerability

The predicted land use data for 2030 was overlaid with several other groundwater vulnerability factors to derive the groundwater vulnerability for 2030 (Figure 4). Similarly, the groundwater vulnerability was classified into five levels: very low, low, moderate, high, and very high, and these levels were compared with the areas of each vulnerability level in 2020 (Table 4). The results show that the areas with very low, low, and moderate groundwater vulnerability exhibited a decreasing trend, shrinking by 0.46 km2, 8.1 km2, and 14.97 km2, respectively, primarily in the southwestern and central–western parts of the study area. Conversely, the areas with high and very high groundwater vulnerability increased by 6.87 km2 and 0.81 km2, respectively, primarily in the central–western and central–eastern parts of the study area. These variations are strongly associated with the transformations in land use projected to occur between 2020 and 2030. Compared to the groundwater vulnerability in 2020, there is little change in the area of groundwater vulnerability across all levels in 2030. This is primarily because the groundwater vulnerability in this study is determined by eight factors. Although there has been a significant change in land use types from 2020 to 2030, the mere change in the area of land use types alone will not cause a drastic change in groundwater vulnerability.
While the variations in groundwater vulnerability from 2020 to 2030 are less significant compared to the land use changes during this period, the expansion of areas categorized as having high or very high vulnerability warrants attention, as it indicates an increasing likelihood of groundwater contamination in these regions. The current status of the groundwater quality in Zhengzhou is concerning, with evidence of pollution already present. Among the 233 groundwater quality sampling points collected (Table 3 and Figure S3), five of the seven indicators used for validation—TDS, chloride, sulfate, nitrate, and total iron—exceeded the maximum allowable limits. The most severe exceedance was observed for the total iron, which was 42.33 times higher than the standard limit. In the newly established Economic Development Zone, in recent years, the groundwater vulnerability level has significantly increased, indicating a growing risk of groundwater contamination. Therefore, in areas of high and very high groundwater vulnerability, appropriate protection measures should be adopted, such as prohibiting the construction of new industrial enterprises and implementing necessary control measures for highly polluting enterprises to reduce the emission of pollutants. In the future implementation of groundwater management measures, adjustments should also be made according to the actual situation of the study area to prevent further deterioration of groundwater quality.

5. Conclusions

This study focuses on the central urban area of Zhengzhou, analyzing and quantifying the land use changes over recent decades and predicting the future land use types. The groundwater vulnerability was assessed and forecasted by integrating factors such as the depth to water, net recharge, aquifer media, soil media, topography, vadose zone impact, hydraulic conductivity, and land use types. The results indicate that, due to rapid urbanization, urban land use is gradually expanding in the central part of the study area, while paddy fields and dryland are steadily decreasing. However, the rate of cropland reduction is slowing down due to the implementation of national policies on farmland protection. Forestland and water body changes are primarily driven by natural factors, including the DEM and annual mean temperature, whereas transformations in urban, rural, and construction land are largely shaped by anthropogenic influences, such as the GDP growth and population density.
In the groundwater vulnerability assessment, a strong correlation was observed between groundwater vulnerability and groundwater quality in 2020. Regions with high and very high vulnerability are predominantly located in the northern, southeastern, and western sections of the study area. While minimal changes are expected between 2020 and 2030, the projected expansion of these vulnerable areas may elevate the risk of groundwater contamination. High and very high vulnerability areas should be paid special attention, with different groundwater protection measures formulated for varying levels of vulnerability. Concurrently, groundwater management and protection efforts should be tailored to the local conditions, taking into account the socioeconomic development of the study area.
Due to data limitations, this study did not assess the groundwater vulnerability for 2000 and 2010. Future research should expand the temporal scope of the groundwater vulnerability studies to facilitate a more nuanced investigation of the trends in groundwater vulnerability. In terms of the validation indicators, a more comprehensive set of water quality parameters could be selected to validate the groundwater vulnerability, enhancing the accuracy of the results and thereby enabling managers to implement more effective groundwater management measures for protection. Additionally, this study provides a viable methodology for vulnerability assessments in other regions.

Supplementary Materials

The following supporting information can be downloaded at https://www.mdpi.com/article/10.3390/w16243716/s1 [74,75]. Text S1: The formula of LULC transfer matrix; Text S2: The calculation of Markov-Plus model; Table S1: Groundwater vulnerability index score; Figure S1: Land expansion drivers, (a) population density, (b) GDP, (c) distance to the road, (d) distance to the railway, (e) annual precipitation, (f) annual average temperature, (g) DEM, (h) slope; Figure S2: Map of various indicators of groundwater vulnerability, (a) depth to water, (b) net recharge, (c) aquifer thickness, (d) soil media, (e) topography, (f) vadose zone impact, (g) hydraulic conductivity, (h) land-use type; Figure S3: Monitoring well water quality map

Author Contributions

W.Y.: Writing—review and editing, writing—original draft, validation, formal analysis. Z.W.: Writing—review and editing, writing—original draft, formal analysis. T.Z.: Formal analysis. Z.L.: Formal analysis. Y.M.: Formal analysis. Y.X.: Investigation, formal analysis. F.A.: Writing—review and editing, writing—original draft, supervision, conceptualization. All authors have read and agreed to the published version of the manuscript.

Funding

This research was funded by [Yan Ma] grant number [2022SKHH01] And The APC was funded by [Wenchao Yuan].

Data Availability Statement

All relevant data are presented in the manuscript and its associated files.

Acknowledgments

This work was financially supported by the Social Science Special Projects, General Program (Grant No. 2022SKHH01).

Conflicts of Interest

Author Fengxia An was employed by the company China Energy Science and Technology Research Institute Co., Ltd. The remaining authors declare that the research was conducted in the absence of any commercial or financial relationships that could be construed as a potential conflicts of interest.

References

  1. Li, P.; Qian, H.; Zhou, W. Finding harmony between the environment and humanity: An introduction to the thematic issue of the Silk Road. Environ. Earth Sci. 2017, 76, 105. [Google Scholar] [CrossRef]
  2. Cassardo, C.; Jones, J.A.A. Managing Water in a Changing World. Water 2011, 3, 618–628. [Google Scholar] [CrossRef]
  3. Salman, S.A.; Arauzo, M.; Elnazer, A.A. Groundwater quality and vulnerability assessment in west Luxor Governorate, Egypt. Groundw. Sustain. Dev. 2019, 8, 271–280. [Google Scholar] [CrossRef]
  4. Yu, H.; Gui, H.; Zhao, H.; Wang, M.; Li, J.; Fang, H.; Jiang, Y.; Zhang, Y. Hydrochemical characteristics and water quality evaluation of shallow groundwater in Suxian mining area, Huaibei coalfield, China. Int. J. Coal Sci. Technol. 2020, 7, 825–835. [Google Scholar] [CrossRef]
  5. Aravinthasamy, P.; Karunanidhi, D.; Subramani, T.; Srinivasamoorthy, K.; Anand, B. Geochemical evaluation of fluoride contamination in groundwater from Shanmuganadhi River basin, South India: Implication on human health. Environ. Geochem. Health 2020, 42, 1937–1963. [Google Scholar] [CrossRef]
  6. Li, P.; Wu, J. Drinking Water Quality and Public Health. Expo. Health 2019, 11, 73–79. [Google Scholar] [CrossRef]
  7. Zhang, Y.; Wu, J.; Xu, B. Human health risk assessment of groundwater nitrogen pollution in Jinghui canal irrigation area of the loess region, northwest China. Environ. Earth Sci. 2018, 77, 273. [Google Scholar] [CrossRef]
  8. Han, D.; Currell, M.J.; Cao, G. Deep challenges for China’s war on water pollution. Environ. Pollut. 2016, 218, 1222–1233. [Google Scholar] [CrossRef] [PubMed]
  9. Su, Z.; Wu, J.; He, X.; Elumalai, V. Temporal Changes of Groundwater Quality within the Groundwater Depression Cone and Prediction of Confined Groundwater Salinity Using Grey Markov Model in Yinchuan Area of Northwest China. Expo. Health 2020, 12, 447–468. [Google Scholar] [CrossRef]
  10. Wei, M.; Wu, J.; Li, W.; Zhang, Q.; Su, F.; Wang, Y. Groundwater Geochemistry and its Impacts on Groundwater Arsenic Enrichment, Variation, and Health Risks in Yongning County, Yinchuan Plain of Northwest China. Expo. Health 2022, 14, 219–238. [Google Scholar] [CrossRef]
  11. Abunada, Z.; Kishawi, Y.; Alslaibi, T.M.; Kaheil, N.; Mittelstet, A. The application of SWAT-GIS tool to improve the recharge factor in the DRASTIC framework: Case study. J. Hydrol. 2021, 592, 125613. [Google Scholar] [CrossRef]
  12. Jang, W.; Engel, B.; Harbor, J.; Theller, L. Aquifer Vulnerability Assessment for Sustainable Groundwater Management Using DRASTIC. Water 2017, 9, 792. [Google Scholar] [CrossRef]
  13. Li, X.; Wu, H.; Qian, H. Groundwater contamination risk assessment using intrinsic vulnerability, pollution loading and groundwater value: A case study in Yinchuan plain, China. Environ. Sci. Pollut. Res. 2020, 27, 45591–45604. [Google Scholar] [CrossRef] [PubMed]
  14. Zhang, Q.; Li, P.; Lyu, Q.; Ren, X.; He, S. Groundwater contamination risk assessment using a modified DRATICL model and pollution loading: A case study in the Guanzhong Basin of China. Chemosphere 2022, 291, 132695. [Google Scholar] [CrossRef]
  15. Boulabeiz, M.; Klebingat, S.; Agaguenia, S. A GIS-Based GOD Model and Hazard Index Analysis: The Quaternary Coastal Collo Aquifer (NE-Algeria). Groundwater 2019, 57, 166–176. [Google Scholar] [CrossRef]
  16. Van Stempvoort, D.; Ewert, L.; Wassenaar, L. Aquifer vulnerability index: A GIS-compatible method for groundwater vulnerability mapping. Can. Water Resour. J. 1993, 18, 25–37. [Google Scholar] [CrossRef]
  17. Nekkoub, A.; Baali, F.; Hadji, R.; Hamed, Y. The EPIK multi-attribute method for intrinsic vulnerability assessment of karstic aquifer under semi-arid climatic conditions, case of Cheria Plateau, NE Algeria. Arab. J. Geosci. 2020, 13, 709. [Google Scholar] [CrossRef]
  18. Hamza, S.M.; Ahsan, A.; Imteaz, M.A.; Rahman, A.; Mohammad, T.A.; Ghazali, A.H. Accomplishment and subjectivity of GIS-based DRASTIC groundwater vulnerability assessment method: A review. Environ. Earth Sci. 2015, 73, 3063–3076. [Google Scholar] [CrossRef]
  19. Raj, A.; Sinha, A.; Singh, A.; Pasupuleti, S. Assessment and prediction of hexavalent chromium vulnerability in groundwater by Geochemical modelling, NOBLES Index and Random Forest Model. Sci. Total Environ. 2024, 906, 167570. [Google Scholar] [CrossRef]
  20. Barzegar, R.; Asghari Moghaddam, A.; Adamowski, J.; Nazemi, A.H. Delimitation of groundwater zones under contamination risk using a bagged ensemble of optimized DRASTIC frameworks. Environ. Sci. Pollut. Res. 2019, 26, 8325–8339. [Google Scholar] [CrossRef]
  21. Brindha, K.; Elango, L. Cross comparison of five popular groundwater pollution vulnerability index approaches. J. Hydrol. 2015, 524, 597–613. [Google Scholar] [CrossRef]
  22. Alam, F.; Umar, R.; Ahmed, S.; Dar, F.A. A new model (DRASTIC-LU) for evaluating groundwater vulnerability in parts of central Ganga Plain, India. Arab. J. Geosci. 2014, 7, 927–937. [Google Scholar] [CrossRef]
  23. Barzegar, R.; Moghaddam, A.A.; Deo, R.; Fijani, E.; Tziritis, E. Mapping groundwater contamination risk of multiple aquifers using multi-model ensemble of machine learning algorithms. Sci. Total Environ. 2018, 621, 697–712. [Google Scholar] [CrossRef]
  24. Kwon, E.; Park, J.; Park, W.; Kang, B.; Hyeon, B.; Woo, N.C. Nitrate vulnerability of groundwater in Jeju Volcanic Island, Korea. Sci. Total Environ. 2022, 807, 151399. [Google Scholar] [CrossRef]
  25. Taghavi, N.; Niven, R.K.; Kramer, M.; Paull, D.J. Comparison of DRASTIC and DRASTICL groundwater vulnerability assessments of the Burdekin Basin, Queensland, Australia. Sci. Total Environ. 2023, 858, 159945. [Google Scholar] [CrossRef] [PubMed]
  26. Luo, K.; Zhang, X. Increasing urban flood risk in China over recent 40 years induced by LUCC. Landsc. Urban Plan. 2022, 219, 104317. [Google Scholar] [CrossRef]
  27. Mooney, H.A.; Duraiappah, A.; Larigauderie, A. Evolution of natural and social science interactions in global change research programs. Proc. Natl. Acad. Sci. USA 2013, 110, 3665–3672. [Google Scholar] [CrossRef]
  28. Yu, Y.; Cao, Y.; Hou, D.; Disse, M.; Brieden, A.; Zhang, H.; Yu, R. The study of artificial intelligence for predicting land use changes in an arid ecosystem. J. Geogr. Sci. 2022, 32, 717–734. [Google Scholar] [CrossRef]
  29. Nlend, B.; Celle-Jeanton, H.; Huneau, F.; Ketchemen-Tandia, B.; Fantong, W.Y.; Boum-Nkot, S.N.; Etame, J. The impact of urban development on aquifers in large coastal cities of West Africa: Present status and future challenges. Land Use Policy 2018, 75, 352–363. [Google Scholar] [CrossRef]
  30. Shooshtarian, S.; Rajagopalan, P. Daytime thermal performance of different urban surfaces: A case study in educational institution precinct of Melbourne. Archit. Sci. Rev. 2018, 61, 29–49. [Google Scholar] [CrossRef]
  31. Liu, X.; Wang, X.; Zhang, L.; Fan, W.; Yang, C.; Li, E.; Wang, Z. Impact of land use on shallow groundwater quality characteristics associated with human health risks in a typical agricultural area in Central China. Environ. Sci. Pollut. Res. 2021, 28, 1712–1724. [Google Scholar] [CrossRef]
  32. Bawa, R.; Dwivedi, P. Impact of land cover on groundwater quality in the Upper Floridan Aquifer in Florida, United States. Environ. Pollut. 2019, 252, 1828–1840. [Google Scholar] [CrossRef]
  33. Lin, J.; Chen, Q. Analyzing and Simulating the Influence of a Water Conveyance Project on Land Use Conditions in the Tarim River Region. Land 2023, 12, 2073. [Google Scholar] [CrossRef]
  34. Gu, H.; Li, J.; Wang, S. Multi-Scenario Simulation of Land Use/Cover Change and Terrestrial Ecosystem Carbon Reserve Response in Liaoning Province, China. Sustainability 2024, 16, 8244. [Google Scholar] [CrossRef]
  35. Liu, X.; Liang, X.; Li, X.; Xu, X.; Ou, J.; Chen, Y.; Li, S.; Wang, S.; Pei, F. A future land use simulation model (FLUS) for simulating multiple land use scenarios by coupling human and natural effects. Landsc. Urban Plan. 2017, 168, 94–116. [Google Scholar] [CrossRef]
  36. Ren, Y.; Lü, Y.; Comber, A.; Fu, B.; Harris, P.; Wu, L. Spatially explicit simulation of land use/land cover changes: Current coverage and future prospects. Earth-Sci. Rev. 2019, 190, 398–415. [Google Scholar] [CrossRef]
  37. Wang, Q.; Guan, Q.; Lin, J.; Luo, H.; Tan, Z.; Ma, Y. Simulating land use/land cover change in an arid region with the coupling models. Ecol. Indic. 2021, 122, 107231. [Google Scholar] [CrossRef]
  38. Huang, Z.; Li, X.; Du, H.; Mao, F.; Han, N.; Fan, W.; Xu, Y.; Luo, X. Simulating Future LUCC by Coupling Climate Change and Human Effects Based on Multi-Phase Remote Sensing Data. Remote Sens. 2022, 14, 1698. [Google Scholar] [CrossRef]
  39. Liang, X.; Guan, Q.; Clarke, K.C.; Liu, S.; Wang, B.; Yao, Y. Understanding the drivers of sustainable land expansion using a patch-generating land use simulation (PLUS) model: A case study in Wuhan, China. Comput. Environ. Urban Syst. 2021, 85, 101569. [Google Scholar] [CrossRef]
  40. Li, C.; Wu, Y.; Gao, B.; Zheng, K.; Wu, Y.; Li, C. Multi-scenario simulation of ecosystem service value for optimization of land use in the Sichuan-Yunnan ecological barrier, China. Ecol. Indic. 2021, 132, 108328. [Google Scholar] [CrossRef]
  41. Dai, K.; Shen, S.; Cheng, C.; Song, Y. Integrated evaluation and attribution of urban flood risk mitigation capacity: A case of Zhengzhou, China. J. Hydrol. Reg. Stud. 2023, 50, 101567. [Google Scholar] [CrossRef]
  42. Ma, Y.; Wang, Z.; Xiong, Y.; Yuan, W.; Wang, Y.; Tang, H.; Zheng, J.; Liu, Z. A critical application of different methods for the vulnerability assessment of shallow aquifers in Zhengzhou City. Environ. Sci. Pollut. Res. 2023, 30, 97078–97091. [Google Scholar] [CrossRef]
  43. Kazakis, N.; Voudouris, K.S. Groundwater vulnerability and pollution risk assessment of porous aquifers to nitrate: Modifying the DRASTIC method using quantitative parameters. J. Hydrol. 2015, 525, 13–25. [Google Scholar] [CrossRef]
  44. Shanmugamoorthy, M.; Subbaiyan, A.; Elango, L.; Velusamy, S. Groundwater susceptibility assessment using the GIS based DRASTIC-LU model in the Noyyal river area of South India. Urban Clim. 2023, 49, 101464. [Google Scholar] [CrossRef]
  45. Karan, S.K.; Samadder, S.R.; Singh, V. Groundwater vulnerability assessment in degraded coal mining areas using the AHP–Modified DRASTIC model. Land Degrad. Dev. 2018, 29, 2351–2365. [Google Scholar] [CrossRef]
  46. Yu, H.; Wu, Q.; Zeng, Y.; Zheng, L.; Xu, L.; Liu, S.; Wang, D. Integrated variable weight model and improved DRASTIC model for groundwater vulnerability assessment in a shallow porous aquifer. J. Hydrol. 2022, 608, 127538. [Google Scholar] [CrossRef]
  47. Tasdighi, A.; Arabi, M.; Osmond, D.L. The Relationship between Land Use and Vulnerability to Nitrogen and Phosphorus Pollution in an Urban Watershed. J. Environ. Qual. 2017, 46, 1137. [Google Scholar] [CrossRef]
  48. Pantusa, D.; Saponieri, A.; Tomasicchio, G.R. Assessment of coastal vulnerability to land-based sources of pollution and its application in Apulia, Italy. Sci. Total Environ. 2023, 886, 163754. [Google Scholar] [CrossRef]
  49. Wang, W.; Mwiathi, N.F.; Li, C.; Luo, W.; Zhang, X.; An, Y.; Zhang, M.; Gong, P.; Liu, J.; Gao, X. Assessment of shallow aquifer vulnerability to fluoride contamination using modified AHP-DRASTICH model as a tool for effective groundwater management, a case study in Yuncheng Basin, China. Chemosphere 2022, 286, 131601. [Google Scholar] [CrossRef] [PubMed]
  50. Şener, E. Appraisal of groundwater pollution risk by combining the fuzzy AHP and DRASTIC method in the Burdur Saline Lake Basin, SW Turkey. Environ. Sci. Pollut. Res. 2023, 30, 21945–21969. [Google Scholar] [CrossRef] [PubMed]
  51. Jesiya, N.P.; Gopinath, G. A Customized FuzzyAHP-GIS based DRASTIC-L model for intrinsic groundwater vulnerability assessment of urban and peri urban phreatic aquifer clusters. Groundw. Sustain. Dev. 2019, 8, 654–666. [Google Scholar] [CrossRef]
  52. Nobre, R.C.M.; Rotunno Filho, O.C.; Mansur, W.J.; Nobre, M.M.M.; Cosenza, C.A.N. Groundwater vulnerability and risk mapping using GIS, modeling and a fuzzy logic tool. J. Contam. Hydrol. 2007, 94, 277–292. [Google Scholar] [CrossRef] [PubMed]
  53. Jia, Y.; Wang, H. Study on Water Resource Carrying Capacity of Zhengzhou City Based on DPSIR Model. Int. J. Environ. Res. Public Health 2023, 20, 1394. [Google Scholar] [CrossRef] [PubMed]
  54. Sun, Z. A study on the evaluation of competitiveness in the aviation logistics industry cluster in Zhengzhou. Sci. Rep 2024, 14, 2659. [Google Scholar] [CrossRef] [PubMed]
  55. Liu, C.; Hu, Y.; Taukenova, A.; Tian, G.; Mu, B. Identification of Wetland Conservation Gaps in Rapidly Urbanizing Areas: A Case Study in Zhengzhou, China. Land 2023, 12, 221. [Google Scholar] [CrossRef]
  56. Wang, Y.; Wang, F.; Min, R.; Song, G.; Song, H.; Zhai, S.; Xia, H.; Zhang, H.; Ru, X. Contribution of local and surrounding anthropogenic emissions to a particulate matter pollution episode in Zhengzhou, Henan, China. Sci. Rep. 2023, 13, 8771. [Google Scholar] [CrossRef]
  57. Babiker, I.S.; Mohamed, M.A.A.; Hiyama, T.; Kato, K. A GIS-based DRASTIC model for assessing aquifer vulnerability in Kakamigahara Heights, Gifu Prefecture, central Japan. Sci. Total Environ. 2005, 345, 127–140. [Google Scholar] [CrossRef] [PubMed]
  58. Lee, S.; Lee, K.; Yoon, H. Using artificial neural network models for groundwater level forecasting and assessment of the relative impacts of influencing factors. Hydrogeol. J. 2019, 27, 567–579. [Google Scholar] [CrossRef]
  59. Li, F.; Feng, P.; Zhang, W.; Zhang, T. An Integrated Groundwater Management Mode Based on Control Indexes of Groundwater Quantity and Level. Water Resour. Manag. 2013, 27, 3273–3292. [Google Scholar] [CrossRef]
  60. Zare, M.; Nikoo, M.R.; Nematollahi, B.; Gandomi, A.H.; Farmani, R. Multi-variable approach to groundwater vulnerability elucidation: A risk-based multi-objective optimization model. J. Environ. Manag. 2023, 338, 117842. [Google Scholar] [CrossRef]
  61. Chen, J.; Wang, E.; Xue, J.; Cui, L.; Zheng, X.; Du, Q. Effects of soil particle size and gradation on the transformation between shallow phreatic water and soil water under laboratory freezing-thawing action. J. Hydrol. 2023, 619, 129323. [Google Scholar] [CrossRef]
  62. Tungittiplakorn, W.; Lion, L.W.; Cohen, C.; Kim, J. Engineered Polymeric Nanoparticles for Soil Remediation. Environ. Sci. Technol. 2004, 38, 1605–1610. [Google Scholar] [CrossRef]
  63. Goyal, D.; Haritash, A.K.; Singh, S.K. A comprehensive review of groundwater vulnerability assessment using index-based, modelling, and coupling methods. J. Environ. Manag. 2021, 296, 113161. [Google Scholar] [CrossRef] [PubMed]
  64. Huan, H.; Wang, J.; Teng, Y. Assessment and validation of groundwater vulnerability to nitrate based on a modified DRASTIC model: A case study in Jilin City of northeast China. Sci. Total Environ. 2012, 440, 14–23. [Google Scholar] [CrossRef]
  65. Roy, A.; Chatterjee, S.; Kumar Sinha, U.; Kumar Jain, A.; Mohokar, H.; Jaryal, A.; Keesari, T.; Jagat Pant, H. Recharge and vulnerability assessment of groundwater resources in North west India: Insights from isotope-geospatial modelling approach. Geosci. Front. 2024, 15, 101721. [Google Scholar] [CrossRef]
  66. Shrestha, S.; Kafle, R.; Pandey, V.P. Evaluation of index-overlay methods for groundwater vulnerability and risk assessment in Kathmandu Valley, Nepal. Sci. Total Environ. 2017, 575, 779–790. [Google Scholar] [CrossRef] [PubMed]
  67. Cao, H.; Dong, W.; Chen, H.; Wang, R. Groundwater vulnerability assessment of typical covered karst areas in northern China based on an improved COPK method. J. Hydrol. 2023, 624, 129904. [Google Scholar] [CrossRef]
  68. Li, J.; Liu, Y.; Dai, W.; Li, J.; Yang, P.; Tian, L.; Yu, S.; Zuo, R.; Zhai, Y.; Song, W.; et al. Nitrate attenuation with rising groundwater levels: An integrated assessment using isotope tracers and microbial signatures. J. Hydrol. 2023, 624, 129911. [Google Scholar] [CrossRef]
  69. Chai, W.S.; Cheun, J.Y.; Kumar, P.S.; Mubashir, M.; Majeed, Z.; Banat, F.; Ho, S.; Show, P.L. A review on conventional and novel materials towards heavy metal adsorption in wastewater treatment application. J. Clean. Prod. 2021, 296, 126589. [Google Scholar] [CrossRef]
  70. Li, Q.; Liu, G.; Qi, L.; Wang, H.; Ye, Z.; Zhao, Q. Heavy metal-contained wastewater in China: Discharge, management and treatment. Sci. Total Environ. 2022, 808, 152091. [Google Scholar] [CrossRef]
  71. Ewuzie, U.; Saliu, O.D.; Dulta, K.; Ogunniyi, S.; Bajeh, A.O.; Iwuozor, K.O.; Ighalo, J.O. A review on treatment technologies for printing and dyeing wastewater (PDW). J. Water Process Eng. 2022, 50, 103273. [Google Scholar] [CrossRef]
  72. Tu, Y.; Shao, G.; Zhang, W.; Chen, J.; Qu, Y.; Zhang, F.; Tian, S.; Zhou, Z.; Ren, Z. The degradation of printing and dyeing wastewater by manganese-based catalysts. Sci. Total Environ. 2022, 828, 154390. [Google Scholar] [CrossRef] [PubMed]
  73. Yang, Y.; Wang, X.; Wu, S.; Yao, X.; Feng, L.; Feng, X.; Ma, Y. Insight into the application of micro-nano bubbles combined with heat-activated persulfate oxidation for removing dissolved organic matter from printing and dying wastewater. J. Water Process Eng. 2023, 56, 104463. [Google Scholar] [CrossRef]
  74. Li, J.Y.; Zheng, X.; Zhang, C.; Chen, Y. Impact of Land-Use and Land-Cover Change on Meteorology in the Beijing-Tianjin-Hebei Region from 1990 to 2010. Sustainability 2018, 10, 176. [Google Scholar] [CrossRef]
  75. Liang, J.; Li, S.; Li, X.; Li, X.; Liu, Q.; Meng, Q.; Lin, A.; Li, J. Trade-off analyses and optimization of water-related ecosystem services (WRESs) based on land use change in a typical agricultural watershed, southern China. J. Clean. Prod. 2021, 279, 123851. [Google Scholar] [CrossRef]
Figure 1. Location of the central urban area of Zhengzhou and the potential pollution source distribution.
Water 16 03716 g001
Figure 2. Markov–PLUS model simulation diagram: (a) actual LULC in 2020; and (b) LULC simulation in 2020.
Water 16 03716 g002
Figure 3. Land use type map from 2000 to 2030: (a) 2000, (b) 2010, (c) 2020, and (d) 2030.
Water 16 03716 g003
Figure 4. Groundwater vulnerability map: (a) groundwater vulnerability in 2020; and (b) groundwater vulnerability simulation in 2030.
Water 16 03716 g004
Figure 5. Groundwater pollution risk verification chart.
Water 16 03716 g005
Table 1. Area of each land use type.
TypeArea (km2)
2000201020202030
Forest19.374.364.374.35
Grass land0.690.680.680.10
Water71.7983.6969.3170.76
Rural land68.2186.0198.42103.82
Urban land163.99404.24477.42524.41
Dry land525.97340.77255.35193.69
Paddy land143.1164.9953.0344.10
Industrial land13.4421.0947.2564.63
Table 2. Weights of various sources of pollution in the DRASTICL model.
DRASTICLWeights
D(1,1,1)(2,3,5)(2,4,5)(3,5,6)(3,5,7)(1/3,1,2)(3,4,5)(1/4,1,3)0.23
R(1/5,1/3,1/2)(1,1,1)(2,3,5)(2,5,6)(3,5,6)(1/4,1/2,1)(2,3,4)(1/5,1/3,.1/2)0.19
A(1/5,1/4,1/2)(1/5,1/3,1/2)(1,1,1)(1,3,4)(1,3,4)(1/6,1/4,1/2)(1/2,1,3)(1/6,1/4,1/3)0.11
S(1/6,1/5,1/3)(1/6,1/5,1/2)(1/4,1/3,1)(1,1,1)(1/2,1,3)(1/7,1/6,1/3)(1/4,1/3,1)(1/6,1/5,1/3)0.03
T(1/7,1/5,1/3)(1/6,1/5,1/3)(1/4,1/3,1)(1/3,1,2)(1,1,1)(1/6,1/5,1/3)(1/4,1/3,1)(1/6,1/5,1/3)0.01
I(1/2,1,3)(1,2,4)(2,4,6)(3,6,7)(3,5,6)(1,1,1)(2,5,6)(1/2,1,3)0.1
C(1/5,1/4,1/3)(1/4,1/3,1/2)(1/3,1,2)(1,3,4)(1,3,4)(1/6,1/5,1/3)(1,1,1)(1/5,1/4,1/2)0.1
L(1/3,1,4)(2,3,5)(3,4,6)(3,5,6)(3,5,6)(1/3,1,2)(2,4,5)(1,1,1)0.23
Table 3. A summary of the results of verification of the groundwater vulnerability evaluation in the study area according to seven water quality variables measured in 233 groundwater samples. Abbreviations: AUC: area under the curve.
IndexUnitMinimumMaximumAverageAUC AreaSpearman Correlation Coefficient
Total dissolved solidsmg/L2421600639.850.7750.83
Chloridemg/L0.104102092.180.8040.83
Sulfatemg/L0.31343489.270.7780.82
Nitratemg/LND20918.380.6030.64
Ammonia nitrogenmg/LND0.1810.040.6880.77
Total ironmg/LND130.910.7950.74
Chemical oxygen
demand
mg/L0.62.51.080.5220.54
Table 4. Area of groundwater vulnerability at different levels.
YearArea (km2)
Very LowLowMediumHighVery High
20205.13202.86459.79274.5881.05
20304.67194.76444.82281.4581.86
Disclaimer/Publisher’s Note: The statements, opinions and data contained in all publications are solely those of the individual author(s) and contributor(s) and not of MDPI and/or the editor(s). MDPI and/or the editor(s) disclaim responsibility for any injury to people or property resulting from any ideas, methods, instructions or products referred to in the content.

