Abstract
According to the World Health Organization (WHO), floods are one of the most important natural disasters in the world, resulting in the severe loss of human lives and intense destruction of infrastructure. The frequent floods in recent decades have caused most parts of Iran to be affected by periodic and destructive floods. Consequently, the casualties and financial losses of floods have increased significantly. The present study aims to investigate redesigning the fuse plug, emergency overflow, and flood system at Ramshir Dam, Iran. In this regard, using a two-dimensional mathematical model, floods with a return period of 10 and 100 years with different scenarios have been investigated. Four scenarios were analyzed, including the current situation, flood channel dredging scenario, flood channel overhaul scenario, and flood channel overhaul scenario with reservoir dredging. The results show the following: (1) The flood channel in its current state cannot even discharge flows lower than the design, i.e., 1400 m3/s, and the flow overflows from the embankments on its sides. (2) Also, the reservoir dredging prevents the failure of the second fuse plug in the 100-year return period (flow rate 4370 m3/s). (3) Discharge more than 2400 m3/s cubic meters led to the activation of the first fuse plug. (4) The present research findings are of particular and essential importance in flood management. (5) The results of this research were based on the rehabilitation and simulation of the diversion dam facilities in the control and conveyance of flood and on three factors of spillway, flood channel, and flood plain, and the correct function of the fuse plug was reviewed.
1. Introduction
Floods are undoubtedly known as natural disasters, but in practice, floods are the most devastating natural disaster globally [1,2], both in terms of casualties and financial losses [3]. For example, floods can destroy agriculture and have severe effects on people’s economy [4]. In recent decades, concerns about flood losses and damages have increased worldwide [5,6]. This upward trend can be attributed to various factors, including population growth, hydro system changes [7], as well as the destructive effects of human activity [8,9]. Also, predictions, surveys, and scientific research report that the world temperature will be warmer by the year 2100 due to various factors, such as the emission of greenhouse gasses [10]. On the other hand, climate change and the consequent extreme weather are other critical factors that influence the increase in floods and droughts [11,12,13]. Two significant consequences reported by Tapas et al. [14] include a trend toward wetter conditions with an increase in flood events leading up to 2100 and low-lying and coastal regions being particularly susceptible to higher flood peaks and more frequent drought events between 2045 and 2100.
According to the available reports, the Ramshir diversion dam has experienced two floods in recent years: the first flood was in 2008, and the second was in 2015. It caused a lot of damage to the region, among which a number of villages in the central part of Ramshir city and its agriculture were flooded. On the other hand, according to the field visits and satellite images, it was clear that the flood control channel is not in good condition and has become a place for the growth of reeds, which causes a difference between the initial hydraulic design conditions of the channel and the current hydraulic conditions of the channel. With this situation, it is not possible to expect the transfer of the flood with the desired discharge of the plan. On the other hand, the fuse plug structure, which is responsible for passing the excess part of the flood, has not shown timely and proper performance.
Iran is one of the countries that is most affected by floods [15,16]. Although most of Iran is in arid and semi-arid regions, the country has been more affected by floods than droughts [17]. The frequent floods in the last few decades, which have affected most parts of the country, are a clear example of this point [18]. The floods of recent years have become so widespread and rapid that they have become a pervasive socio-economic and health problem [19]. Population growth combined with poor planning for land use, deforestation, pastures, and the development of impervious surfaces has led to less water permeation into the ground and faster downstream flows [20]. As a result, floods are becoming more frequent, severe, and sudden, and more people are being affected by more severe floods [21]. Studies were conducted on floods to identify their effects and how to manage them in different landscapes, some of which are discussed below.
Modeling the flooding event has been vastly investigated by researchers in recent years [22,23,24,25]. Flood modeling has sometimes been conducted based on observations [26,27], sometimes based on solving fluid motion equations (hydrodynamic models) [28,29,30,31], and sometimes based on simple conceptual models to provide a rapid estimation of flood inundation [32,33]. Researchers have used HEC-RAS version 6.5 commercial software to simulate flooding processes [34,35,36,37,38]. Rangari et al. [39] investigated the risk of floods in District 13 of Hyderabad and used HEC-RAS software to simulate flooding. They considered two scenarios of past heavy rainfall events and a possible heavy rainfall event for the model’s 2-, 5-, and 10-year return period. They suggested that flood risk threatens 17% of the entire region. Dasallas et al. [40] investigated the 2002 Baeksan flood event by case study and numerical data, and they reported that the results of the HEC-RAS 1D–2D and filed data were similar. Yalcin [41], using HEC-RAS software, examined the topographic performance and resolution of land cover data in modeling the floodplain of Kilicozu Creek, which passes through the center of the province of Turkey. Results show that the use of different resolution digital surface models with a resolution lower than 2 m/pixel deteriorates the estimates of flow dynamics to the extent that they lead to inaccurate risk assessment. Garcia et al. [42] investigated the performance of the HEC-RAS model in Integrating Reservoir Operations and flood modeling. Their results showed the ability of a single model, HEC-RAS 2D, concerning combined hydrologic and hydraulic simulations, reservoir operations, and floodplain analysis. Qian et al. [43] found that coupled 1D/2D modeling performed better than the FEMA BLE model for producing accurate flood inundation maps of the Neches River Tidal floodplain. Also, some investigated floods from different theoretical aspects [44,45,46,47].
Considering the importance of flooding issues, especially in developing countries like Iran, the current research aims to study redesigning the fuse plug, emergency overflow, and flood system at Ramshir Dam, Iran. So, in this connection, floods with a return period of 10 and 100 years with different scenarios have been addressed by applying a two-dimensional mathematical model. In addition, the basic design and system of the facilities and fuse plug structure of Ramshir diversion dam have suffered problems due to the change in flood conditions caused by the change in rainfall patterns in the region. Therefore, intense damage is caused to the dam’s surrounding and downstream areas every year. Hence, this research is looking for a new solution to redesign the mentioned facilities to reduce the general damage. Based on this, taking into account the action plan scenarios in flood conditions and flood management based on new design points will bring minimum financial and life losses.
2. Materials and Methods
2.1. Introduction of Dam
2.1.1. Introduction of Ramshir Diversion Regulating Dam
Ramshir diversion dam and its irrigation and drainage networks are among the five irrigation networks of the Maroon and Aala watershed basins. This dam is located downstream of the Maroon and Jarreh reservoirs, after the Behbahan, Jayzan, and Ramhormoz irrigation and drainage networks. The crest length of the diversion dam is 40 m, the diversion dam’s main width in the flow direction is 50 m, and the maximum upper elevation of the diversion dam is 32 m with UTM coordinates and sea datum. The average river bed elevation at the dam axial site is 17 m from the reference datum, and the dam’s upstream and downstream foundation elevation is 12 and 5 m, respectively. Also, the water level in normal operating conditions is 27.75 m, the maximum water level in maximum flood conditions is 30.60 m, the maximum discharge capacity in normal reservoir water levels is 365 m3/s, the maximum discharge capacity in water levels of 30 m (start of embankment breaching) is 520 m3/s, and the maximum discharge capacity under maximum regime conditions is 570 m3/s. The main components are water intake facilities, a Sluiceway, a sediment drainage duct, a lower gate, a free overflow spillway, a fish passage structure, a sealing wall, and a machine bridge. The main conveyance canals with trapezoidal cross-sections start 38.50 m from the beginning of the intake apparatus. The characteristics of the irrigation canal are as follows: Q = 9 m3/s, Normal Water Surface (N.W.S.) = 27.5 m, F.B = 0.4 m, V = 0.75 m/s, b = 3 m, z = 1.5, and embankment elevation of 27.90 m. Figure 1 shows the Jarahi River, Ramshir diversion dam and its facilities, Ramshir reservoir, flood canal, and flood plain near the diversion dam.
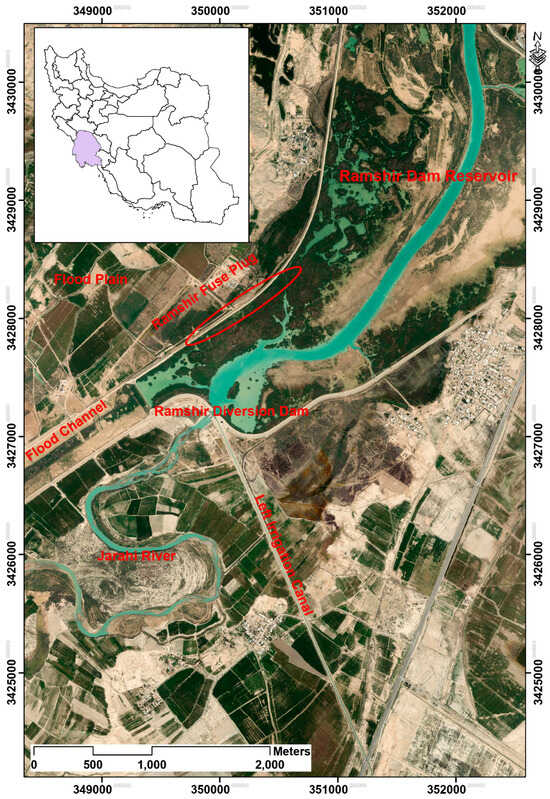
Figure 1.
The Jarahi River system and Ramshir diversion dam facilities.
2.1.2. Sluiceway and Lower Conduits
Two similar sluiceways are placed on both sides of the dam, which are connected to the canals’ intake facilities. These are radial gates of 5 m in length and 4 m in height. The reinforced concrete apron with El = 19 m is connected to the concrete wall from the upper part. The discharge capacity of two gates with a whole opening is 286 and 345 m3/s, respectively, at both the N.W.S. and the maximum possible water level, according to the resilience capacity of the river. Moreover, one automatic radial gate (5 m length and 3 m height at the inlet lower conduit) has been designed to regulate a control water surface at the diversion dam reservoir approach equal to 27.75 m (control water surface (C.W.S.) = 27.75) for the base flow rate of the river. This elevation is essential because of the downstream water supply and safe intake elevation. The maximum discharge flow of this conduit is 115 m3/s at the maximum upstream water surface [48].
2.1.3. Overflow Spillway
Generally, plugging the upper part of the sluiceway conduit, the control gate of the lower tube, and the fishway, especially in floods, causes a drop in the water intake and problems in the operation and maintenance of all facilities. Hence, the floating material in the upstream water surface is discharged by a free overflow spillway 13 m in length in the middle of the diversion dam. However, a series of dividing walls with a total length of 25.15 m has been designed to prevent sediment transport from upstream into the intake facilities. Also, this provides the required hydraulic purposes in front of the intake. The maximum discharge capacity of the free spillway at the maximum water level is 120 m3/s [48].
2.1.4. Flood Control in Ramshir Diversion Dam
Three separate sections are considered to control the flood entering the Ramshir Dam reservoir: the overflow spillway, flood control channel, and fuse plug. The flood control canal is located on the right bank of the Jarahi River and at the far right of the irrigation and drainage network on the right bank of the Ramshir River (Figure 2). It is approximately parallel to the Jarahi River and in the same direction as its flow path. The flood control canal starts from the axis of its inlet overflow (km 0 + 000), located in the right-side embankment of the diversion dam reservoir. Finally, it connects to low and swampy lands at km 23 + 500 northwest of Bastin village. The Ramshir Plain is almost never no planted and has no significant residential areas to the right of the flood control canal. In general, the towns near the channel on the right side include Cham Ishaq Sofla and Olya, Saba Ikta, Boyardeh, and Rashideh, which include about 100 families with a population of about 700. Notably, the flood control channel’s water level has been controlled with the assumption of plant growth and sedimentation based on a Manning coefficient of 0.04 [48].
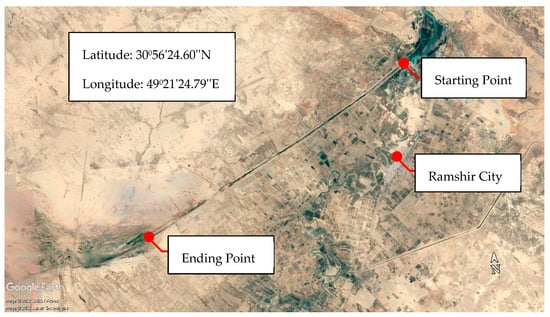
Figure 2.
Flood control canal location: Ramshir, Khuzestan, Iran.
2.1.5. Fuse Plug
The fuse plug system was constructed in the right plain of the flood control channel as floods pass a 25 to 1000-year return period. In addition, the fuse plug is located in the earthen arm of the right bank at a distance of 400 m and perpendicular to the spillway path. Its length is 300 m, separated from the sidewalls by concrete sidewalls (Figure 3). The fuse plug is divided into two parts of 150 m length for each. The crest elevation of the earthen arm of the fuse plug is 1 m (as a safety factor) lower than the other part elevation of the crest. With the increase in the water surface elevation from 30 m, the first part of the fuse plug initially worked and was destroyed. If the water level increases and exceeds 30.30 m, the overflow would happen from the second part and begin to destroy it. In other words, the first part (first 150 m) could discharge the flow rate up to 4400 m3/s. Hence, it would not be necessary to destroy the total length of this structure. The discharge capacity of each of the two parts is 2330 m3/s, and with the operation of the entire length, a total discharge of 7400 m3/s would pass through the diversion dam and flood control facilities [48].
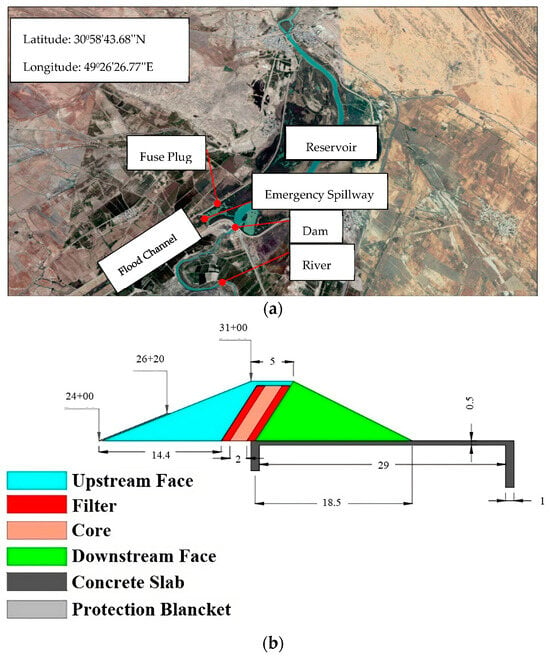
Figure 3.
Execution details of the fuse plug. (a) Dam and other component location and (b) cross-sectional view of the fuse plug.
2.1.6. Study Area
The study’s reach is between Mashrageh station and the Ramshir diversion dam of the Jarahi River sections. The Jarahi River is one of the most important rivers in Iran, and most of it is located in Khuzestan province. This river originates from Aala (Allah or Ramhormoz) and Maroon in Cham Hashem, located 20 km south of Ramhormoz [48]. The length of the Jarahi River from the Ala and Maroon Rivers’ confluence to its Khormousi estuary is 210 km, and from the source of the Maroon River to the estuary is 520 km. The area of its watershed is about 23,245 km2, of which about 10,910 km2 are high mountainous zones, and the rest is plains and foothills. This area sees rainfall for about six months of the year. In this regard, river floods mainly occur between December and May, especially from December to February. This study used the statistics and information of the Mashrageh hydrometric station (height 30 m, x= 348,889, and y=3,319,818 according to UTM coordinate system) as the region’s index station. This station is located 22 km downstream of the junction point of the Maroon and Aala Rivers on the Jarahi River and at the beginning of the Ramshir plain. However, its distance to the axis of the selected diversion dam is 6 km. Meteorological information has been available at this station since 1966.
Daily discharge data and hourly flood flow rates from the KWPA were collected to conduct hydrological studies of the Jarahi River in the study area. The average monthly discharges of the Jarahi River were calculated based on a 26-year statistical period at Mashrageh station, considering the discharges of the Maroon dam, the discharges of the middle watershed basin, the Aala River, and consumption discharges in the Behbahan, Jaizan, and Ramhormoz plains. Some operations were performed to achieve the purposes of this research, including cross-section surveying from the flood control channel, a topography surveying plan with 1/500 accuracy, dimensions of the facilities, etc. Their length was chosen by covering dikes, the earth road of the flood control channel, and details outside up to an 80 m distance on both sides of the dikes. The length of all sections was considered to be 500 m. The distance of cross-sections from each other was considered to be 2 km (of course, except for cross-sections in reaches canal spillways, asphalt crossroads, and drop structures with numbers 1 to 3). Finally, 26 sections were surveyed and named from C1 to C26 (Table 1).

Table 1.
Specification of sections taken from the flood channel.
2.1.7. Ramshir Diversion Dam Reservoir Hydrography
Figure 4 shows the entire reservoir (8 km upstream of the dam). The distance between the points perpendicular to the Jarahi River is 10 m. In addition, they surveyed longitudinally with a distance of 50 m. Moreover, scattered points have been surveyed with a scale of 1/500 in the dry parts of the reservoir. Fortunately, due to the structure of the flood control canal system with earthen walls, this canal has not been severely damaged by past floods and has not incurred any costs for reconstruction and restoration. However, the model showed that in the first phase of this study, it was found that the channel performed poorly during floods and could not pass the desired flood, then the flow overflowed and led to the propagation of the surrounding areas. As a result, redesigning and modifying were of particular importance [48].
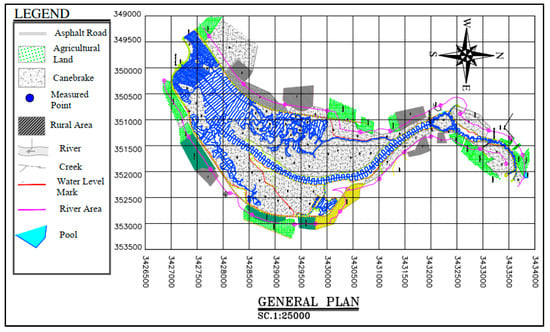
Figure 4.
General plan of Ramshir diversion dam reservoir hydrography, scale 1:25,000.
2.1.8. Fuse Plug Operation History
Based on available reports, this structure was ruined in 2003 when this structure was constructed [48]. According to the reports of the Iranian Meteorological Organization on 2009 December 17, due to the possibility of flooding induced by rainfall, to control the flood, the Ramshir diversion dam was emptied on 2009 December 16. In this regard, after 36 h, the flood crossing the dam started with a flow rate of 369 m3/s and reached a maximum value of 3600 m3/s. It was believed that the main reason for this was the increase in density due to the passage of machines on the embankment. The original design specifications were not followed, and the destroyed site was filled and compacted without considering standard criteria after the second destruction of this structure in 2009 due to the high costs related to reconstruction and the insufficient budget available to the operating company with which to rebuild the fuse plug. The local river materials were removed; therefore, its various elements, including downstream embankment, clay core, upstream embankment, and upstream cover, were removed entirely. In April 2016, the fuse plug operated and caused irreparable damage to the area.
According to field visits and satellite images, it was clear that this canal was not in a good condition and became a place for the growth of reeds, which caused a difference between the initial hydraulic design conditions of this canal and the current hydraulic conditions of the channel. Regarding this situation, the transfer of flood could not be expected with the project’s desired flow. One of the problems that giant reeds can cause is increasing the water surface and decreasing flow velocity. Slowing down increases the flow depth and overflows through the dikes along the flood control channel, which in turn causes a lot of damage [49].
2.1.9. Dam Hydrograph
Table 2 lists the performance of different dam structures at different levels. These data were determined based on the following conditions: The normal water level in the reservoir was 27.75 m, and all diversion dam gates were considered in the full opening mode (except for the network intake gate). The spillway crest elevation remains 28 m long in 56 m and 28.1 m in 196 m. The fuse plug of the first part at the 30.30 m water elevation of the reservoir begins to be destroyed, and the fuse plug of the second part at 30.60 m begins to be destroyed [48]. These data were used to calibrate the results obtained from the HEC-RAS model.

Table 2.
Discharge data.
In Table 2, ElW is the water surface elevation; Qs is the discharge of the diversion dam spillway; Qc is the flow rate of the flood control channel inlet; Qfp1 and Qfp2 are the flow rates of fuse plug part one and two, respectively’; and finally, Q.T. is the total discharge.
2.2. Numerical Simulations
2.2.1. Data of Jarahi River
Surveying of the Maroon and Jarahi rivers in the downstream area of the Maroon Dam to the Shadegan wetland in 2002 with a scale of 1:2000 was performed by the Surveying Organization of Iran (Figure 5). The bandwidth of the mapping was performed with minimum and maximum strip bounds of 3.5 and 12 km, respectively. About 941 topographic map sheets were obtained from the Maroon River. Since this study aimed to investigate the diversion dam and related structures, the parts related to this area were removed from the map and used separately.
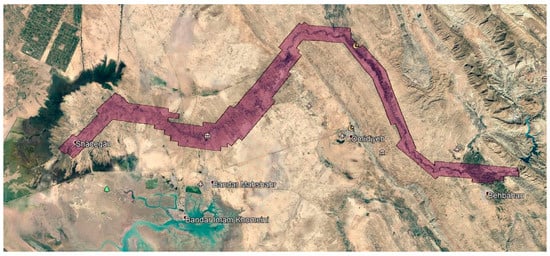
Figure 5.
Map with a scale of 1:2000 Maroon—based on the Surveying Organization in 2002.
Accurate data are required to model the reservoir two-dimensionally. Since the existing 1:2000 plans were related to a date before the construction of the Ramshir diversion dam, ground surveying and hydrographic data were used for the detailed two-dimensional modeling of the reservoir. Ninety-three cross-sections were taken from the Maroon River, downstream of the Maroon Dam to the Shadegan wetland, in 2004 by KWPA. Twenty-six sections were surveyed according to Figure 6 along the flood channel to model a one-dimensional flood in the existing conditions and according to the study’s objectives. In Figure 6a, the red lines on the longitudinal path of the flood channel are the cross-sections that were surveyed in this research.
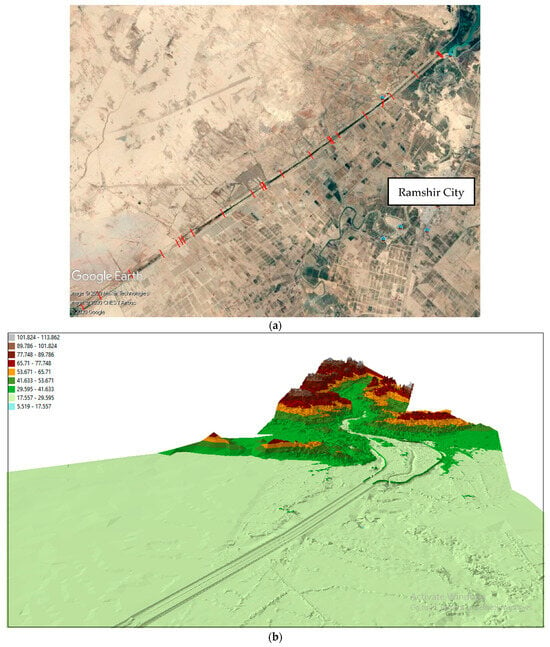
Figure 6.
(a) Location of sections surveyed in this study; (b) initial setup in the model for the study area (three-dimensional view).
2.2.2. HEC-RAS Model
In the present study, a the one-dimensional–two-dimensional model of HEC-RAS was used to hydraulically investigate the failure of the fuse plug and the flood channel [50,51]. The HEC-RAS model can analyze the sedimentation process, erosion, and quality [52,53]. Figure 6b shows a three-dimensional view.
2.2.3. Meshing
An irregular meshing was performed in HEC-RAS after preparing a three-dimensional model and surveying the area with an accuracy of 1 m. The initial trial was a 20 × 20 m mesh system, but the running times were long, and some results went wrong because of the large volume of calculations. Therefore, the mesh system dimensions were changed according to the details in the model. However, a mesh network system of 50 × 50 m was considered for the reservoir and 100 × 100 m for the flood plain, respectively. Figure 7 shows the mesh system in the HEC-RAS model.
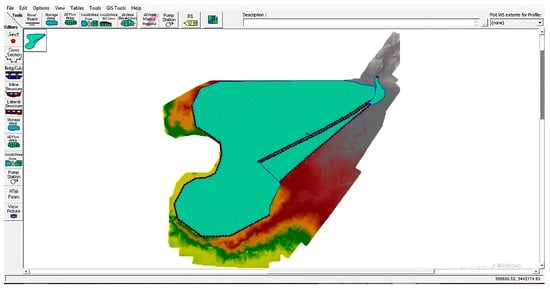
Figure 7.
The meshing of the study area in HEC-RAS software.
2.2.4. Introduce Hydraulic Structures in the Model
The Ramshir diversion dam has a series of two sluiceways, an outlet gate, and a fishway structure. There is a flood channel spillway and two fuse plugs on the right side of the dam. They were defined in the model according to the details in Figure 8. These components were used to connect the two-dimensional and one-dimensional parts of the model.
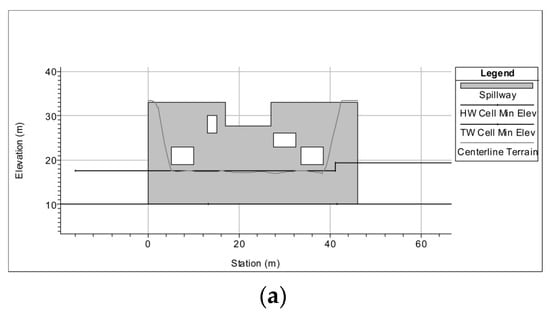
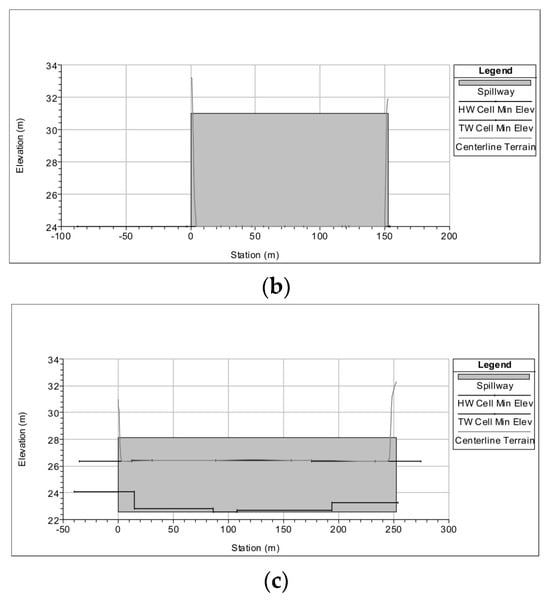
Figure 8.
Defining the hydraulic structures in the model: (a) Ramshir diversion; (b) Ramshir fuse plug; and (c) flood channel overflow (flood transmission channel).
2.2.5. Initial and Boundary Condition
The HEC-RAS can model two-dimensional flow routing through diffusion wave and full momentum equations. The choice of the solution method depends on the initial and boundary conditions [39]. Thus, the diffusion wave method is acceptable if the flow changes are gradual. However, since severe changes in velocity accompany the flood caused by the fuse plug failure, it is necessary to use the full-moment method. Therefore, this plan used the full-moment method to route the flood. A variable time step based on the Courant number is essential if the significant velocity changes and the computing cell dimensions are variable [54]. Likewise, the Courant number should not exceed one for the model to remain stable, which was controlled in all scenarios.
The present study considered flood hydrographs with a 10- and 100-year return period. The data in Table 2 were used to determine the boundary conditions upstream of the reservoir.
The reason for choosing this period was that in a 10-year flood, fuse plug failure does not occur; conversely, in a 100-year flood, both fuse plugs are destroyed. Normal depth was introduced to the model as the boundary conditions downstream of the dam and the entrance of the Shadegan wetland. The initial condition used in this study was the water level in the operating conditions, i.e., 27.75 m. In other words, the initial condition of the model is considered wet in the reservoir and dry in the floodplain. Figure 9 shows the position of the boundary conditions in blue.
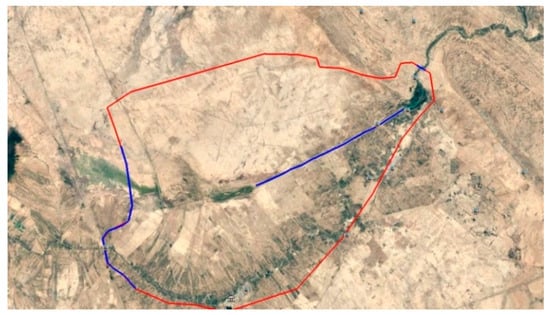
Figure 9.
View of the study area (red line), the position of the upstream and downstream boundary conditions, and the route of the flood channel (blue line).
2.3. Scenarios
As mentioned earlier, reservoir input was considered as an upstream boundary condition. The hydrographs used in this boundary condition with a continuum of six days were selected to examine the hypothesis of the failure and non-failure of fuse plugs. So, in a peak flood discharge of 4370 m3/s, both fuse plugs break, and neither failure occurs in a 1700 m3/s peak flood discharge. For all scenarios, the failure phenomenon in the first fuse started when the water level reached 30.30 m, and the second fuse began at 30.60 m. The lower failure limit was introduced to the model by the failure floor elevation equal to 25 m, which is equal to the average level of the natural surface of the ground downstream of the fuse plug. According to the design conditions, since the fuse plug must be completely broken, in all scenarios, the entire length of the fuse plug would be destroyed if the flood overflow occurred. The estimation of the dam failure parameters, such as the final failure width and final failure time, could not be calculated accurately. However, these values could be estimated to an acceptable level using the regulations according to Table 3 for the earthen dam [54].

Table 3.
Failure parameters recommended in different regulations.
In Table 3, the middle column is the side slope after breaching; since failure in earthen dams is not instantaneous, the failure time was estimated to be about 40 min based on experimental relationships and a review of regulations. The above conditions were considered the same for all the studied scenarios, which are given below.
- (A)
- Current situation scenario
In this scenario, the surveyed cross-sections of the flood channel were used, indicating the channel’s current condition. In these conditions, the roughness coefficient of the reservoir axis was 0.025, and its sides were considered 0.1 due to dense vegetation, including reeds and shrubs. The roughness coefficient in the flood canal was considered 0.1 because of dense and tall vegetation in the middle and 0.04 on the sides due to agricultural lands.
- (B)
- Flood channel dredging scenario
In this scenario, the vegetation inside the canal was completely removed to improve the flood channel’s throughput capacity. In these conditions, a roughness coefficient of 0.025 was used. The roughness coefficient of the reservoir and cross-sections were considered according to the previous scenario to examine only the effect of vegetation within the channel.
- (C)
- Flood channel overhaul scenario
Investigations show that the flood channel was very different from the design conditions because of the increased roughness caused by agriculture, reed growth, irregularity, and bed digging and the formation of long and short ridges caused by erosion and sedimentation embankment fractures. It had design conditions and could not carry the design discharge, so overflow and consequent damage to farms and flooding were inevitable. However, the channel was redesigned by compound cross-sections, as shown in Figure 10, to compare its performance with the existing conditions. It should be noted that the following criteria were considered in the redesign of the channel:
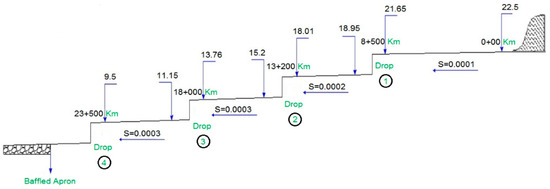
Figure 10.
Longitudinal profile map of flood channel on Ramshir diversion dam.
According to the above criteria and the soil particle size (sandy clay), the maximum allowable velocity in this canal was equal to 1.42 m/s, which, by adding 30% of the same amount (flood conditions), changed to 1.82 m/s. It should be noted that in the presented results, the allowable velocity should not exceed this value.
According to the proposed criteria, the minimum flow velocity in this channel should not be less than 0.5 to 0.6 m/s. Otherwise, sedimentation would occur; therefore, 0.6 m/s was selected for the minimum allowable velocity.
The value of the Manning roughness coefficient was considered 0.025.
According to the longitudinal profile, it was observed that the bottom slope was 0.0001, 0.0002, and 0.0003 in each part.
The main and executive section of this channel was a compound cross-section.
In the compound cross-section, the dimensions of the conductor channel were fixed and should not be changed. In addition, the width of the road was fixed and equal to 2 m. This section was in the form of two berms; the width of each berm was 4 m, and the embankment crest elevation at the beginning of the channel was 29 m, while at the end, it was 11.5 m. Furthermore, the consecutive distance cross-section should not exceed 350 m (width was kept constant in cross-sections).
- (D)
- Flood channel overhaul scenario with reservoir dredging
A roughness coefficient of 0.025 instead of 0.1 was considered to remove the effect of increasing roughness on the fuse plug and overflow channel’s performance. This scenario was designed based on the results of previous scenarios and in response to the following question: Can the removal of vegetation in the reservoir prevent the failure of the second fuse plug (with the level 30.60 m) in the 100-year return period?
It is possible to analyze the river system after defining the scenarios. Figure 11 shows the process of the calculation and selection of an action plan for the Ramshir diversion dam.
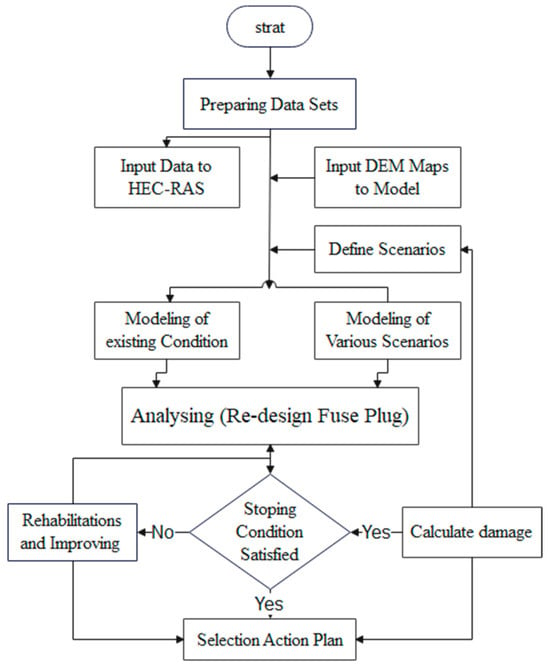
Figure 11.
Flowchart of methodology to select action plan.
3. Results and Discussion
As mentioned in Table 1, the diversion dam’s maximum discharge capacity in the project’s maximum flood conditions was 567 m3/s. This condition was true in all scenarios according to the hydrograph of the dam outlet in the previous section, assuming the fuse plug failed. Hence, the diversion dam was not in critical condition. In the worst case scenario, a “current situation” flood with a 100-year return period, the water level did not exceed 31.0 m, and the flow passes followed the design conditions. According to the initial design, the spillway of the flood channel should discharge a flow rate of 1400 m3/s. However, considering the channel freeboard, it should pass more discharges up to about 2000 m3/s. The performance of this structure in different scenarios is discussed in the following.
3.1. Current Situation Scenario
The current situation results show that the spillway and flood channel cannot pass the flow rate even for discharges less than the design conditions (Figure 12). In comparison, there was insufficient passage capacity in the 10-year return period with a 1071 m3/s peak flow rate. Therefore, most flow from the right bank embankment is overflowed and propagated (Figure 12e). The zoning map in Figure 12h shows the rate of flow propagation in the flood plain. The above conditions are true for the entire return period in this scenario. In addition to the right bank, there is an overflow in the left bank embankment. However, the amount is small for a return period of 10 years. Nonetheless, for the return period of 100 years, it is significant, according to Figure 13f, because the discharge of fuse plug failure increases the water level of the flood plain to more than the embankment level. Hence, a significant amount of flow enters from the channel inlet, and since then, it has no capacity, causing it to overflow from the left bank embankment. The points where the flow overflows are at the beginning of the canal and after the third drop structure (the presence of a local fracture of the right bank embankment) at 18 + 500 km. This is shown in Figure 13g as a water level profile in the flood channel. In both return periods, the inlet flow to the flood channel did not exceed the maximum channel capacity. For example, in the 10 and 100 years, about 1070 and 1133 m3/s flowed the canal, respectively (Figure 12d and Figure 13d).
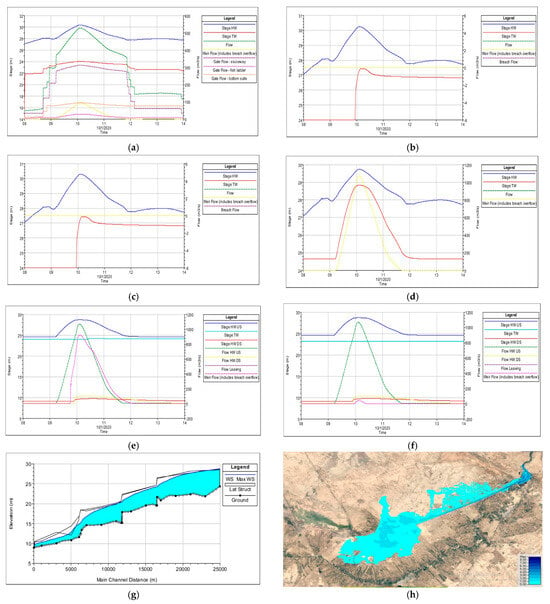
Figure 12.
Results of the current situation scenario, the 10-year return period: (a) hydrograph of the dam outlet and related facilities in the current situation scenario; (b) hydrograph of the first fuse plug in the current scenario; (c) hydrograph of the second fuse plug in the current scenario; (d) flood channel overflow hydrograph in the current scenario; (e) right bank of the floodplain embankment hydrograph in the current scenario; (f) left bank embankment hydrograph in the current scenario; (g) the profile of flood channel water surface in the current scenario; and (h) flood zones in the current scenario.
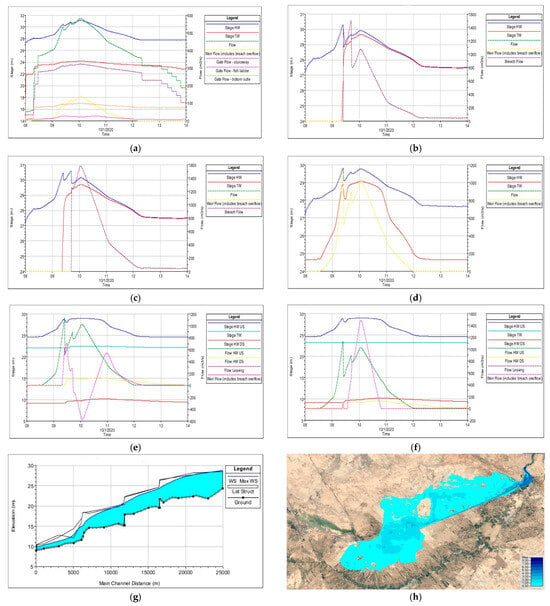
Figure 13.
Results of the current situation scenario, the 100-year return period: (a) hydrograph of the dam outlet in the current scenario; (b) hydrograph of the first fuse plug in the current scenario; (c) hydrograph of the second fuse plug in the current scenario; (d) flood channel overflow hydrograph in the current scenario; (e) right bank of the floodplain embankment hydrograph in the current scenario; (f) left bank of the floodplain embankment hydrograph in the current scenario; (g) water surface profiles in the flood channel in the current scenario; and (h) flood zones in the current scenario.
The following parameters are about the dam outlet, embankment, emergency overflow, and fuse plug diagrams:
- Stage H.W. (blue color) is the upstream level of the structure.
- Stage tw (red color) is the downstream level of the structure.
- Flow (green dashed line) is the total discharge.
- Weir flow (Yellow dashed line) and overflow (in any structure, it is related to the overflow).
- Gate flow—sluiceway (purple dashed line corresponding to the dam) is the discharge of sediment discharge duct.
- Gate flow—fish ladder (pink dashed line) is the discharge of the fishway.
- The gate flow—bottom outlet (orange dashed line) is the discharge of the lower duct.
- Breach flow (purple dashed line in the fuse chart diagram) is discharged due to fuse plug failure.
And for the flood channel, the following parameters hold:
- Stage Hwus is the water level at the beginning of the canal.
- Stage tw is the water level behind the canal wall.
- Stage hwds is the water level at the end of the canal.
- Flow hwus is discharged at the beginning of the canal.
- Flow hw is discharged at the end of the canal.
- Weir flow is discharged by crossing the canal wall.
3.2. Flood Channel Dredging Scenario
In this scenario, only the effect of the roughness coefficient on the flood channel was investigated, and the sections used are similar to those in the “current situation” scenario. According to Figure 14b and Figure 15a, the overflow hydrographs in this scenario show that the flow rate has changed slightly compared to the “current situation” and can be said to have no effect upstream. The embankment hydrographs of the flood channel, according to Figure 14c and Figure 15b, show that significant flow goes out of the fractures located on the right bank at the channel end. Contrary to the “current situation” for a 10 to 50 years return period, no overflow in the channel beginning did not occur. During the 100-year return period, the channel inflow from the right bank embankment was such that the flow rate reached more than 2000 m3/s for a while and caused the overflow from the channel left bank, as shown in Figure 15d. The results obtained from this scenario will be similar to the basic design conditions if the embankments’ fractures are overhauled.

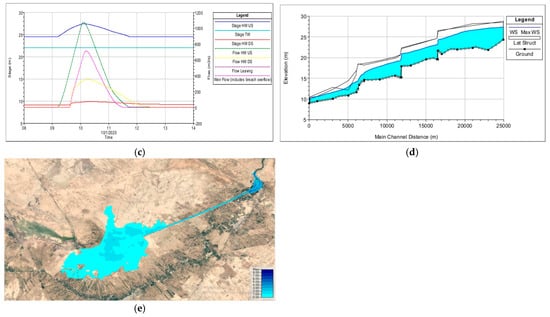
Figure 14.
Flood zones in the channel dredging scenario, 10-year return period: (a) dam outlet hydrograph in channel dredging scenario, 10-year return period; (b) Flood channel overflow hydrograph in channel dredging scenario, 10-year return period; (c) Right bank of the floodplain embankment hydrograph in the channel dredging scenario, 10-year return period; (d) Longitudinal profile of water surface in flood channel in canal dredging scenario, 10 year return period; and (e) Flood zones in the current scenario.
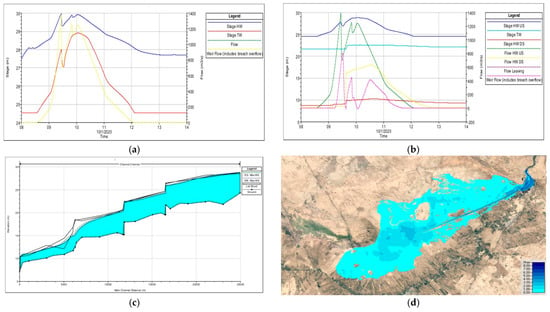
Figure 15.
Results of canal dredging scenario, the 100-year return period: (a) Flood channel overflow hydrograph in channel dredging scenario, 100-year return period; (b) Right bank of the floodplain embankment hydrograph in the channel dredging scenario, 100-year return period; (c) Water level profiles in the flood channel in the channel dredging scenario, 100-year return period; and (d) Flood zones in the channel dredging scenario, 100-year return period.
3.3. Flood Channel Overhaul Scenario
As shown in the “current situation,” the flood channel is very far from the design conditions and performs poorly. In the previous scenario, only the roughness effect was examined. In this scenario, the initial design conditions, in addition to roughness, are also discussed. According to Figure 16b and Figure 17a, the overflow hydrographs in this scenario show that the overflow is the same as in the previous scenarios and has not changed significantly. The results obtained from the canal modification show that there is no overflow from the embankments in all return periods. During the 100-year return period, for about 500 m3/s, the flood plain flow enters the canal from the right bank embankment and is transferred downstream. Because the channel bank height in the scenario increased by about 60 to 100 cm by the wall modification, the amount of inflow through the right bank embankment to the channel has decreased compared to the previous scenario.
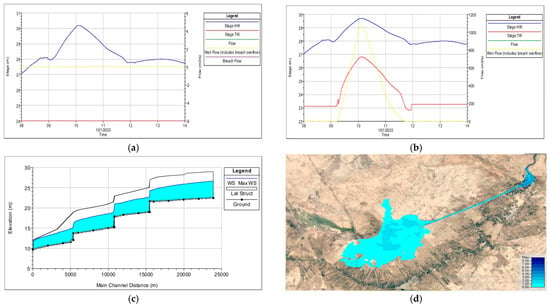
Figure 16.
Results of the channel overhaul scenario, a 10-year return period: (a) Hydrograph of the first fuse plug in the correction channel scenario, 10-year return period; (b) Flood channel overflow hydrograph in the correction channel scenario, 10-year return period; (c) Water surface profiles in the correction channel scenario, 10-year return period; and (d) Flood zones in the correction channel scenario, 10-year return period.
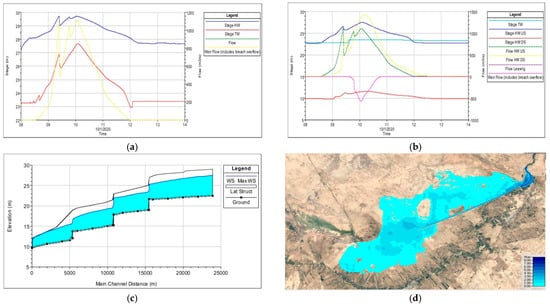
Figure 17.
Results of the channel overhaul scenario, a 100-year return period: (a) Flood channel overflow hydrograph in the correction channel scenario, 100-year return period; (b) Right bank of the floodplain embankment hydrograph in the correction channel scenario, 100-year return period; (c) Flood channel water surface profiles in the correction channel scenario, 100 year return period; and (d) Flood zones in the correction channel scenario, a 100-year return period.
3.4. Scenario of Flood Channel Modification and Reservoir Dredging
Correction of the flood channel alone can solve the problem of overflow from the embankments. However, the overflow is still less than the design flow, i.e., 1400 m3/s, and as a result, the maximum capacity of the channel is not used. That clearly shows that the overflow is affected by upstream conditions. Therefore, in this scenario, vegetation inside the reservoir was removed by a roughness coefficient of 0.025 to investigate the effect of upstream conditions on fuse plug performance and flood channel overflow. The results of the overflow hydrograph, as shown in Figure 18 and Figure 19, show that such action significantly increases the overflow rate. In the 25 and 100 years return period, 1520 and 1790 m3/s, respectively, overflow. Compared to the canal correction or dredging scenario alone, the minimum and maximum flow rate increases in the 25 and 100-year return periods are about 450 and 600 m3/s, respectively. According to the results obtained in this scenario, it is quite clear that the overhaul or dredging of the canal alone cannot solve all the problems and issues of the “current situation” because the condition of the reservoir is very dominant.
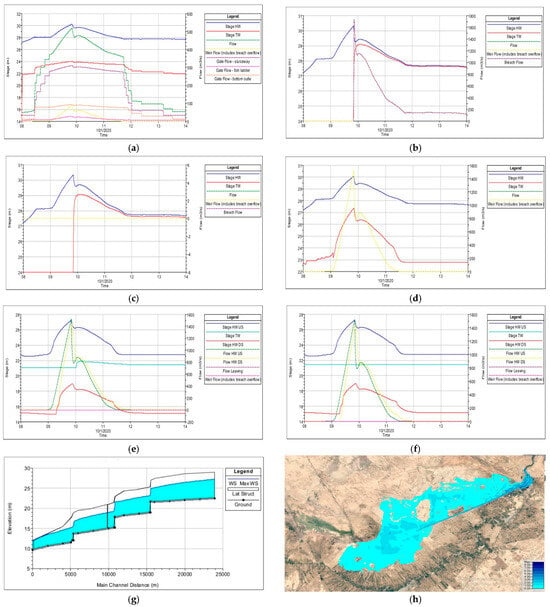
Figure 18.
Results of the canal overhaul scenario with reservoir dredging, the 25-year return period: (a) Dam output hydrograph in the correction channel scenario with reservoir dredging, 25-year return period; (b) Hydrograph of the first fuse plug in the correction channel scenario with reservoir dredging, 25-year return period; (c) Hydrograph of the second fuse plug in the correction channel scenario with reservoir dredging, 25-year return period; (d) Flood channel overflow hydrograph in the correction channel scenario with reservoir dredging, 25-year return period; (e) Right bank of the floodplain embankment hydrograph in the correction channel scenario with reservoir dredging, 25-year return period; (f) Left bank embankment hydrograph of floodplain in the correction channel scenario with reservoir dredging, 25-year return period; (g) Flood channel water level profile in the correction channel scenario with reservoir dredging, 25-year return period; and (h) Flood zones in the correction channel scenario with reservoir dredging, 25-year return period.
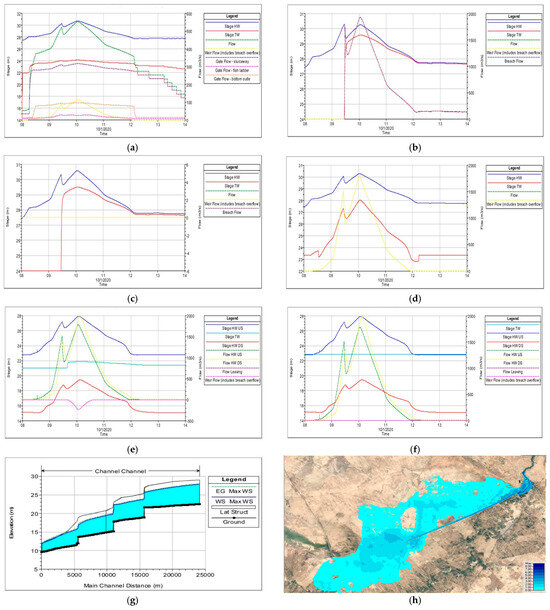
Figure 19.
Results of the canal overhaul scenario with reservoir dredging, the 100-year return period: (a) Barrier outlet hydrograph in the correction channel scenario with reservoir dredging, 100-year return period; (b) Hydrograph of the first fuse plug in the correction channel scenario with reservoir dredging, 100-year return period; (c) The second fuse plug hydrograph in the correction channel scenario with reservoir dredging, 100-year return period; (d) Flood channel overflow hydrograph in the correction channel scenario with reservoir dredging, 100-year return period; (e) Right bank of the floodplain embankment hydrograph in the correction channel scenario with reservoir dredging, 100-year return period; (f) Left bank of the floodplain embankment hydrograph in the correction channel scenario with reservoir dredging, 100-year return period; (g) Flood channel water level profile in the correction channel scenario with reservoir dredging, 100-year return period; and (h) Flood zones in the correction channel scenario with reservoir dredging, 100-year return period.
3.5. Fuse Plug Function
According to the design conditions, the fracture operation begins with the initial slip of the lower end of the conductor channel and reaches the clay core. The clay core then acts as a cascade and finally breaks, and the lateral washing of the embankment begins. In the following, the performance of this structure in different scenarios is discussed.
3.5.1. Current Situation
In this scenario, the first failure of the fuse plug occurs in the 25-, 50-, and 100-year return periods and the second fuse breaks only in the 100 years. None of the fuses break during the 10-year return period. All failures occur before the flood flow rate peak. It is worth noting that the freeboard height of the first fuse on the 10-year return period is about 6 cm (Figure 12b), and it is about 3 cm for the second fuse on the 50-year return period (Figure 20). The results obtained in Figure 12b–Figure 13b show that some of the overflow currents from the flood channel collect in the fuse plug tail before it is broken. In addition, the discharge resulting from the failure is added. This factor hurts the fuse plug failure process. In practice, this is because it prevents the formation of waterfalls and reduces the overturning force of the clay core after the onset of failure. As a result, the fuse plug is incompletely broken. The results show that the end fuse plug level in this scenario is between 26.35 and 26.75 before failure and reaches 29 to 29.65 after failure. In the best case, the difference between the head and tail is about 2 m and, in the worst case, is 1.5 m. Therefore, it is necessary to improve the downstream slope to prevent water accumulation in the fuse plug tail. Failure flow rates for both fuses are shown in Figure 12b–Figure 13c. Most of this scenario is related to the 100-year return period, taking into account that the sum of the two fuse plugs is about 3000 m3/s.
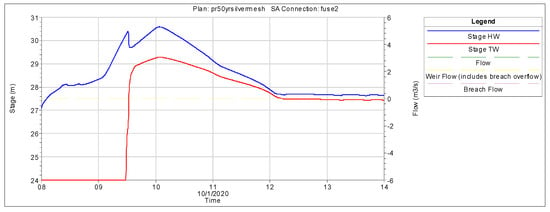
Figure 20.
Hydrograph of second fuse plug in the current situation scenario, the 50-year return period.
3.5.2. Flood Channel Dredging Scenario
3.5.3. Flood Channel Overhaul Scenario
The failures are different from the “current situation” scenario and are simply dredging the canal in this scenario. For the “current situation” scenario, the results show some overflow from the flood channel to the fuse plug tail before failure. According to the hydrograph of the fuse plugs (Like Figure 16a and Figure 17b), this issue was resolved similarly to the “channel dredging” scenario. The fuse plug tail is completely dry before failure for the entire return period. However, due to the improper slope of the stream, water still collects downstream of the fuse plate after failure.
Unlike the previous two scenarios, an interesting event in this scenario is the failure of the second fuse plug on the 50-year return period (Figure 21). It should be noted that previously, a significant amount of failure flow entered the flood channel. However, because of the increasing flood channel sidewall height (about 60 to 100 cm), the inlet flow to the channel is greatly reduced compared to the previous two scenarios. As a result, the head and tailwater of the fuse plug will increase due to the inappropriate slope downstream. This scenario causes the second fuse plug to be destroyed after the flood peak reaches a 50-year return period. As can be seen from the above results, modifying one component without considering other factors can aggravate the crisis in different components.
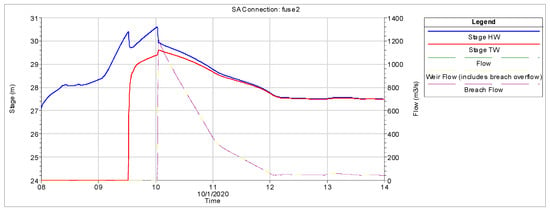
Figure 21.
Hydrograph of second fuse plug in the flood channel overhaul scenario, 50-year return period.
3.5.4. Flood Channel Modification Scenario with Reservoir Dredging
Reservoir dredging can increase the overflow by about 450 to 600 m3/s. The results obtained from the fuse plug failure show that the increase in the overflow causes an average delay of 4 h to the start time at the fuse plug failure (still, the failure start time is before the peak flood flow rate). Therefore, the possibility of discharging excess flow through the overflow and canal is increased, and the water level in the reservoir after failure is lower than in the previous scenarios. The results show that the vegetation removal effect in the reservoir is such that it prevents the failure of the second fuse plug in the return periods of 50 and 100 years (in the scenario of an overhaul of the canal alone). According to the results obtained and the initial design, the failure of the first fuse plug in all scenarios for a more than ten-year return period is definite. It should be noted that the highest flow rate of 1800 m3/s due to failure in this scenario is related to the 100-year return period. This discharge is approximately half the output discharge of the sum of the two fuse plugs in the previous three scenarios. Reducing the flow rate of the fuse plug and increasing the overflow means reducing the depth of flooding in the fields in the floodplain and directing it to the wetland.
4. Conclusions
The current research used a conducting field and numerical tests to investigate the problem and provide a working solution for the fuse plug; so, the main goals are redesigning the fuse plug, emergency spillway, and flood system at Ramshir Dam, Iran. After examining the results of different scenarios, the results can be summarized as follows:
- (1)
- The current situation of the Ramshir diversion dam reservoir and flood channel is very far from the design conditions. This factor causes the difference between the initial and current hydraulic design conditions.
- (2)
- The flood channel cannot discharge flows of less than 1400 cubic meters per second (design capacity), and the flow overflows into the surrounding lands.
- (3)
- Flow rates greater than 2400 m3/s activate the first fuse plug.
- (4)
- The flow through the Ramshir diversion dam did not exceed 560 m3/s, so the downstream river will not flood.
- (5)
- The improper slope downstream of the fuse plug causes water to accumulate downstream and, in practice, prevents the fuse plug from breaking properly. Therefore, correcting the downstream slope of the fuse plug is essential.
- (6)
- Dredging or modifying the channel alone can greatly improve the hydraulic condition of the channel and allow flow rates of 1400 to 2000 m3/s.
- (7)
- Dredging or modifying the channel alone does not affect the flow rate of the overflow of the flood channel, but in the case of dredging the reservoir, the flow through the overflow increases by 400 to 600 m3/s.
- (8)
- Reservoir dredging, along with channel modification, causes a delay in the failure of the fuse plug, and as a result, the opportunity to discharge the flow through the overflow of the flood channel increases.
- (9)
- Reservoir dredging prevents the failure of the second fuse plug in the 100-year return period (flow rate 4370 m3/s).
- (10)
- The maximum flow rate (return period of 100 years) from the fuse plug in the channel modification scenario with reservoir dredging and other scenarios is 1800 and 3000 m3/s, respectively.
- (11)
- Although in the 100-year return period, in the channel modification scenario, along with the dredging of the reservoir, the second fuse plug does not enter the circuit, its free height is about 3 cm. If we consider the calculation error, the possibility of the second fuse breaking, in this case, is also possible.
- (12)
- A significant amount of the flow resulting from the failure of the fuse plug enters this channel through the flood plain located on the right side of the flood channel.
- (13)
- The increase in the embankment wall of the flood channel reduces the inflow from the flood plain. As a result, this factor, in addition to the inappropriate slope of the fuse abutment, causes the failure of the second fuse plug in the 50-year return period (flow rate of 3400 m3/s) in the scenario of the basic modification of the flood channel.
- (14)
- In channel correction or dredging conditions, the maximum speed does not exceed the allowed value of 1.8 m/s.
In the end, it is mentioned that the main limitation of the present research, considering the extent of the area and the vastness of the flood plain, is the use of Google Earth maps, which, due to the time delay in imaging, allows possibility of error in the flood trend in the flood plain. Of course, this error has been controlled and reduced to a certain extent due to the ground surveys. Also, since the flood spreading modeling in this article is carried out using the HEC-RAS two-dimensional model and this model simulates in the form of depth averaging, three-dimensional models can be used in future research to increase the accuracy of the simulation.
Author Contributions
Conceptualization: All authors; Methodology: All authors; Software: P.K. and J.A.; Validation: All authors; Formal Analysis: All authors; Investigation: All authors; Resources: All authors; Data Curation: All authors; Writing—Original Draft Preparation: All authors; Writing—Review and Editing: All authors; Visualization: All authors; Supervision: J.A.; M.V., and S.M.S.; Project Administration: J.A.; M.V., and S.M.S.; Funding Acquisition: J.A.; M.V., and S.M.S. All authors have read and agreed to the published version of the manuscript.
Funding
This work was supported by the Shahid Chamran University of Ahvaz and Khuzestan Water and Power Authority.
Data Availability Statement
All data generated or analyzed during this study are available from the corresponding authors upon request.
Acknowledgments
The authors are grateful to the Research Council of the Shahid Chamran University of Ahvaz, the Khuzestan Water and Power Authority (KWPA), and the Center of Excellence of the Irrigation and Drainage Networks Improvement and Maintenance (Ahvaz, Iran) for financial support.
Conflicts of Interest
The authors declare no conflicts of interest.
References
- Tran, T.N.D.; Nguyen, B.Q.; Grodzka-Łukaszewska, M.; Sinicyn, G.; Lakshmi, V. The role of reservoirs under the impacts of climate change on the Srepok River basin, Central Highlands of Vietnam. Front. Environ. Sci. 2023, 11, 1304845. [Google Scholar] [CrossRef]
- Nguyen, B.Q.; Kantoush, S.A.; Tran, T.-N.-D.; van Binh, D.; Vo, N.D.; Saber, M.; Sumi, T. Response of Hydrological to Anthropogenic Activities in a Tropical Basin. In Proceedings of the 40th IAHR World Congress, Vienna, Austria, 21–25 August 2023. [Google Scholar] [CrossRef]
- Al-Hussein, A.A.; Khan, S.; Ncibi, K.; Hamdi, N.; Hamed, Y. Flood analysis using HEC-RAS and HEC-HMS: A case study of Khazir River (Middle East—Northern Iraq). Water 2022, 14, 3779. [Google Scholar] [CrossRef]
- Mulligan, R.P.; Mallinson, D.J.; Clunies, G.J.; Rey, A.; Culver, S.J.; Zaremba, N.; Leorri, E.; Mitra, S. Estuarine responses to long-term changes in inlets, morphology, and sea level rise. J. Geophys. Res. Oceans 2019, 124, 9235–9257. [Google Scholar] [CrossRef]
- Chen, J.; Huang, G.; Chen, W. Towards better flood risk management: Assessing flood risk and investigating the potential mechanism based on machine learning models. J. Environ. Manag. 2021, 293, 112810. [Google Scholar] [CrossRef]
- Tran, T.N.D.; Lakshmi, V. Enhancing human resilience against climate change: Assessment of hydroclimatic extremes and sea level rise impacts on the eastern shore of Virginia, United States. Sci. Total Environ. 2024, 947, 174289. [Google Scholar] [CrossRef] [PubMed]
- Do, S.K.; Nguyen, B.Q.; Tran, V.N.; Grodzka-Łukaszewska, M.; Sinicyn, G.; Lakshmi, V. Investigating the Future Flood and Drought Shifts in the Transboundary Srepok River Basin Using CMIP6 Projections. IEEE J. Sel. Top. Appl. Earth Obs. Remote Sens. 2024, 17, 7516–7529. [Google Scholar]
- Ongdas, N.; Akiyanova, F.; Karakulov, Y.; Muratbayeva, A.; Zinabdin, N. Application of HEC-RAS (2D) for flood hazard maps generation for Yesil (Ishim) river in Kazakhstan. Water 2020, 12, 2672. [Google Scholar] [CrossRef]
- Nguyen, B.Q.; Van Binh, D.; Tran, T.N.D.; Kantoush, S.A.; Sumi, T. Response of streamflow and sediment variability to cascade dam development and climate change in the Sai Gon Dong Nai River basin. Clim. Dyn 62. 2024, 7997–8017. [Google Scholar] [CrossRef]
- IPCC: Climate Change 2023: Synthesis Report. Contribution of Working Groups I, II and III to the Sixth Assessment Report of the Intergovernmental Panel on Climate Change; Lee, T.H., Romero, J., Eds.; IPCC: Geneva, Switzerland, 2023; pp. 35–115. [Google Scholar] [CrossRef]
- Allen, M.; Antwi-Agyei, P.; Aragon-Durand, F.; Babiker, M.; Bertoldi, P.; Bind, M.; Brown, S.; Buckeridge, M.; Camilloni, I.; Cartwright, A.; et al. Technical Summary: Global warming of 1.5 C. An IPCC Special Report on the Impacts of Global Warming of 1.5 C Above Pre-Industrial Levels and Related Global Greenhouse Gas Emission Pathways, in the Context of Strengthening the Global Re-sponse to the Threat of Climate Change, Sustainable Development, and Efforts to Eradicate Poverty. Intergovernmental Panel on Climate Change: Geneva, Switzerland, 2019. [Google Scholar]
- Weilnhammer, V.; Schmid, J.; Mittermeier, I.; Schreiber, F.; Jiang, L.; Pastuhovic, V.; Herr, C.; Heinze, S. Extreme weather events in europe and their health consequences–A systematic review. Int. J. Hygiene Environ. Health 2021, 233, 113688. [Google Scholar] [CrossRef]
- Tapas, M.R.; Etheridge, R.; Finlay, C.G.; Peralta, A.L.; Bell, N.; Xu, Y.; Lakshmi, V. A methodological framework for assessing sea level rise impacts on nitrate loading in coastal agricultural watersheds using SWAT+: A case study of the Tar-Pamlico River basin, North Carolina, USA. Sci. Total Environ. 2024, 951, 175523. [Google Scholar] [CrossRef]
- Tapas, M.R.C.; Do, S.K.; Etheridge, R.; Lakshmi, V. Investigating the impacts of climate change on hydroclimatic extremes in the Tar-Pamlico River basin, North Carolina. J. Environ. Manag. 2024, 363, 121375. [Google Scholar] [CrossRef]
- Yari, A.; Ardalan, A.; Ostadtaghizadeh, A.; Zarezadeh, Y.; Boubakran, M.S.; Bidarpoor, F.; Rahimiforoushani, A. Underlying factors affecting death due to flood in Iran: A qualitative content analysis. Int. J. Disaster Risk Reduct. 2019, 40, 101258. [Google Scholar] [CrossRef]
- Hadian, S.; Afzalimehr, H.; Soltani, N.; Tabarestani, E.S.; Karakouzian, M.; Nazari-Sharabian, M. Determining flood zonation maps, using new ensembles of multi-criteria decision-making, bivariate statistics, and artificial neural network. Water 2022, 14, 1721. [Google Scholar] [CrossRef]
- Darand, M.; Sohrabi, M.M. Identifying drought-and flood-prone areas based on significant changes in daily precipitation over Iran. Nat. Hazards 2018, 90, 1427–1446. [Google Scholar] [CrossRef]
- Nabinejad, S.; Schüttrumpf, H. Agent-Based Modeling for Household Decision-Making in Adoption of Private Flood Mitigation Measures: The Upper Kan Catchment Case Study. Water 2024, 16, 2027. [Google Scholar] [CrossRef]
- Shokri, A.; Sabzevari, S.; Hashemi, S.A. Impacts of flood on health of Iranian population: Infectious diseases with an emphasis on parasitic infections. Parasite Epidemiol. Control. 2020, 9, e00144. [Google Scholar] [CrossRef] [PubMed]
- Ogras, S.; Onen, F. Flood Analysis with HEC-RAS: A Case Study of Tigris River. Adv. Civ. Eng. 2020, 2020, 6131982. [Google Scholar] [CrossRef]
- Wang, W.; Zhou, K.; Jing, H.; Zuo, J.; Li, P.; Li, Z. Effects of bridge piers on flood hazards: A case study on the Jialing river in China. Water 2019, 11, 1181. [Google Scholar] [CrossRef]
- Nunes Correia, F.; Castro Rego, F.; Da Grača Saraiva, M.; Ramos, I. Coupling GIS with hydrologic and hydraulic flood modelling. Water Resour. Manag. 1998, 12, 229–249. [Google Scholar] [CrossRef]
- Bellos, V.; Tsakiris, G. Comparing various methods of building representation for 2D flood modelling in built-up areas. Water Resour. Manag. 2015, 29, 379–397. [Google Scholar] [CrossRef]
- Chen, S.; Garambois, P.A.; Finaud-Guyot, P.; Dellinger, G.; Mose, R.; Terfous, A.; Ghenaim, A. Variance based sensitivity analysis of 1D and 2D hydraulic models: An experimental urban flood case. Environ. Model. Softw. 2018, 109, 167–181. [Google Scholar] [CrossRef]
- Dong, B.; Xia, J.; Zhou, M.; Li, Q.; Ahmadian, R.; Falconer, R.A. Integrated modeling of 2D urban surface and 1D sewer hydrodynamic processes and flood risk assessment of people and vehicles. Sci. Total. Environ. 2022, 827, 154098. [Google Scholar] [CrossRef] [PubMed]
- Kitsikoudis, V.; Becker, B.P.; Huismans, Y.; Archambeau, P.; Erpicum, S.; Pirotton, M.; Dewals, B. Discrepancies in Flood Modelling Approaches in Transboundary River Systems: Legacy of the Past or Well-grounded Choices? Water Resour. Manag. 2020, 34, 3465–3478. [Google Scholar] [CrossRef]
- Amponsah, W.; Marra, F.; Zoccatelli, D.; Marchi, L.; Crema, S.; Pirastru, M.; Borga, M. Scale-dependence of observational and modelling uncertainties in forensic flash flood analysis. J. Hydrol. 2022, 607, 127502. [Google Scholar] [CrossRef]
- Vacondio, R.; Rogers, B.; Stansby, P.; Mignosa, P. SPH modeling of shallow flow with open boundaries for practical flood simulation. J. Hydraul. Eng. 2011, 138, 530–541. [Google Scholar] [CrossRef]
- Liu, Q.; Qin, Y.; Zhang, Y.; Li, Z. A coupled 1D–2D hydrodynamic model for flood simulation in flood detention basin. Nat. Hazards 2015, 75, 1303–1325. [Google Scholar] [CrossRef]
- Brunner, G.W. HEC-RAS River Analysis System User’s Manual Version 5.0; US Army Corps of Engineers: Washington, DC, USA, 2016; Volume 962. [Google Scholar]
- Bellos, V.; Tsakiris, V.K.; Kopsiaftis, G.; Tsakiris, G. Propagating dam breach parametric uncertainty in a river reach using the HEC-RAS software. Hydrology 2020, 7, 72. [Google Scholar] [CrossRef]
- Nobre, A.D.; Cuartas, L.A.; Hodnett, M.; Renno, C.D.; Rodrigues, G.; Silveira, A.; Waterloo, M.; Saleska, S. Height above the nearest drainage—A hydrologically relevant new terrain model. J. Hydrol. 2011, 404, 13–29. [Google Scholar] [CrossRef]
- Teng, J.; Vaze, J.; Kim, S.; Dutta, D.; Jakeman, A.J.; Croke, B.F.W. Enhancing the capability of a simple, computationally efficient, conceptual flood inundation model in hydrologically complex terrain. Water Resour. Manag. 2019, 33, 831–845. [Google Scholar] [CrossRef]
- Xiong, Y. A Dam Break Analysis Using HEC-RAS. J. Water Resour. Protect 2011, 3, 370–379. [Google Scholar] [CrossRef]
- Haltas, I.; Tayfur, G.; Elci, S. Two-dimensional numerical modeling of flood wave propagation in an urban area due to Ürkmez dam-break, İzmir, Turkey. Nat. Hazards 2016, 81, 2103–2119. [Google Scholar] [CrossRef]
- Patel, D.P.; Ramirez, J.A.; Srivastava, P.K.; Bray, M.; Han, D. Assessment of flood inundation mapping of Surat city by coupled 1D/2D hydrodynamic modeling: A case application of the new HEC-RAS 5. Nat. Hazards 2017, 89, 93–130. [Google Scholar] [CrossRef]
- Parhi, P.K. Flood Management in Mahanadi Basin using HEC-RAS and Gumbel’s Extreme Value Distribution. J. Inst. Eng. (India) Ser. A 2018, 99, 751–755. [Google Scholar] [CrossRef][Green Version]
- Ghimire, E.; Sharma, S.; Lamichhane, N. Evaluation of one-dimensional and two-dimensional HEC-RAS models to predict flood travel time and inundation area for flood warning system. ISH J. Hydraul. Eng. 2022, 28, 110–126. [Google Scholar] [CrossRef]
- Rangari, V.A.; Umamahesh, N.V.; Bhatt, C.M. Assessment of inundation risk in urban floods using HEC RAS 2D. Model. Earth Syst. Environ. 2019, 5, 1839–1851. [Google Scholar] [CrossRef]
- Dasallas, L.; Kim, Y.; An, H. Case study of HEC-RAS 1D–2D coupling simulation: 2002 Baeksan flood event in Korea. Water 2019, 11, 2048. [Google Scholar] [CrossRef]
- Yalcin, E. Assessing the impact of topography and land cover data resolutions on two-dimensional HEC-RAS hydrodynamic model simulations for urban flood hazard analysis. Nat. Hazards 2020, 101, 995–1017. [Google Scholar] [CrossRef]
- Garcia, M.; Juan, A.; Bedient, P. Integrating reservoir operations and flood modeling with HEC-RAS 2D. Water 2020, 12, 2259. [Google Scholar] [CrossRef]
- Qian, Q.; Edwards, D.J.; Zhang, Y.; Haselbach, L. Improving Flood Inundation Mapping Accuracy Using HEC-RAS Modeling: A Case Study of the Neches River Tidal Floodplain in Texas. J. Hydrol. Eng. 2024, 29, 05024011. [Google Scholar] [CrossRef]
- Bahmanpouri, F.; Lazzarin, T.; Barbetta, S.; Moramarco, T.; Viero, D.P. Estimating flood discharge at river bridges using the entropy theory. Insights from Computational Fluid Dynamics flow fields. Hydrol. Earth Syst. Sci. Discuss. 2023, 28, 3717–3737. [Google Scholar] [CrossRef]
- Chen, L.; Ye, L.; Singh, V.; Zhou, J.; Guo, S. Determination of input for artificial neural networks for flood forecasting using the copula entropy method. J. Hydrol. Eng. 2014, 19, 04014021. [Google Scholar] [CrossRef]
- Khazaei Moughani, S.; Rezazadeh, S.; Azimmohseni, M.; Rahi, G.; Bahmanpouri, F. Applying a transfer function model to improve the sediment rating curve. Int. J. River Basin Manag. 2024, 1–13. [Google Scholar]
- Farina, G.; Alvisi, S.; Franchini, M.; Corato, G.; Moramarco, T. Estimation of bathymetry (and discharge) in natural river cross-sections by using an entropy approach. J. Hydrol. 2015, 527, 20–29. [Google Scholar] [CrossRef]
- Mahab Ghods Consultant Engineering Group. Detail Design of Ramshir Diversion Dam and Its Flood Control, Energy Ministry of Iran; Mahab Ghods Consultant Engineering Group: Tehran, Iran, 1995; p. 225. [Google Scholar]
- Ahadiyan, J.; Bahmanpouri, F.; Adeli, A.; Gualtieri, C.; Khoshkonesh, A. Riprap Effect on Hydraulic Fracturing Process of Cohesive and Non-cohesive Protective Levees. Water Resour. Manag. 2022, 36, 625–639. [Google Scholar] [CrossRef]
- Zolghadr, M.; Hashemi, M.R.; Hosseinipour, E.Z. Investigating the Optimum pattern of Levee System Fuse Plugs by a Two-Dimensional Model. In World Environmental and Water Resources Congress: Crossing Boundaries; ASCE press: Reston, VA, USA, 2012; pp. 1186–1194. [Google Scholar] [CrossRef]
- Zainal, N.N.; Abu Talib, S.H. Review paper on applications of the HEC-RAS model for flooding, agriculture, and water quality simulation. Water Pract. Technol. 2024, 19, 2883–2900. [Google Scholar] [CrossRef]
- Raji, B.M.; Turabi, H.; Nasimi, M.N. Sedimentation Analysis of Kabul River by Using HEC-RAS. J. Inst. Eng. (India) Ser. A 2024, 105, 229–238. [Google Scholar] [CrossRef]
- Romali, N.S.; Yusop, Z.; Ismail, A.Z. Application of HEC-RAS and Arc GIS for floodplain mapping in Segamat town, Malaysia. Geomate J. 2018, 15, 7–13. [Google Scholar] [CrossRef]
- Hydrologic Engineering Center. HEC-RAS River Analysi System, Hydraulic Reference Manual; U.S. Army Corps of Engineering, Hydrologic Engineering Center: Davis, CA, USA, 2016. [Google Scholar]
Disclaimer/Publisher’s Note: The statements, opinions and data contained in all publications are solely those of the individual author(s) and contributor(s) and not of MDPI and/or the editor(s). MDPI and/or the editor(s) disclaim responsibility for any injury to people or property resulting from any ideas, methods, instructions or products referred to in the content. |
© 2024 by the authors. Licensee MDPI, Basel, Switzerland. This article is an open access article distributed under the terms and conditions of the Creative Commons Attribution (CC BY) license (https://creativecommons.org/licenses/by/4.0/).