Article

Linking Water Quality Indicators in Stable Reservoir Ecosystems: Correlation Analysis and Ecohydrological Implications

1
College of Natural Resources and Geographic Information, Hubei Land Resources Vocational College, Wuhan 430090, China
2
Yejin Geological Brigade of Hubei Geological Bureau, Shiyan 435004, China
3
Eighth Geological Brigade of Hubei Geological Bureau, Xiangyang 441000, China
4
Laboratory of Soil Health and Green Remediation, College of Resources and Environment, Huazhong Agricultural University, Wuhan 430070, China
5
Hubei Geological Survey, Wuhan 430034, China
6
Business School, Huanggang Normal University, No. 146 Xinggang 2nd Road, Huanggang 430070, China
*
Authors to whom correspondence should be addressed.
Water 2024, 16(24), 3600; https://doi.org/10.3390/w16243600
Submission received: 26 November 2024 / Revised: 11 December 2024 / Accepted: 12 December 2024 / Published: 14 December 2024

Abstract

:
This research was conducted to determine the connections between dissolved oxygen (DO), chemical oxygen demand (COD), permanganate index (CODMn), five-day biochemical oxygen demand (BOD5), and ammonia nitrogen (NH3-H) across five reservoirs of Yunmeng County, China, from January to November 2022. Each month, water samples were collected and subjected to analysis using standard methods. The samples were collected and analyzed using standard methods: dissolved oxygen was determined using the electrochemical probe method, COD was measured via the rapid digestion spectrophotometric method, CODMn was detected using the potassium permanganate oxidation method, BOD5 was determined using the dilution and inoculation method, and NH3-N was measured by using the Nessler reagent spectrophotometry method. The results confirmed strong positive correlations between COD and CODMn, with different intensities from reservoir to reservoir. More specific and demanding COD parameters were used to estimate the level of oxygen consumption; hence, a more variable correlation strength was observed between BOD5 and the other two parameters. Thus, BOD5 was found to be the main indicator of biodegradable organic matter and bacterial oxygen consumption. However, the results were negative, showing a decreasing trend. This means that the oxygen content was lower in the majority of reservoirs, which is attributed to the decomposition of ammonia nitrogen and the presence of organic matter. These findings significantly contribute to the development of appropriate programs for efficient water quality monitoring and the development of reservoir-specific management strategies. This study suggests that there is a need for continuous monitoring of these parameters, together with the extension of the program to additional reservoirs and water quality indicators, along with the use of advanced modeling techniques to clarify the underlying factors that connect water quality parameters in these complex reservoir ecosystems.

1. Introduction

The quality of surface water is routinely assessed through indicators such as dissolved oxygen (DO), permanganate index (CODMn), chemical oxygen demand (COD), five-day biochemical oxygen demand (BOD5), ammonia nitrogen (NH3-N), conductivity, transparency, turbidity, and chlorophyll-a. These parameters are critical for monitoring the condition of reservoirs and reservoirs, as surface water plays a central role in environmental impact assessments and is closely tied to human health and well-being. Using monitoring data from Mengze Reservoir, Zhengjia Reservoir, Huangxiang Reservoir, Sunjia Reservoir, and Longxuhou Reservoir in Yunmeng County, Xiaogan City, this study examines the relationships among DO, COD, CODMn, BOD5, and NH3-N. The reservoirs were selected based on their individual exposure to agriculture, residential, and industrial activity, ensuring a diverse sampling to capture potential pollution dynamics. The analysis explores the interactions among these parameters in stable aquatic systems, providing insights into water pollution mechanisms and informing strategies for continuous monitoring and quality control.
Dissolved oxygen (DO) is a measure of the free oxygen dissolved in water, serving as a vital indicator of aquatic environmental quality and ecosystem health [1]. It is a critical metric for evaluating water quality and the self-purification capacity of water bodies, which is influenced by factors such as temperature, atmospheric pressure, water depth, dissolved salts, algae content, and light intensity [2,3]. Low dissolved oxygen levels in polluted water bodies can lead to the proliferation of anaerobic bacteria, resulting in the decomposition of organic matter and causing the water to become malodorous and discolored. Consequently, DO is a key parameter in assessing water pollution and self-purification capabilities, with higher DO levels indicating better water quality and lower levels suggesting increased organic pollution.
Research worldwide identifies DO as a critical variable in the modeling of ecological health. In the United States, studies highlight its involvement in nutrient cycling and biodiversity maintenance in freshwater lakes [4,5,6]. In China, comparable studies showed DO levels as a vital factor affecting microbial activity and pollutant degradation in river systems, highlighting its importance for localized and large-scale water quality evaluations [7,8,9,10].
Chemical oxygen demand (COD) represents the amount of oxygen required to oxidize organic and inorganic substances in water, as determined by potassium dichromate oxidation under acidic conditions. This parameter provides a rapid assessment of water pollution levels caused by reducing substances, with its primary limitation being the inability to distinguish oxygen consumption due to microbial decomposition [11,12]. Similarly, the permanganate index (CODMn) measures the oxygen equivalent of substances oxidized by potassium permanganate under specific conditions. It serves as an aggregate indicator of pollution by organic and reducing inorganic substances [13].
Although COD and CODMn have been used for many years in assessing water quality, their use as a real-time monitoring system has grown in recent years. In a series of studies in Vietnam, combined COD measurements and multivariate statistical techniques have been undertaken to provide useful insights into pollution sources [14,15]. A similar pattern is observable in Chinese research, where COD and CODMn are used to assess the efficiency of industrial wastewater treatment systems [16,17,18].
The COD and CODMn values indicate the concentration of oxidizable substances in water, differentiated by the oxidants used: potassium dichromate for COD and potassium permanganate for CODMn. These parameters reflect the severity of organic pollution in water bodies, with higher values corresponding to greater pollution levels.
The five-day biochemical oxygen demand (BOD5) quantifies the oxygen consumed by microorganisms during the decomposition of organic matter under specified conditions [19]. This parameter is particularly representative of microbial activity in water, providing a practical measure of biodegradable organic matter. It is influenced by reducing substances such as organic matter, nitrites, sulfides, and ferrous compounds, with organic matter being the predominant contributor.
Studies from both developed and developing regions revealed the increasing use of BOD5 as a tool for urban water quality management. For example, in Europe, BOD5 monitoring has been assimilated into automated systems for predicting algal bloom dates [20,21,22]. On the other hand, comparable studies in the Huai River Basin of China emphasize its effectiveness in monitoring agricultural runoff [23].
Ammonia nitrogen (NH3-N), comprising free ammonia (NH3) and ammonium ions (NH4+), is another key indicator of water quality. It primarily originates from the microbial decomposition of nitrogen-containing organic matter, particularly in domestic sewage. High NH3-N levels indicate nutrient enrichment and severe pollution, often leading to eutrophication and reduced self-purification capacity.
Chlorophyll-a, an indicator of phytoplankton biomass, is critical for assessing primary productivity and eutrophication levels in aquatic ecosystems. Its concentration provides valuable insights for water quality management.
The interrelationships among DO, COD, CODMn, BOD5, and NH3-N are significant for understanding pollution dynamics in stable aquatic systems. Other parameters such as conductivity, transparency, turbidity, and chlorophyll-a may also exhibit correlations in pristine natural waters. This study aims to elucidate these relationships, contributing to the broader understanding of water quality dynamics and the development of effective monitoring strategies.

2. Research Methodology

2.1. Study Area and Research Sites

This study focuses on five reservoirs located in Yunmeng County, Xiaogan City, Hubei Province: Mengze Reservoir, Zhengjia Reservoir, Huangxiang Reservoir, Sunjia Reservoir, and Longxuhou Reservoir (Figure 1). Surface water samples were collected from fixed cross-sectional points at the beginning of each month. Sampling points of the above cross-sections were selected according to the hydrology and topography characteristics, distribution of pollutant sources, and accessibility of transportation to guarantee representativeness. Sampling points were established at various key points at each hydrated reservoir to represent changes in water quality information, including inflow locations of tributaries, sewage disposal points, and hydrological transitions. Based on individual water depth, samples were collected at a depth of 0.5 m below the surface, 0.5 m above the bottom for waters greater than 5 m, 0.3 m below the surface, and 0.3 m above the bottom for waters less than 1 m. By capturing area-specific data, this method ensured that results were representative, accurate, comparable, and accounted for spatial and temporal distributions of pollutants. Standard detection methods were employed to analyze the water quality at these sites.
The Mengze Reservoir is situated between Jianshe East Road and Longgang East Road, to the west of Huangxiang Avenue and east of Huguang Road, adjacent to the Xiangshan Museum. The reservoir covers an area of over 22.85 hectares, with an average water depth of 2.2 m. The water is primarily sourced from natural precipitation and rainwater collected from the surrounding catchment area. The reservoir field has been artificially expanded.
The Zhengjia Reservoir is located in Chengguan Town, Yunmeng County, approximately 1000 m from the Longgang Cemetery and 3000 m from the Sleeping Tiger Cemetery.
The Huangxiang Reservoir, also situated in Yunmeng County, is interconnected with other reservoirs, which means its water level and volume are influenced by the broader regional water system. Historically, the Yunmeng County Water Conservancy and Lake Bureau has conducted ecological water replenishment efforts to maintain the reservoir’s health and environmental stability. For example, in the summer of 2021, due to high temperatures, reduced reservoir area, and low self-purification capacity, the reservoir’s water level dropped and its water quality deteriorated. In response, the Water Conservancy and Lake Bureau implemented a series of measures, including the use of culvert pipes to inject water into the reservoir, successfully improving both water quality and the water level.
The Sunjia Reservoir and Longxuhou Reservoir are also located within Xiaogan City. This region falls under the subtropical monsoon climate zone, characterized by distinct seasons with abundant rainfall during the summer. The climate significantly impacts both the water volume and ecosystem health of these reservoirs.
The five reservoirs are subjected to different pollutant sources owing to the presence of human activities around these waterbodies. Due to its proximity to urban areas, the Mengze Reservoir receives large quantities of domestic sewage containing organic matter, nitrogen, phosphorus compounds, and bacteria. If industrial effluents such as heavy metals, organic pollutants, acids, or alkalis are not treated sufficiently, contaminants could threaten the Zhengjia Reservoir and Huangxiang Reservoir. Sunjia and Longxuhou Reservoirs are susceptible to non-point source pollution from agricultural runoff, which includes fertilizers, pesticides, and agricultural waste like straw and livestock manure. Landfill leachate, which contains organic matter and heavy metals, threatens the quality of water in all reservoirs. Also, rainwater and surface runoff carry suspended solids, organic matter, and bacterial contaminants into the rainwater reservoirs, exacerbating the pollution problem.
The reservoirs for this study were selected based on geographic concentration, representativeness, and ecological diversity. The Mengze Reservoir was selected for its unique ecosystem and water quality characteristics, as local environmental conditions are reflected in the reservoir. The Zhengjia Reservoir, holding a dual role as a natural reservoir and an archaeological site, is a typical reservoir affected by anthropogenic activities/culture. The Huangxiang, Sunjia, and Longxuhou Reservoirs were selected due to their different pollution degrees and ecological characteristics, thus providing a fairly representative view of the water quality in the region. These reservoir pairs collectively offer a balance: on the one hand, they are representative of typical conditions, on the other, they are unique to the region, making them appropriate for regional water quality assessments.
These five reservoirs—Huangxiang, Mengze, Zhengjia, Sunjia, and Longxuhou—are connected through the Sanhu Canal (also known as the Quyang River), which forms an ecological water system stretching over 20 km around the city. This interconnected water system plays a crucial role in the hydrology in Yunmeng County, with each reservoir depending on the others to maintain ecological balance.
Table 1 provides a summary of the key characteristics and monitoring indicators for each of the five reservoirs, including conductivity, transparency, chlorophyll-a levels, and turbidity.

2.2. Research Method

The water quality monitoring data for key parameters—chemical oxygen demand (COD), five-day biochemical oxygen demand (BOD5), and permanganate index (CODMn)—were analyzed through pairwise linear regression to establish the linear relationship between these variables. The univariate linear regression equation (y) and the correlation coefficient (R) were used to assess the strength of the linear correlation. The data used for this analysis were collected from January 2022 to November 2022 (to sufficiently represent the temporal variability of water quality indicators of the research zone). The data contain different seasonal change phases, including the wet season, dry season, and intermediate seasons, covering the entire period to analyze the changing trends over the seasonal periods. While a year or more of monitoring might have theoretically been better, this approach was avoided due to cost-effectiveness, operational complexity, and diminishing returns with regard to seasonality analysis. This strikes a balance by allowing sufficient seasonal variation in the classifications while also being practical enough to collect and process data within a reliable timeframe.
A summary of the analysis method is provided in Table 2.

2.2.1. Main Equipment

  • JPBJ-608 Portable Dissolved Oxygen Analyzer (Shanghai Yideng Scientific Instrument Co., Ltd., Shanghai, China)
  • HCA-101 Standard COD Digester (Jiangsu Taizhou Huachen Instrument Co., Ltd., Taizhou, Jiangsu, China)
  • TU-1810D UV-Visible Spectrophotometer (Beijing Puyang General Instrument Co., Ltd., Beijing, China)
  • Burette

2.2.2. Water Sample Treatment Procedures

  • Dissolved oxygen: measured according to “Determination of Dissolved Oxygen in Water Quality—Electrochemical Probe Method” (HJ 506-2009) [24].
  • Chemical oxygen demand (COD): determined using the “Rapid Digestion Spectrophotometric Method” (HJ 828-2017) [25].
  • Permanganate index (CODMn): determined using the “Determination of Permanganate Index in Water Quality” (GB/T 11892-1989) [26].
  • Five-day biochemical oxygen demand (BOD5): measured according to the “Dilution and Inoculation Method” (HJ 505-2009) [11,12,27,28,29].
  • Ammonia nitrogen (NH3-N): measured using the “Nessler Reagent Spectrophotometry Method” (HJ 535-2009) [30].

2.3. Data Analysis

2.3.1. Correlation Analysis Using Univariate Linear Regression

To assess the relationships between key water quality parameters, the chemical oxygen demand (COD), five-day biochemical oxygen demand (BOD5), and permanganate index (CODMn) were paired and analyzed through univariate linear regression. For each pair, a linear regression equation was established, and the correlation coefficient (R) was calculated. The resulting equations and correlation coefficients are presented in Figure 2, Figure 3 and Figure 4 and Table 3. The analysis revealed a positive correlation between COD and BOD5 with CODMn in the surface water sections of the five reservoirs in the study area.

2.3.2. Correlation Coefficient (R) Analysis

The fitting results of the pairwise indices, shown in Figure 2, Figure 3 and Figure 4, suggest that the correlation coefficient (R) lies between 0 and 1, indicating a linear relationship between the variables. The R-value was computed using the univariate linear regression equations for the following index pairs: COD-CODMn, BOD5-CODMn, and COD-BOD5.
As shown in Table 3, the correlation coefficient for the univariate linear regression between COD and CODMn was greater than 0.5 across all five reservoirs, with the highest correlations observed in the Mengze Reservoir, followed by the Huangxiang Reservoir, Zhengjia Reservoir, Longxuhou Reservoir, and Sunjia Reservoir. This indicates a significant positive linear correlation between COD and CODMn in these water bodies, with the strength of the correlation decreasing in the following order: Mengze Reservoir > Huangxiang Reservoir > Zhengjia Reservoir > Longxuhou Reservoir > Sunjia Reservoir.
For the analysis of the relationship between BOD5 and CODMn, the highest R-value was observed for the Zhengjia Reservoir (0.5809), followed by the Sunjia Reservoir, Mengze Reservoir, and Huangxiang Reservoir. The Longxuhou Reservoir exhibited the lowest R-value (0.0022) in this analysis. Thus, the strength of the linear correlation between BOD5 and CODMn has the following order: Zhengjia Reservoir > Sunjia Reservoir > Mengze Reservoir > Huangxiang Reservoir > Longxuhou Reservoir.
These findings highlight the varying degrees of linear correlation between water quality indicators across the five reservoirs, which can inform targeted water quality management strategies.
By comparing the correlation coefficient (R) values for the univariate linear regression equation between chemical oxygen demand (COD) and five-day biochemical oxygen demand (BOD5), it was found that the Zhengjia Reservoir exhibited the highest R-value of 0.7507, surpassing the other four reservoirs. In contrast, the Longxuhou Reservoir had the lowest R-value at 0.0837. Based on these results, the strength of the linear correlation between COD and BOD5 in these reservoirs has the following order: Zhengjia Reservoir > Huangxiang Reservoir > Sunjia Reservoir > Mengze Reservoir > Longxuhou Reservoir. This analysis further emphasizes the varying degrees of relationship between these two water quality indicators across the study area.

3. Results and Discussion

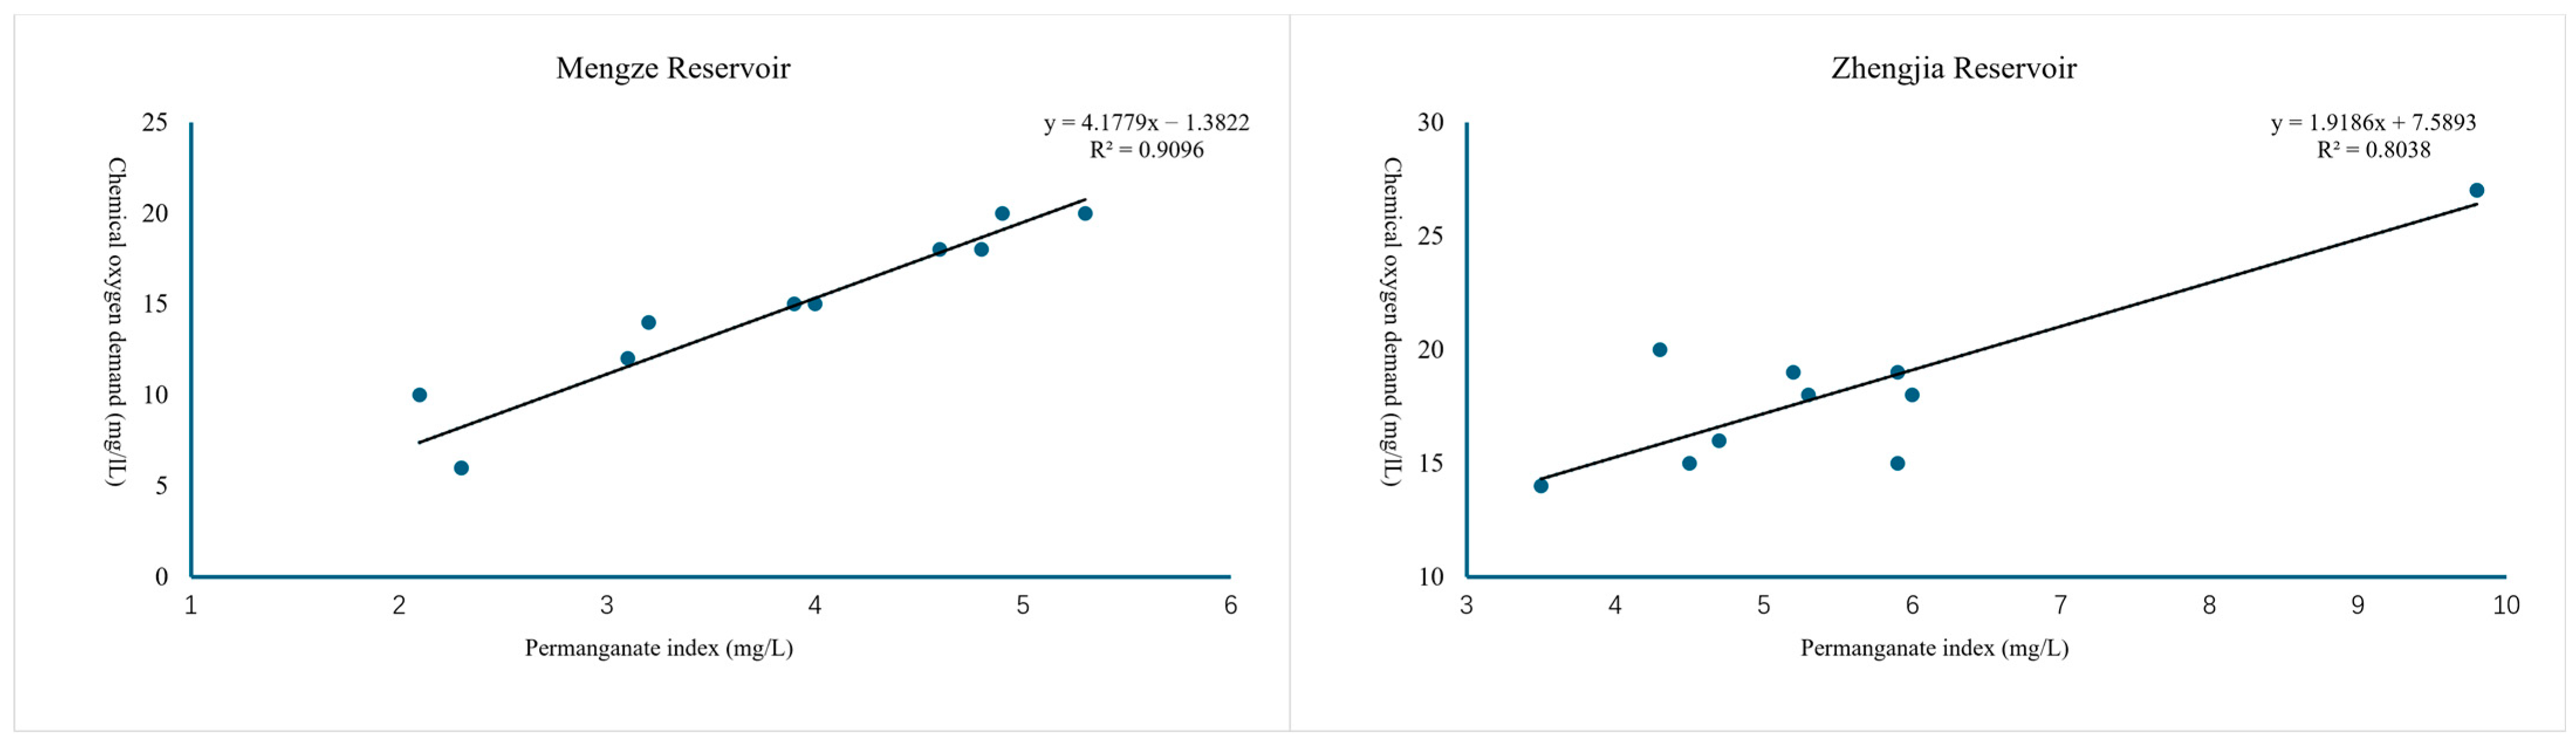
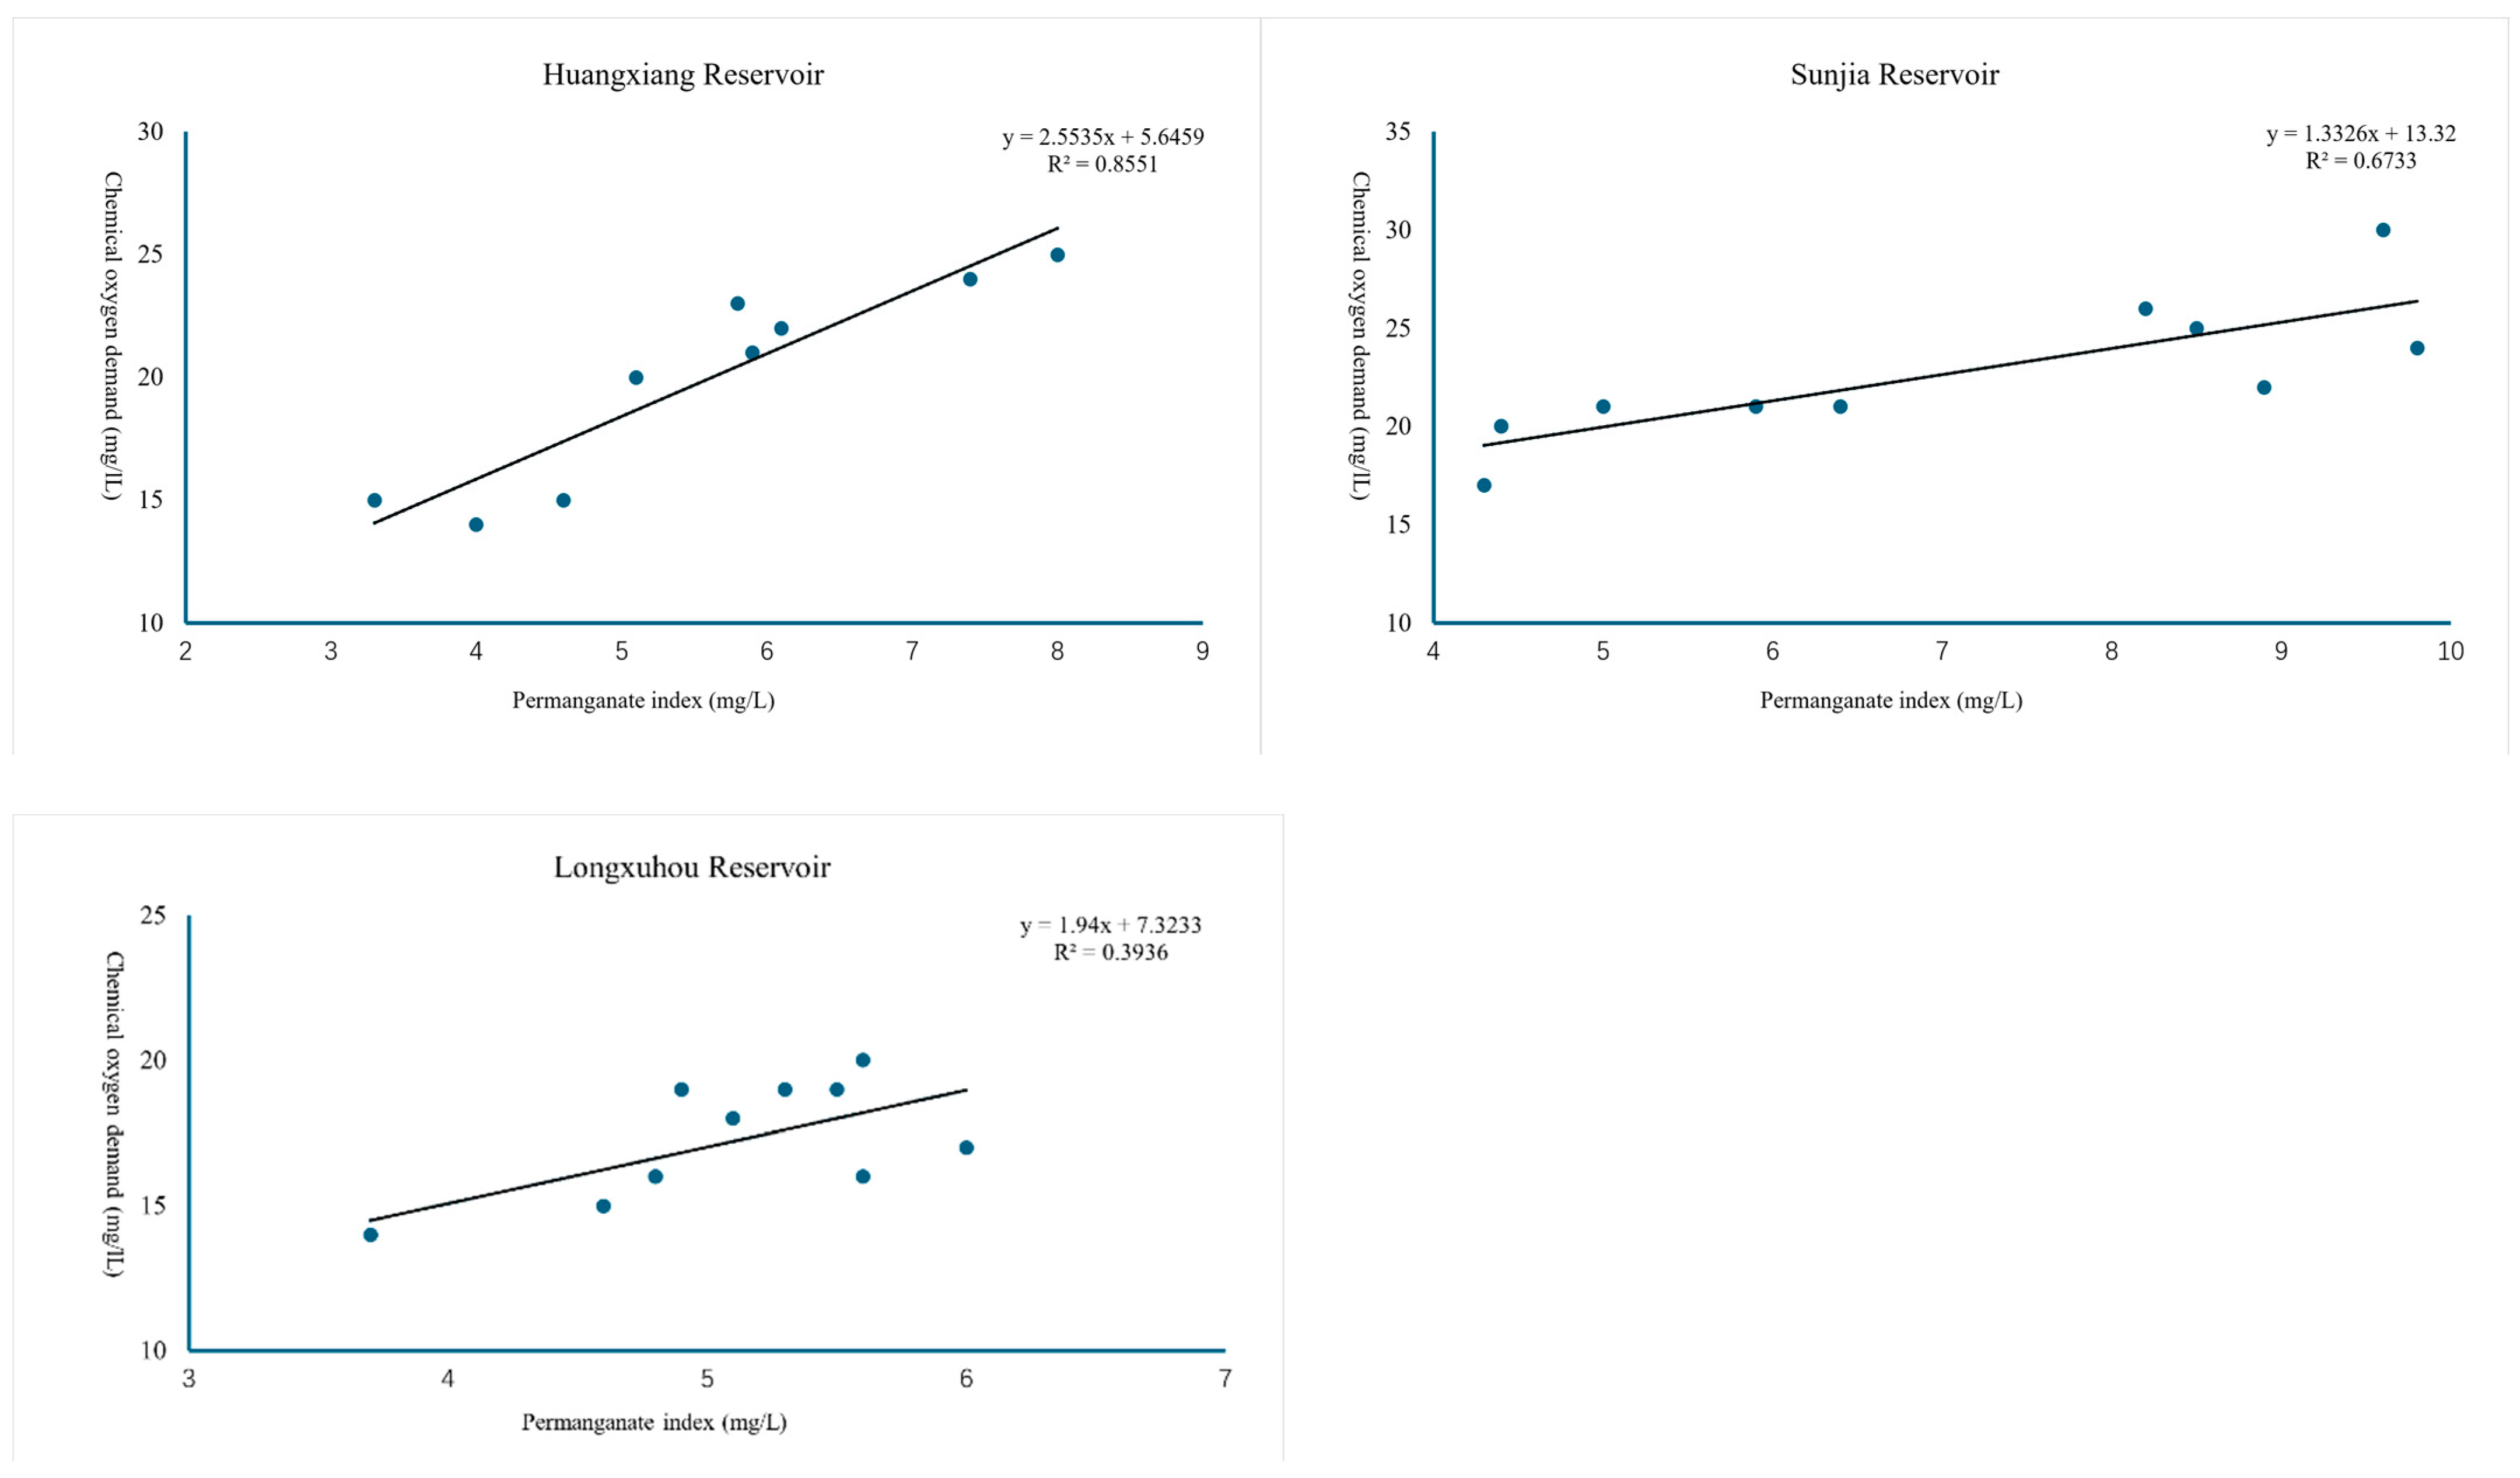
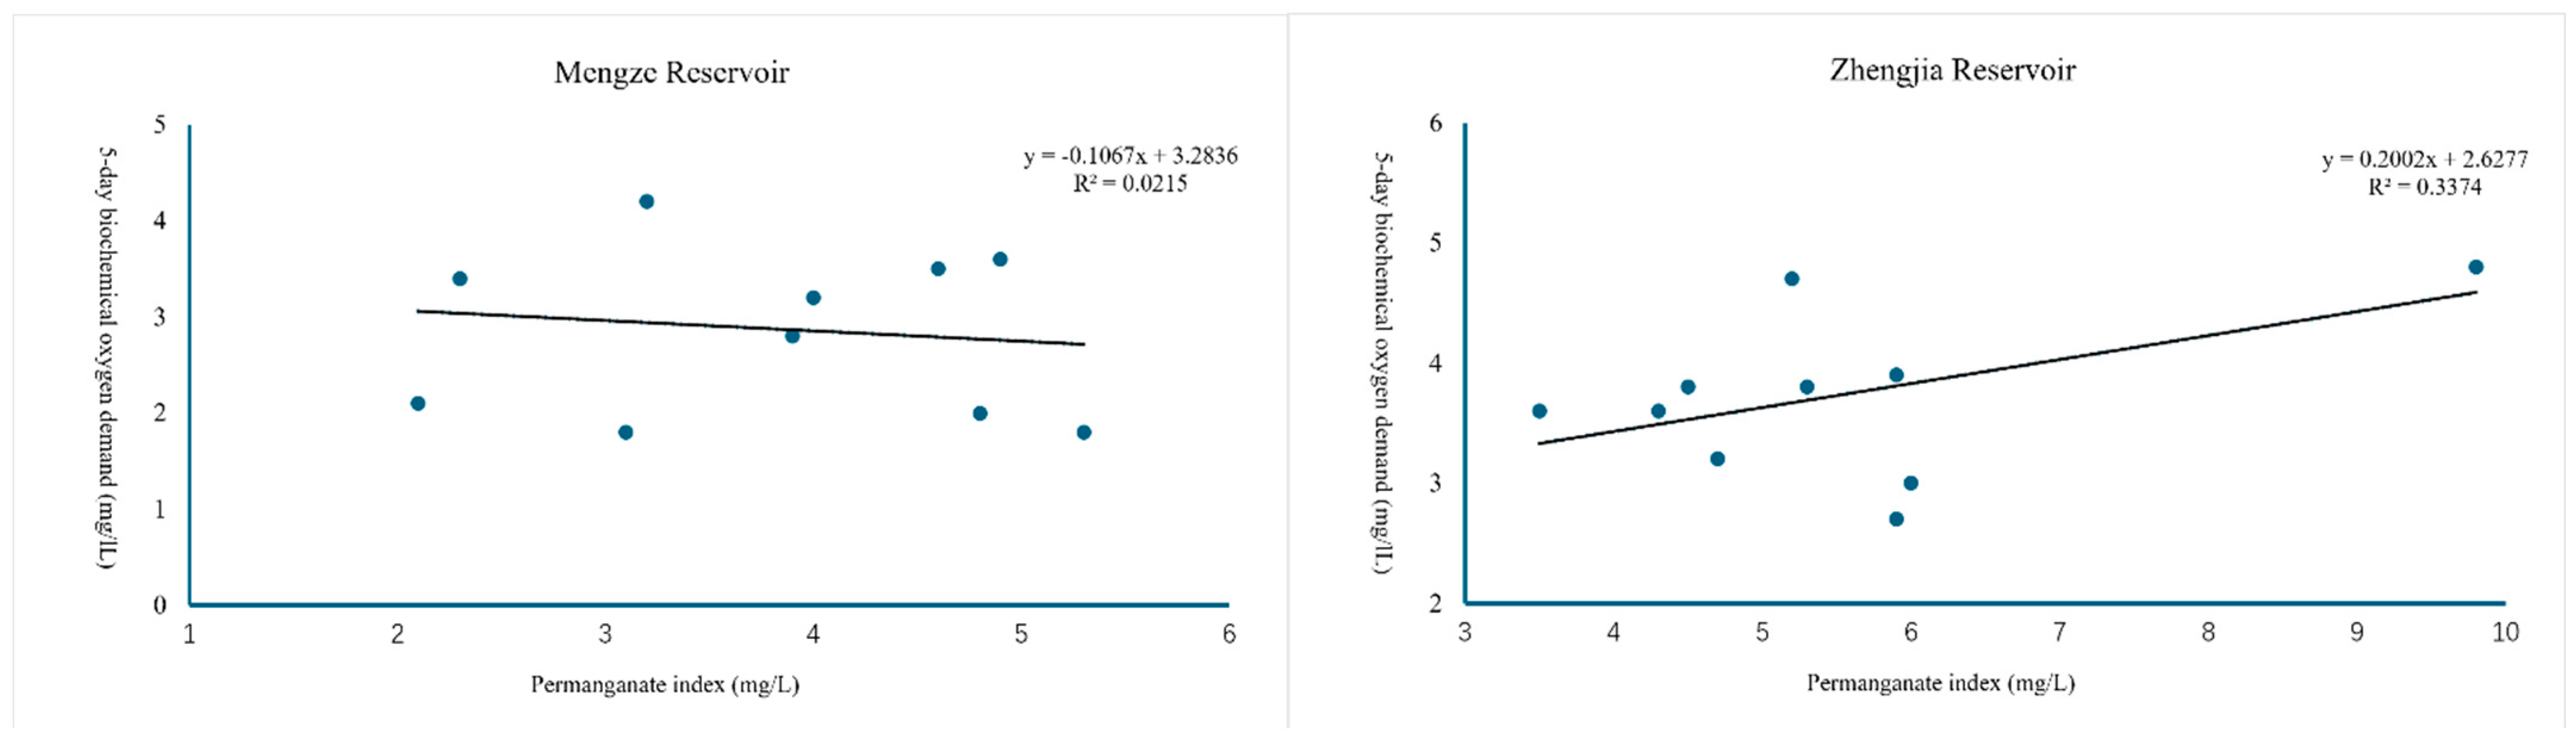
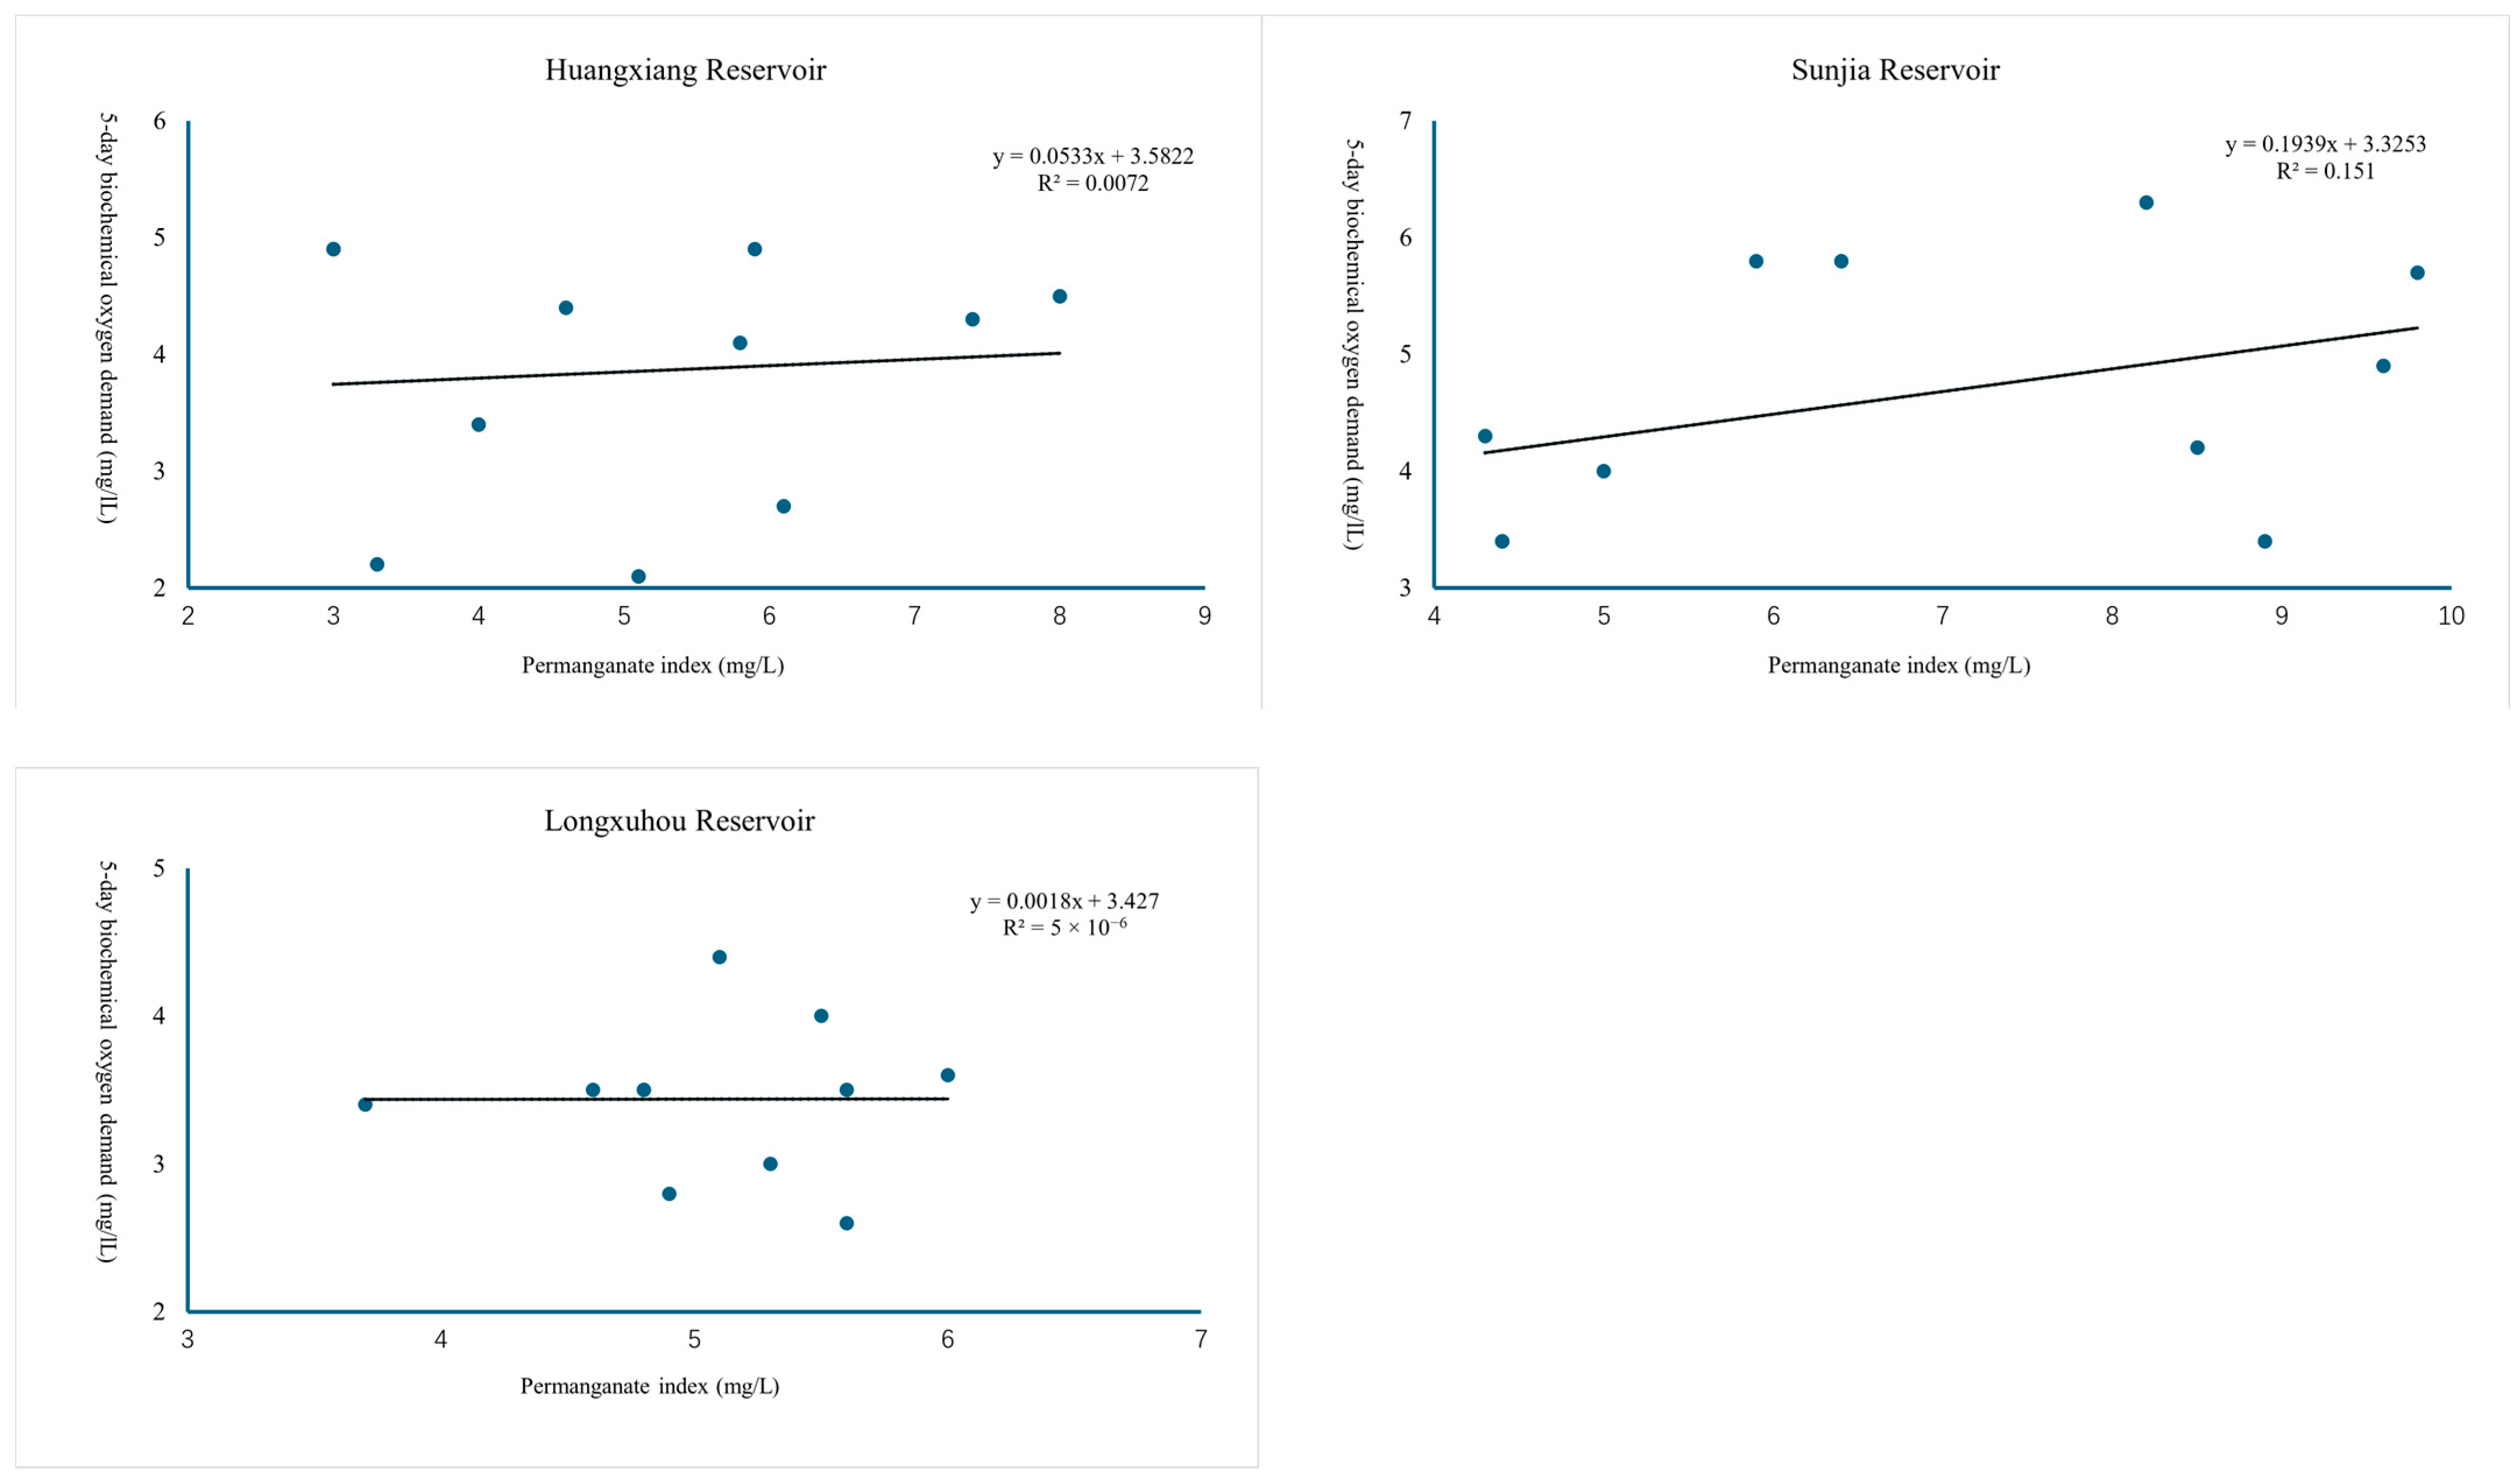
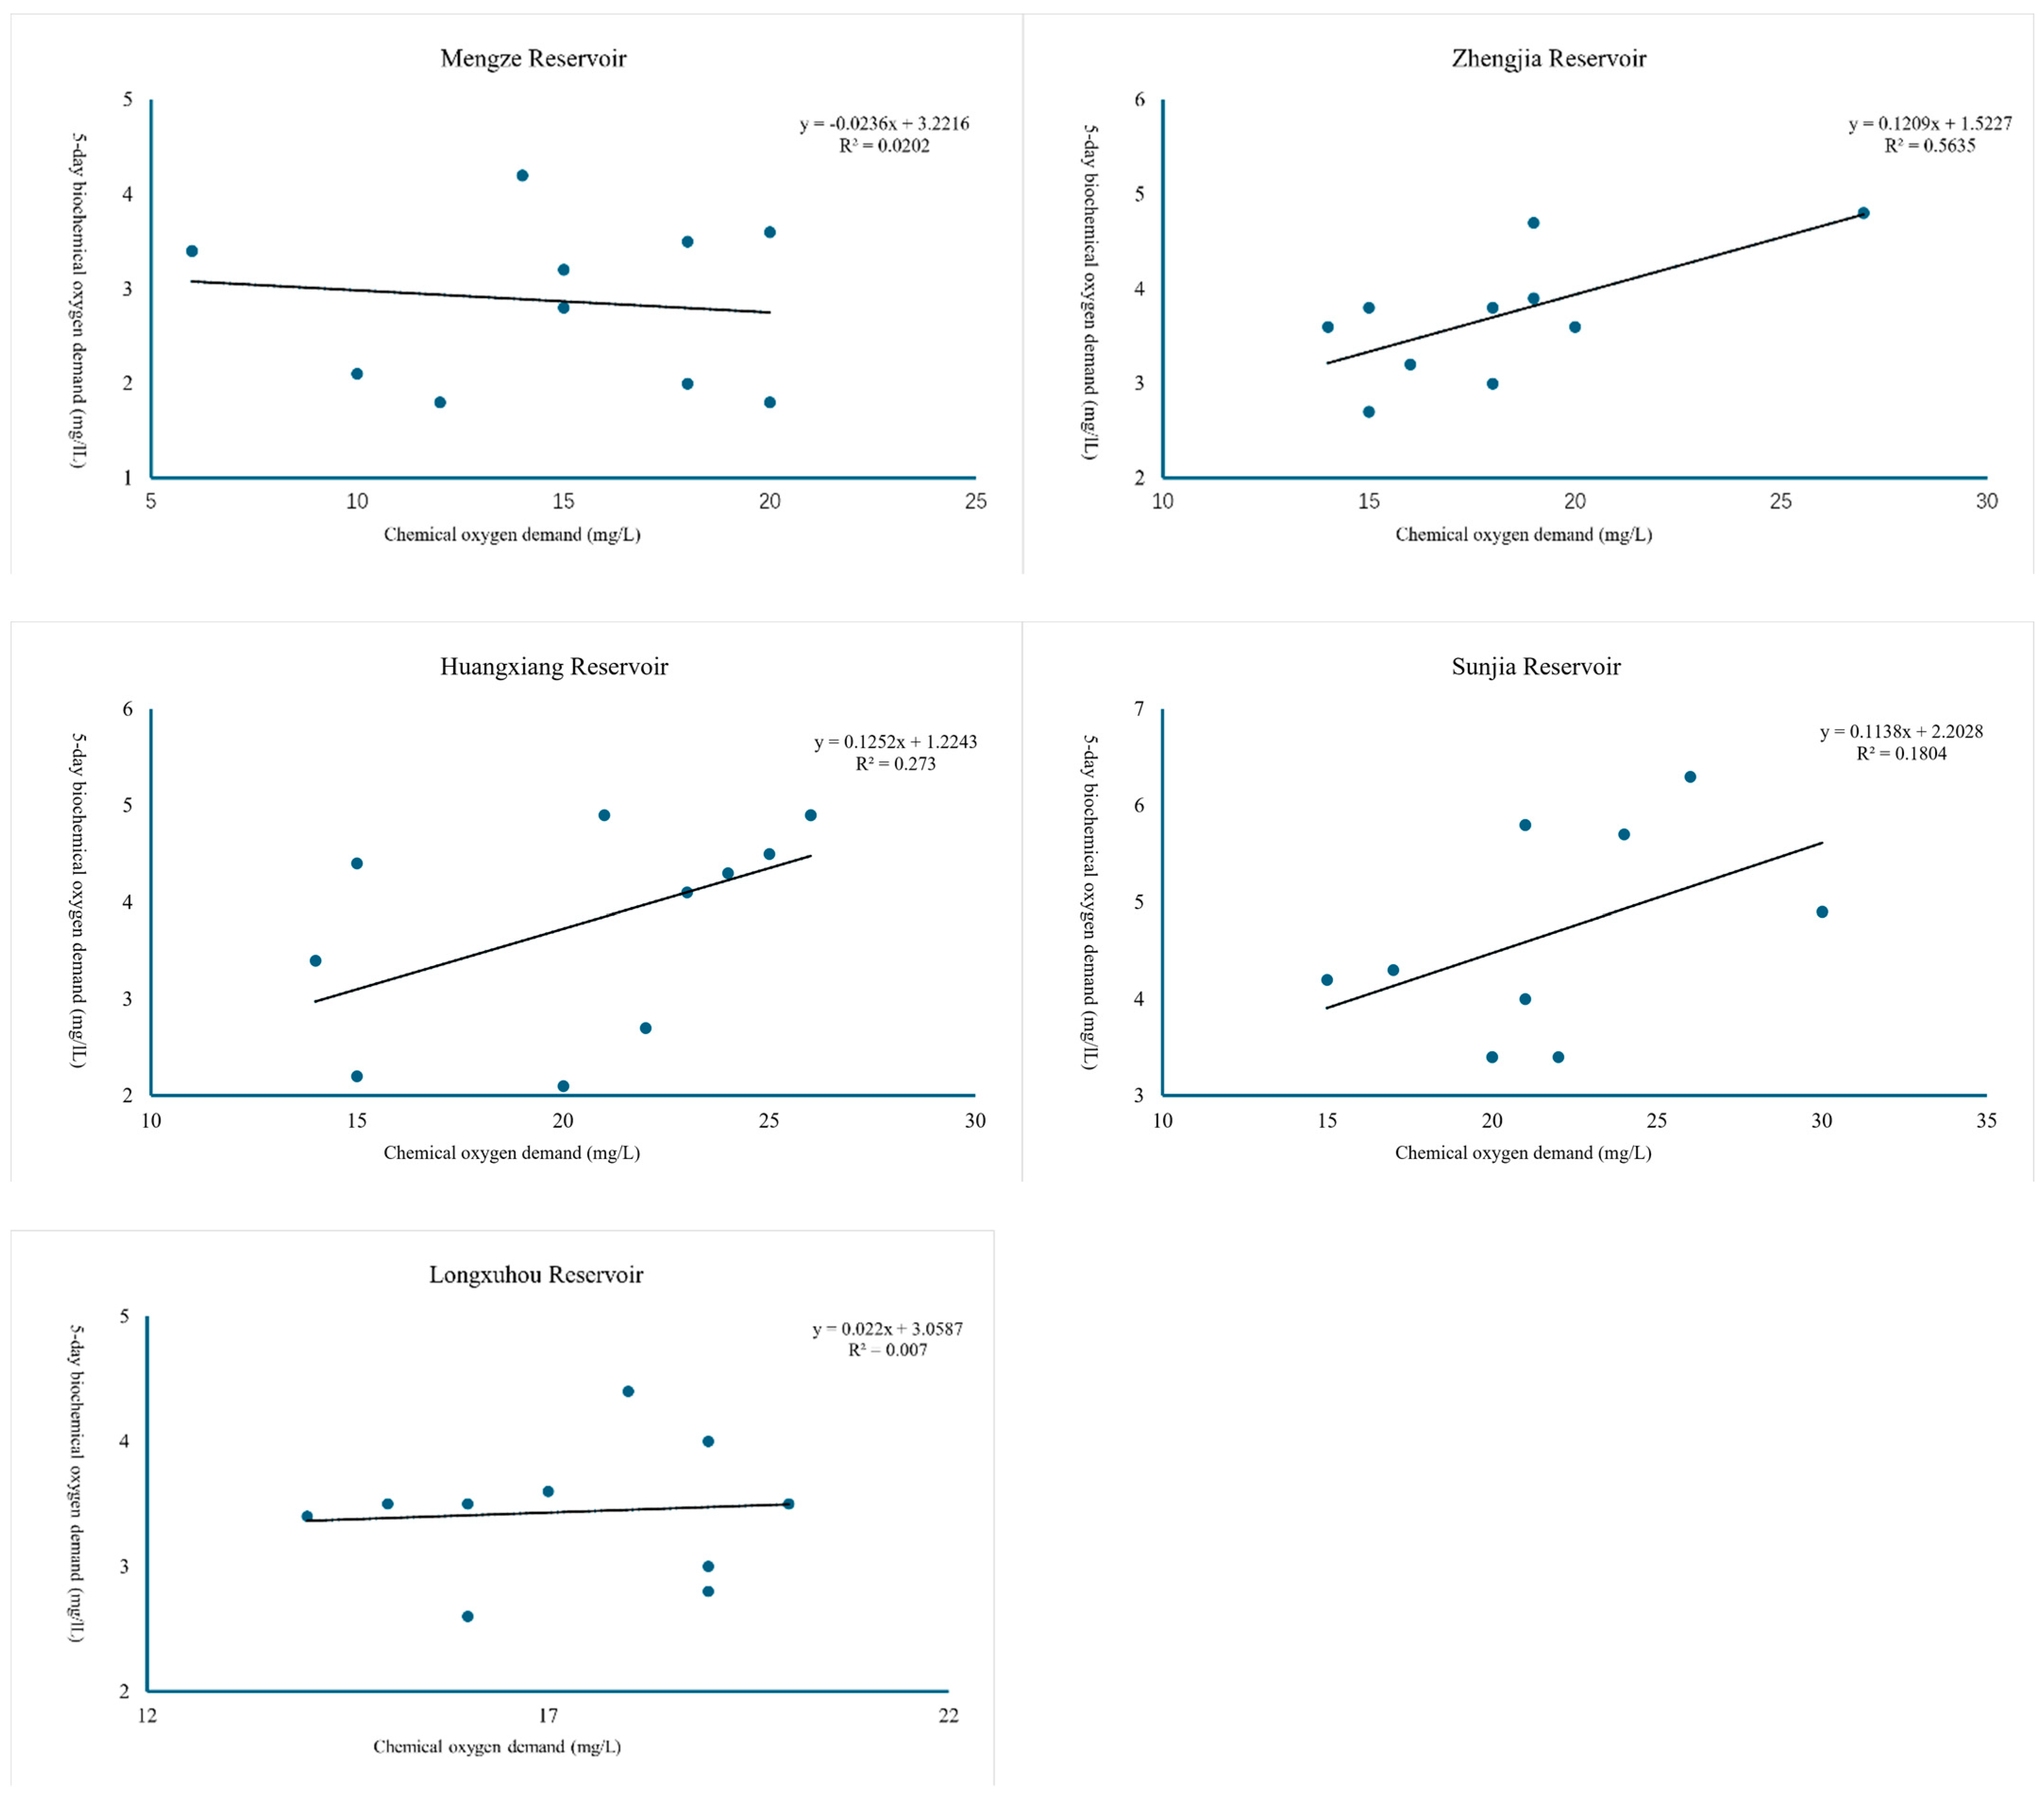
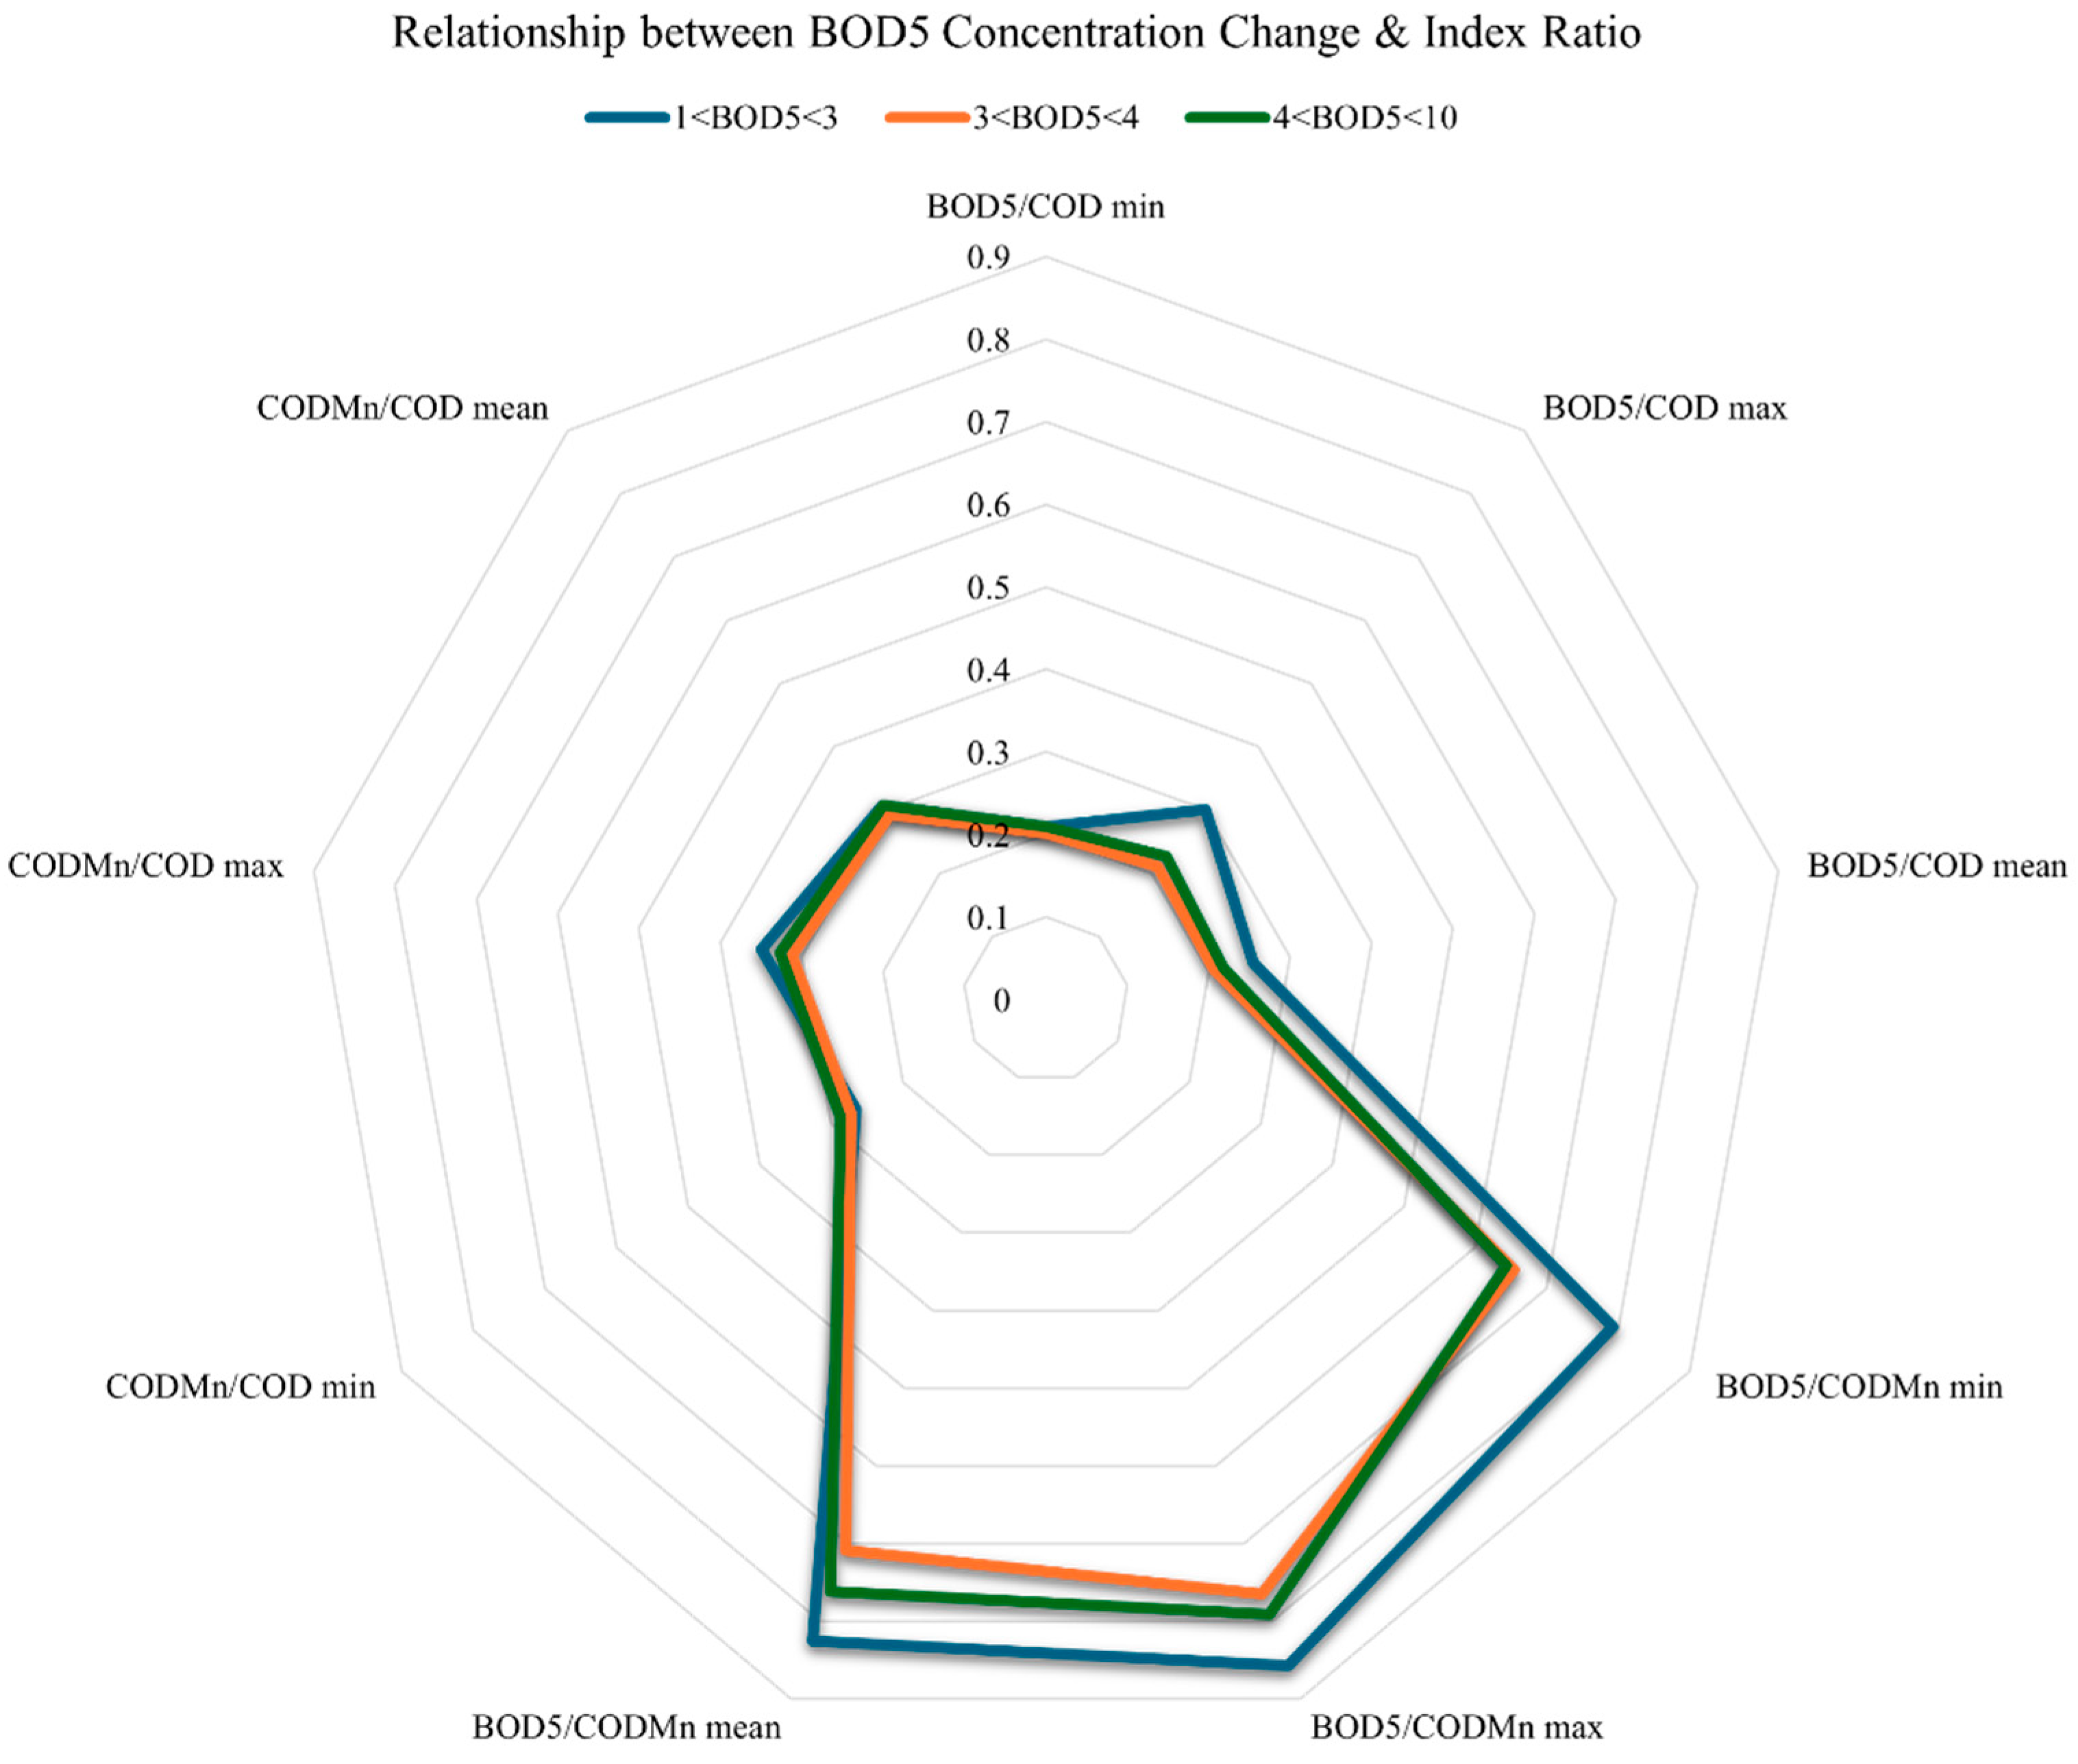
3.1. Correlation Outcome Statistics of BOD5, COD, and CODMn

By testing the correlation significance of the regression equations of the five-day biochemical oxygen demand (BOD5), permanganate index (CODMn), and chemical oxygen demand (COD) across five reservoir sections in Yunmeng County, and analyzing the correlation coefficient of monitoring index data, it was concluded that there is a significant correlation between the permanganate index, five-day biochemical oxygen demand, and chemical oxygen demand of surface water in this area. By referring to the maximum, minimum, and average values of the indicator concentrations for 11 consecutive months (Table 4), the changes in the correlation ratios of the two indicators were analyzed to obtain the correlation [31,32].
These results highlight the importance of incorporating correlation analysis in predictive water quality models. By tracking relationships between key parameters over time, environmental authorities could gain insight into which relationships are evolving to drive emerging pollution risks. This study demonstrates that such an approach could be used for the management of reservoirs with different pollution profiles and other ecological characteristics.
As shown in Figure 5, according to the classification of surface water quality [33,34], the five-day BOD concentration is divided into three ranges: 1 ≤ BOD5 < 3 mg/L, 3 ≤ BOD5 < 4 mg/L, and 4 ≤ BOD5 ≤ 10 mg/L. Within these ranges, the ratio of five-day BOD to chemical oxygen demand (BOD5/COD) and the ratio of BOD5 to the permanganate index (BOD5/CODMn) showed a significant positive correlation with changes in the five-day BOD concentration.
As the concentration of five-day BOD increased [35], the ratios BOD5/COD, BOD5/CODMn, and CODMn/COD changed accordingly. With the increase in BOD concentration, the minimum, maximum, and average values of BOD5/COD decreased initially and then increased.
Similarly, the minimum and maximum values of BOD5/CODMn showed a decreasing trend. However, when the five-day BOD concentration transitioned from greater than 1 mg/L and less than 3 mg/L to greater than 3 mg/L and less than 4 mg/L, the mean value of BOD5/CODMn decreased. The mean value of BOD5/CODMn then increased slowly until the five-day BOD concentration changed from more than 3 mg/L and less than 4 mg/L to more than 4 mg/L and less than 10 mg/L.
The minimum value of CODMn/COD showed an increasing trend with the increase in the five-day BOD concentration. However, when the five-day BOD concentration transitioned from greater than 1 mg/L and less than 3 mg/L to greater than 3 mg/L and less than 4 mg/L, both the maximum and average values of CODMn/COD exhibited a downward trend. The maximum and mean values of CODMn/COD then increased slowly until the five-day BOD concentration changed from more than 3 mg/L and less than 4 mg/L to more than 4 mg/L and less than 10 mg/L.

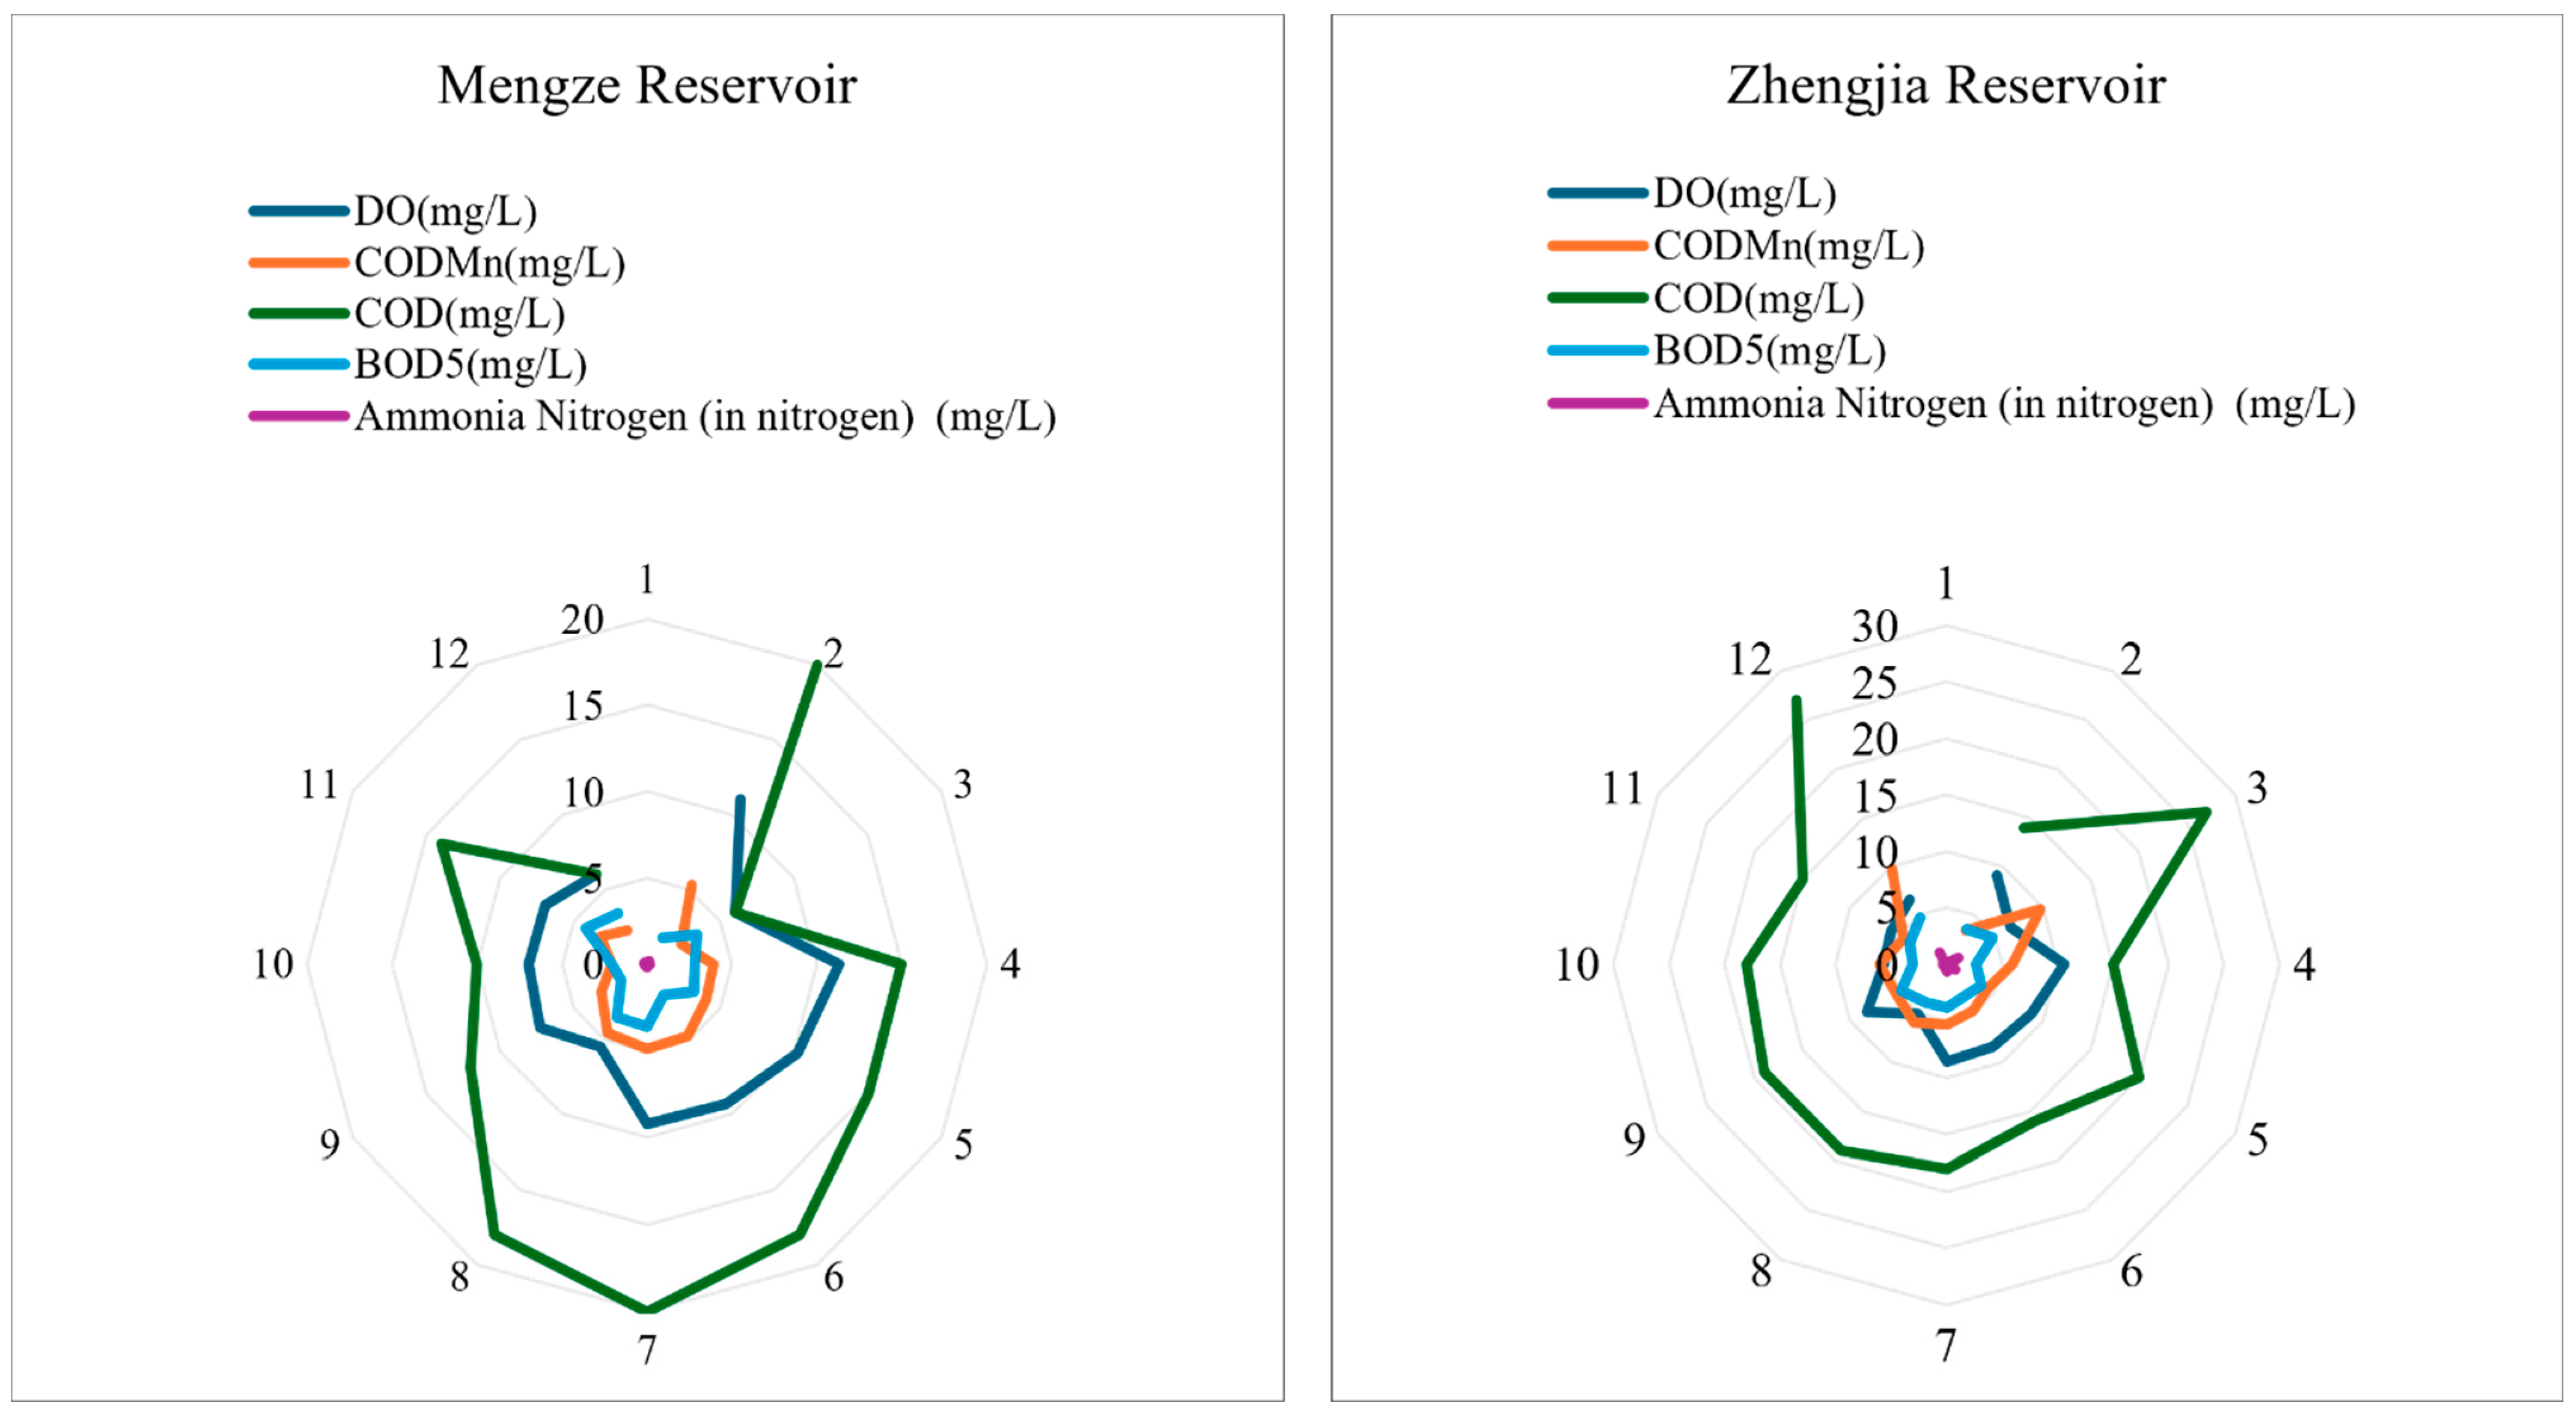
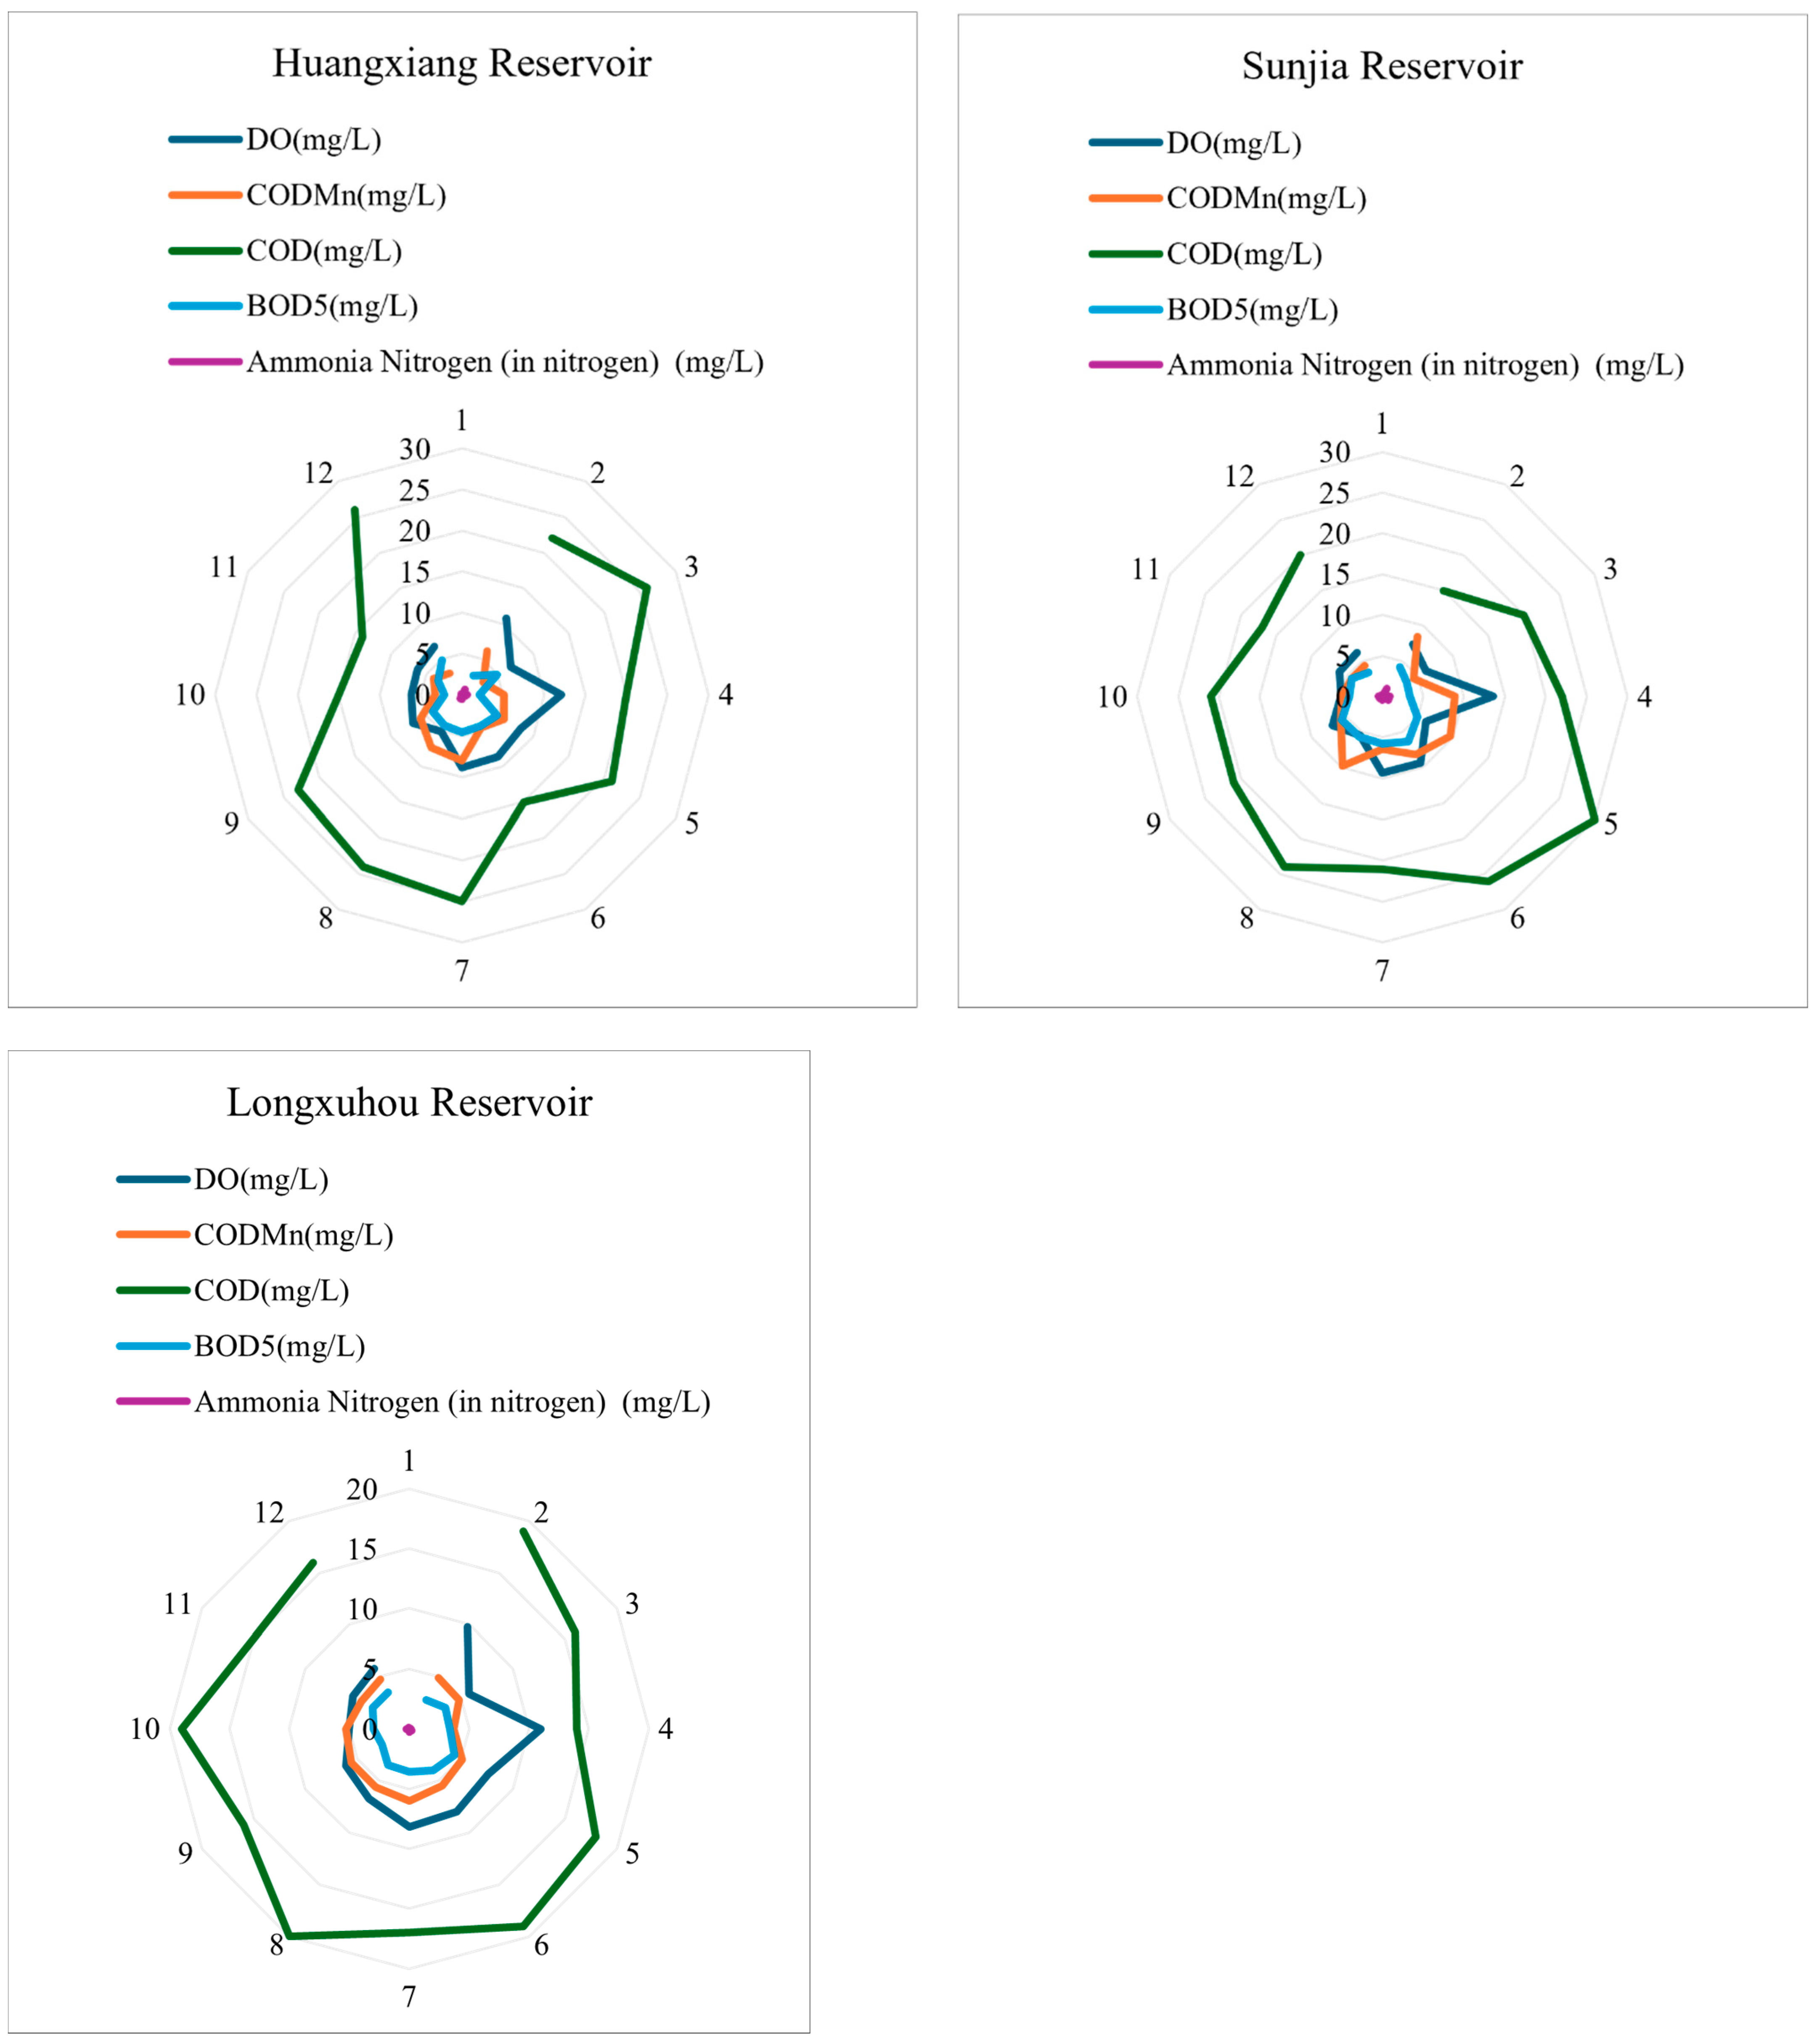
3.2. Statistics Results of DO, BOD5, COD, CODMn, and NH3-H

The test data for dissolved oxygen, permanganate index, chemical oxygen demand, biochemical oxygen demand, and ammonia nitrogen in the five reservoirs over 11 months were compiled, as shown in Figure 6. Our results show that regular analysis of ammonia nitrogen as well as its correlation with dissolved oxygen is crucial for managing water quality.
Chemical oxygen demand > permanganate index > five-day biochemical oxygen demand in the five reservoirs.
From the statistical results of the Zhengjia Reservoir, it is evident that ammonia nitrogen is negatively correlated with dissolved oxygen: higher ammonia nitrogen content corresponds to lower dissolved oxygen content in the water. This is likely because ammonia nitrogen is primarily produced via the decomposition of nitrogen-containing organic matter in water through microbial action. In the process of microbial action, oxygen in the water will be consumed. Thus, higher ammonia nitrogen content leads to greater oxygen consumption and lower dissolved oxygen levels.
The five-day BOD of the Mengze Reservoir, Zhengjia Reservoir, Huangxiang Reservoir, and Longxuhou Reservoir was also negatively correlated with dissolved oxygen. This is because biochemical oxygen demand reflects the amount of oxygen consumed by microbial oxidation and decomposition after organic matter enters the water body. The more organic matter microorganisms decompose, the more oxygen is consumed, resulting in lower dissolved oxygen levels in the water.
The permanganate index closely follows the trend of the chemical oxygen demand line because the permanganate index reflects a part of the chemical oxygen demand. In stable water bodies, this proportion generally remains unchanged in the short term.

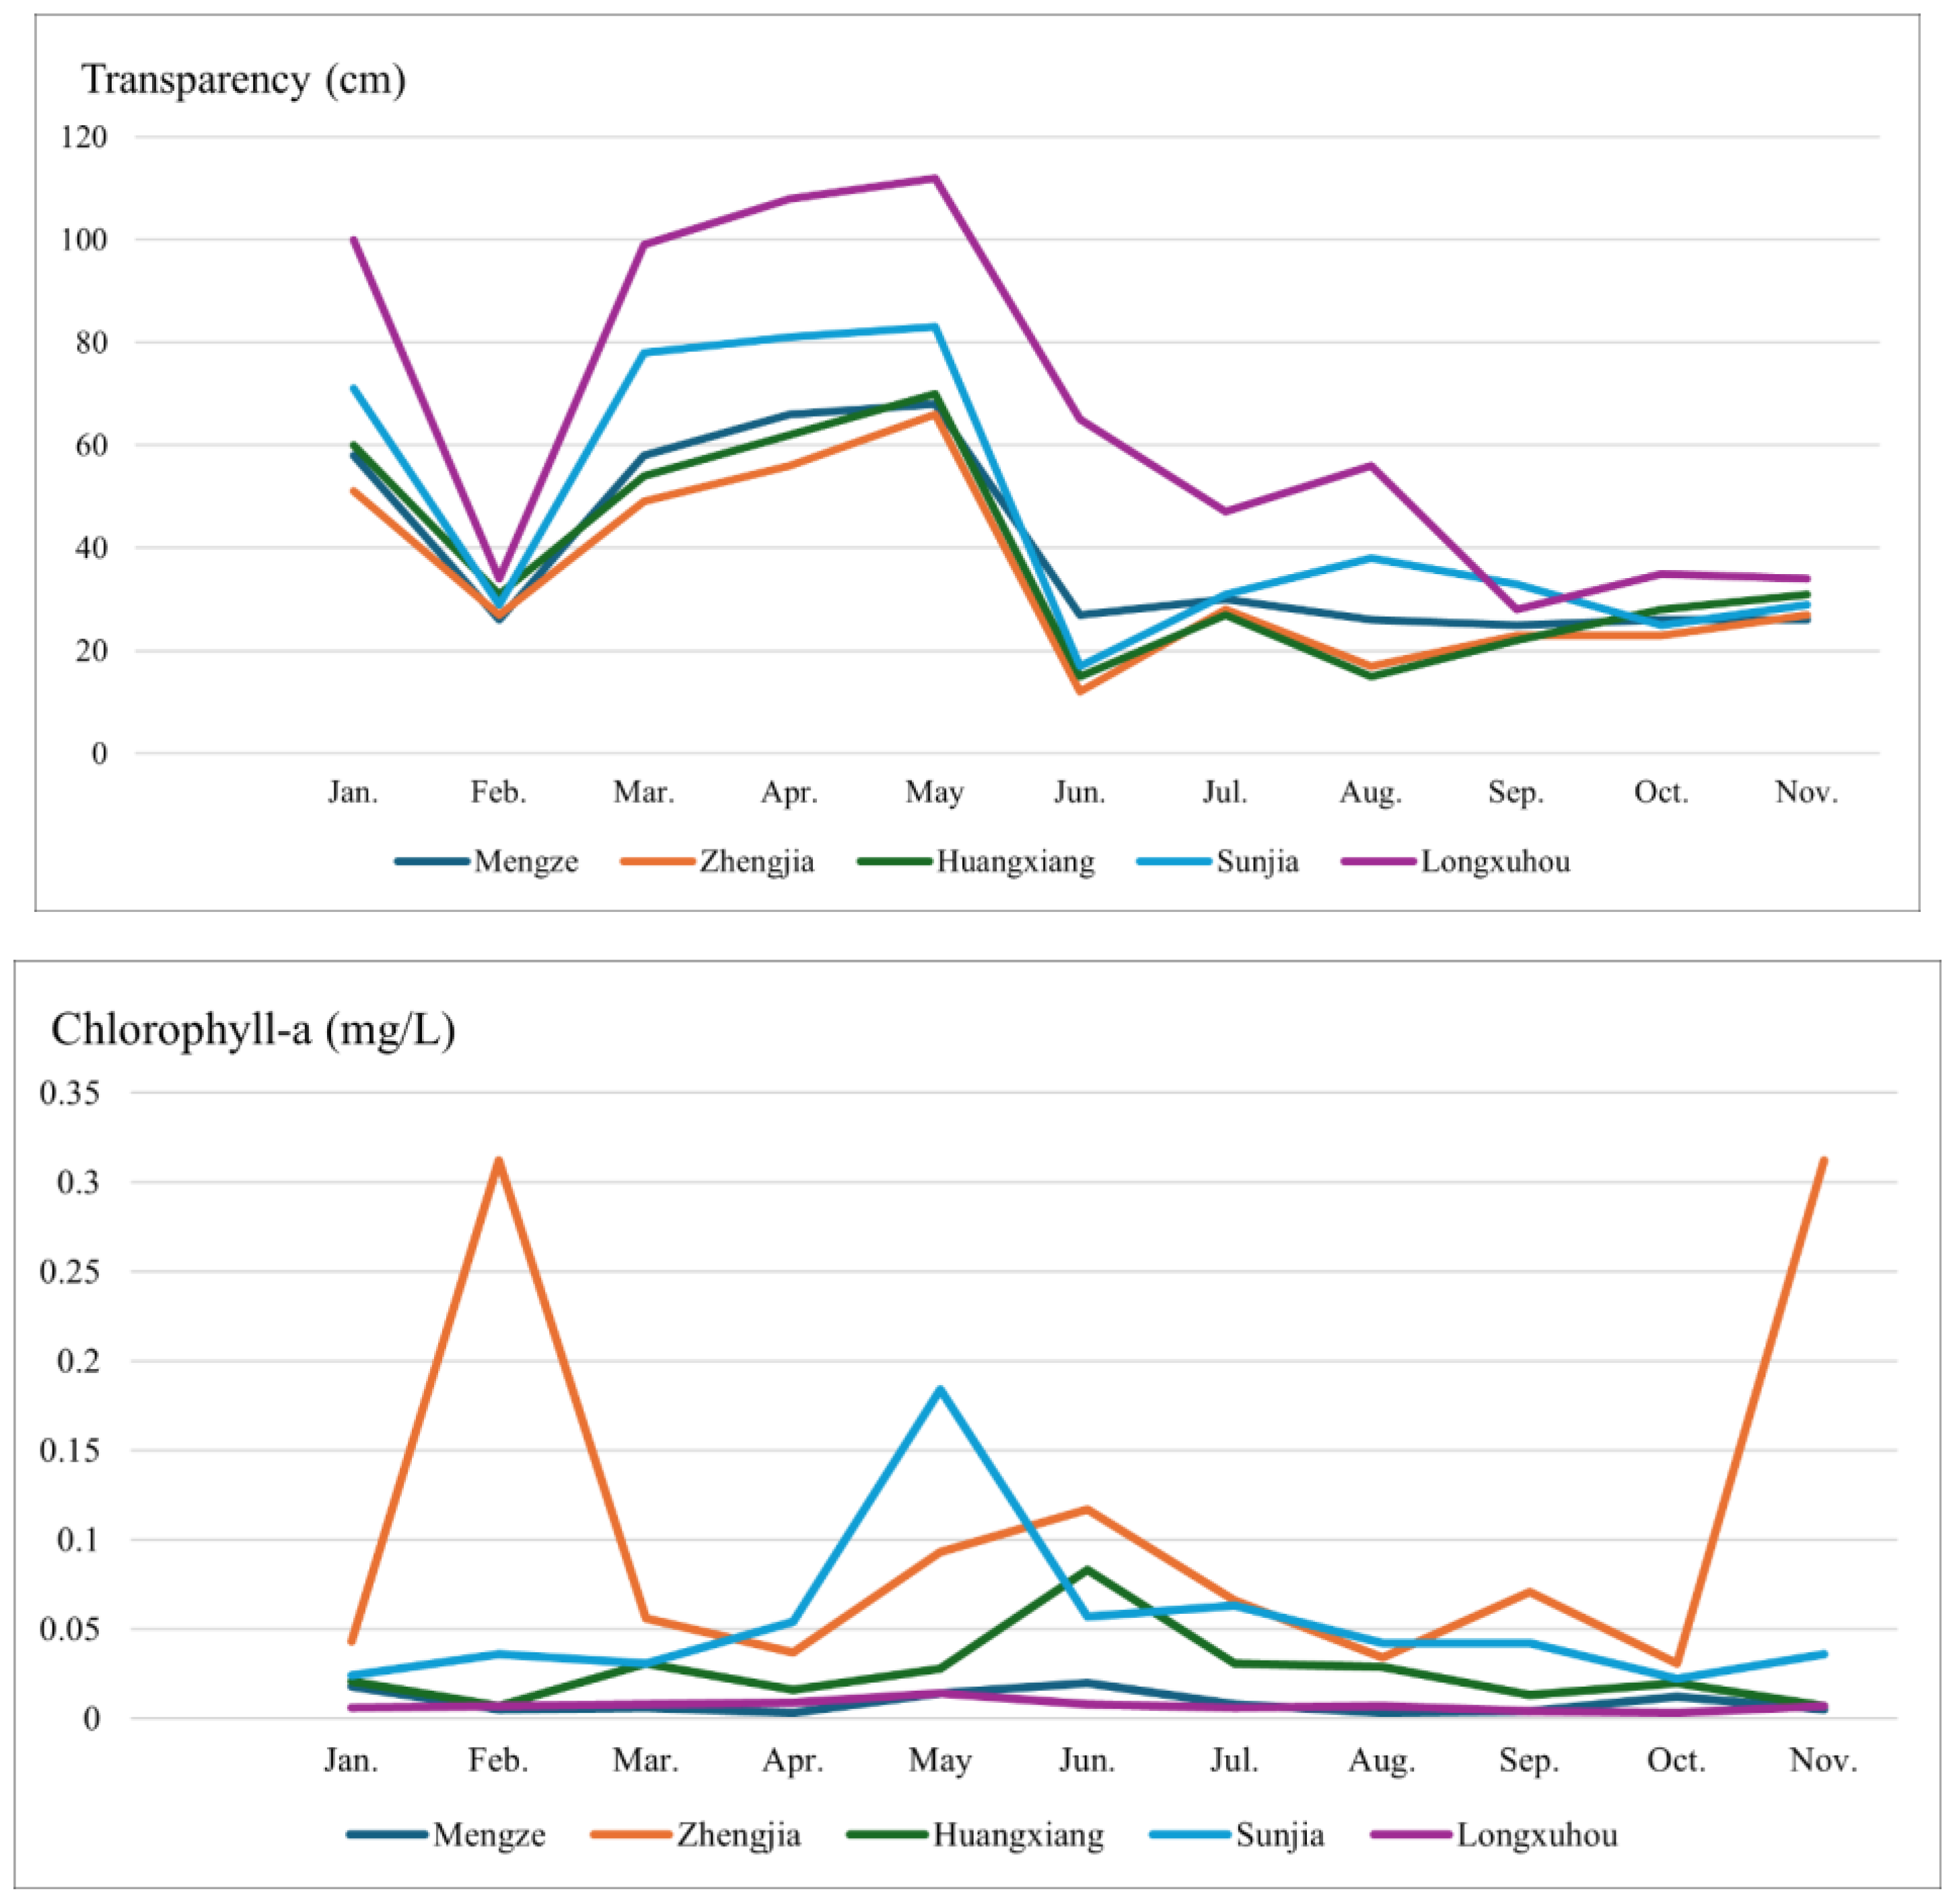
3.3. Analysis of Water Temperature, Chlorophyll-a, Transparency, and Turbidity Dynamics in the Reservoirs

Based on 11 months of water quality monitoring data (Figure 7), the temporal and spatial distributions of reservoir transparency [36] and the correlation between water temperature [37], chlorophyll-a [38], and turbidity [39] across Yunmeng County’s five reservoirs were analyzed and summarized. The results showed that the reservoirs with few aquatic plants and poor water quality exhibited lower transparency compared to reservoirs with more aquatic plants and better water quality. Water transparency was significantly negatively correlated with chlorophyll-a, turbidity, dissolved oxygen, and permanganate index [40]. During the dry season or periods of high temperatures, reservoir water levels may drop; however, this issue can be effectively mitigated through ecological water replenishment and similar measures. Our findings suggest that regular monitoring of ammonia nitrogen, particularly its correlation with dissolved oxygen, is important for water quality control.

4. Conclusions, Recommendations, and Research Limitations

From January to November 2022, water quality monitoring data were collected from five reservoirs in Yunmeng County. The results revealed significant relationships between several key water quality parameters, including dissolved oxygen (DO), permanganate index (CODMn), chemical oxygen demand (COD), five-day biochemical oxygen demand (BOD5), and ammonia nitrogen (NH3-N). Specifically, ammonia nitrogen was found to be negatively correlated with dissolved oxygen; higher ammonia nitrogen concentrations corresponded to lower levels of dissolved oxygen. Similarly, BOD5 also showed a negative correlation with DO. Additionally, the trends in the permanganate index and COD were observed to follow similar patterns.
These results highlight the importance of correlation analysis in understanding reservoir water quality dynamics. However, regular analysis of these interrelationships can help in designing predictive models in water quality management, thus enabling authorities to proactively manage environmental risks.
To establish robust predictive frameworks, it is suggested that relevant environmental authorities in Yunmeng County incorporate these findings into regular water quality monitoring. Such models can help formulate targeted interventions based on regional monitoring data.
The method and results of this study are also relevant for environmental assessment in similar regions. Local data can be compared to existing correlations, allowing local authorities to improve water quality assessments and improve decision-making. So, not only does this approach support informed and effective water management efforts, but it also reinforces ecological and environmental protection efforts.

Research Limitations

One limitation of this study involves the absence of vertical thermal-oxygen profiling, which could provide additional insights into stratification effects on water quality. While this research focuses on surface water sampling to analyze the temporal dynamics of chemical and biological indicators, future studies could incorporate thermal-oxygen profiles to explore vertical variations and their implications for water quality management. Another limitation of this study is that meteorological factors, such as wind and sunshine, which are essential for the dynamical study of hydrodynamic mechanics at the bottom of the reservoir, were not considered due to resource constraints. The investigation was directed focused on water quality parameters directly related to pollution dynamics and ecosystem health. For future studies, it will be important to incorporate meteorological data and advanced modeling approaches to study the interplays between meteorological drivers, hydrodynamics, and water quality in these ecosystems. Finally, sediment resuspension and internal feed can also affect the reservoir water quality. While this study does not directly address these factors, it provides insight into parameters affecting water quality and highlights the need to account for these variables in future work.

Author Contributions

Conceptualization, J.D.; formal analysis, J.D.; funding acquisition, P.X.; investigation, J.D., P.X. and X.W.; methodology, J.D. and X.Y.; software, J.D.; supervision, X.Y., P.W. and Q.Y.; validation, J.D., X.Y., X.W. and Q.W.; visualization, J.D., D.W. and Q.W.; writing—original draft, J.D., X.Y. and P.X.; writing—review and editing, J.D. and A.R. All authors have read and agreed to the published version of the manuscript.

Funding

This research was funded by the Science and Technology Project of the Hubei Geological Bureau (grant no. KJ2023-30); Educational Science Planning Project of the Education Department of Hubei Province (grant no. 2024GB086); and Crossing Research Project of Hubei Land Resources Vocational College (grant no. HX2024ZX05, HX2024ZX12, HX2024ZX13).

Data Availability Statement

The data presented in this study are available on request from the corresponding author. The data are not publicly available due to organizational policies and data use restrictions.

Acknowledgments

The authors would like to thank the Resources and Environment Investigation Institute of the Yejin Geological Brigade and the Eighth Geological Brigade of the Hubei Geological Bureau for their assistance in the survey and sampling for this project, respectively. The authors also extend their gratitude to the laboratory of the Sixth Geological Brigade of the Hubei Geological Bureau for assisting with the water quality testing for this project.

Conflicts of Interest

The authors declare no conflicts of interest.

References

  1. Wang, Z.; Chu, X.; Chen, Y. Spatial and temporal distribution of dissolved oxygen in surface water environment of megacities. J. East China Norm. Univ. Nat. Sci. Ed. 2020, 6, 154–163. [Google Scholar]
  2. Guo, W. Variation of dissolved oxygen with depth in Dudang Reservoir. Straits Sci. 2012, 6, 27–28. [Google Scholar]
  3. Chen, H.; Yan, L. Variation characteristics of dissolved oxygen and its correlation with water temperature in Changtan Reservoir, Zhejiang Province. Bull. Sci. Technol. 2015, 31, 249–253. [Google Scholar]
  4. Jane, S.F.; Hansen, G.J.A.; Kraemer, B.M.; Leavitt, P.R.; Mincer, J.L.; North, R.L.; Pilla, R.M.; Stetler, J.T.; Williamson, C.E.; Woolway, R.I.; et al. Widespread deoxygenation of temperate lakes. Nature 2021, 594, 66–70. [Google Scholar] [CrossRef] [PubMed]
  5. Lin, P.; Klump, J.V.; Guo, L. Dynamics of dissolved and particulate phosphorus influenced by seasonal hypoxia in Green Bay, Lake Michigan. Sci. Total Environ. 2016, 541, 1070–1082. [Google Scholar] [CrossRef]
  6. Cotner, J.B.; Anderson, N.J.; Osburn, C. Accumulation of recalcitrant dissolved organic matter in aerobic aquatic systems. Limnol. Oceanogr. Lett. 2022, 7, 401–409. [Google Scholar] [CrossRef]
  7. Gao, H.; Xie, Y.; Hashim, S.; Akhtar Khan, A.; Wang, X.; Xu, H. Application of Microbial Technology Used in Bioremediation of Urban Polluted River: A Case Study of Chengnan River, China. Water 2018, 10, 643. [Google Scholar] [CrossRef]
  8. Wang, C.; Zhai, W.; Shan, B. Oxygen microprofile in the prepared sediments and its implication for the sediment oxygen consuming process in a heavily polluted river of China. Environ. Sci. Pollut. Res. 2016, 23, 8634–8643. [Google Scholar] [CrossRef] [PubMed]
  9. Wu, Y.; Lin, H.; Yin, W.; Shao, S.; Lv, S.; Hu, Y. Water Quality and Microbial Community Changes in an Urban River after Micro-Nano Bubble Technology in Situ Treatment. Water 2019, 11, 66. [Google Scholar] [CrossRef]
  10. Zhao, J.; Zhao, X.; Chao, L.; Zhang, W.; You, T.; Zhang, J. Diversity change of microbial communities responding to zinc and arsenic pollution in a river of northeastern China. J. Zhejiang Univ. Sci. B 2014, 15, 670–680. [Google Scholar] [CrossRef]
  11. Li, G.; Wang, D. Biochemical oxygen demand (BOD) determination methods. China Environ. Monit. 2004, 20, 54–57. [Google Scholar]
  12. Zhang, J.; Cui, J.; Liu, H. Progress in determination of Biochemical oxygen demand (BOD5). Hebei Chem. Ind. 2006, 1, 12–15. [Google Scholar]
  13. Zhang, P. Application of inoculated fluid to five-day biochemical oxygen demand detection. Environ. Res. Monit. 2008, 21, 23–26. [Google Scholar]
  14. Hong, T.T.K.; Viet, L.H.; Giao, N.T. Analysis of Spatial-Temporal Variations of Surface Water Quality in the Southern Province of Vietnamese Mekong Delta Using Multivariate Statistical Analysis. J. Ecol. Eng. 2022, 23, 1–9. [Google Scholar] [CrossRef]
  15. Phung, D.; Huang, C.; Rutherford, S.; Dwirahmadi, F.; Chu, C.; Wang, X.; Nguyen, M.; Nguyen, N.H.; Do, C.M.; Nguyen, T.H.; et al. Temporal and spatial assessment of river surface water quality using multivariate statistical techniques: A study in Can Tho City, a Mekong Delta area, Vietnam. Environ. Monit. Assess. 2015, 187, 229. [Google Scholar] [CrossRef]
  16. Sun, Y.; Ren, F.; Liu, J.; Shi, N.; Wang, H.; You, X. Evaluation of Wastewater Pollution and Treatment Efficiencies in China During Urbanization Based on Dynamic Exogenous Variable Data Envelopment Analysis. Front. Environ. Sci. 2021, 9, 585718. [Google Scholar] [CrossRef]
  17. Zhou, Y.; Duan, N.; Wu, X.; Fang, H. COD Discharge Limits for Urban Wastewater Treatment Plants in China Based on Statistical Methods. Water 2018, 10, 777. [Google Scholar] [CrossRef]
  18. Jiang, H.; Hua, M.; Zhang, J.; Cheng, P.; Ye, Z.; Huang, M.; Jin, Q. Sustainability efficiency assessment of wastewater treatment plants in China: A data envelopment analysis based on cluster benchmarking. J. Clean. Prod. 2020, 244, 118729. [Google Scholar] [CrossRef]
  19. China, E.P.A. Editorial Committee of Monitoring and Analysis Methods of Water and Wastewater State Environmental Protection Administration. In Monitoring and Analysis Methods of Water and Wastewater; China Environmental Science Press: Beijing, China, 2002; pp. 227–235. [Google Scholar]
  20. Wang, H.; Zhu, R.; Zhang, J.; Ni, L.; Shen, H.; Xie, P. A Novel and Convenient Method for Early Warning of Algal Cell Density by Chlorophyll Fluorescence Parameters and Its Application in a Highland Lake. Front. Plant Sci. 2018, 9, 869. [Google Scholar] [CrossRef]
  21. Park, Y.-J.; Ruddick, K.; Lacroix, G. Detection of algal blooms in European waters based on satellite chlorophyll data from MERIS and MODIS. Int. J. Remote Sens. 2010, 31, 6567–6583. [Google Scholar] [CrossRef]
  22. Maguire, J.; Cusack, C.; Ruiz-Villarreal, M.; Silke, J.; McElligott, D.; Davidson, K. Applied simulations and integrated modelling for the understanding of toxic and harmful algal blooms (ASIMUTH): Integrated HAB forecast systems for Europe’s Atlantic Arc. Harmful Algae 2016, 53, 160–166. [Google Scholar] [CrossRef]
  23. Li, N.; Wei, Y.; Wang, L.; Zeng, C.; Ma, X.; Wu, H. Impact of industrialization on water protection in the Huai River Basin within Shandong Province, China. Nat. Hazards 2016, 81, 1193–1207. [Google Scholar] [CrossRef]
  24. Liang, X.; Pan, Z.; Wang, A. Determination of dissolved oxygen in water by iodometry. Chem. Anal. Metrol. 2021, 2, 75–77. [Google Scholar]
  25. Mu, Z.; Zhu, L. Influence of chloride ion on COD determination. Pollut. Control Technol. 2011, 24, 50–66. [Google Scholar]
  26. Wang, B.; Li, L.; Cheng, W. Correlation analysis of permanganate index, biochemical oxygen demand and chemical oxygen demand in surface water. Environ. Sci. Manag. 2016, 41, 134–147. [Google Scholar]
  27. Hou, Y.; Liang, D. Development and Implementation of Machining Technology; China Light Industry Press: Beijing, China, 2017. [Google Scholar]
  28. China Environmental Science Press. Water Quality Five-day Biochemical Oxygen Demand (BOD5) Determination Dilution and Inoculation Method; China Environmental Science Press: Beijing, China, 2009. [Google Scholar]
  29. Zhou, X.; Wu, Y. Health Standard for Smoke and Dust in Welding Workshops; National Group Standards Information Platform: Beijing, China, 2017. [Google Scholar]
  30. Wang, W.; Guo, Z.; Shang, W. Determination method of ammonia nitrogen in water. Water Sci. Eng. Technol. 2012, 3, 26–28. [Google Scholar]
  31. Rafiei, V.; Nejadhashemi, A.P.; Mushtaq, S.; Bailey, R.T.; An-Vo, D.A. Groundwater-surface water interactions at wetland interface: Advancement in catchment system modeling. Environ. Model. Softw. 2022, 152, 105407. [Google Scholar] [CrossRef]
  32. Zhu, S.; Zhang, F.; Kung, H.T.; Yushanjiang, A. Hydrogen and Oxygen Isotope Composition and Water Quality Evaluation for Different Water Bodies in the Ebinur Lake Watershed, Northwestern China. Water 2019, 11, 2067. [Google Scholar] [CrossRef]
  33. Han, Y.; Zhai, Y.; Guo, M.; Cao, X.; Lu, H.; Li, J.; Wang, S.; Yue, W. Hydrochemical and Isotopic Characterization of the Impact of Water Diversion on Water in Drainage Channels, Groundwater, and Lake Ulansuhai in China. Water 2021, 13, 3033. [Google Scholar] [CrossRef]
  34. Wang, G.; Shi, H.; Li, X.; Yan, J.; Miao, Q.; Li, Z.; Akae, T. A Study on Water and Salt Transport, and Balance Analysis in Sand Dune-Wasteland-Lake Systems of Hetao Oases, Upper Reaches of the Yellow River Basin. Water 2020, 12, 3454. [Google Scholar] [CrossRef]
  35. Yang, B.; Liu, J.; Jin, Q. Analysis and research on the correlation between Chemical oxygen Demand, permanganate index and Biochemical oxygen demand in China. In Environmental Engineering Technology Innovation and Application Sub-Forum, Proceedings of the 2019 Annual Science and Technology Conference of the Chinese Society of Environmental Sciences, Xi’an, China, 23–25 August 2019; Environmental Engineering Branch of Chinese Society of Environmental Sciences, Editorial Department of Environmental Engineering: Beijing, China, 2019; p. 4. [Google Scholar]
  36. Zhang, Y.; Qin, B.; Chen, W. Chlorophyll a and primary productivity of phytoplankton in Meiliang Bay, Taihu Lake. Chin. J. Appl. Ecol. 2004, 15, 2127–2131. [Google Scholar]
  37. Pan, J.; Xiong, F.; Li, W. Spatial and temporal variation of transparency and its influencing factors in Fuxian Lake, Yunnan Province. J. Lake Sci. 2008, 20, 681–686. [Google Scholar]
  38. Miao, C.; Gu, H.; Lou, C. Multiple regression analysis of water eutrophication factors in Beijing Zoo. Beijing Water Aff. 2012, 15, 27–31. [Google Scholar]
  39. Chen, D. Relationship between water transparency and eutrophication in Yudong Reservoir. Water Resour. Res. 2013, 34, 39–41. [Google Scholar]
  40. Tian, Z.-Q.; Tian, B.-H.; Xin, L.-H. Relationship between phytoplankton community structure and water quality factors in autumn in Yuqiao Reservoir. Environ. Pollut. Control 2011, 33, 64–68. [Google Scholar]
Figure 1. Sampling sites map of surface water of selected reservoirs. Satellite Imagery Source: Esri, ArcGIS Imagery.
Water 16 03600 g001
Figure 2. Correlation analysis of CODMn and COD.
Water 16 03600 g002aWater 16 03600 g002b
Figure 3. Correlation analysis of CODMn and BOD5.
Water 16 03600 g003aWater 16 03600 g003b
Figure 4. Correlation analysis of BOD5 and COD.
Water 16 03600 g004
Figure 5. The relationship between the BOD5 concentration change and index ratio among the five reservoirs.
Water 16 03600 g005
Figure 6. Result statistics chart of DO, COD, CODMn, BOD5, and NH3-H among the five reservoirs.
Water 16 03600 g006aWater 16 03600 g006b
Figure 7. Result statistics chart of water temperature, transparency, chlorophyll-a, and turbidity in the five reservoirs.
Water 16 03600 g007aWater 16 03600 g007bWater 16 03600 g007c
Table 1. Characteristics of the selected reservoirs.
Reservoir NameGeographic LocationDetection NumberDepth at Which Water Samples Were Collected
MengzeE 113°41′12.72″, N 31°1′20.30″S22900010.35 m
ZhengjiaE 113°40′8.40″, N 31°1′0.83″S22900020.42 m
HuangxiangE 113°45′50.50″, N 31°14′6.37″S22900030.38 m
SunjiaE 113°47′1.65″, N 31°31′31″S22900040.39 m
LongxuhouE 113°50′17.86″, N 31°0′24.75″S22900050.40 m
Table 2. Analytical methods for BOD5, COD, and CODMn in surface water.
Monitoring IndexStandard MethodStandard Number
BOD5Water quality–determination of BOD5–dilution and inoculation methodHJ 505-2009 [8]
CODWater quality–determination of COD–rapid digestion spectrophotometric methodHJ/T 399-2007 [9,10]
CODMnWater quality–determination of CODMnGB/T 11892-1989 [11]
Table 3. Correlation analysis of linear regression among the five reservoirs.
Correlation IndexReservoir NameLinear RelationR-Value
COD-CODMnMengze y = 4.1779x − 1.38220.9537
Zhengjiay = 1.9186x + 7.58390.8965
Huangxiangy = 2.5535x + 5.64590.9247
Sunjiay = 0.9901x + 14.7590.5315
Longxuhouy = 1.94x + 7.32330.6274
BOD5-CODMnMengzey = −0.1067x + 3.28360.1466
Zhengjiay = 0.2002x + 2.62770.5809
Huangxiangy = 0.0533x + 3.58220.0849
Sunjiay = 0.1939x + 3.32530.3886
Longxuhouy = 0.0018x + 3.4270.0022
COD-BOD5Mengze y = −0.0236x + 3.22160.1421
Zhengjiay = 0.1209x + 1.52270.7507
Huangxiangy = 0.1252x + 1.22430.5225
Sunjiay = 0.1138x + 2.20280.4247
Longxuhouy = 0.022x + 3.05870.0837
Table 4. The maximum, minimum, and mean values of BOD5, COD, and CODMn.
IndexMengzeZhengjiaHuangxiangSunjiaLongxuhou
BOD5max4.20004.80004.90006.30004.4000
min1.80002.70002.10003.40002.6000
mean2.90773.80003.80004.68463.4462
CODmax20.000027.000026.000030.000020.0000
min6.000014.000014.000015.000014.0000
mean13.846219.153820.846221.692317.1538
CODMnmax5.30009.80008.00009.80006.0000
min2.10003.50003.00004.30003.7000
mean3.68186.01545.16926.88465.0462
Disclaimer/Publisher’s Note: The statements, opinions and data contained in all publications are solely those of the individual author(s) and contributor(s) and not of MDPI and/or the editor(s). MDPI and/or the editor(s) disclaim responsibility for any injury to people or property resulting from any ideas, methods, instructions or products referred to in the content.

