Article

Hydrogeochemistry, Water Quality, and Health Risk Analysis of Phreatic Groundwater in the Urban Area of Yibin City, Southwestern China

1
Yibin Research Institute, Southwest Jiaotong University, Yibin 644000, China
2
Faculty of Geosciences and Environmental Engineering, Southwest Jiaotong University, Chengdu 611756, China
3
Sichuan Province Engineering Technology Research Center of Ecological Mitigation of Geohazards in Tibet Plateau Transportation Corridors, Chengdu 611756, China
4
State Key Laboratory of Nuclear Resources and Environment, East China University of Technology, Nanchang 330013, China
5
School of Chemical and Environmental Engineering, Sichuan University of Science & Engineering, Zigong 643000, China
6
Sichuan Communication Surveying & Design Institute Co., Ltd., Chengdu 610017, China
*
Author to whom correspondence should be addressed.
Water 2024, 16(24), 3599; https://doi.org/10.3390/w16243599
Submission received: 13 November 2024 / Revised: 10 December 2024 / Accepted: 11 December 2024 / Published: 13 December 2024
(This article belongs to the Section Wastewater Treatment and Reuse)

Abstract

:
With rapid urbanization, intensified agricultural activities, and industrialization, groundwater resources are increasingly threatened by pollution. Industrial wastewater discharge and the extensive use of agricultural fertilizers in particular, have had substantial impacts on groundwater quality. This study examines 18 groundwater samples collected from the main urban area of Yibin City to assess hydrochemical characteristics, spatial distribution, source attribution, water quality, and human health risks. Statistical analysis reveals significant exceedances in TDS, NO3, Mn, and As levels in groundwater, with elevated concentrations of B as well. Isotopic analysis identifies atmospheric rainfall as the primary recharge source for groundwater in the area, with water–rock interactions and limestone dissolution playing key roles in shaping its chemical composition. Applying the Entropy-Weighted Water Quality Index (EWQI) for a comprehensive water quality assessment, the study found that 94.44% of groundwater samples were rated as “good”, indicating relatively high overall water quality. Deterministic health risk assessments indicate that 72.22% of the groundwater samples have non-carcinogenic health risks below the threshold of 1, while 66.67% have carcinogenic health risks below 1.00 × 10⁻⁴. Monte Carlo simulations produced similar results, reinforcing the reliability of the health risk assessment. Although the study area’s groundwater quality is generally good, a significant human health risk persists, underscoring the need to ensure the safety of drinking and household water for local residents. This study provides a valuable reference for the rational management and remediation of groundwater resources.

1. Introduction

Groundwater is a critical freshwater resource for drinking water and agricultural irrigation, playing an indispensable role worldwide [1,2,3,4,5,6,7]. With the accelerated pace of industrialization and intensified human activities, groundwater resources face severe pollution threats, especially in regions with dense industrial operations and intensive agriculture [8,9,10]. Although groundwater has a natural resilience against external pollution, once contaminated, its self-repair capacity is limited, making remediation and effective management challenging [11,12]. Agricultural fertilizers [13], industrial wastewater [14], and urban pollution [15] are the main sources of groundwater contamination. As a major agricultural country, China has a long history of agricultural activities [16]. The extensive use of agricultural fertilizers has led to severe groundwater contamination with nitrates, boron, and fluorides [17]. Additionally, China has experienced rapid growth in mining and metallurgical activities in recent years. Waste containing arsenic and manganese from these processes can also contribute significantly to groundwater contamination [18,19].
When contaminated groundwater is used for daily activities and drinking, it can pose both carcinogenic and non-carcinogenic health risks to humans [20]. Long-term consumption of groundwater with elevated nitrate levels poses a serious health risk to infants, pregnant women, and adults. It may lead to various health issues, including methemoglobinemia, gastrointestinal cancers, thyroid dysfunction, and cardiovascular diseases [21]. Long-term consumption of groundwater with excessive boron levels significantly impacts children, pregnant women, and individuals with kidney dysfunction. It can lead to digestive system issues, kidney damage, neurological damage, and weight loss [22]. Excessive fluoride intake can significantly affect the development of teeth and bones, especially in children who are still in their growth stages [23]. High levels of manganese in groundwater can adversely affect the nervous system and cognitive function, posing heightened risks to children and sensitive populations [24]. High levels of arsenic in groundwater can lead to non-cancerous conditions such as neurological damage, cardiovascular diseases, and skin lesions, while also increasing the risk of cancers, including skin, lung, bladder, liver, and kidney cancer [25].
The water quality index (WQI) is built by hydrochemical parameters and presents a comprehensive overview of water quality for diverse suitability. Enormous indices have been proposed by experts to precisely evaluate the groundwater quality [26,27]. Unlike traditional indices, the entropy-weighted method stands out by minimizing the impact of subjective factors on assessment outcomes. The relative weights are calculated by applying a weighting approach based on information entropy, thereby improving the accuracy and scientific rigor of the evaluation [28,29]. Thus, the Entropy-Weighted Water Quality Index (EWQI) provides an objective perspective to reflect the overall condition of water bodies by integrating multiple quality parameters. The health risk assessment model developed by the U.S. Environmental Protection Agency (USEPA) has become a crucial tool in environmental pollution and health risk assessment. It is known for its systematic approach, comprehensiveness, flexibility, scientific rigor, and high applicability [30]. Additionally, this health risk assessment model is well suited for uncertainty and sensitivity analysis, further enhancing the accuracy and reliability of its evaluations [31]. Monte Carlo simulation is a widely used tool for uncertainty and sensitivity analysis, particularly effective for managing uncertainty in complex systems. It can accommodate random variations across multiple input parameters [32].
Yibin City is located in the Sichuan Basin in southwestern China, at the confluence of the Jinsha River, Min River, and Yangtze River. The area has a well-developed surface water system and abundant water resources. However, the study area has a long history of agricultural development [33,34], with not only a rich history of rice cultivation but also the cultivation of various other crops. In recent years, the brewing industry and the smart manufacturing sector have also seen significant growth in the area [35,36]. These factors may contribute to groundwater contamination from agricultural fertilizers and industrial wastewater. Therefore, understanding the chemical characteristics of groundwater and assessing its quality and health risks is essential for safeguarding the health of local residents. Limited research has been conducted in this region, so to address this gap, this study performs groundwater sampling and analysis to examine its chemical characteristics and evaluate water quality and health risks. Therefore, the objectives of this study are to: (1) analyze the hydrochemical characteristics through statistical analysis and hydrogeochemical analysis; (2) identify groundwater recharge sources and hydrochemical origins using stable isotopes; (3) assess groundwater quality using the Entropy-Weighted Water Quality Index (EWQI); (4) evaluate non-cancer and cancer health risks to human health using a deterministic health risk model; and (5) analyze the uncertainty and sensitivity of health risks through Monte Carlo simulation.
The research findings can offer valuable support and a basis for the sustainable use of groundwater resources in Yibin City, as well as aid in the prevention and management of groundwater pollution in similar regions.

2. Study Area

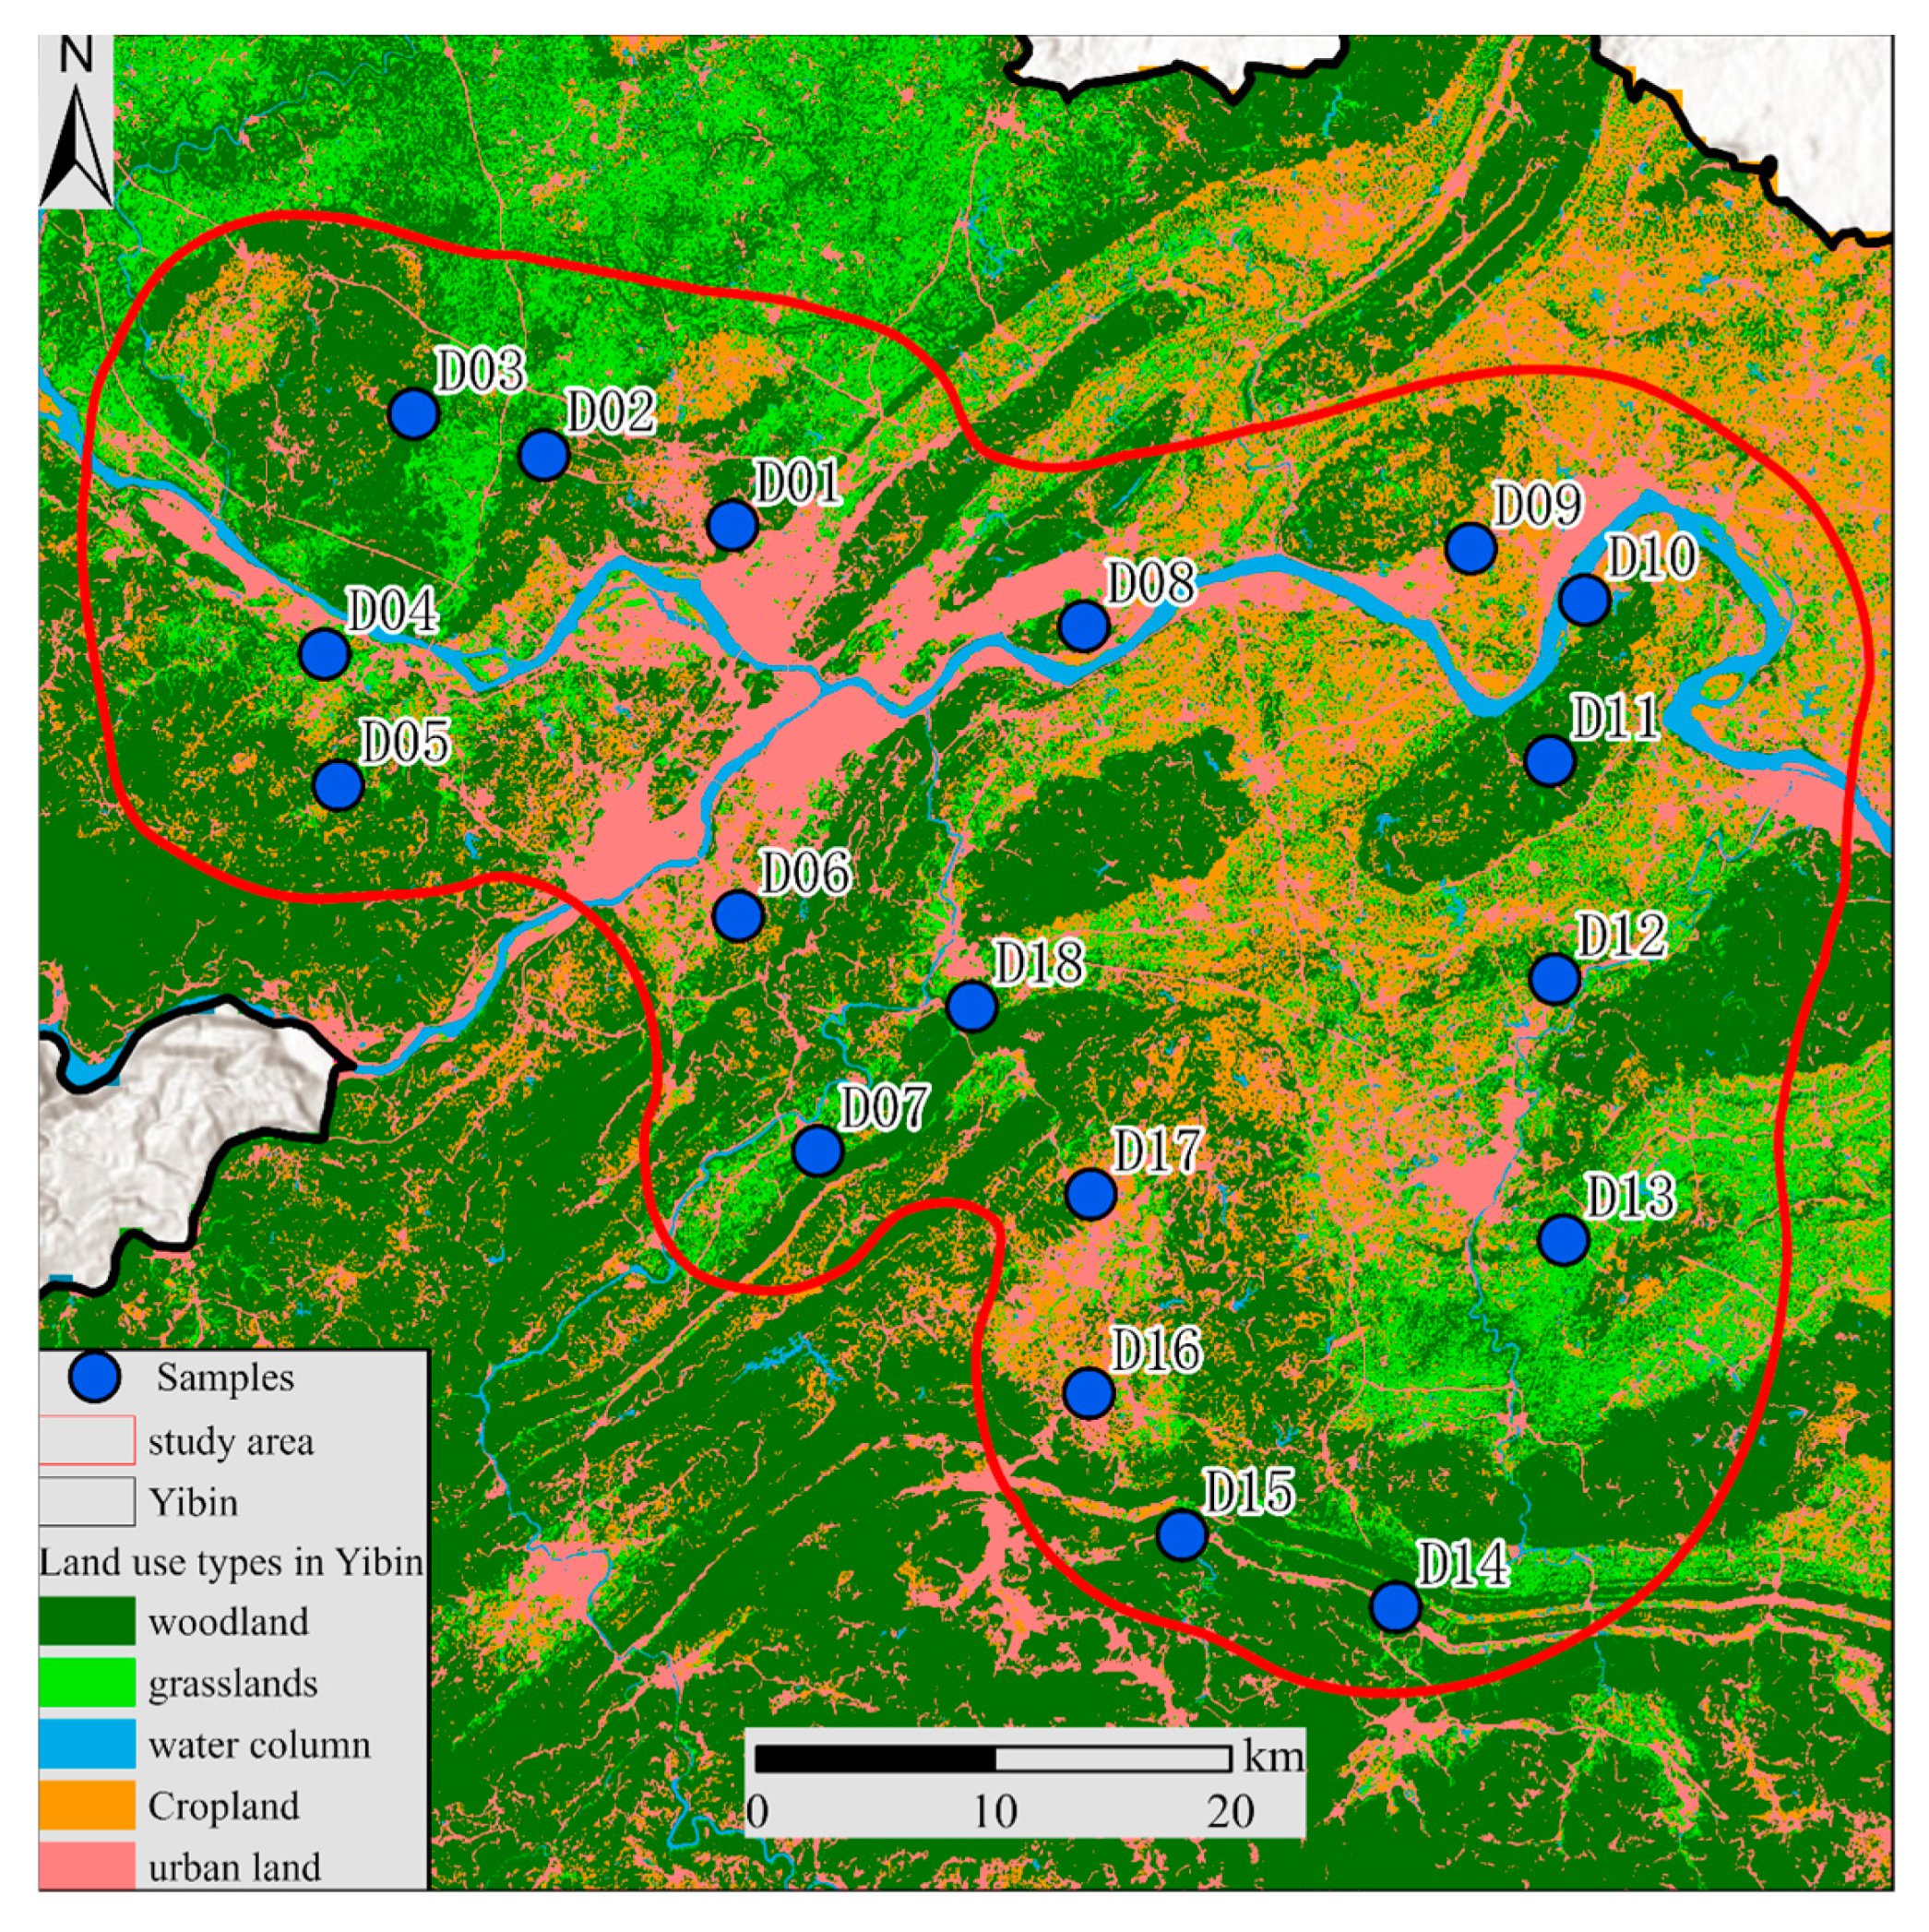
The study area is located at the southern edge of the Sichuan Basin in southern China, between longitudes 103°36′ to 105°20′ E and latitudes 27°50′ to 29°16′ N (Figure 1a,b). Yibin City has a diverse topography, featuring mountains, hills, basins, and plains. The western and southern regions are at higher elevations, primarily characterized by mountains and hills, while the eastern and northern regions are at lower elevations, predominantly consisting of plains and basins, mainly the Western Sichuan Plain. The study area is located at the confluence of three rivers, where the Jinsha River and Min River merge to form the Yangtze River, which traverses the northern part of the city (Figure 1c). Residential land in the study area is clearly linked to the distribution of water bodies in the study area, mainly around the Three Rivers, supplemented by other small tributaries, agricultural land is basically located on both sides of the Yangtze River, and some of the agricultural land is distributed around other water bodies, and the study area is characterized by high vegetation cover (Figure 2). The study area has a subtropical humid monsoon climate, with an annual average rainfall ranging from 1050 to 1618 mm. The rainy season occurs from May to October, accounting for 81.7% of the total annual precipitation. The average monthly minimum temperature occurs in January, at 3 °C, while the highest average temperature is recorded in August, reaching 36.6 °C.
The northern part of the study area is primarily composed of sandstones from the Lower Cretaceous Woshan Group and the Tianmashan Group. The western and eastern parts of the study area are primarily composed of mudstones and sandstones from the Upper Jurassic Penglaizhen Group, Suining Group, and the Lower Jurassic Shangshaximiao Subgroup and Xiashaximiao Subgroup. The central part of the study area contains limestone from the Upper Triassic Xujiahe Group, the Middle Triassic Leikoupo Group, and the Lower Triassic Jialingjiang Group and Feixianguan Group. The study area primarily belongs to the red bed strata of the Sichuan Basin, predominantly consisting of sandstones and mudstones from the Cretaceous and Jurassic periods.
The aquifers in this study area consist of Quaternary loose rock aquifer, Cretaceous sandstone aquifer, and Jurassic sandstone–mudstone aquifer, which corresponds to three types of groundwater: loose rock pore water, bedrock fracture water, and interstitial water in clastic rock pore-fracture systems [37]. Loose rock pore water is primarily found in the loose deposits and alluvial layers along the banks of rivers. Bedrock fracture water mainly consists of weathered zone fracture water, typically located on the sides of valleys or in sloped areas, with a maximum flow rate of 91.03 m3/d. The interstitial water in clastic rock pore-fracture systems is associated with the clastic rocks of the Xujiahe Group, with sandstones serving as the primary aquifer. The groundwater is predominantly recharged by atmospheric precipitation, followed by agricultural irrigation and surface water bodies. The runoff is primarily influenced by the topographic characteristics such as the local replenishment and proximity to excretion.

3. Materials and Methods

3.1. Data Sources

In April 2024, 18 groundwater samples (D1–D18) were collected within the main urban area of the study region. The samples were all sourced from karst groundwater within a carbonate aquifer. The sampling locations are shown in Figure 1. Prior to field sampling, the groundwater was pumped for more than half an hour to eliminate the negative influence of stagnant water, and then the sampling bottles were rinsed three times with distilled water. For cation analysis (Na⁺, K⁺, Ca2⁺, Mg2⁺), polyethylene plastic bottles were used, and nitric acid was added to the water samples to acidify them to a pH of less than 2 [38]. For anion analysis (Cl, SO42−, NO3, F), polyethylene plastic bottles were also used without any additional reagents. For sulfide analysis, brown glass bottles were selected, and 10 mL of zinc acetate solution (1.0 mol/L) and 1 mL of NaOH (1.0 mol/L) were added to make the water alkaline and to form a zinc sulfide precipitate. Furthermore, another two clear polyethylene plastic bottles were utilized to store the groundwater for an isotope test. After filling the sampling bottles, the bottle tops were sealed with wax. During the sampling process, a portable multi-parameter water quality meter (WTW and Multi 3620 IDS + Multi 3630 IDS, Water Technology and Environmental Services GmbH, Ölbronn-Dürrn, Germany) was used to measure parameters such as temperature, pH, TDS, and Do. The concentration of HCO3 was measured on-site using a titration kit (Merck, Darmstadt, Germany) with an accuracy of 0.1 mmol/L.
After the fieldwork was completed, the water samples were sent to Kehui Testing (Tianjin) Technology Co., Ltd, Tianjin, China. for comprehensive water quality analysis. The main anion components were tested using a spectrophotometer, while the primary cation components were analyzed using inductively coupled plasma mass spectrometry (ICP-MS, Jena PQ MS, Analytik Jena AG, Jena, Germany), inductively coupled plasma optical emission spectrometry (ICP-OES, Thermo Fisher ICAP 7200 Radial, Thermo Fisher Scientific, Waltham, MA, USA), and ion chromatography (ICS-2100). The charge balance error between the main cations and anions for all samples was less than ±5%. The isotopes δD, δ18O, and 87Sr/86Sr were also measured by Kehui Testing (Tianjin) Technology Co., Ltd. The δD and δ18O were determined using the Nu Perspective stable isotope mass spectrometer (Stable IRMS) from Nu Instruments (Cardiff, UK), with results reported relative to the Vienna Standard Mean Ocean Water (VSMOW) [15] using the traditional δ(‰) notation, and analytical precisions of ±1.0% and ±0.2%, respectively. The 87Sr/86Sr ratio was measured using a MAT262 solid mass spectrometer (Thermo Fisher Scientific, Waltham, MA, USA), with the strontium isotope standard being NBS987 [15] and a testing precision of ±0.01%.
In this study, Microsoft Excel 2019 (USA) software was used to model the hydrogeochemical process. The Python 3.11.4 (Netherlands) software was used to calculate the water quality indices and analysis the sensitivity of EWQI. The ArcGispro 3.0 (USA) software was used to make inverse distance weighted interpolation (IDW). The flowchart of the workflows in this study was illustrated in Figure 3.

3.2. Hydrogeochemical Characteristics Analysis

Isotope methods utilize stable isotopes such as δD and δ18O to trace water sources [39], while strontium (Sr) isotopes are particularly useful for reflecting the sources and intensity of water–rock interactions, as well as analyzing the contribution of rock weathering to water chemistry [40,41]. These methods are widely used in studies for identifying the sources of groundwater and surface water, assessing pollutant migration, and promoting the sustainable management of water resources.

3.3. Entropy-Weighted Water Quality Index (EWQI)

EWQI (Entropy-Weighted Water Quality Index) is a method for objectively evaluating regional water quality by integrating multiple water quality parameters. In this study, the entropy weight method is used to calculate the weights of different parameters in the EWQI computation process, enhancing its objectivity and accuracy to minimize the influence of human factors [42]. The calculation process is summarized as follows [43,44,45]:
  • Establish the initial evaluation index matrix. This matrix consolidates and presents the collected groundwater-related parameters. Let the number of sampling points be m and a certain evaluation variable be n; thus, the initial evaluation index matrix is denoted as X. In the evaluation index matrix, Xij represents the value of the j-th evaluation indicator for the i-th sampling point.
    X = x 11 x 12 x 1 n x 21 x 22 x 2 n x m 1 x m 2 x m n
  • Data normalization processing. Since the nature of each evaluation indicator varies and their magnitudes differ, it is necessary to normalize the data of each indicator to eliminate their units. Positive indicators are processed using Equation (2), while negative indicators are processed using Equation (3).
    y i j = x i j m i n ( x j ) max x j m i n ( x j )
    y i j = m a x ( x j ) x i j max x j m i n ( x j )
    where yij is the standardized value of the j-th indicator for the i-th sample, xij is the original value of the j-th indicator for the i-th sample, and max(xj) and min(xj) are the original maximum and minimum values of the corresponding indicator, respectively.
  • Determine the weights of each evaluation factor. If there are m samples to be evaluated in the study, and n (where n = 1~i) evaluation variables, then the entropy value of the j-th evaluation variable is denoted as wj.
    P i j = y i j + 10 4 i = 1 m y i j + 10 4
    e j = 1 l n m i = 1 m P i j l n P i j
    w j = 1 e j j = 1 n ( 1 e j )
    In this step, Pij represents the ratio of the indicator value in a specific column of the standardized evaluation index matrix to the sum of the values in that column. The additional term 10−4 is a correction parameter, aimed at preventing the formula from becoming meaningless when Pij equals 0, which could affect subsequent calculations.
  • Evaluation index calculation. The water quality ratio qij is calculated based on the concentration Cj of each parameter j and the corresponding permissible limit Sj. A separate calculation method is used for the pH value. Finally, the EWQI is derived by summing the weighted ratios of all parameters. Based on the calculated EWQI, groundwater can be classified into five categories: (1) Excellent (EWQI ≤ 50); (2) Good (50 < EWQI ≤ 100); (3) Moderate (100 < EWQI ≤ 150); (4) Poor (150 < EWQI ≤ 200); (5) Very Poor (EWQI > 200) [46].
    q j = C j S j × 100
    q p H p H 7 8.5 7 × 100       pH > 7 7 p H 7 6.5 × 100     pH < 7
    E W Q I = j = 1 n w j q i j
    where Sj is the permissible limit for parameter j based on China’s groundwater quality standards in this study ([7]).

3.4. Health Risk Assessment Model

The health risk assessment model proposed by the U.S. Environmental Protection Agency ([30]) has been widely used to analyze human health risks and has been broadly accepted in academia. The main routes of human exposure to groundwater contaminants are oral ingestion and dermal contact. Previous studies have shown that dermal contact is not a major source of human health risks [6,47,48]. This study divides the population into two groups based on age: children under 18 and adults aged 18 and above. The evaluation methods and calculation formulas are presented in Equations (10)–(14) as follows. Using Equation (10), the daily oral intake (CDI) was calculated based on the concentrations of harmful trace elements Cw, the intake rate IR, exposure frequency EF, body weight BW, and average exposure time AT. The non-cancer health risk hazard quotient (HQ) was calculated using Equation (11) and the reference exposure dose (RfD). The cancer risk (CR) was calculated using Equation (12) and the slope factor (SF). The hazard index (HI) and cumulative cancer risk (CCR) are the sums of HQ and CR, respectively, as shown in Equations (13) and (14).
C D I = C W × I R × E F × E D B W × A T
H Q = C D I R f D
C R = C D I × S F
H I = j = 1 m H Q j
C C R = j = 1 m C R
Non-cancer risks are classified into two different levels based on the threshold of 1: no health risk (≤1) and some health risk (>1). When HI > 1, it indicates that the threshold has been exceeded, and the health risk to humans cannot be ignored. When HI ≥ 2, it is considered significantly above the threshold, indicating a higher non-cancer health risk to humans. Cancer health risks are categorized into two levels based on the threshold of 1 × 10⁻⁴: no cancer risk (≤1 × 10⁻⁴) and cancer risk (>1 × 10⁻⁴).
Harmful Trace Elements can pose health risks when they reach certain dosage levels, leading to various diseases in individuals who are exposed to such environments over an extended period [49]. High doses of Mn can cause neurological damage, high doses of B can lead to abnormal weight loss, high doses of As can result in cardiovascular diseases and skin issues, excessive NO3 can cause abnormal hemoglobin levels, and excessive F can lead to bone damage and neurological disorders. The reference doses (RfD) and slope factors for harmful trace elements are listed in Table 1.

3.5. Uncertainty and Sensitivity Analysis

In this study, Monte Carlo Simulation (MCS) was used to determine data uncertainty and sensitivity. Monte Carlo Simulation is a computational method based on random sampling and statistics, widely used to simulate uncertainty in systems and assess the probability distribution of outcomes. It has been extensively applied in the field of environmental science [47]. This simulation was conducted using Oracle Crystal Ball® 11.1.24 in Excel, with a total of 10,000 iterations.

4. Results and Discussion

4.1. Hydrogeochemical Characteristics and Driving Factors of Groundwater

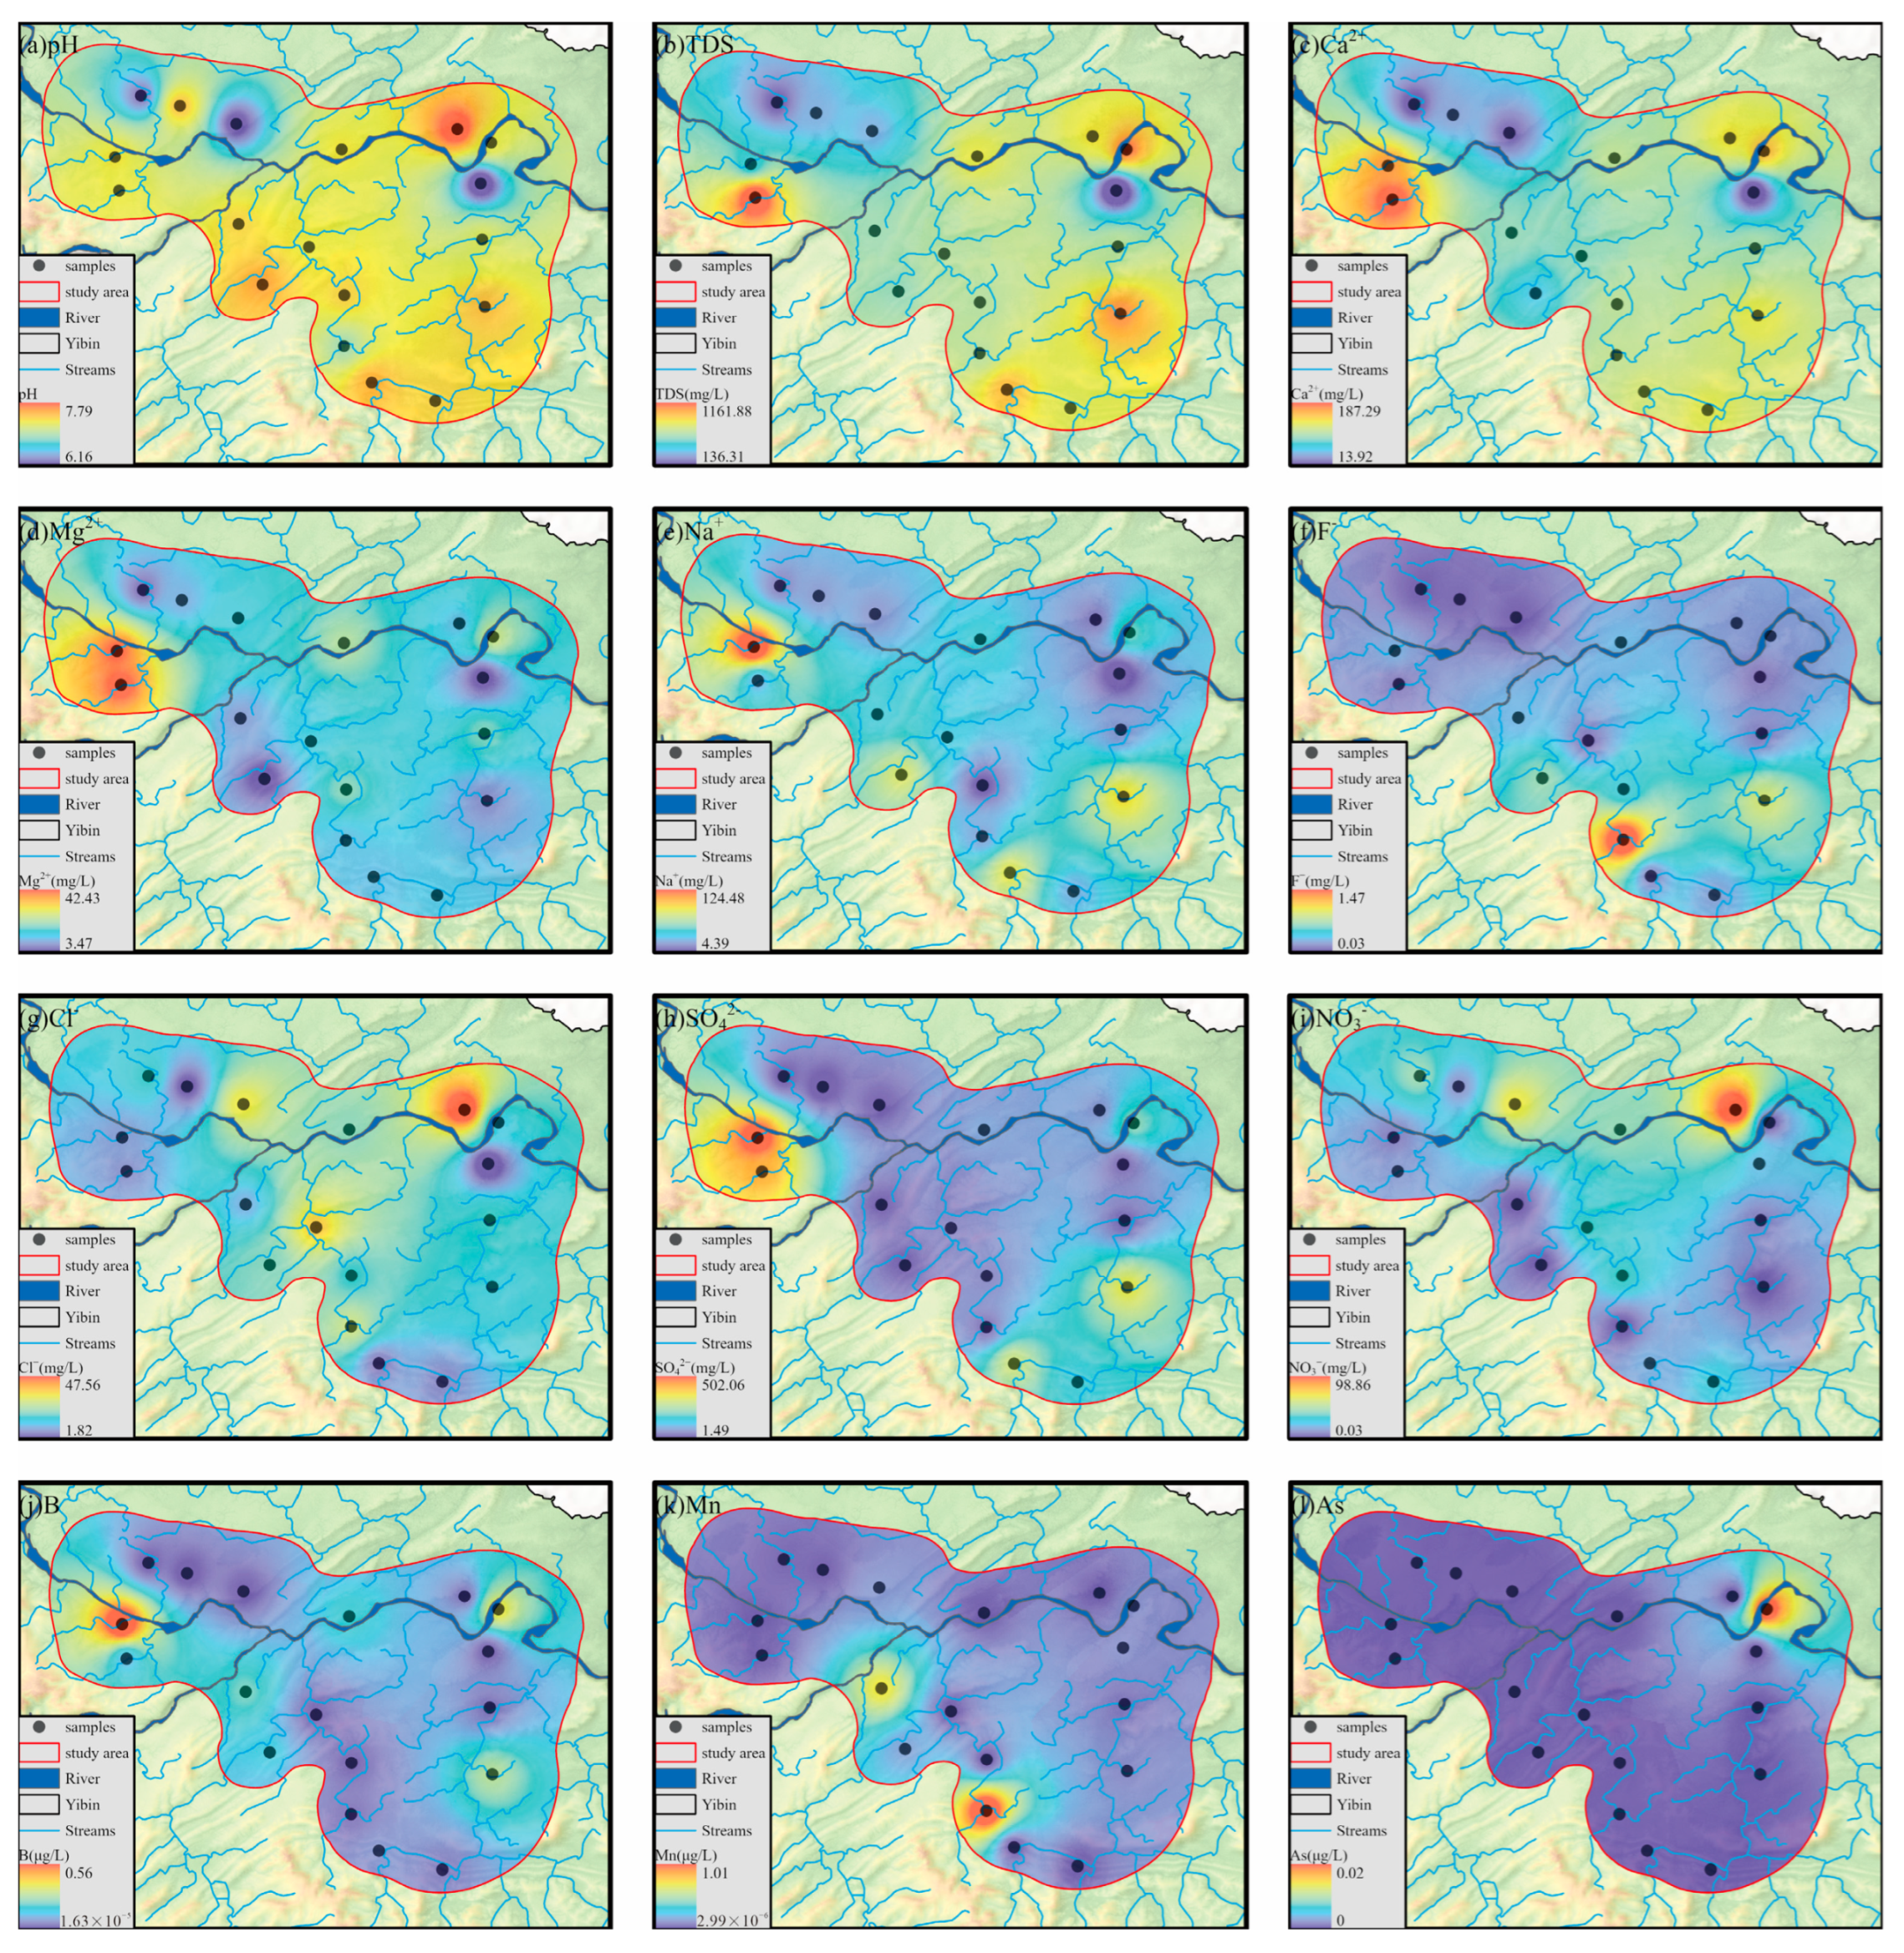
This study analyzed the physicochemical parameters of 18 groundwater samples (Figure 4). The pH values of the samples ranged from 6.16 to 7.79, with an average of 7.16. In Figure 4a, three samples had pH values below 6.5, which may be influenced by atmospheric pollution or human activities near the sampling sites. The remaining samples fell within the drinking water quality standards, exhibiting neutral to slightly alkaline characteristics. The total dissolved solids (TDS) of the samples ranged from 136 to 1162 mg/L, with an average of 670.11 mg/L. Only the TDS values of samples D5 and D10 exceeded the drinking water standard limit of 1000 mg/L, likely due to human activities in the vicinity of these sampling points (Figure 4b). Apart from a few samples where the concentrations of NO3, Mn, and As exceeded the drinking water quality standards (Figure 4i–l), the remaining physical parameter indicators were within the limits of drinking water standards. It is speculated that the exceedances in some samples may be caused by agricultural irrigation around the sampling sites. Although the concentration of B in the samples did not exceed the standard limit, its overall level was relatively high, and its impact should not be overlooked.
As shown in Figure 4m–o, the concentration of HCO3 in the groundwater of the study area ranges from 19.0 mg/L to 454.8 mg/L, with an average of 274.2 mg/L. The temperature varies between 19 °C and 27.5°C, with an average of 21.7 °C, indicating a normal level. The dissolved oxygen (DO) ranges from 2.9 mg/L to 9.1 mg/L, with an average of 5.8 mg/L, reflecting a relatively good water quality.
The groundwater ion concentration difference map (Figure 5) reflects the variations in ion concentrations in groundwater across different regions or time periods, which helps to reveal water quality trends, identify pollution sources, reflect hydrogeochemical processes, infer groundwater flow paths, and assess the impact of natural or human factors on groundwater. It is an important tool for water resource monitoring and management. Most areas in the study region show pH values ranging from neutral to slightly alkaline (Figure 5a). The distribution of Ca2+ and Mg2+ concentrations follows a similar trend, with particularly high ion concentrations at two points in the western part of the study area, which may suggest that groundwater in these areas has strong contact or dissolution interactions with calcium- and magnesium-bearing minerals such as carbonates or gypsum (Figure 5c,d). Two groundwater points in the southern part of the study area exhibit higher concentrations of F and SO42− ions compared to other points (Figure 5f,h). The higher fluoride content in these regions may result from the dissolution of fluoride-containing minerals in the groundwater. Long-term consumption of high-fluoride water can negatively affect human health, leading to conditions such as dental fluorosis or osteoporosis. The northern part of the study area shows elevated concentrations of Cl and NO3 at two points, which is usually related to the dissolution of salt rocks. It may also indicate pollution sources on the north side of the river, such as industrial wastewater or domestic sewage discharge. Excessively high concentrations of these ions can impact water quality, making it unsuitable for drinking (Figure 5g,i). The concentration of B ions in the western part of the study area is significantly higher than in other regions (Figure 5i), which is near the Minjiang River. This could be due to local residents using river resources for agricultural activities, involving fertilizers or pesticides rich in boron. In the southwestern part of the study area (Figure 5k), higher Mn ion concentrations are observed, possibly due to industrial plants nearby, where wastewater may contain elevated levels of manganese ions. Notably, the concentration of As ions in the northwest region is significantly higher than in other areas and exceeds the health standards for drinking water quality (Figure 5l). Long-term exposure could pose serious health risks.
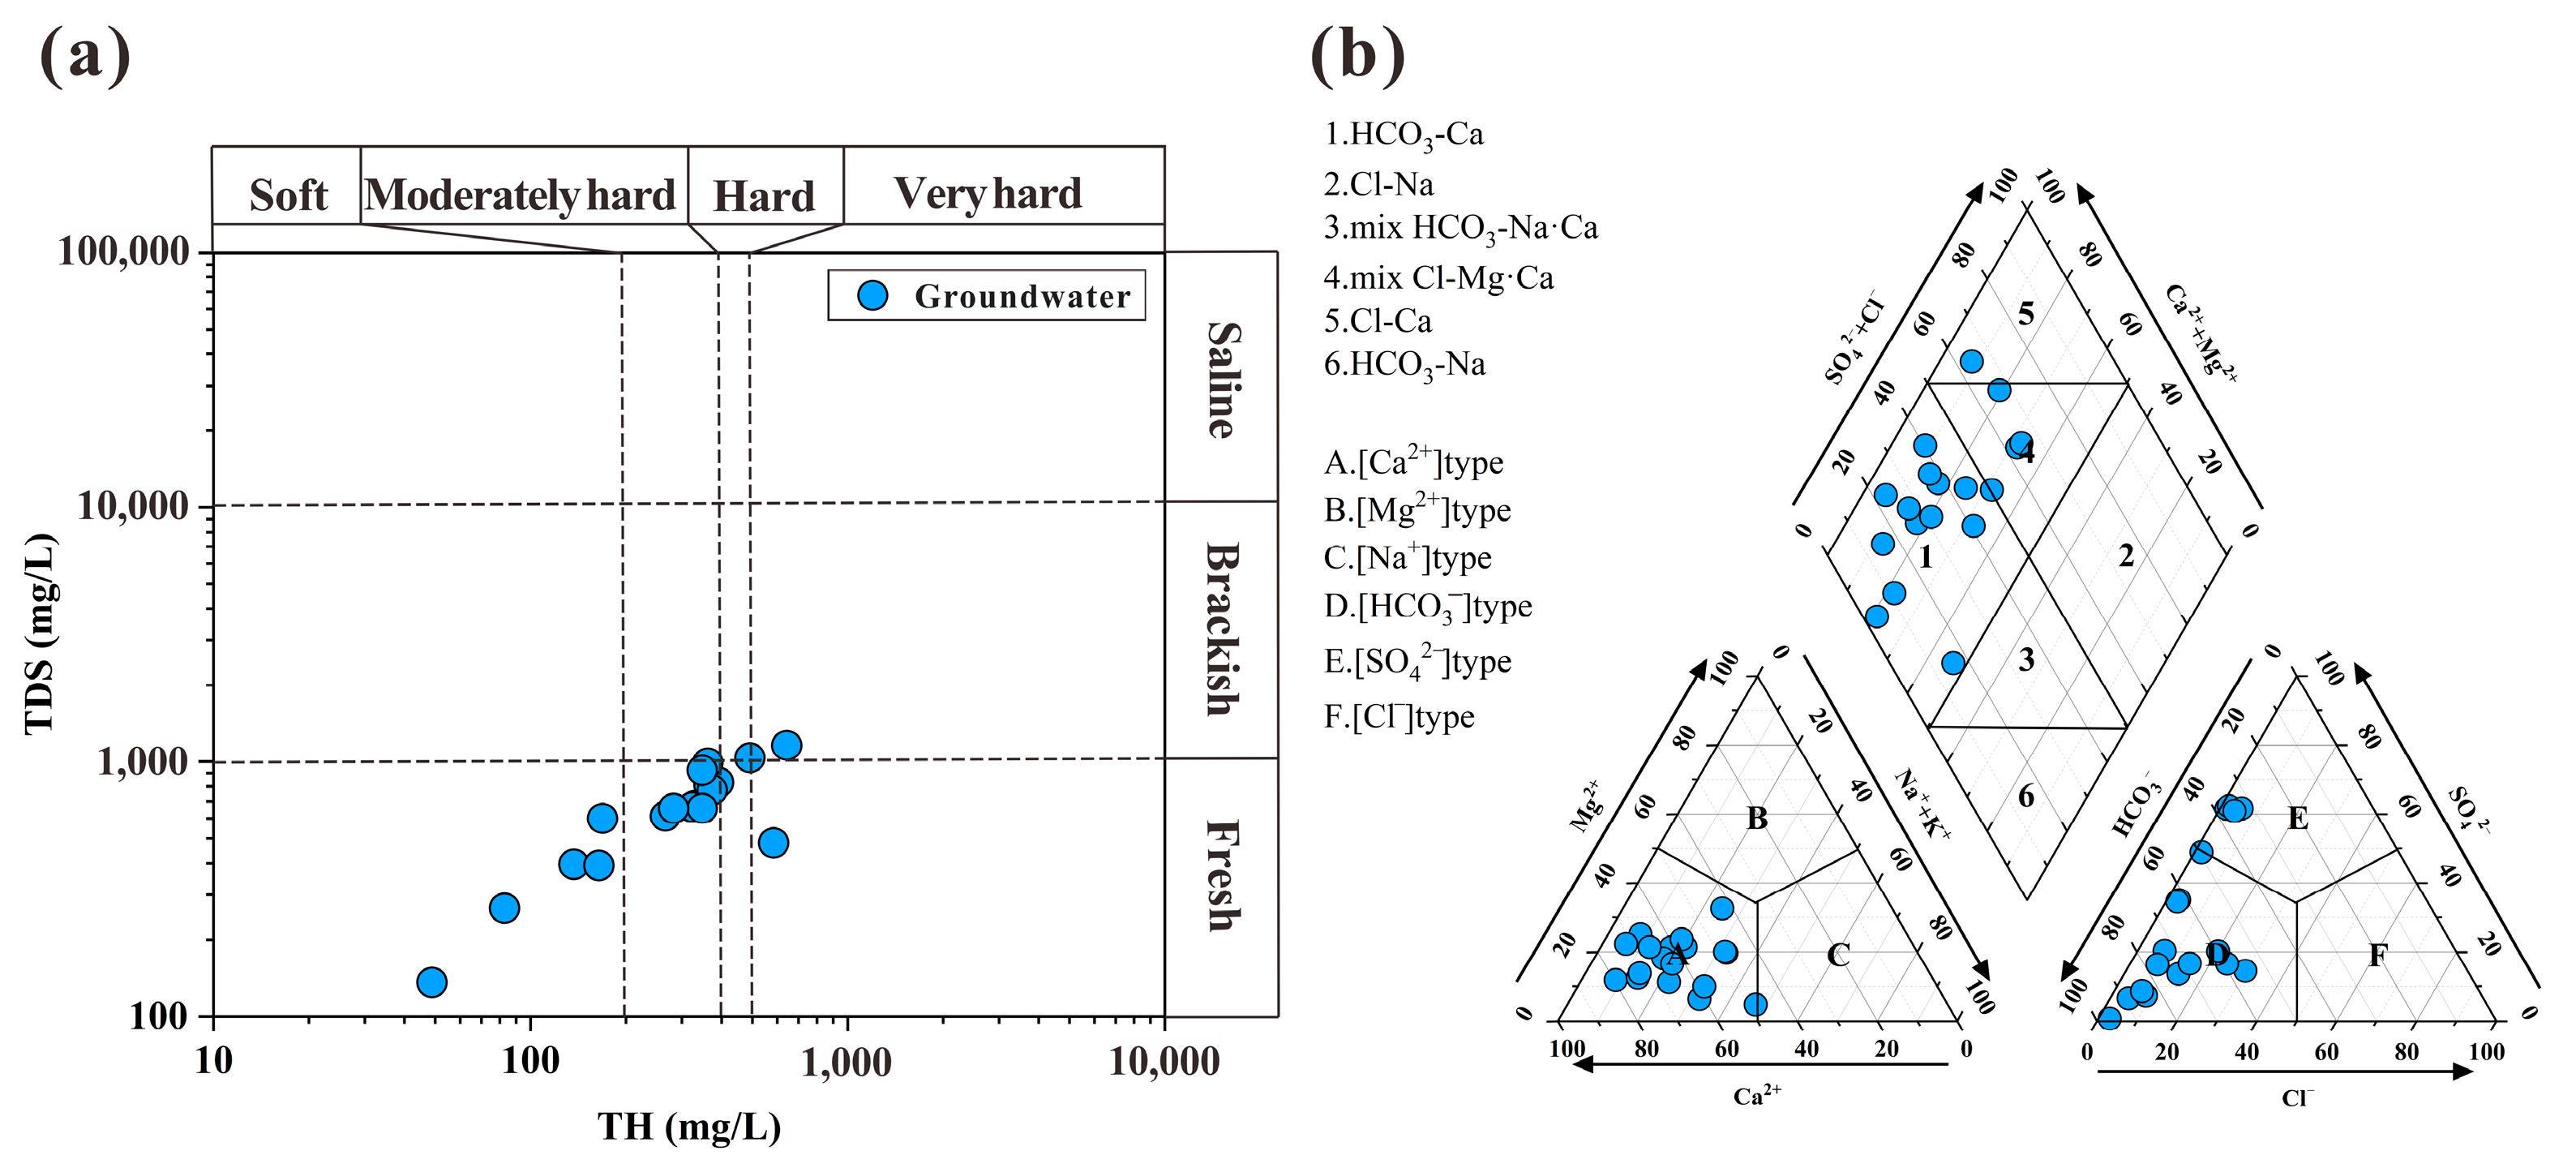
Total hardness (TH) is an important indicator for evaluating aquifer characteristics. Generally, TH values are classified into five categories: very soft (0–75 mg/L), soft (75–150 mg/L), moderately hard (150–300 mg/L), hard (300–450 mg/L), and very hard (>450 mg/L) [50]. The TH values in the study area range from 48.97 to 642.23 mg/L, indicating that the water hardness in the region varies from soft to very hard (Figure 6a). The Piper diagram is a simple and effective method for classifying water chemical types and has been widely used in hydrochemical studies. By using the milliequivalent percentage of the major cations and anions, the points can be plotted on a triangular diagram, resulting in a Piper diagram that reflects the hydrochemical types of the region (Figure 6b). The water samples in the study area primarily fall within the HCO3-Ca type region, with a small number of samples located in the mixed type region or other areas. The water samples exhibit a certain trend on the Piper diagram, transitioning from the HCO3-Ca type to the HCO3·SO4-Ca type and HCO3·SO4-Ca·Na type. This indicates that the concentration of sulfate ions in some groundwater is gradually increasing, which may be due to pollution from human activities [51].
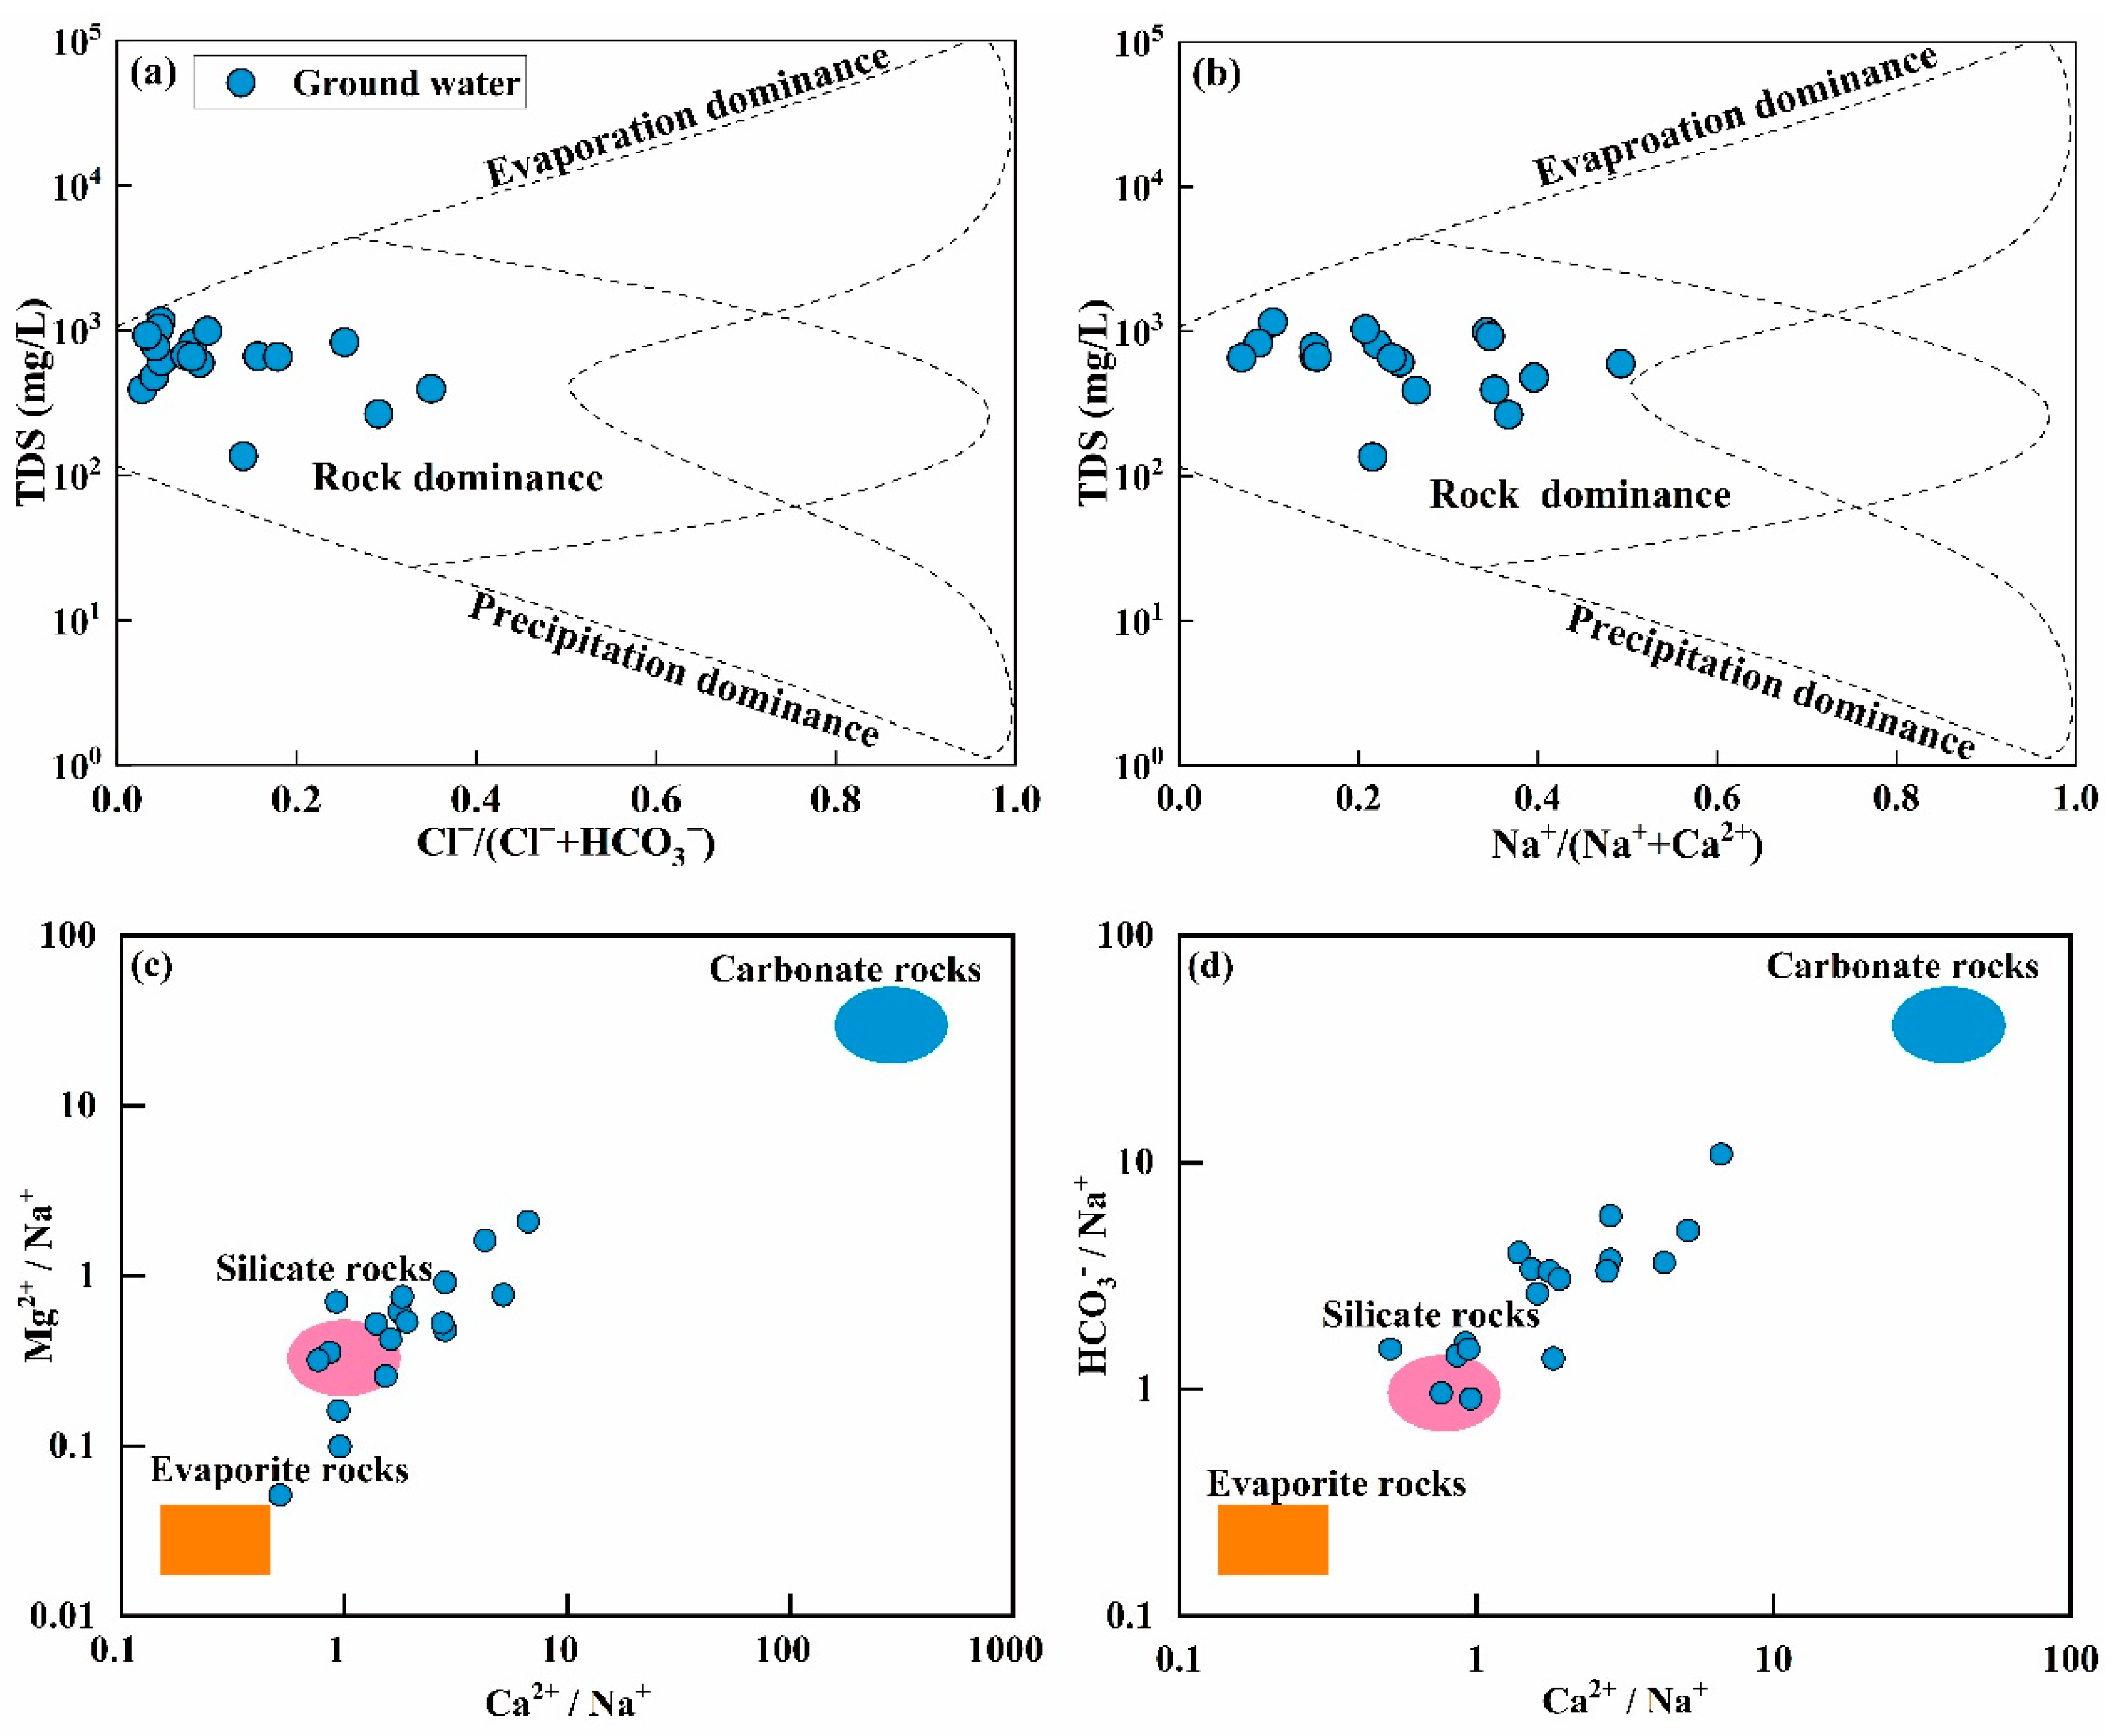
The Gibbs diagram helps analyze the relationship between aquifer lithology and water composition [52]. It contains three different end members: Evaporation dominance, Rock dominance, and Precipitation dominance. In the study area, the total dissolved solids (TDS) of groundwater samples range from 136 to 1162 mg/L (with an average of 670.1 mg/L), and the ratios of Na+/(Na++Ca2+) and Cl/(Cl+HCO3) range from 0 to 0.6. The sampling points are located in the rock dominance region (Figure 7a,b), indicating that the ion concentrations in the groundwater are primarily controlled by rock weathering, with water–rock interaction playing a dominant role in the formation of groundwater chemical mechanisms in the study area.
The molar mass ratios of Ca2⁺/Na⁺, Mg2⁺/Na⁺, and HCO3/Na⁺ serve as indicators to differentiate the sources of rock weathering and dissolution processes [53]. Nearly all groundwater samples cluster near the silicate mineral end member, with a slight shift toward the carbonate mineral end member (Figure 7c,d). This indicates that silicate minerals primarily govern the water–rock interactions in the study area, although carbonate minerals also exert a notable influence. This pattern aligns with the characteristics of the formations within the red bed zone of the Sichuan Basin, where the study area is situated.
By analyzing the correlation of major ions, we can further clarify the relevant minerals that influence water–rock interactions. When the primary water–rock interaction process in groundwater is the dissolution of evaporite minerals (Equations (15) and (16)), the molar ratio of (Na++K+) to Cl should lie on the line y = x [54,55]. Most water samples deviate from the line y = x and lean towards the (Na++K+) axis, indicating that the contribution of evaporite dissolution to Na+ and K+ ions is relatively small (Figure 8a). The Na+ and K+ ions in the water may originate from the dissolution of silicates (Equations (17) and (18)) or from cation exchange processes. The sources of Ca2⁺ and Mg2⁺ ions in groundwater can be revealed by calculating the molar ratio of (Ca2⁺ + Mg2⁺) to (HCO3 + SO42−). Most water samples are located near the line y = x (Figure 8b), indicating that the Ca2⁺ and Mg2⁺ ions in the water are jointly controlled by the dissolution of carbonate and silicate minerals. Notably, some water samples lie above the line y = x, which may be due to the influence of sulfide oxidation in addition to the weathering or dissolution of carbonates and silicates controlling the concentrations of Ca2⁺ and Mg2⁺ ions in these samples.
NaCl → Na+ + Cl
KCl → K+ + Cl
2NaAlSi3O8 + 2CO2 + 11H2O → Al2Si2O5(OH)4 + 4H4SiO4 + 2Na+ + 2HCO3
2KAlSi3O8 + 2CO2 + 11H2O → Al2Si2O5(OH)4 + 4H4SiO4 + 2K+ + 2HCO3
When the Ca2⁺ and Mg2⁺ ions in groundwater originate from the dissolution of calcite and dolomite (Equations (19) and (20)), the molar ratios of Ca2⁺ and Mg2⁺ to HCO3 should be approximately 0.5 and 0.25, respectively. The water samples from the study area are located near the calcite dissolution line and lean towards the Ca axis (Figure 8c), indicating that the dissolution of calcite is the dominant process. The relatively low concentration of HCO3 may be due to its consumption during sulfide oxidation or through the release of H⁺ ions generated during the hydrolysis of Fe and Mn (Equation (21)). When Ca2⁺ and SO42− primarily derive from the dissolution of gypsum, a linear relationship with a molar ratio of 1:1 should exist between Ca2⁺ and SO42− (Equation (22)). However, most water samples do not lie on the line y = x, indicating that gypsum dissolution is not the main source of Ca2⁺ and SO42− ions in the water (Figure 8e). Additionally, the samples leaning towards the Ca axis further suggest that the Ca2⁺ ions in the groundwater are primarily influenced by the dissolution of carbonate minerals.
CaCO3(calcite) + CO2 + H2O → Ca2+ + 2HCO3
CaMg(CO3)2(dolomite) + 2CO2+2H2O → Ca2+ + Mg2+ + 4HCO3
HCO3 + H+ → H2CO3 → CO2 + H2O
CaSO4·2H2O(gypsum) → Ca2+ + SO42− + 2H2O
Cation exchange refers to the process in which particles adsorb certain cations under specific conditions, releasing some of the previously adsorbed cations into the water, thereby altering the hydrochemical composition of natural water. Cation exchange is typically characterized by the molar concentration ratio of (Na+ + K+−Cl) to [(Ca2+ + Mg2+) − (SO42− + HCO3)]. If cation exchange occurs, the ratio generally approaches −1. Most water samples from the study area fall near the line y = −x, indicating that this ratio is close to -1, which suggests that a strong cation exchange is taking place (Figure 8g). To understand the type and intensity of cation exchange, the Chlor-Alkalinity Index (CAI-I and CAI-II) (Equations (23) and (24)) are employed for testing. If Ca2⁺ and Mg2⁺ in the water are replaced by Na⁺ and K⁺ in the aquifer medium, the index will yield a negative value, indicating a positive cation exchange. Conversely, a positive value indicates a negative cation exchange. Most water samples in the study area have CAI-I and CAI-II values less than zero (Figure 8h), leading to the conclusion that positive cation exchange has occurred, resulting in an increase in Na⁺ ion concentration in the samples.
CAI-I = (Cl − (Na+ + K+))/Cl
CAI-II = (Cl − (Na+ + K+))/(HCO3 + SO42− + CO32− + NO3)
The mineral saturation index (SI) is an important parameter for assessing the balance and reactivity between minerals and groundwater. In this study, the PHREEQC 3.0 program was utilized to calculate and evaluate the SI values of minerals in the water samples from the study area (Equation (25)):
SI = log (IAP/K)
The saturation indices of calcite, dolomite, gypsum, and halite were calculated for the water samples from the study area. In most samples, the saturation indices of calcite and dolomite were greater than zero (Figure 8i), indicating that calcite and dolomite have started to precipitate, which is consistent with the geological background of the study area containing a large amount of carbonate rocks. The saturation index of gypsum in the samples was around zero and slightly greater than zero, suggesting that gypsum is in a state of saturation. In contrast, all samples had saturation indices of halite that were less than zero, indicating that halite is in a soluble state.

4.2. Reverse Hydrogeochemical Simulation

In this study, the chemical composition in groundwater is clear, but the evolution of its formation is unknown. Therefore, reverse hydrogeochemical simulation is employed to explain the hydrochemical reaction of various sites in the same path. Based on the PHREEQC 3.3.9 software, the study aims to explore the hydrochemical evolution by calculating the mineral saturation index (SI) and using the mass balance model.
  • Selection of simulation path
Based on the principles of elevation differences in groundwater sampling locations, TDS concentration fluctuation, and the same water flow path, the D3 → D10 path was selected for reverse hydrogeochemical simulation. The main minerals in the study area include coal, limestone, and halite, with no metallic minerals. Thus, a total of eight parameters (pH, Na+, K+, Ca2+, Mg2+, Cl, SO42−, and HCO3) were selected for this simulation (Table 2).
2.
Determination of probable mineral phases
Probable mineral phases are determined based on the geological conditions of the study area, lithological characteristics, and the content of each mineral component. The main minerals in the study area are known to be limestone and halite through investigation. Gypsum, calcite, dolomite, halite, fluorite. and CO2 (g) will be used as mineral phases to the water–rock reaction. The chemical equation of each mineral is as Table 3.
3.
Saturation index (SI)
The saturation index is widely utilized to ascertain the saturation state of minerals in groundwater. When SI = 0, the minerals are in equilibrium in the aqueous solution; SI < 0 indicates that the minerals are not saturated in the aqueous solution; SI > 0 indicates that the minerals are supersaturated in the aqueous solution.
In the result of the mineral saturation index indicated (Table 4), the SI of calcite and dolomite change from negative to positive values, indicating that these two minerals are gradually saturated in groundwater. The saturation indexes of the other minerals are all less than zero, indicating that these minerals are in the dissolved state.
4.
The result of hydrogeochemical simulation
Table 5 exhibited the result of reverse hydrogeochemical simulation. All minerals are dissolved in the groundwater. Based on the results of the Saturation index, calcite and dolomite are gradually saturated from the upstream dissolved state, indicating that calcite and dolomite are the main sources of Ca2+ and HCO3−. The source of Mg2+ attributes to dolomite dissolution. Fluorite is the source of F, and has some contributions to Ca2+. The primary source of Ca2+ and SO42− is Gypsum dissolution. Na+ and Cl come from halite dissolution. CO2 (g) dissolution makes great contributions to HCO3−.

4.3. Isotopic Characterization Analysis

4.3.1. Recharge Source

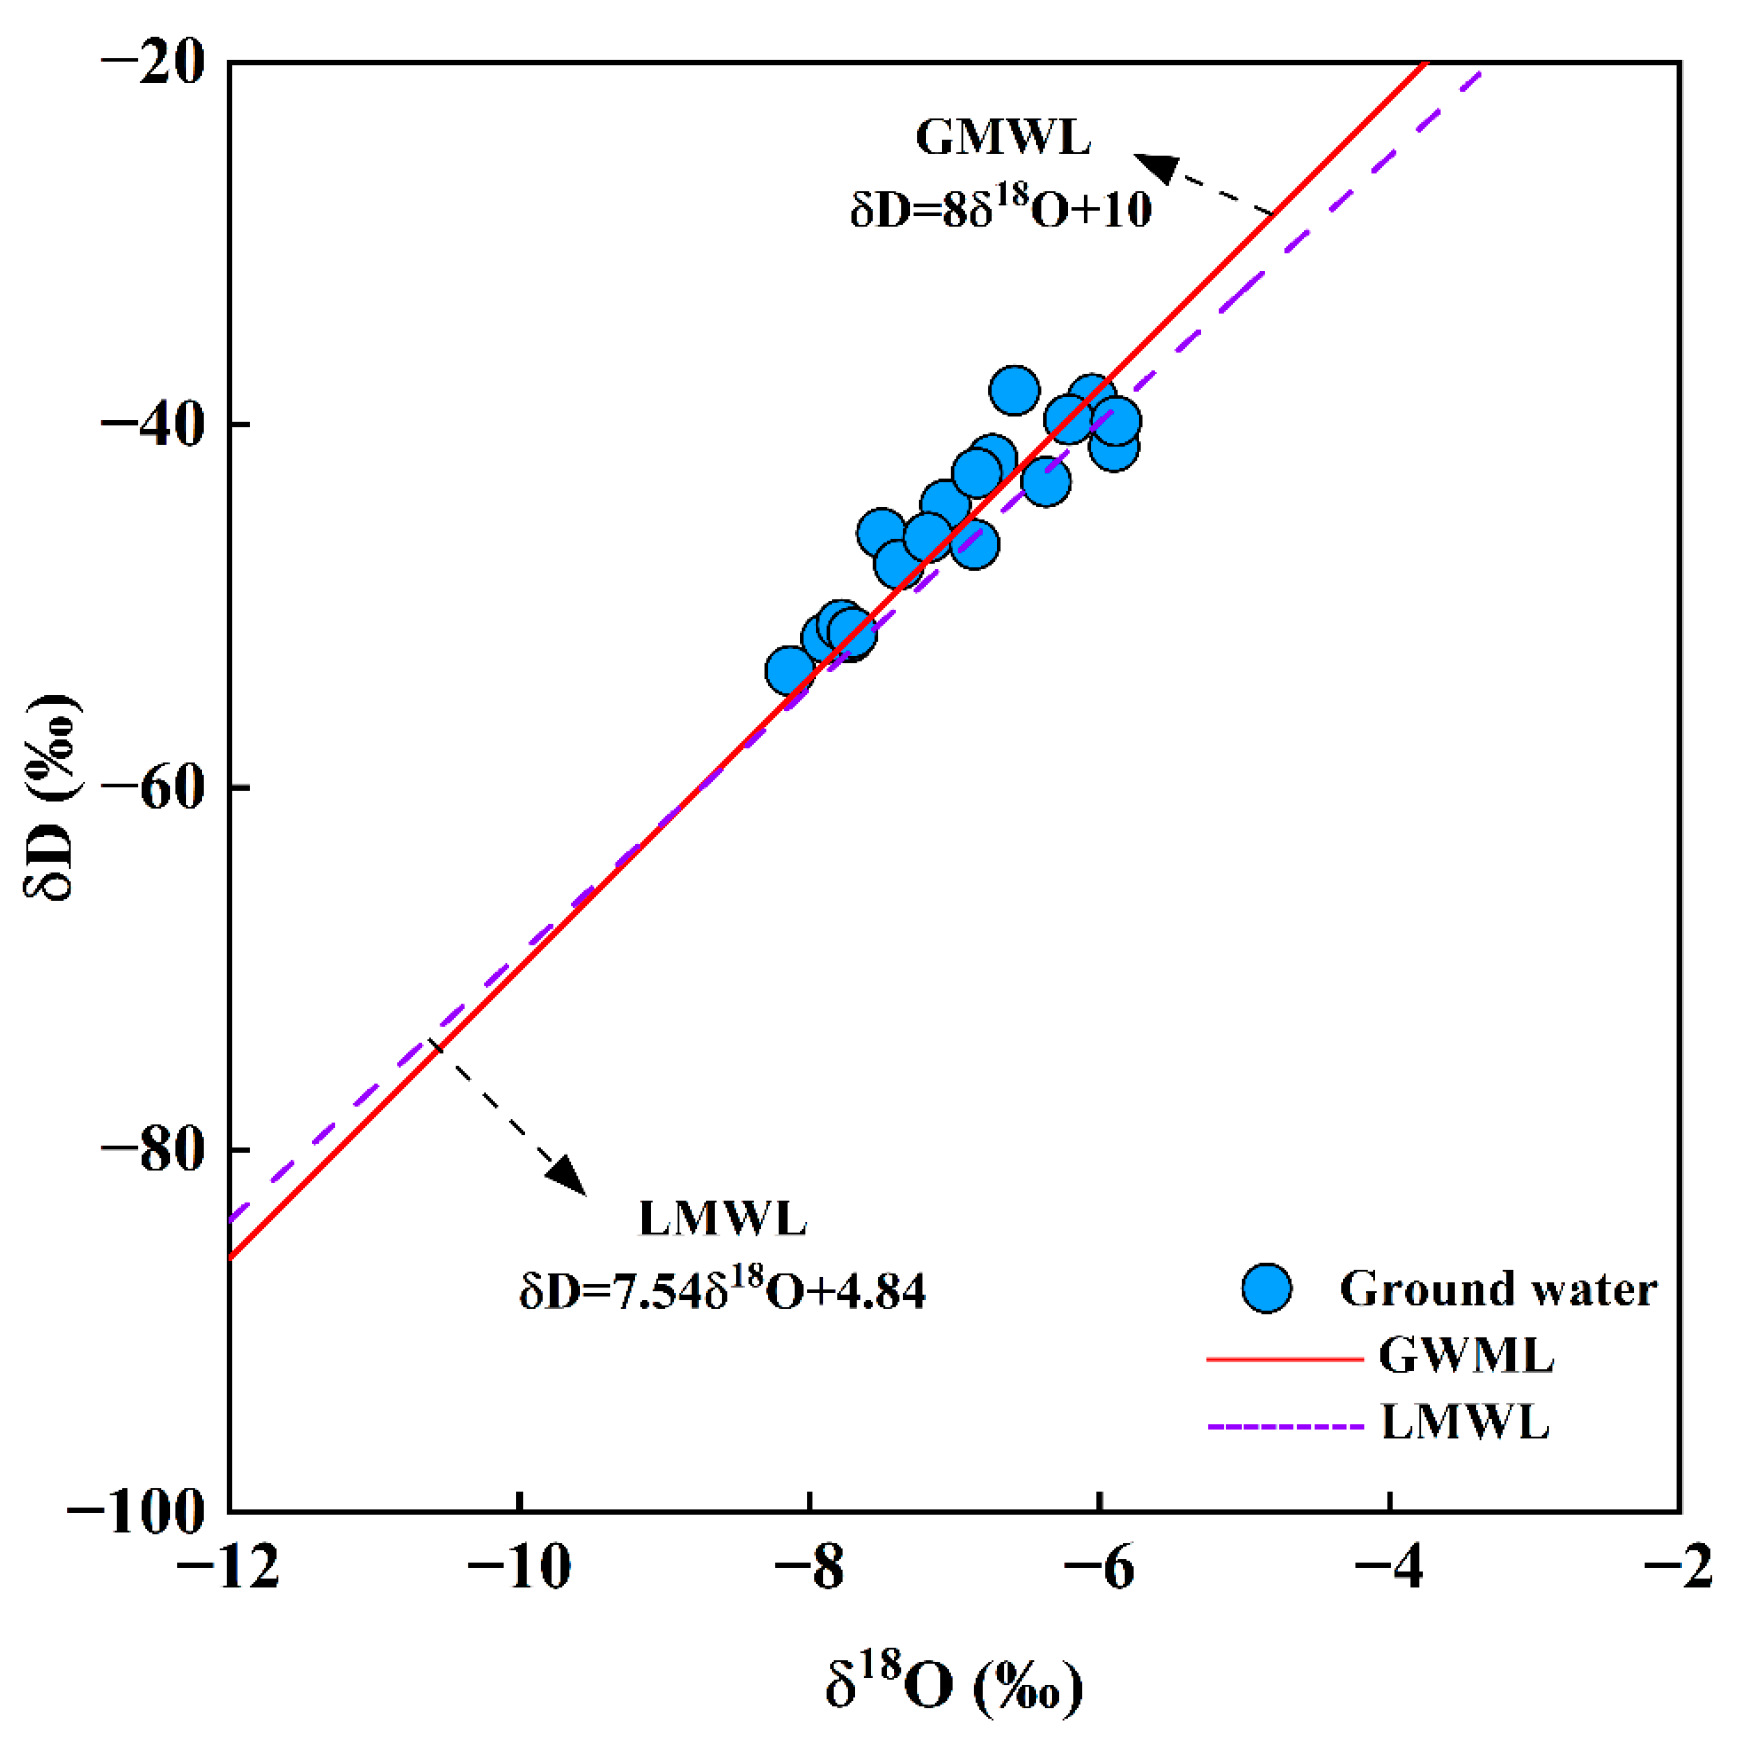
When water evaporates into a gaseous state or condenses into a liquid state, the hydrogen and oxygen isotopes within it undergo a fractionation phenomenon. The heavier isotopes tend to accumulate more readily in the liquid phase, while the lighter isotopes are more likely to concentrate in the gas phase, exhibiting the characteristics of hydrogen and oxygen isotope gas–liquid phase fractionation. This isotopic fractionation can result in natural water bodies at different locations and elevations displaying distinct hydrogen and oxygen isotope characteristics, forming varying δD and δ18O ratios. The positions of the water sampling points on the δD–δ18O relationship diagram, reflect the different compositions and environments of these water bodies [56,57]. All groundwater samples in the study area are located above or near the global atmospheric precipitation line and the atmospheric precipitation line of western Sichuan (Figure 9), indicating that the groundwater in the region primarily originates from atmospheric precipitation. Additionally, the evaporation in the study area is not intense. The western and southern parts of the region are characterized by the high-altitude Daliangshan area, which helps to block water vapor loss and facilitates rainfall formation. Furthermore, the study area itself is at a low elevation; although summers can be quite hot, the overall evaporation does not reach an intense level. The annual average rainfall in the study area ranges from 1050 to 1618 mm, providing ample precipitation that benefits groundwater recharge.

4.3.2. Ion Source Analysis

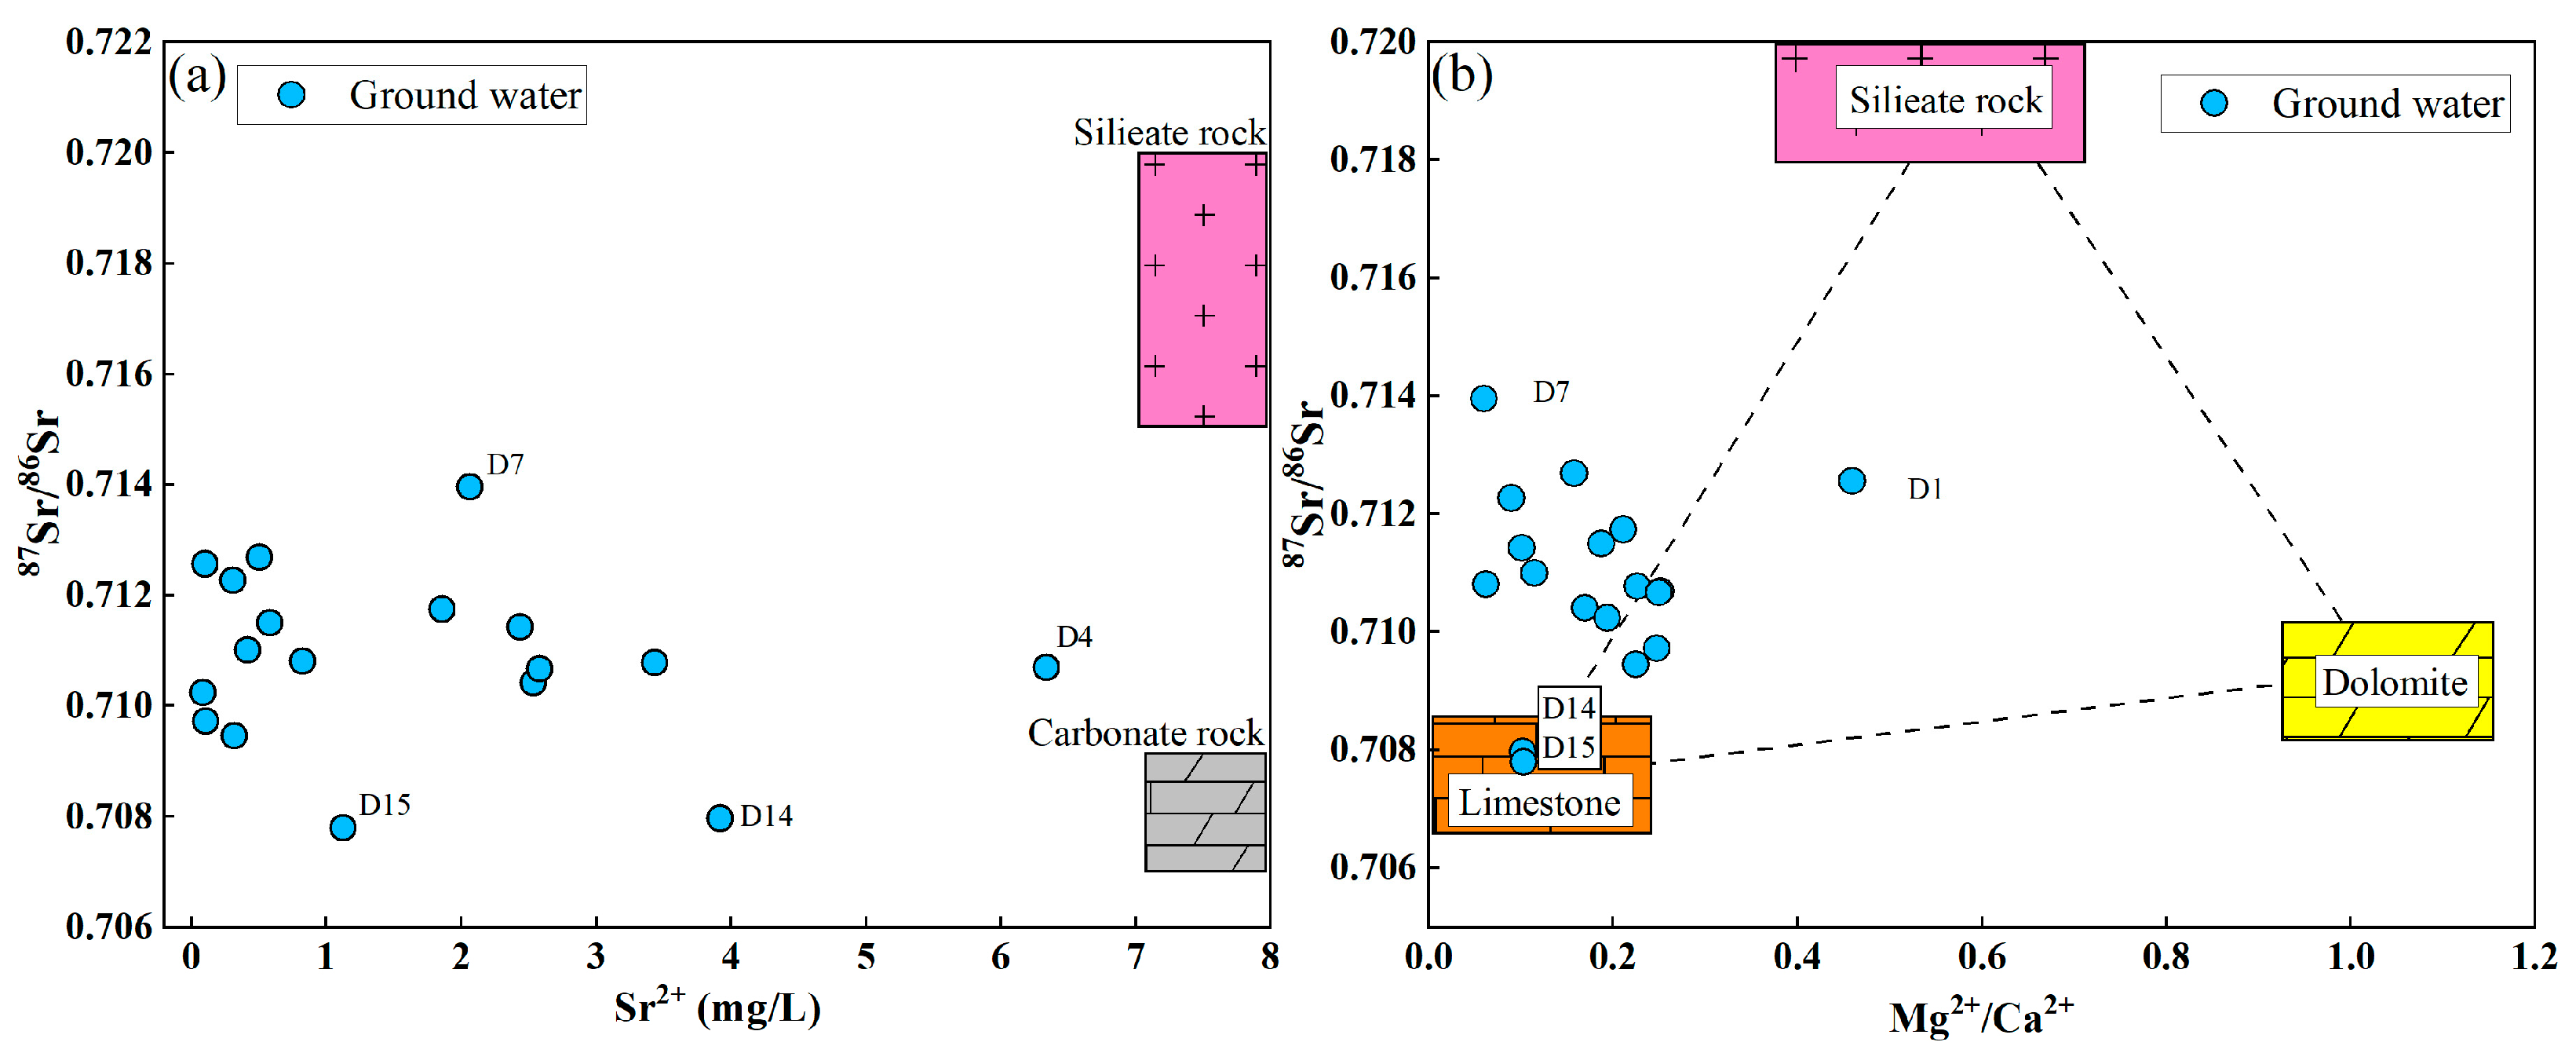
The strontium–isotope ratio (87Sr/86Sr) varies significantly among different rock types and can be used to indicate the water–rock interaction. Previous studies have shown that the 87Sr/86Sr ratio in marine carbonate rocks is approximately 7.067 to 7.092 [60,61]. In the study area, the 87Sr/86Sr ratio of groundwater ranges from 0.7078 to 0.7127, with an average of 0.7109, indicating that the strontium in the groundwater may be controlled by the dissolution of carbonate rocks (Figure 10a). Generally, due to the significant differences in the Mg/Ca ratios of limestone, dolostone, and silicate rocks [62,63], combining Mg/Ca and 87Sr/86Sr can help classify them into three different end members to determine their specific sources. In the study area, groundwater is primarily distributed near the limestone end member, suggesting that the ion sources in the groundwater are mainly influenced by the weathering and dissolution of limestone (Figure 10b). The study area is mainly located within the urban center of Yibin City, underlain by the limestone strata of the red beds, which aligns with the characteristics indicated by the 87Sr/86Sr analysis.

4.4. Entropy-Weighted Water Quality Index (EWQI)

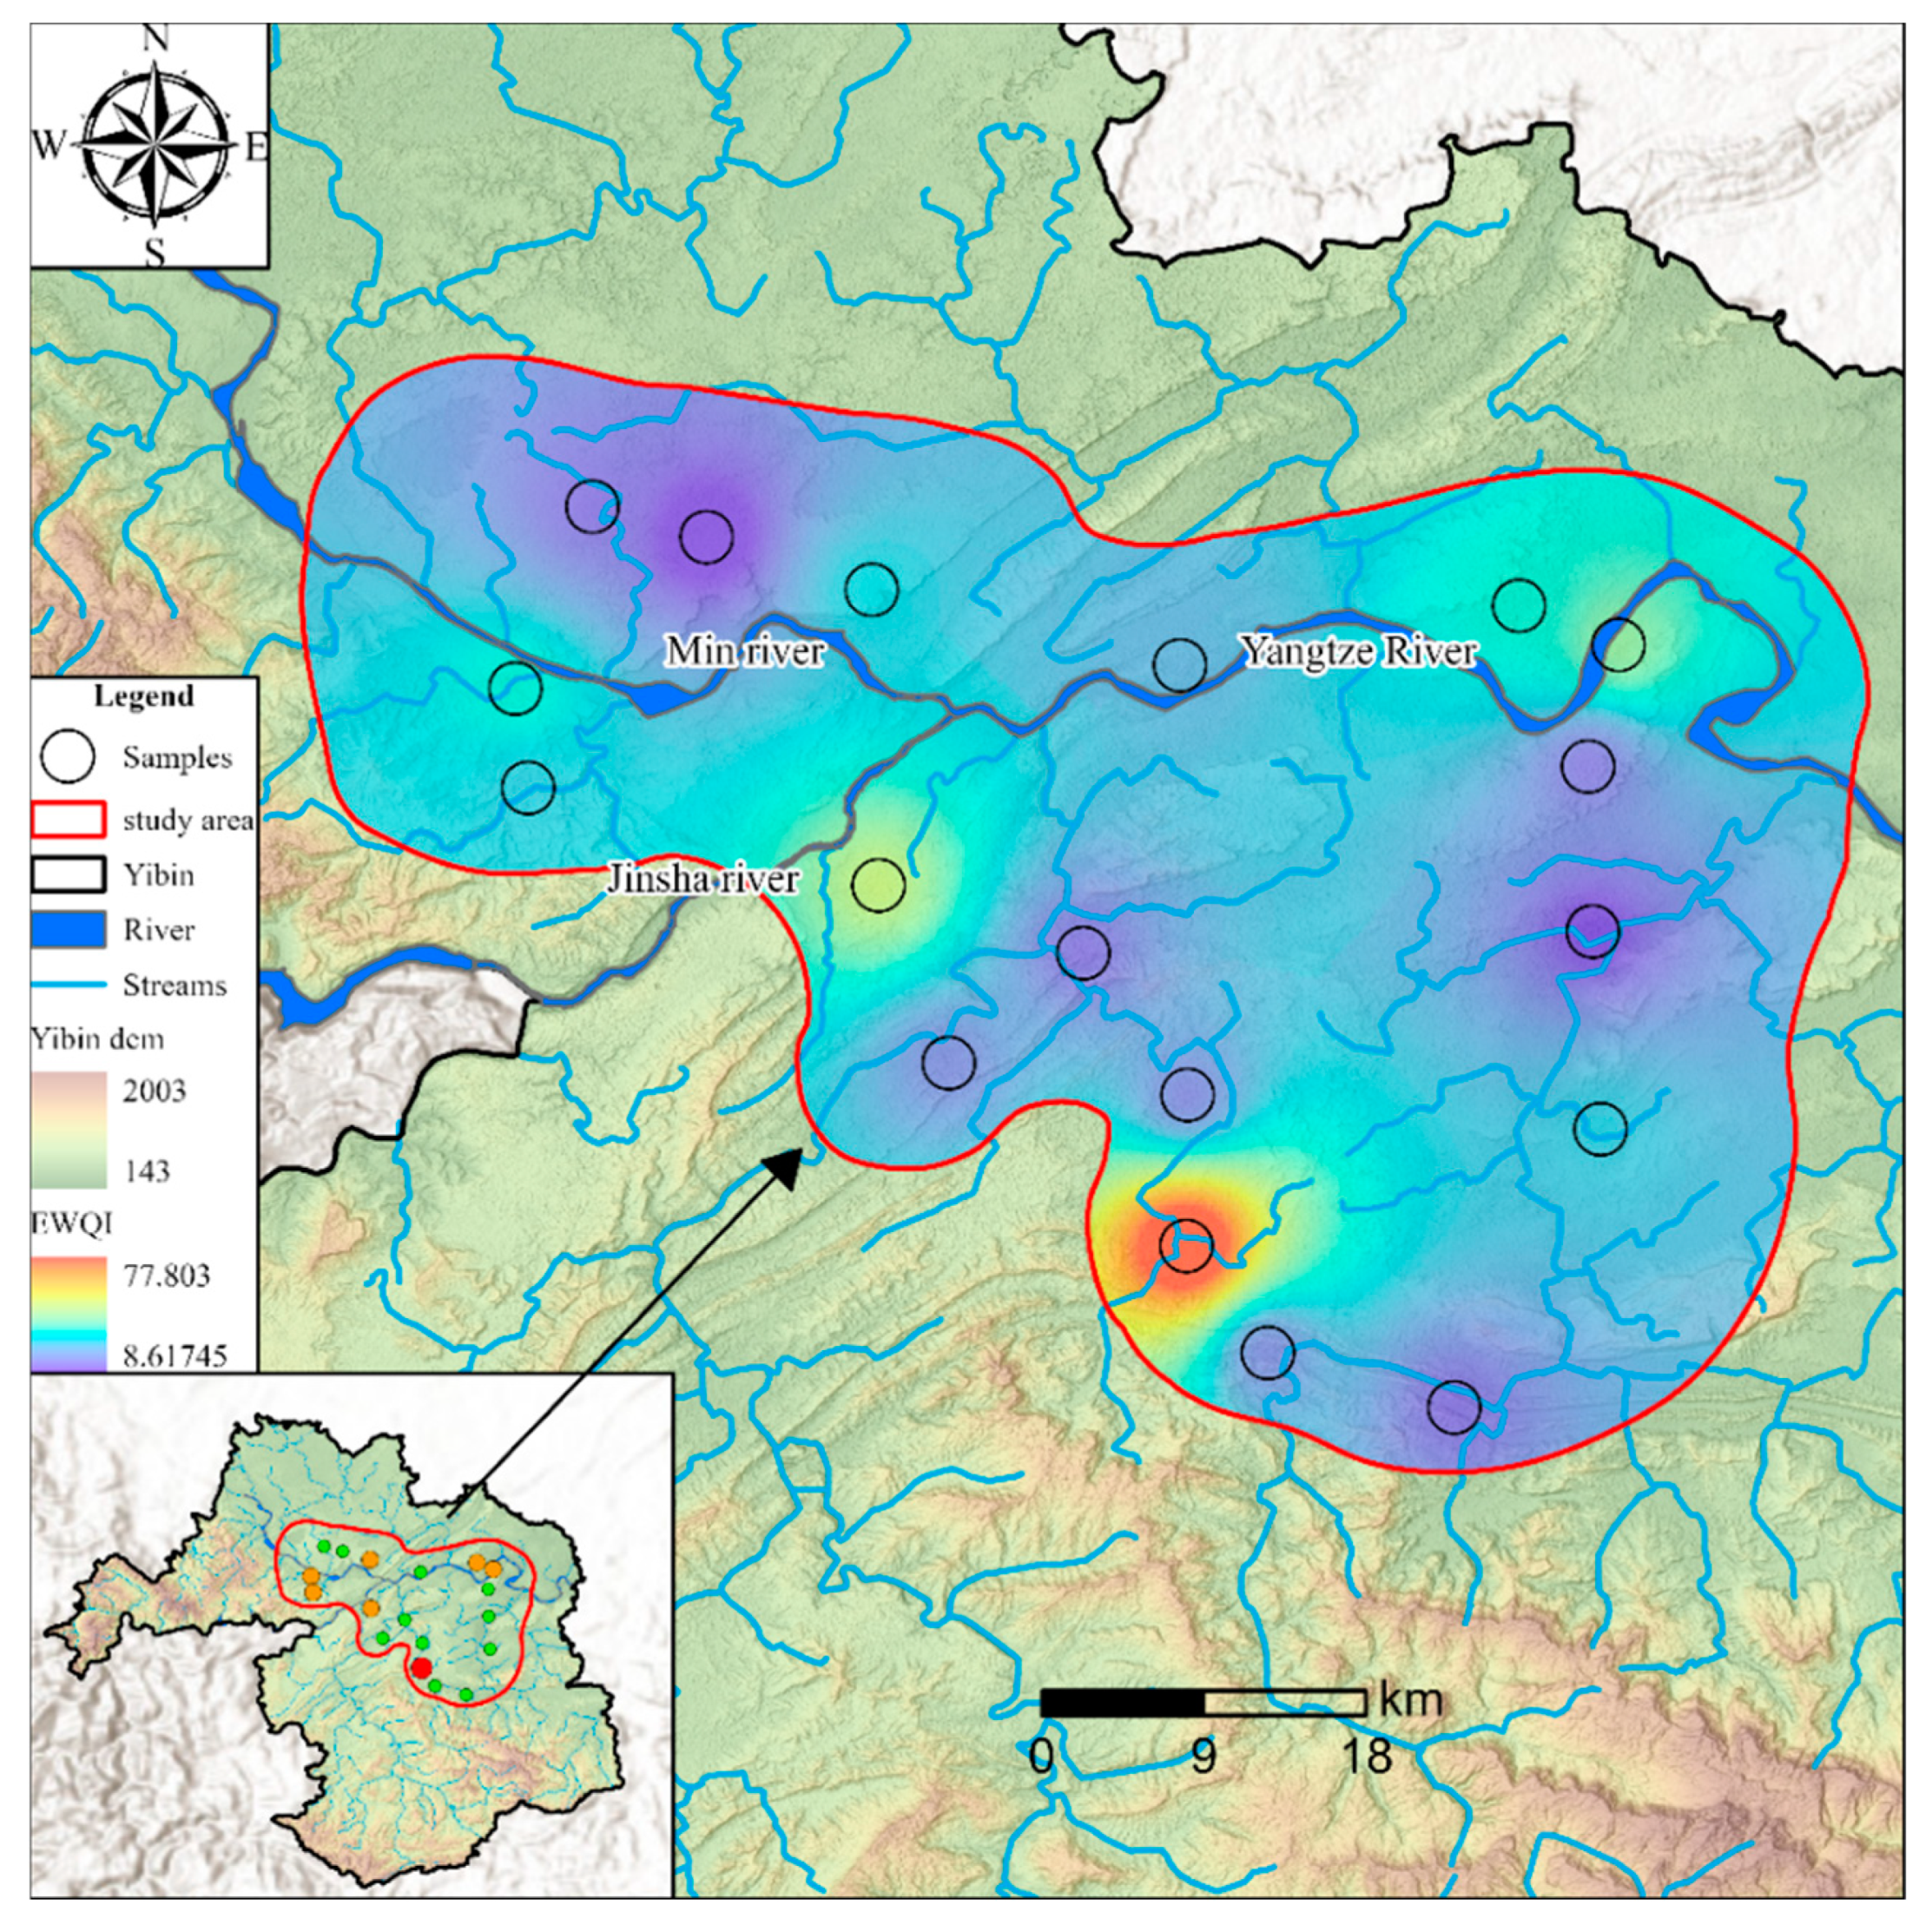
Due to the fact that the concentrations of cations and anions such as Na⁺, Ca2⁺, Mg2⁺, Cl, SO42−, HCO3, NO3, as well as elements like B, Mn, and As, along with pH and TDS, either exceed or approach the threshold limits, these 11 indicators have been selected to evaluate the water quality index. The results are presented in Figure 10. The evaluation results indicate that the groundwater quality in the study area is classified into two levels: good and fairly good, with no samples falling into the moderate, poor, or very poor categories. Only one sample received a rating of fairly good, accounting for 5.56% of the total samples. Among the 17 samples rated as good, 5 had an EWQI greater than 25, indicating a relatively poorer quality, and these were primarily distributed along the banks of the river. The groundwater rated as good and fairly good generally meets drinking water standards, and in this study, all groundwater samples were found to essentially satisfy the requirements for drinking water.
After conducting spatial distribution analysis using interpolation, it was found that the only groundwater sample rated as fairly good is located in the southern part of the study area, beneath Tongluo Town (Figure 11). There is an industrial plant nearby, and it is speculated that the decline in water quality in this area is influenced by the discharge of wastewater from the plant. The study area has a well-developed surface water system and is situated at the confluence of three rivers, with abundant rainfall leading to rapid replenishment of shallow groundwater. Consequently, after the discharge of wastewater from the industrial facility, the surrounding water bodies are quickly renewed and purified, which explains why the groundwater samples from surrounding locations were not adversely affected. Although the study area has a long history of agricultural development (particularly in Sichuan), which has led to prolonged use of chemical fertilizers, the rapid circulation and purification of water bodies in the area have not caused severe adverse effects on groundwater quality. The exceedance rates for nitrate (NO3) and manganese (Mn) are 11.11%, while the exceedance rate for arsenic (As) is only 5.56%. Notably, no samples exceeded the standards for boron (B) and fluoride (F).

4.5. Health Risk Assessment

4.5.1. Deterministic Characteristics of Health Risk

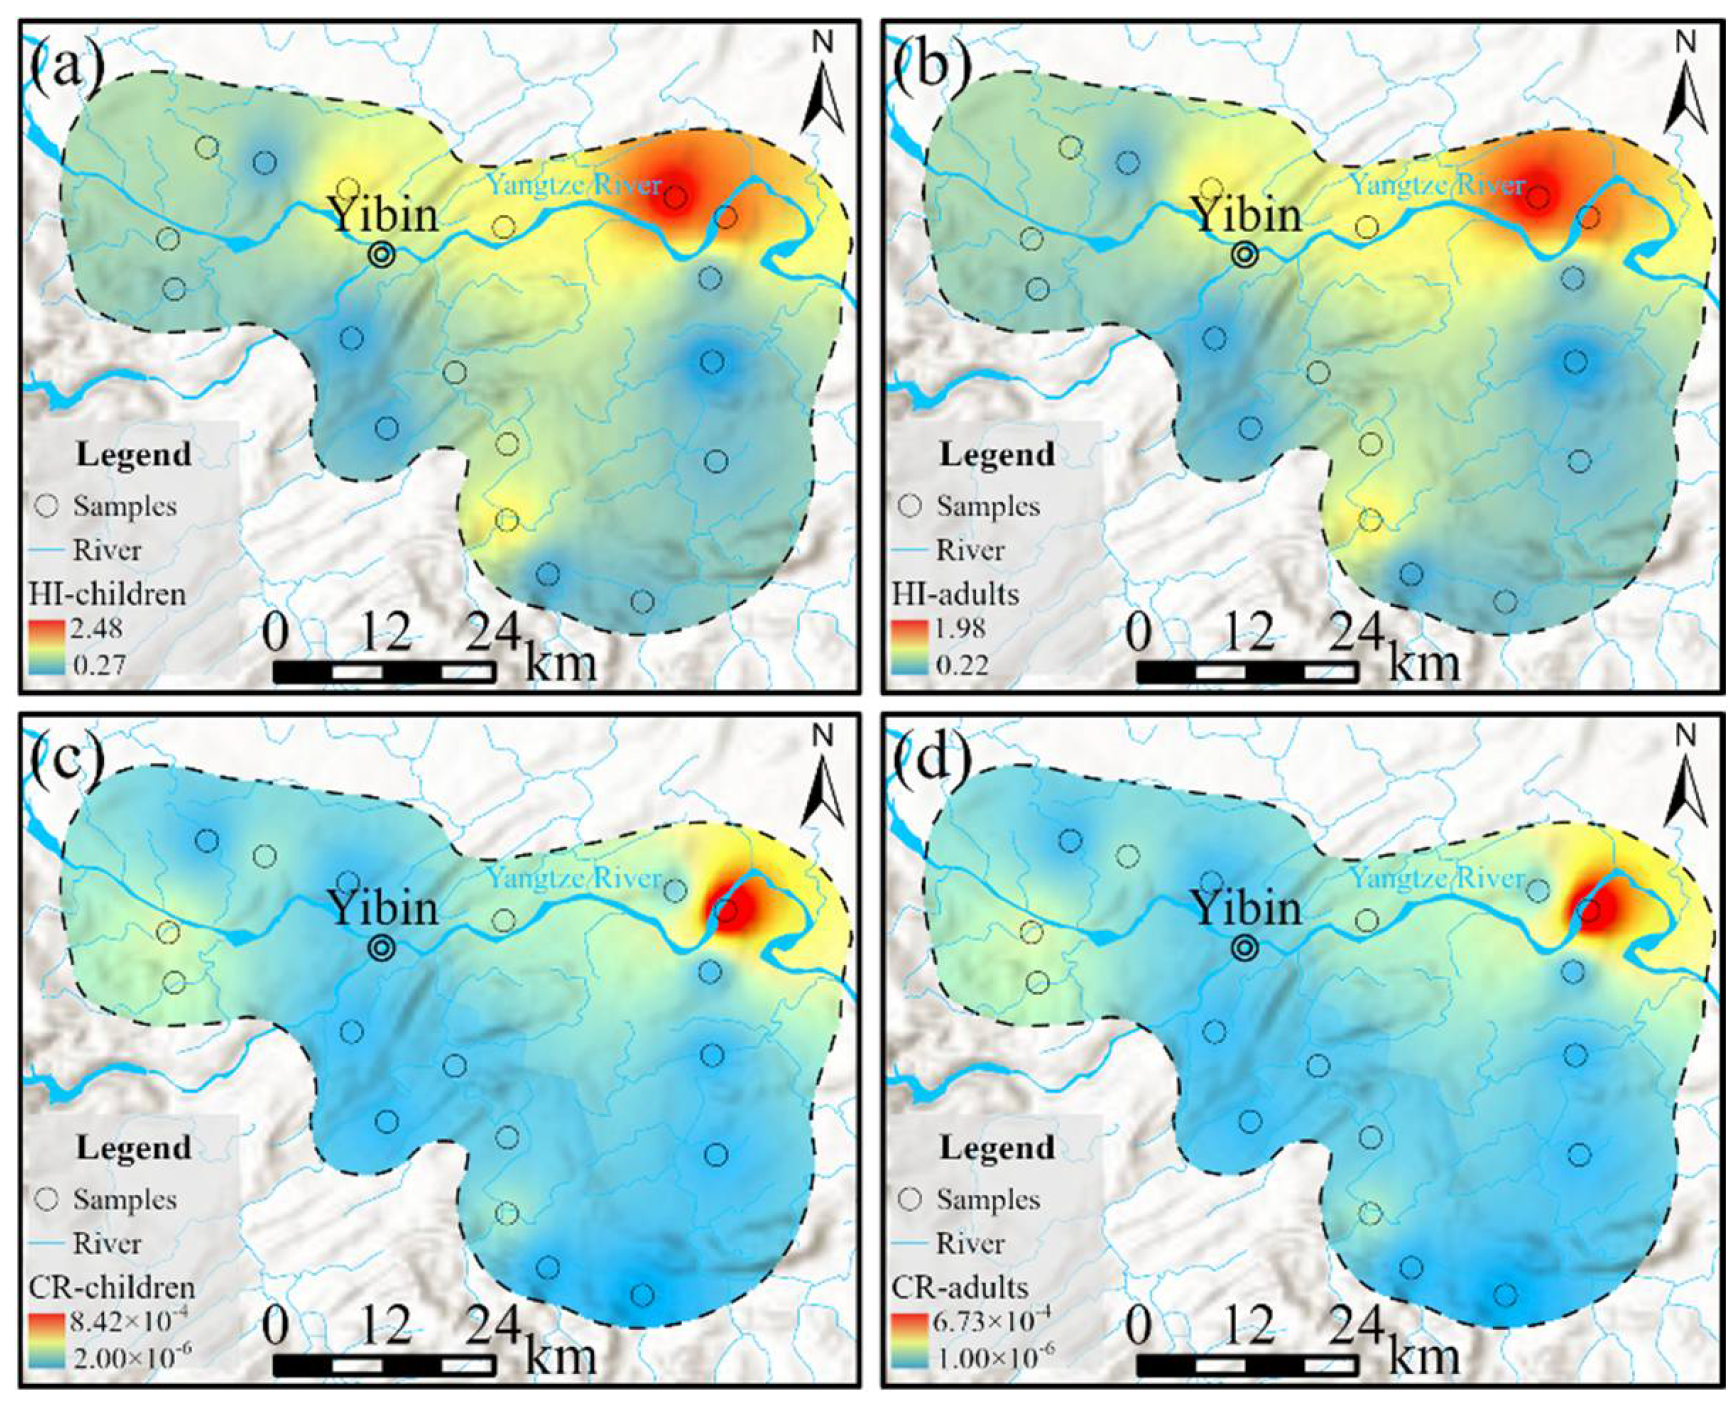
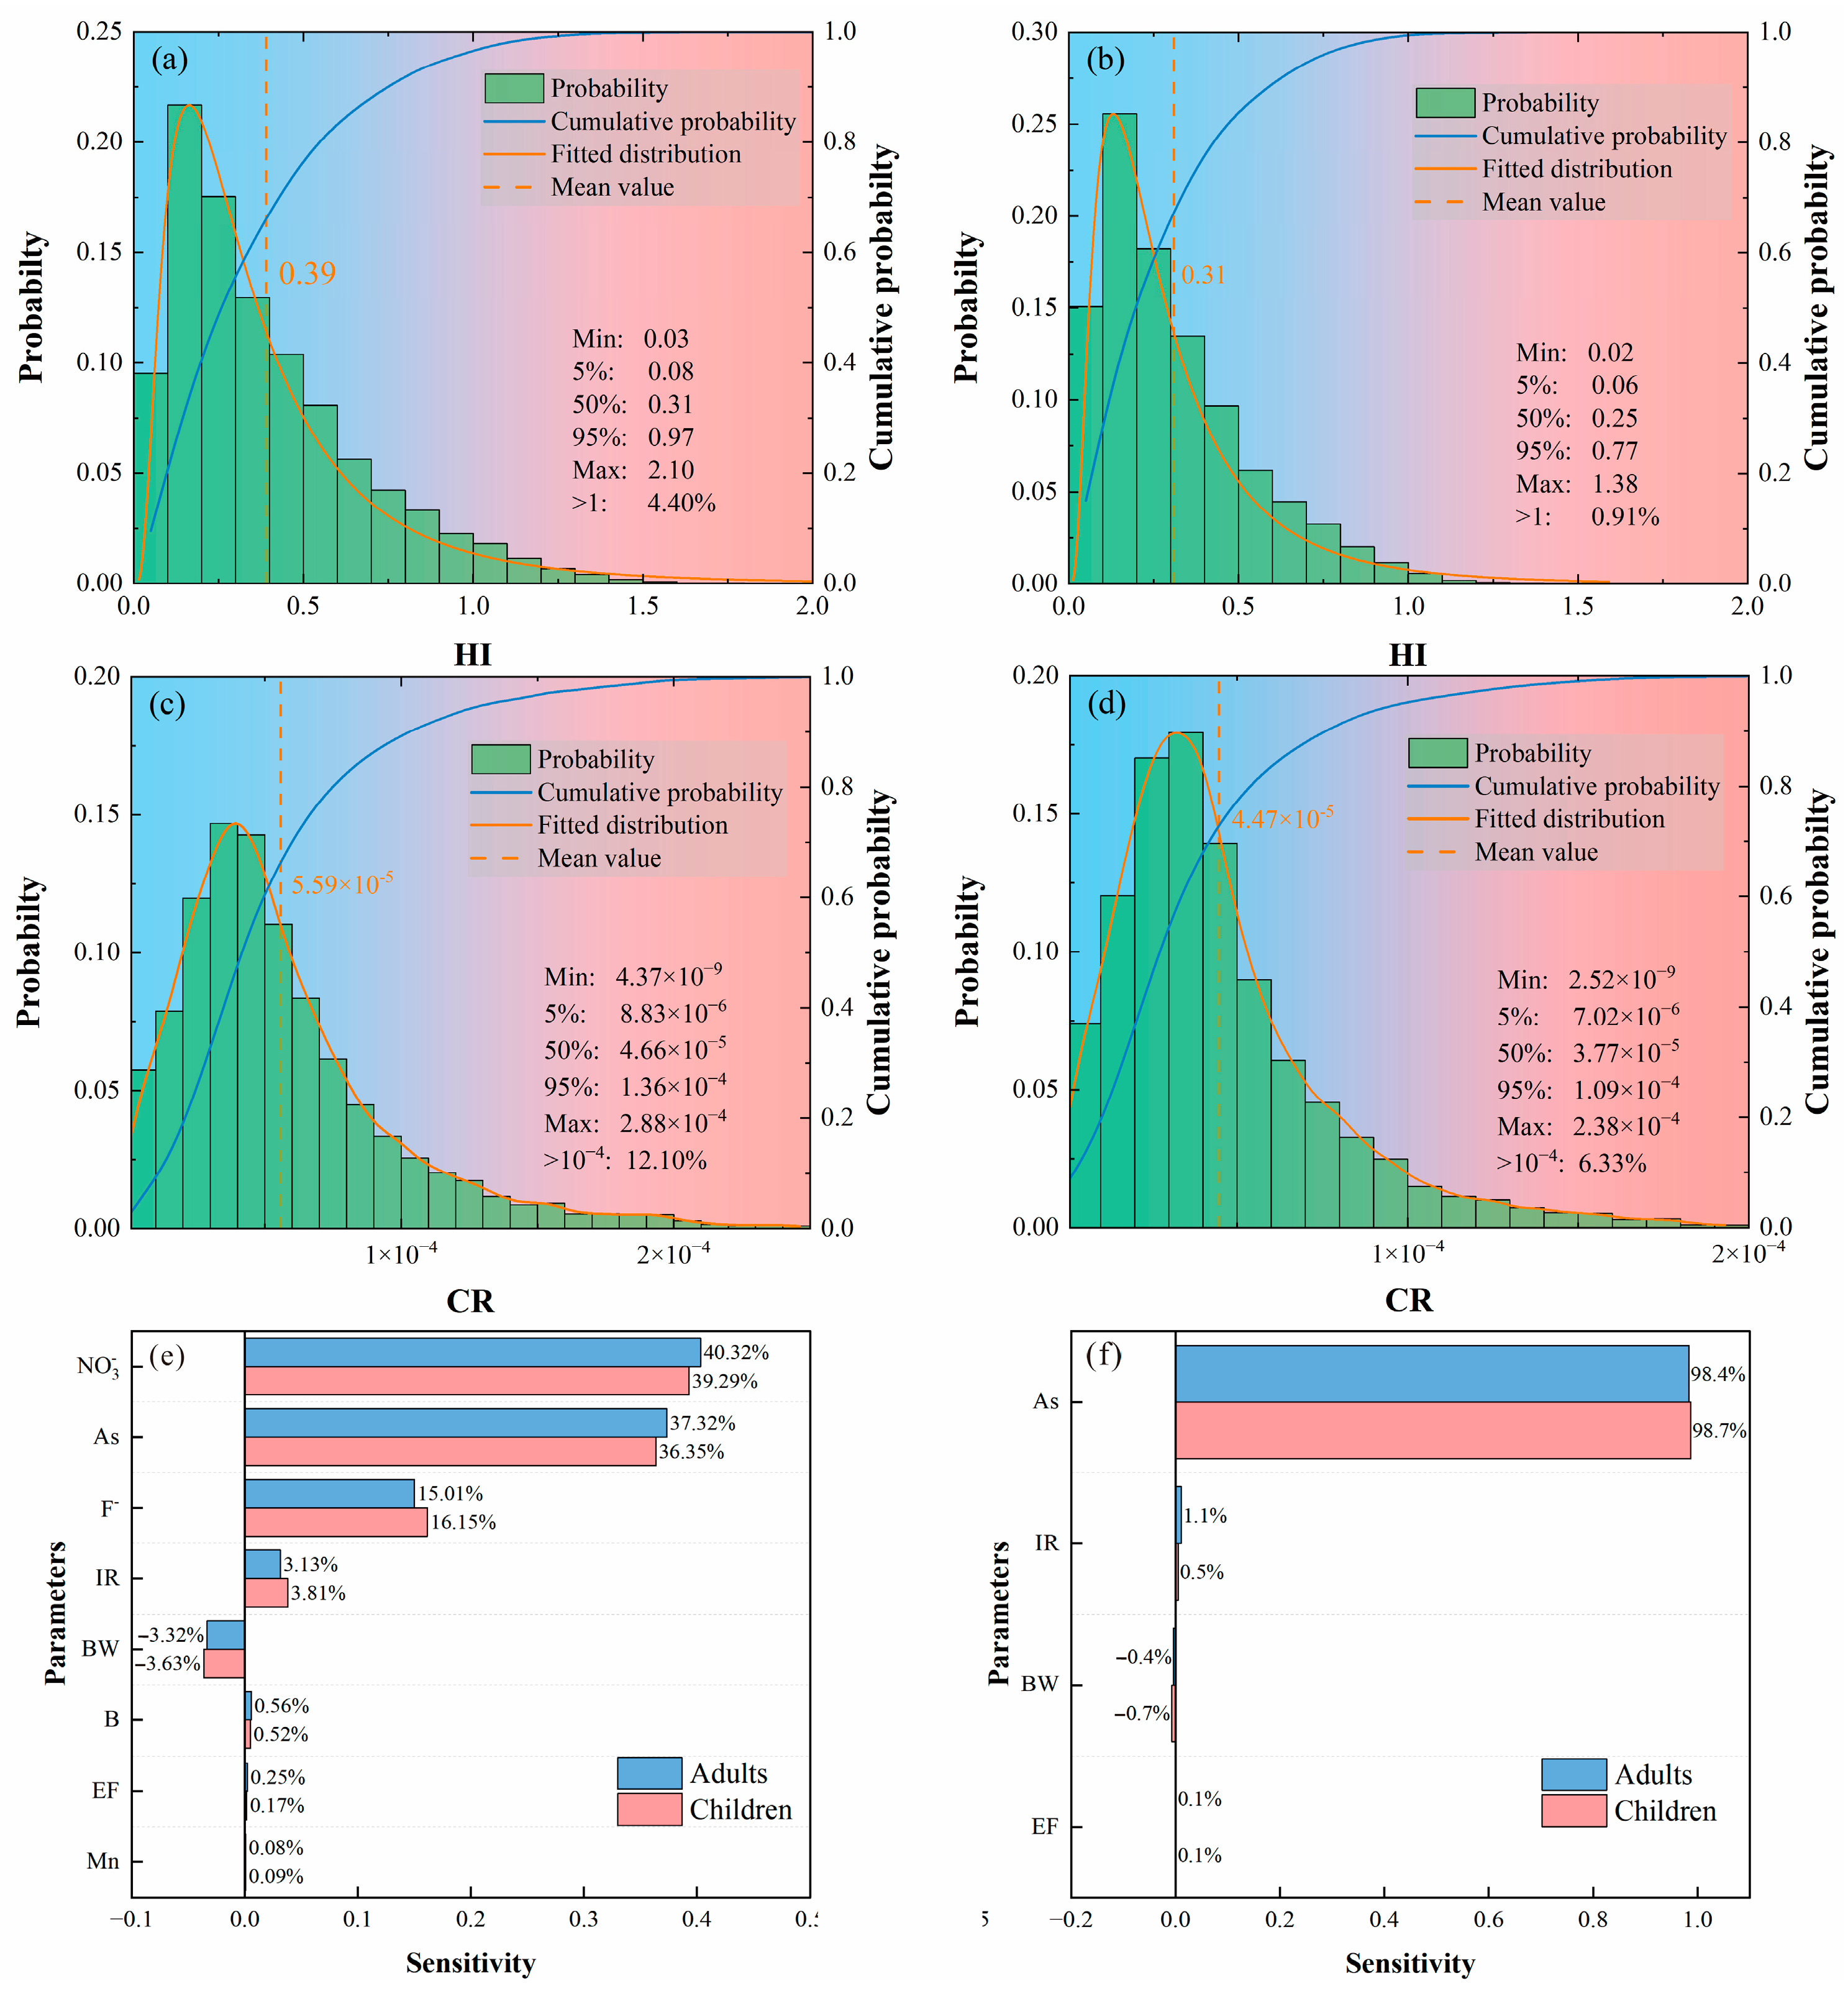
The results of EWQI revealed that groundwater in the study area was contaminated, which poses potential health risks to humans through drinking. Therefore, the B, Mn, NO3, F, and As were selected to evaluate the deterministic characteristics of non-carcinogenic and carcinogenic health risks through oral intake based on the HHR model, and the results were listed in Table 6. The HI values of children and adults were in the range of 0.27–2.48 and 0.22–1.98, with the mean values of 0.93 and 0.74, respectively. The percentage of exceedances of acceptable thresholds (1.0) was both 27.78%. In addition, the CR for children and adults varied from 2.00 × 10⁻⁶ to 8.42 × 10⁻⁴ and from 1.00 × 10⁻⁶ to 6.73 × 10⁻⁴, while the average values were 1.20 × 10⁻⁴ and 9.60 × 10⁻⁵, respectively. The proportion of samples exceeding the limit (1.00 × 10⁻⁴) was both 33.33%. As in other similar studies [64,65], children faced higher non-carcinogenic and carcinogenic health risks compared to adults, which is associated with their lower body weight [66].
The spatial distribution characteristics of HI and CR are shown in Figure 12. It can be seen that all the samples posed excess non-carcinogenic and carcinogenic risks for children and also exceeded them for adults. Where the exceedance samples were mainly located in the northern part, along the Yangtze River, while groundwater quality is generally better in the southern part. This indicates that groundwater contamination along the Yangtze River is more significant. Notably, a sample (D10) from the lower reaches of the Yangtze River had the highest non-carcinogenic risk as well as carcinogenic risk, which suggested severe contamination.

4.5.2. Probabilistic Analysis of Health Risk

The deterministic evaluation results could not reflect overall groundwater characteristics within the study area because it only based on finite sample information, and the health risk results they provided posed uncertainty [67]. Therefore, the probabilistic analysis was conducted by the Monte Carlo simulation for health risk assessment, and the results are shown in Figure 13. In general, groundwater poses higher health risks to children than adults, which is similar to the deterministic results. Furthermore, the maximum values, mean values, and ratios of exceedances of probabilistic results were lower than deterministic results, which indicated that the contamination of groundwater only occurred locally in the study area. The 95th percentile is usually considered the benchmark for reasonable maximum exposure [68], and the 95th percentiles of HI to children and adults were 0.97 and 0.77, both lower than 1.0. While the 95th percentiles of CR were both higher than 1.0 × 10⁻⁴ (1.36 × 10⁻⁴ for children, and 1.09 × 10⁻⁴ for adults). It suggested that groundwater poses acceptable non-carcinogenic health risks and slightly high carcinogenic health risks in the study area.
Overall, the probabilistic analysis provided a broader and more reasonable insight into health risk assessment. Although the results were similar to deterministic evaluation, it effectively attenuates the uncertainty due to limited sample information.

4.5.3. Sensitivity Analysis

To further understand the influence level of each parameter on the HHR assessment model and provide targeted suggestions for groundwater environmental management, a sensitivity analysis was performed based on the variance contribution from the Monte Carlo simulation [69]. As shown in Figure 13e, the non-carcinogenic risk assessment model response was greater for NO3 and As (>30%), followed by F (>15%). Where children were slightly more sensitive to body weight (BW) and ingestion rate (IR) than adults. Therefore, more attention needs to be paid to the safety of drinking water for children. In addition, adults were more sensitive to NO3 and As compared with children, which may be related to their much higher ingestion rate than children. For the carcinogenic risk assessment, the effect of As concentration was absolutely dominant (98.4% for adults and 98.7% for children), while the influence of other variables could almost be neglected (Figure 13f).

4.6. Drinking Water Protection Measures and Recommendations

Although the majority of groundwater samples in the study area meet standard limits for common trace elements, with only a few exceptions, there is still an observable trend of declining water quality. Additionally, the groundwater in this area poses significant carcinogenic and non-carcinogenic health risks, which present a serious concern for the health of local residents. To ensure safe water use and protect public health, the following recommendations are proposed:
  • Given the high hardness of groundwater in the study area, it is recommended that all drinking water undergo uniform softening and purification before consumption.
  • Conduct lectures and educational programs on groundwater health risks to raise residents’ awareness of water-related health issues. Encourage the installation of household water purification systems and recommend that residents consume purified groundwater.
  • The single location with relatively poor water quality is situated near the industrial park in the southern area of Tongluo Town. As such, local factories should enhance their wastewater purification and treatment processes to reduce the impact of discharged pollutants on groundwater quality.
  • Non-carcinogenic health risks associated with groundwater are primarily influenced by NO3 and As, with As being the predominant factor in carcinogenic risks. Therefore, focused control and purification efforts for NO3 and As are particularly important. Given that these contaminants primarily stem from agricultural and industrial activities, increased regulation and preventive measures in these sectors are essential.

5. Conclusions

In this study, researchers collected 18 groundwater samples from the main urban area of Yibin City in the Sichuan Basin, China. The analysis focused on the hydrochemical characteristics of groundwater, its source contributions, water quality, and health risks to humans. The research utilized basic hydrological geochemical analysis methods, stable isotope analysis methods, the Entropy Weight Water Quality Index (EWQI) model, and health risk assessment models, leading to the following main conclusions:
  • There are significant exceedances of pH, TDS, NO3, Mn, and As in the groundwater. The hardness of the water exhibits a trend ranging from soft to very hard, with the dominant hydrochemical type being HCO3-Ca. Strong cation exchange processes have occurred in the groundwater, with Na⁺ and K⁺ ions likely originating from the dissolution of silicates or cation exchange. The Ca2⁺ and Mg2⁺ ions are jointly controlled by the dissolution of carbonate and silicate minerals, primarily through the dissolution of calcite. The mineral saturation index of the groundwater indicates that dolomite and calcite are in a supersaturated state, with the saturation index of calcite being higher than that of dolomite.
  • The primary source of groundwater in the study area is atmospheric precipitation, and the evaporation process in the region is not significant. The Gibbs diagram indicates that water–rock interactions play a dominant role in the formation of the hydrochemical mechanisms of groundwater in the study area, with evaporation and precipitation not being prominent influences. The Sr in the groundwater is likely controlled by the dissolution of carbonate rocks, with its ion sources mainly influenced by the weathering and dissolution of limestone.
  • The overall water quality in the study area is good, with only one sample rated as relatively good, accounting for 5.56% of the total samples. Some areas along the riverbanks show a declining trend in water quality. The only point with relatively poor water quality is located near the industrial area in Tongluo Town in the southern part of the study area, suggesting that industrial activities in the south have severely impacted the local groundwater quality, necessitating attention to prevention and remediation measures.
  • In the study area, 72.22% of the groundwater samples have non-carcinogenic health risks below the limit of one, while 66.67% of the samples have carcinogenic health risks below the limit of 1.00 × 10⁻⁴. The maximum, average, and exceedance ratios of probabilistic results are all lower than those of deterministic results, although the overall trend is similar. Non-carcinogenic risks are primarily influenced by NO3 and As, followed by F. Children exhibit slightly higher sensitivity to body weight (BW) and intake rate (IR) than adults, while adults are more sensitive to NO3 and As than children. In carcinogenic risks, the concentration of As has a dominant effect. Despite the overall good water quality in the study area, there are still significant human health risks, indicating that the management and control of groundwater will be crucial for reducing these health risks.

Author Contributions

Conceptualization, and Z.X.; Data curation, X.W.; Formal analysis, S.Y.; Funding acquisition, Y.Z.; Investigation, X.X.; Methodology, X.W. and Y.W. (Yangshuang Wang); Project administration, X.X. and Y.W. (Ying Wang); Resources, Q.H. and H.L.; Software, J.Y.; Supervision, Y.Z.; Validation, Y.Z.; Writing—original draft, X.W.; Writing—review and editing, and Z.X. All authors have read and agreed to the published version of the manuscript.

Funding

This research was funded by the Yibin Scientific and Technology programs, with grant number SWJTU2021020007, SWJTU2021020008, YBSCXY2023020006, YBSCXY2023020007; Sichuan Transportation Science and Technology Program with grant number 2023-B-15; Open funding of State Key Laboratory of Nuclear Resources and Environment (East China University of Technology) with grant number 2022NRE06.

Data Availability Statement

The data presented in this study are available on request from the corresponding author.

Conflicts of Interest

Author Xiaojun Xu was employed by the company Sichuan Communication Surveying & Design Institute Co., Ltd. The remaining authors declare that the research was conducted in the absence of any commercial or financial relationships that could be construed as a potential conflict of interest.

References

  1. Uddin, M.J.; Jeong, Y.K. Urban river pollution in Bangladesh during last 40 years: Potential public health and ecological risk, present policy, and future prospects toward smart water management. Heliyon 2021, 7, e06107. [Google Scholar] [CrossRef]
  2. Trebuch, L.M.; Timmer, J.; van de Graaf, J.; Janssen, M.; Fernandes, T.V. Making waves: How to clean surface water with photogranules. Water Res. 2024, 260, 121875. [Google Scholar] [CrossRef]
  3. Abbasnia, A.; Yousefi, N.; Mahvi, A.H.; Nabizadeh, R.; Radfard, M.; Yousefi, M.; Alimohammadi, M. Evaluation of groundwater quality using water quality index and its suitability for assessing water for drinking and irrigation purposes: Case study of Sistan and Baluchistan province (Iran). Hum. Ecol. Risk Assess. Int. J. 2019, 25, 988–1005. [Google Scholar] [CrossRef]
  4. Mukherjee, I.; Singh, U.K. Groundwater fluoride contamination, probable release, and containment mechanisms: A review on Indian context. Environ. Geochem. Health 2018, 40, 2259–2301. [Google Scholar] [CrossRef]
  5. Al-Mussawi, W.H. Assessment of Groundwater Quality in UMM ER Radhuma Aquifer (Iraqi Western Desert) by Integration Between Irrigation Water Quality Index and GIS. J. Univ. Babylon 2014, 22, 201–217. [Google Scholar]
  6. Wang, S.; Chen, J.; Zhang, S.; Bai, Y.; Zhang, X.; Jiang, W.; Yang, S. Shallow groundwater quality and health risk assessment of fluoride and arsenic in Northwestern Jiangsu Province, China. Appl. Water Sci. 2024, 14, 119. [Google Scholar] [CrossRef]
  7. GB/T 14848-2017; GAQS (General Administration of Quality Supervision) and SAC (Standardization Administration of China): Standard for Groundwater Quality. Standardization Administration of the PRC: Beijing, China, 2017.
  8. Harris, R.C.; Skinner, A.C. Controlling diffuse pollution of groundwater from agriculture and industry. J. Inst. Water Environ. Manag. 1992, 6, 569–574. [Google Scholar] [CrossRef]
  9. Tokatli, C. Health risk assessment of toxic metals in surface and groundwater resources of a significant agriculture and industry zone in Turkey. Environ. Earth Sci. 2021, 80, 156. [Google Scholar] [CrossRef]
  10. Wang, Y.; Li, R.; Wu, X.; Yan, Y.; Wei, C.; Luo, M.; Xiao, Y.; Zhang, Y. Evaluation of Groundwater Quality for Drinking and Irrigation Purposes Using GIS-Based IWQI, EWQI and HHR Model. Water 2023, 15, 2233. [Google Scholar] [CrossRef]
  11. Cervantes-Servin, A.I.; Arora, M.; Peterson, T.J.; Pettigrove, V. Seasonal estimation of groundwater vulnerability. Sci. Rep. 2023, 13, 9720. [Google Scholar] [CrossRef] [PubMed]
  12. Wiebe, A.J.; McKenzie, J.M.; Hamel, E.; Rudolph, D.L.; Mulligan, B.; de Grandpré, I. Groundwater vulnerability in the Yukon and Northwest Territories, Canada. Hydrogeol. J. 2024, 32, 341–346. [Google Scholar] [CrossRef]
  13. Maggi, F.T.; Fiona HMTubiello, F.N. Agricultural pesticide land budget and river discharge to oceans. Nature 2023, 620, 1013–1017. [Google Scholar] [CrossRef] [PubMed]
  14. Saha, N.; Rahman, M.S.; Ahmed, M.B.; Zhou, J.L.; Ngo, H.H.; Guo, W. Industrial metal pollution in water and probabilistic assessment of human health risk. J. Environ. Manag. 2017, 185, 70–78. [Google Scholar] [CrossRef]
  15. Duan, L.; Zhang, W.; Qiu, Y.; Chen, S.; Wang, D.; Luo, Y.; Qu, S.; Gao, R.; Xue, B.; Wang, G.; et al. Identifying the spatio-seasonal pattern of hydrochemical evolution and surface water-groundwater interaction in a large urban river basin, Northwest China. Sci. Total Environ. 2024, 944. [Google Scholar] [CrossRef]
  16. Zhang, C.; Dionysiou, D.D.; Wen, R.; Zhang, H.; Wan, X.; Wang, X.; Li, F.; Li, Y.; Zhou, Q.; Ying, G.-G.; et al. Inference of emission history of neonicotinoid pesticides from marine sediment cores impacted by riverine runoff of a developed agricultural region: The Pearl River Basin, China. Water Res. 2022, 218, 118475. [Google Scholar] [CrossRef] [PubMed]
  17. Othax, N.; Peluso, F.; Castelain, J.G. Health risk due to fluorides, nitrates and arsenic in groundwater: The case of the city of Tres Arroyos, Argentina. Rev. Int. Contam. Ambient. 2014, 30, 27–41. [Google Scholar]
  18. Tan, H.; Zhang, C.; Li, J.; Zeng, M.; Cheng, Y. Human Health Risk Assessment of Elevated Fe and Mn Intake in Groundwater in Yangtze Catchment. Groundwater 2024, 62, 226–235. [Google Scholar] [CrossRef]
  19. Jing, X.; Wang, X.; Zhou, J.; Lu, Y. Spatiotemporal variations and health risks of arsenic in soils of the Pearl River Basin, China. Sci. Total Environ. 2024, 951, 175393. [Google Scholar] [CrossRef] [PubMed]
  20. Adimalla, N.; Qian, H. Groundwater quality evaluation using water quality index (WQI) for drinking purposes and human health risk (HHR) assessment in an agricultural region of Nanganur, south India. Ecotoxicol. Environ. Saf. 2019, 176, 153–161. [Google Scholar] [CrossRef]
  21. Vlachou, C.; Hofstädter, D.; Rauscher-Gabernig, E.; Griesbacher, A.; Fuchs, K.; König, J. Probabilistic risk assessment of nitrates for Austrian adults and estimation of the magnitude of their conversion into nitrites. Food Chem. Toxicol. 2020, 145, 111719. [Google Scholar] [CrossRef]
  22. Mosaferi, M.; Jahani Moghaddam, H.; Shaker Khatibi, M.; Esmat Saatloo, S.M.; Nemati Mansour, S.; Nazmara, S. Spatial variation and quantitative screening level assessment of human risk from boron exposure in groundwater resources of western edge of the Lake Urmia, Iran. Int. J. Environ. Health Res. 2020, 30, 237–250. [Google Scholar] [CrossRef] [PubMed]
  23. Zhang, K.; Li, X.; Zheng, X.; Qiang, C.; Zhang, X. Human health risk assessment and spatial distribution of fluoride from shallow groundwater in a region of southwest China. J. Water Supply Res. Technol.-AQUA 2020, 69, 733–747. [Google Scholar] [CrossRef]
  24. Aboud, A.A.; Tidball, A.M.; Kumar, K.K.; Neely, M.D.; Ess, K.C.; Erikson, K.M.; Bowman, A.B. Genetic risk for Parkinson’s disease correlates with alterations in neuronal manganese sensitivity between two human subjects. NeuroToxicology 2012, 33, 1443–1449. [Google Scholar] [CrossRef]
  25. Teschke, R. Copper, Iron, Cadmium, and Arsenic, All Generated in the Universe: Elucidating Their Environmental Impact Risk on Human Health Including Clinical Liver Injury. Int. J. Mol. Sci. 2024, 25, 6662. [Google Scholar] [CrossRef]
  26. Tang, L.; Yao, R.; Zhang, Y.; Ding, W.; Wang, J.; Kang, J.; Liu, G.; Zhang, W.; Li, X. Hydrochemical analysis and groundwater suitability for drinking and irrigation in an arid agricultural area of the Northwest China. J. Contam. Hydrol. 2023, 259, 104256. [Google Scholar] [CrossRef] [PubMed]
  27. Yan, T.; Shen, S.-L.; Zhou, A. Indices and models of surface water quality assessment: Review and perspectives. Environ. Pollut. 2022, 308, 119611. [Google Scholar] [CrossRef]
  28. Adimalla, N. Application of the Entropy Weighted Water Quality Index (EWQI) and the Pollution Index of Groundwater (PIG) to Assess Groundwater Quality for Drinking Purposes: A Case Study in a Rural Area of Telangana State, India. Arch. Environ. Contam. Toxicol. 2021, 80, 31–40. [Google Scholar] [CrossRef] [PubMed]
  29. Ahmad, S.; Umar, R.; Ahmad, I. Assessment of groundwater quality using Entropy-Weighted Quality Index (EWQI) and multivariate statistical techniques in Central Ganga plain, India. Environ. Dev. Sustain. 2024, 26, 1615–1643. [Google Scholar] [CrossRef]
  30. USEPA. Exposure Factors Handbook, 2011 ed; United States Environmental Protection Agency: Washington, DC, USA, 2011. [Google Scholar]
  31. Yao, R.; Zhang, Y.; Yan, Y.; Wu, X.; Uddin, M.G.; Wei, D.; Huang, X.; Tang, L. Natural background level, source apportionment and health risk assessment of potentially toxic elements in multi-layer aquifers of arid area in Northwest China. J. Hazard. Mater. 2024, 479, 135663. [Google Scholar] [CrossRef] [PubMed]
  32. Liu, Z.; Du, Q.; Guan, Q.; Luo, H.; Shan, Y.; Shao, W. A Monte Carlo simulation-based health risk assessment of heavy metals in soils of an oasis agricultural region in northwest China. Sci. Total Environ. 2023, 857, 159543. [Google Scholar] [CrossRef]
  33. Zhang, T.S.; Chen, X.H.; Jiang, Z.Y.; Lan, G.Z. Occurrence of Groundwater and Its Influence Factors in Red Bed Region, Sichuan Basin—A Case Study of Nanchong City. Acta Geol. Sichuan 2005, 25, 97–100. [Google Scholar]
  34. Li, X.F. Environmental Problems of Water Resources and Sustainable Development Management in Sichuan. Reform Econ. Syst. 2002, 6, 16–18. (In Chinese) [Google Scholar]
  35. Han, B.; Zhou, W.; Chen, R.; Tian, S.; Gong, H.; Wang, Y.; Xu, Q.; Bian, M. Multi-factor analysis of the quality of cellar mud of Luzhou-flavor liquor in Yibin production area. Food Sci. Nutr. 2024, 12, 5231–5249. [Google Scholar] [CrossRef] [PubMed]
  36. Wang, Y.; Zhou, B.; Hu, X. A value assessment system for the conservation and utilization of decentralized distilleries in the architectural heritage of the brewing industry: A case study of Yibin city, China. J. Asian Archit. Build. Eng. 2024. [Google Scholar] [CrossRef]
  37. Wei, L.; Kong, D.; Luo, Y.; Jia, Y.; Shu, Q. Groundwater Occurrence Environment in the Red Beds of Southern Sichuan and the Hydro-chemical Characteristic:A Case Study in Pingshan County,Yibin City. Explor. Eng. Rock Soil Drill. Tunneling 2018, 45, 145–150. [Google Scholar]
  38. Apollaro, C.; Buccianti, A.; Vespasiano, G.; Vardè, M.; Fuoco, I.; Barca, D.; Bloise, A.; Miriello, D.; Cofone, F.; Servidio, A.; et al. Comparative geochemical study between the tap waters and the bottled mineral waters in Calabria (Southern Italy) by compositional data analysis (CoDA) developments. Appl. Geochem. 2019, 107, 19–33. [Google Scholar] [CrossRef]
  39. Luo, H.; Zhang, Y.; Liu, J.; Yang, S.; Wu, X.; Wang, Y. Hydrochemical appraisal and suitability for irrigation and portable purposes in eastern Himalayan syntaxis of Tibet Plateau. Phys. Chem. Earth Parts A/B/C 2024, 136, 103713. [Google Scholar] [CrossRef]
  40. Petelet-Giraud, E.; Négrel, P.; Casanova, J. Tracing surface water mixing and groundwater inputs using chemical and isotope fingerprints (delta O-18-delta H-2, Sr-87/Sr-86) at basin scale: The Loire River (France). Appl. Geochem. 2018, 97, 279–290. [Google Scholar] [CrossRef]
  41. Blum, J.D.; Erel, Y.; Brown, K. 87Sr/86Sr ratios of sierra nevada stream waters: Implications for relative mineral weathering rates. Geochim. Cosmochim. Acta 1993, 57, 5019–5025. [Google Scholar] [CrossRef]
  42. Gautam, U.; Tiwari, V.; Tripathi, V.K. Evaluation of groundwater quality of Prayagraj city using entropy water quality index (EWQI) and new integrated water quality index (IWQI). Sustain. Water Resour. Manag. 2022, 8, 57. [Google Scholar] [CrossRef]
  43. Paliwal, K.V.; Delhi, N. Irrigation with saline water. Water Technol. Cent. Indian Agric. Res. Inst 1975, 39, 1973. [Google Scholar] [CrossRef]
  44. Li, P.; Qian, H.; Wu, J. Groundwater Quality Assessment Based on Improved Water Quality Index in Pengyang County, Ningxia, Northwest China. J. Chem. 2010, 7, S209–S216. [Google Scholar]
  45. Spandana, M.P.; Suresh, K.R.; Prathima, B. Developing an Irrigation Water Quality Index for Vrishabavathi Command Area. Int. J. Eng. Res. Technol 2013, 2, 821–830. [Google Scholar]
  46. Luo, Y.; Xiao, Y.; Hao, Q.; Zhang, Y.; Zhao, Z.; Wang, S.; Dong, G. Groundwater geochemical signatures and implication for sustainable development in a typical endorheic watershed on Tibetan plateau. Environ. Sci. Pollut. Res. 2021, 28, 48312–48329. [Google Scholar] [CrossRef]
  47. You, D.; Zhou, Y.; Wang, B.; Li, K.; Chang, J.X.; Lu, C. Groundwater health risk assessment of North China Plain based on Monte Carlo model sensitivity analysis and morphological analysis: A case study of Shijiazhuang City. Water Environ. Res. 2024, 96. [Google Scholar] [CrossRef]
  48. Alharbi, T.; El-Sorogy, A.S. Groundwater quality and health risk assessment of nitrate and fluoride in Al Qaseem area, Saudi Arabia. Open Chem. 22, 20240042. [CrossRef]
  49. Aralu, C.C.; Okoye, P.A.C.; Abugu, H.O.; Ochiagha, K.E.; Egbueri, J.C. Evaluating the seasonal variations of risks associated with potentially toxic elements in underground water sources near a dumpsite in Awka, Nigeria. J. Hazard. Mater. Adv. 2024, 15, 100440. [Google Scholar] [CrossRef]
  50. Freeze, R.A.; Cherry, J.A. Groundwater; Prentice-Hall: Englewood Cliffs, NJ, USA, 1979; p. 370. [Google Scholar]
  51. Apollaro, C.; Caracausi, A.; Paternoster, M.; Randazzo, P.; Aiuppa, A.; De Rosa, R.; Fuoco, I.; Mongelli, G.; Muto, F.; Vanni, E.; et al. Fluid geochemistry in a low-enthalpy geothermal field along a sector of southern Apennines chain (Italy). J. Geochem. Explor. 2020, 219, 106618. [Google Scholar] [CrossRef]
  52. Feth, J.H. Mechanisms controlling world water chemistry—evaporation-crystallization process. Science 1971, 172, 870–871. [Google Scholar] [CrossRef] [PubMed]
  53. Gaillardet, J.; Dupré, B.; Louvat, P.; Allegre, C.J. Global silicate weathering and CO2 consumption rates deduced from the chemistry of large rivers. Chem. Geol. 1999, 159, 3–30. [Google Scholar] [CrossRef]
  54. Wen, X.H.; Wu, Y.Q.; Wu, J. Hydrochemical characteristics of groundwater in the Zhangye Basin, Northwestern China. Environ. Geol. 2008, 55, 1713–1724. [Google Scholar] [CrossRef]
  55. Zhang, B.; Zhao, D.; Zhou, P.; Qu, S.; Liao, F.; Wang, G. Hydrochemical characteristics of groundwater and dominant water–rock interactions in the Delingha Area, Qaidam Basin, Northwest China. Water 2020, 12, 836. [Google Scholar] [CrossRef]
  56. Zongxing, L.; Qi, F.; Song, Y.; Wang, Q.J.; Yang, J.; Yongge, L.; Jianguo, L.; Xiaoyan, G. Stable isotope composition of precipitation in the south and north slopes of Wushaoling Mountain, northwestern China. Atmos. Res. 2016, 182, 87–101. [Google Scholar] [CrossRef]
  57. Liu, J.D.; Zhao, Y.C.; Liu, E.K.; Wang, D. Discussion on the stable isotope time-space distribution law of china atmospheric precipitation. Site Investig. Sci. Technol. 1997, 3, 34–39. (In Chinese) [Google Scholar]
  58. Craig, H. Isotopic variations in meteoric waters. Science 1961, 133, 1702–1703. [Google Scholar] [CrossRef] [PubMed]
  59. Zhihua, H.U.; Jianji, T.I.A.N.; Fei, L.Y.U. Isotope characteristics of lithium-rich hot springs and its genesis in Batang area of western Sichuan. World Nucl. Geosci. 2024, 41, 88–104. (In Chinese) [Google Scholar]
  60. Tang, Y.; Wang, X.; Pang, X.; Chen, S.; Zhang, X.; Sun, P. Hydrochemical characteristics and genesis of Xujiahe Formation formation water in Jianyang,central Sichuan: Evidence from hydrochemistry and strontium isotope. Fault-Block Oil Gas Field 2024, 31, 444–452. (In Chinese) [Google Scholar]
  61. Hernández-Terrones, L.M.; Street, J.; Null, K.; Paytan, A. Groundwater chemistry and Sr isotope ratios shed light on connectivity and water-rock interactions in the coastal aquifer of the Caribbean coast, Mexico. Cont. Shelf Res. 2021, 212, 104293. [Google Scholar] [CrossRef]
  62. Pu, J.; Daoxian, Y.; Cheng, Z.; Heping, Z. Identifying the Sources of Solutes in Karst Groundwater in Chongqing, China: A Combined Sulfate and Strontium Isotope Approach. J. Geol. Engl. Ed. 2012, 86, 980–992. [Google Scholar]
  63. Wang, Y.; Yuan, X.; Zhang, Y.; Zhang, X.; Xiao, Y.; Duo, J.; Huang, X.; Sun, M.; Lv, G. Hydrochemical, D–O–Sr isotopic and electromagnetic characteristics of geothermal waters from the Erdaoqiao area, SW China: Insights into genetic mechanism and scaling potential. Ore Geol. Rev. 2023, 158, 105486. [Google Scholar] [CrossRef]
  64. Yuan, R.; Li, Z.; Guo, S. Health risks of shallow groundwater in the five basins of Shanxi, China: Geographical, geological and human activity roles. Environ. Pollut. 2023, 316, 120524. [Google Scholar] [CrossRef]
  65. Zheng, Y.; Wei, D.; Gan, J.; Zou, L.; Zhu, R.; Zhang, Y. Hydrochemical insights, water quality, and human health risk assessment of groundwater in a coastal area of southeastern China. Environ. Monit. Assess. 2024, 196, 959. [Google Scholar] [CrossRef] [PubMed]
  66. Wang, Y.; Li, P. Appraisal of shallow groundwater quality with human health risk assessment in different seasons in rural areas of the Guanzhong Plain (China). Environ. Res. 2022, 207, 112210. [Google Scholar] [CrossRef]
  67. Kaur, L.; Rishi, M.S.; Siddiqui, A.U. Deterministic and probabilistic health risk assessment techniques to evaluate non-carcinogenic human health risk (NHHR) due to fluoride and nitrate in groundwater of Panipat, Haryana, India. Environ. Pollut. 2020, 259, 113711. [Google Scholar] [CrossRef]
  68. Zhang, Y.; Yan, Y.; Yao, R.; Wei, D.; Huang, X.; Luo, M.; Wei, C.; Chen, S.; Yang, C. Natural background levels, source apportionment and health risks of potentially toxic elements in groundwater of highly urbanized area. Sci. Total Environ. 2024, 935, 173276. [Google Scholar] [CrossRef] [PubMed]
  69. Gao, Y.; Qian, H.; Zhou, Y.; Chen, J.; Wang, H.; Ren, W.; Qu, W. Cumulative health risk assessment of multiple chemicals in groundwater based on deterministic and Monte Carlo models in a large semiarid basin. J. Clean. Prod. 2022, 352, 131567. [Google Scholar] [CrossRef]
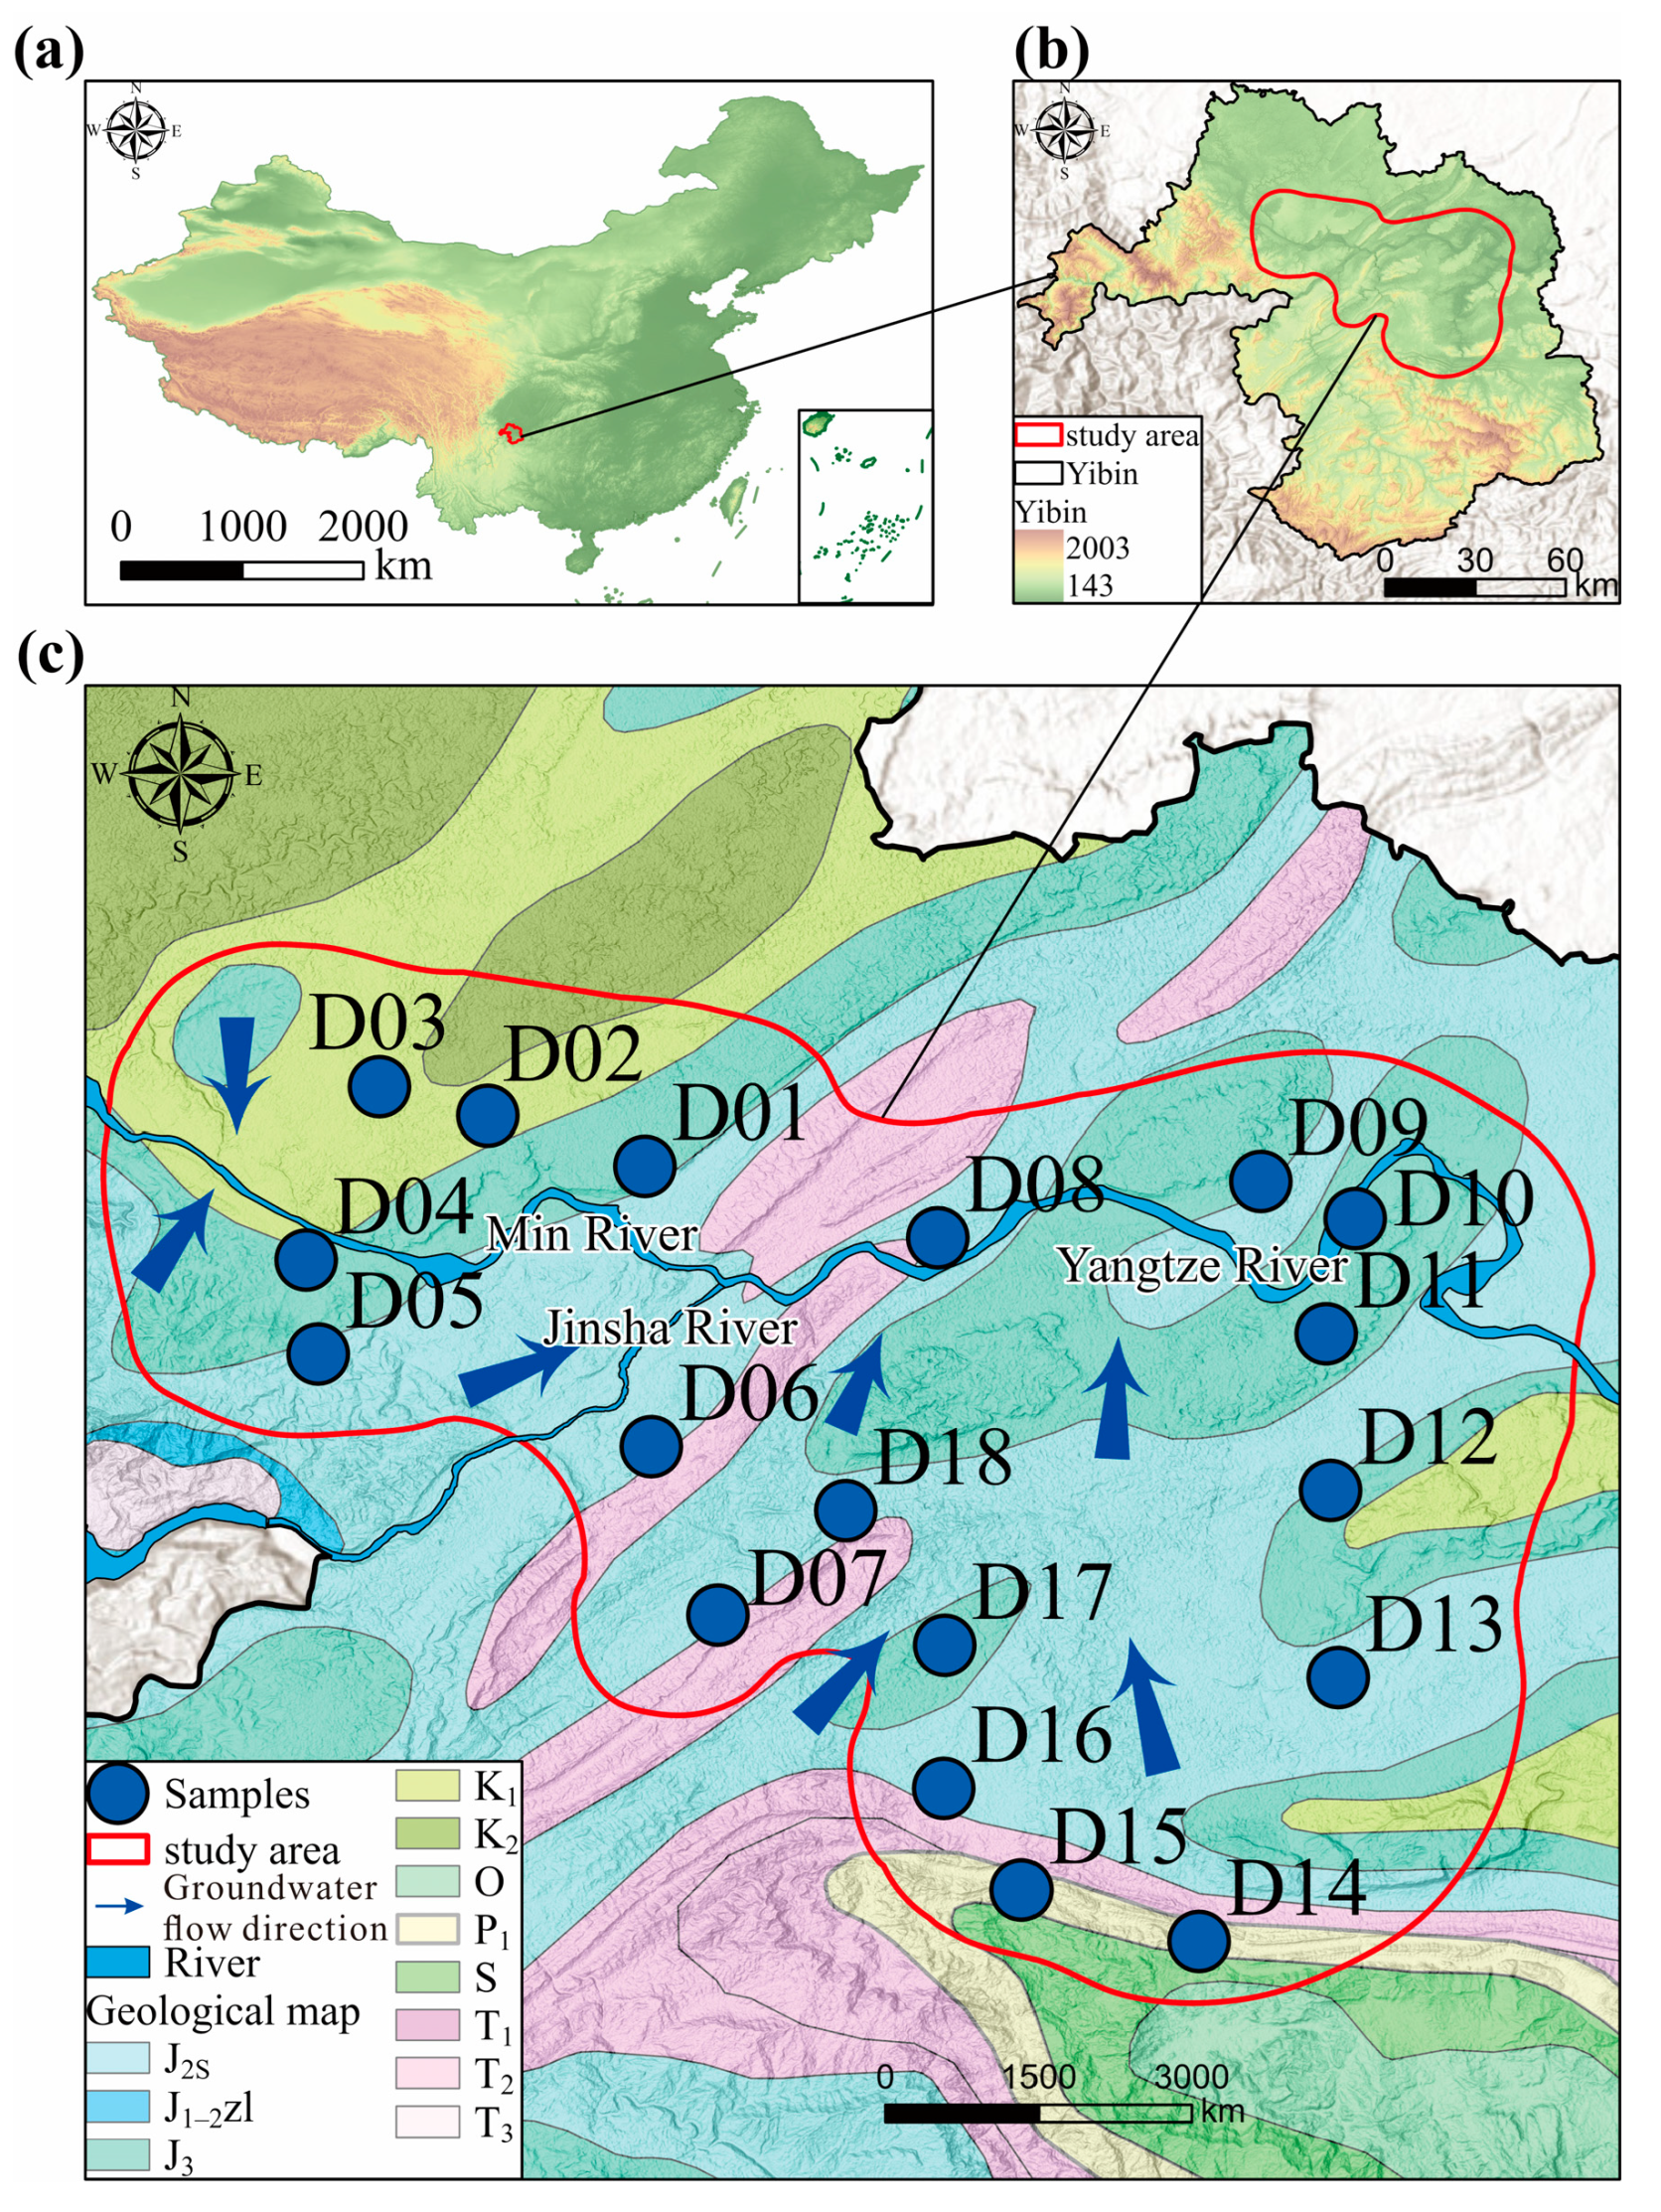
Figure 1. (a) Location of Yibin in China. (b) Location of study area in Yibin. (c) Location of groundwater sampling sites and geological map in the study area (sample size = 18). J2S refers to the Middle Jurassic strata, J1–2zl refers to the Lower to Middle Jurassic strata, J3 represents the Upper Jurassic strata, K1 denotes the Lower Cretaceous strata, and K2 represents the Upper Cretaceous strata. O refers to the Ordovician strata, P1 indicates the Lower Permian strata, S corresponds to the Silurian strata, while T1, T2, and T3 represent the Lower, Middle, and Upper Triassic strata.
Water 16 03599 g001
Figure 2. The different types of land use in the study area and the distribution of the samples.
Water 16 03599 g002
Figure 3. The flowchart of the workflows in this study.
Water 16 03599 g003
Figure 4. Box plots of macronutrient ions and trace elements in groundwater in the main urban area of Yibin City. (ao) represent the box plots of pH, TDS, Ca2+, Mg2+, Na+, F, Cl, SO₄², NO3, B, Mn, As, HCO3, temperature (T), and dissolved oxygen (DO), respectively.
Water 16 03599 g004
Figure 5. Spatial distribution map of major elements: (a) pH, (b) TDS, (c) Ca2+, (d) Mg2+, (e) Na+, (f) F, (g) Cl, (h) SO42−, (i) NO3, (j) B, (k) Mn, and (l) As (sample size = 18).
Water 16 03599 g005
Figure 6. (a) Groundwater Total Hardness Classification Chart. (b) Piper trilinear diagram of samples in the study area.
Water 16 03599 g006
Figure 7. Cation–Anion Molar Mixing Ratio Diagram for (a) Cations and (b) Anions; and Hydrogeochemical processes based on Gibbs diagrams for (c) anions and (d) cations.
Water 16 03599 g007
Figure 8. Scatter plots of (a) Cl vs. Na+ + K+; (b) (HCO3 + SO42−) vs. (Ca2+ + Mg2+); (c) HCO3 vs. Ca2+; (d) HCO3 vs. (Ca2+ + Mg2+); (e) SO42− vs. Ca2+; (f) Ca2+ vs. Mg2+; (g) Ca2+ + Mg2+-(HCO3 + SO42−) vs. Na+ + K+−Cl; (h) chloro alkaline indices CAI-Ι and CAI-П; (i) Saturation index of calcite, dolomite, gypsum, and halite.
Water 16 03599 g008
Figure 9. Scatterplot of stable isotopes of hydrogen and oxygen in groundwater samples from the main city of Yibin. GMWL refers to [58], LMWL refers to [59].
Water 16 03599 g009
Figure 10. Correlation diagram for (a) Sr vs. 87Sr/86Sr; (b) Mg2+/Ca2+ vs. 87Sr/86Sr.
Water 16 03599 g010
Figure 11. Spatial distribution of groundwater quality for drinking purposes based on EWQI.
Water 16 03599 g011
Figure 12. Spatial distribution characteristics of HI and CR. (a) HI to children; (b) HI to adults; (c) CR to children; (d) CR to adults.
Water 16 03599 g012
Figure 13. Probabilistic assessment results based on the Monte Carlo simulation: (a) HI to children; (b) HI to adults; (c) CR to children; (d) CR to adults and the sensitivities of each parameter on the HHR model: (e) Sensitivities on HI; (f) Sensitivities on CR.
Water 16 03599 g013
Table 1. The reference dose (RfD) and slope factor (SF) of potentially toxic elements used for non-carcinogenic and carcinogenic health risk assessment.
ParametersUnitMnBAsNO3F
RfDmg/(kg·d)0.140.20.00031.60.06
SFkg·d/mg--1.5--
Table 2. The hydrochemical parameters in the simulation path.
PathNa+Mg2+K+Ca2+FClSO42−HCO3pH
D315.705.834.3123.540.0216.8115.5570.346.38
D1046.3926.061.82154.030.1712.86201.55451.677.25
Table 3. Water–rock interaction relationship.
Mineral PhaseChemical Equation
GypsumCaSO4 = Ca2+ + SO42−
CalciteCaCO3 = Ca2+ + CO32−
DolomiteCaMg(CO3)2 = Ca2+ + Mg2+ + 2CO32−
HaliteNaCl = Na+ + Cl
FluoriteCaF2 = Ca2+ + 2F
CO2 (g)CO2 + H2O = H2CO3
Table 4. The result of mineral saturation index.
PathSamplesCalciteDolomiteFluoriteGypsumHaliteCO2 (g)
D3 → D10D03−1.72−3.70−4.80−2.74−8.12−1.45
D100.580.73−2.35−1.13−7.82−1.55
Table 5. The result of reverse hydrogeochemical simulation (unit: mmol/L).
PathCalciteDolomiteFluoriteGypsumHaliteCO2 (g)
D3 → D105.971 × 10−22.693 × 10−27.499 × 10−51.054 × 10−15.841 × 10−32.447 × 10⁻¹
Note: Positive values indicate the amount moved into solution, and negative values indicate the amount moved out of solution.
Table 6. Statistical characteristics of health risk assessment.
ParametersHICR
ChildrenAdultsChildrenAdults
Min0.27 0.22 2.00 × 10−61.00 × 10−6
5%0.39 0.31 1.70 × 10−51.40 × 10−5
Median0.74 0.59 5.10 × 10−54.10 × 10−5
Mean0.93 0.74 1.20 × 10−49.60 × 10−5
95%2.11 1.69 3.07 × 10−42.45 × 10−4
Max2.48 1.98 8.42 × 10−46.73 × 10−4
Unacceptable27.78%27.78%33.33%33.33%
Disclaimer/Publisher’s Note: The statements, opinions and data contained in all publications are solely those of the individual author(s) and contributor(s) and not of MDPI and/or the editor(s). MDPI and/or the editor(s) disclaim responsibility for any injury to people or property resulting from any ideas, methods, instructions or products referred to in the content.