Article

Morphological Characteristics and Annual Population Dynamics of Microcystis (Cyanobacteria) in Nanwan Reservoir (Xinyang, China)

1
Fisheries College of Xinyang Agriculture and Forestry University, Xinyang 464000, China
2
Guangxi Key Laboratory of Aquatic Biotechnology and Modern Ecological Aquaculture, Guangxi Academy of Marine Sciences, Guangxi Academy of Sciences, Nanning 530007, China
3
The Affairs Center of Nanwan Reservoir in Xinyang, Xinyang 464000, China
*
Author to whom correspondence should be addressed.
Water 2024, 16(24), 3569; https://doi.org/10.3390/w16243569
Submission received: 19 October 2024 / Revised: 6 December 2024 / Accepted: 8 December 2024 / Published: 11 December 2024

Abstract

:
Microcystis, a key genus of bloom-forming cyanobacteria in freshwater ecosystems, has garnered significant research interest due to its species diversity and population dynamics. This study investigated the water profiles and Microcystis populations at six stations in the Nanwan Reservoir (Xinyang, China) throughout 2022 to elucidate the morphological characteristics of Microcystis, analyze its population density patterns, and identify key environmental factors influencing its dynamics. The reservoir was classified as mesotrophic during most of the study period. Seven common Microcystis species were identified, including M. botrys, M. smithii, M. wesenbergii, M. firma, M. novacekii, M. aeruginosa, and a species suspected to be M. flos-aquae. The spatial and temporal distribution analyses revealed a bimodal fluctuation in Microcystis densities, with a monthly occurrence across stations except in August. The highest density, 1.71 × 10⁷ cells/L, was recorded in May, while the lower densities were observed from July to September. The Mantel test results indicated that the nitrogen levels, particularly NO 3 -N, were the primary factors influencing the Microcystis density. Additionally, both the reservoir bays and dam areas exhibited a high risk of Microcystis blooms. Effective management of nitrogen inputs, enhanced monitoring, and appropriate gate operations are recommended to mitigate the risk of Microcystis blooms in the Nanwan Reservoir.

1. Introduction

Microcystis, a primary contributor to harmful algal blooms (HABs) in freshwater ecosystems, has attracted global attention [1]. During these blooms, substantial accumulations of Microcystis cells form at the water’s surface, obstructing sunlight and reducing water transparency. In the bloom’s later stages, the lysis and death of numerous algal cells lead to dissolved oxygen depletion, causing hypoxia and potential mass mortality of aquatic organisms, thus worsening water quality [2]. Additionally, certain Microcystis species produce toxins that can pose serious health risks to humans and animals [3]. A notable example occurred in 2007 when a severe Microcystis bloom in Lake Taihu triggered a week-long drinking water crisis, affecting two million residents of Wuxi, Jiangsu Province, China [4]. Another incident involved wildlife fatalities in Doñana National Park, Spain, where toxic cyanobacteria ingestion caused the death of at least 579 greater flamingos [5]. Therefore, effectively managing Microcystis-induced HABs is crucial for safeguarding aquatic ecosystems and public health.
The genus Microcystis belongs to the phylum cyanobacteria, order Chroococcales, and family Microcystaceae. Its colonies comprise numerous cells forming irregular spherical or perforated reticular structures, enclosed within a uniform, colorless gelatinous matrix containing gas vesicles and granules. The cells typically reproduce by division. Over 50 Microcystis species have been described globally [6], with seven common species in China, including M. aeruginosa, M. botrys, M. firma, M. flos-aquae, M. ichthyoblabe, M. novacekii, and M. pseudofilamentosa [7]. Zhang et al. identified a novel species in China, M. panniformis, in Lake Taihu, distinguished by plate-like cells that are thick in the center and thin at the edges [8]. Recently, Lv et al. discovered Radiocystis fernandoi in Lake Erhai (Yunnan), with a comparative analysis of the ITS region providing support for it as a new member of the genus Microcystis. Consequently, they propose reclassifying Radiocystis fernandoi into Microcystis fernandoi comb. nov, which is characterized by stacked spherical cells [9]. Molecular methods, including the 16S rRNA gene, sequences from the β-subunit gene of DNA gyrase (gyrB), and the intergenic spacer region between two phycocyanin subunits (cpcBA-IGS), have been employed to differentiate Microcystis species. However, these methods have shown limitations in certain studies [10,11,12,13]. While the current taxonomy relies primarily on the morphological traits observed in field populations [14], genetic analysis using phylogenetic trees is essential for identifying new species or refining the taxonomic classification of specific algae [9,15].
The density of Microcystis is influenced by both biotic factors, such as population growth, resting spores, and germination from the seed bank [16], and abiotic factors, including water conditions and nutrient availability. Although Microcystis can adapt to a broad range of light intensities and temperatures [14], elevated temperatures and high light conditions are particularly favorable for its growth. Laboratory experiments have shown that nitrogen addition promotes Microcystis growth more effectively than phosphorus [17]. Additionally, when water pH exceeds 9—often due to phytoplankton photosynthesis—Microcystis utilizes buoyancy mechanisms to form surface blooms, enhancing CO2 absorption from the air–water interface [18]. In contrast, other algae lacking buoyancy mechanisms are at a disadvantage, unable to maintain high photosynthesis rates due to limited CO2 availability [19]. Understanding how environmental factors drive the Microcystis population dynamics is essential for effective HAB management.
The purpose of this study was to characterize the morphological features of Microcystis in the Nanwan Reservoir (Xinyang, China), analyze population density patterns, and identify environmental influences. To achieve this goal, our study conducted a comprehensive investigation of Microcystis and environmental parameters through year-round monitoring in the Nanwan Reservoir. It assessed the species richness, morphological characteristics, spatiotemporal population density, and key factors influencing Microcystis growth. The findings provide insights into the Microcystis dynamics and inform management strategies for controlling HABs in this large temperate reservoir.

2. Materials and Methods
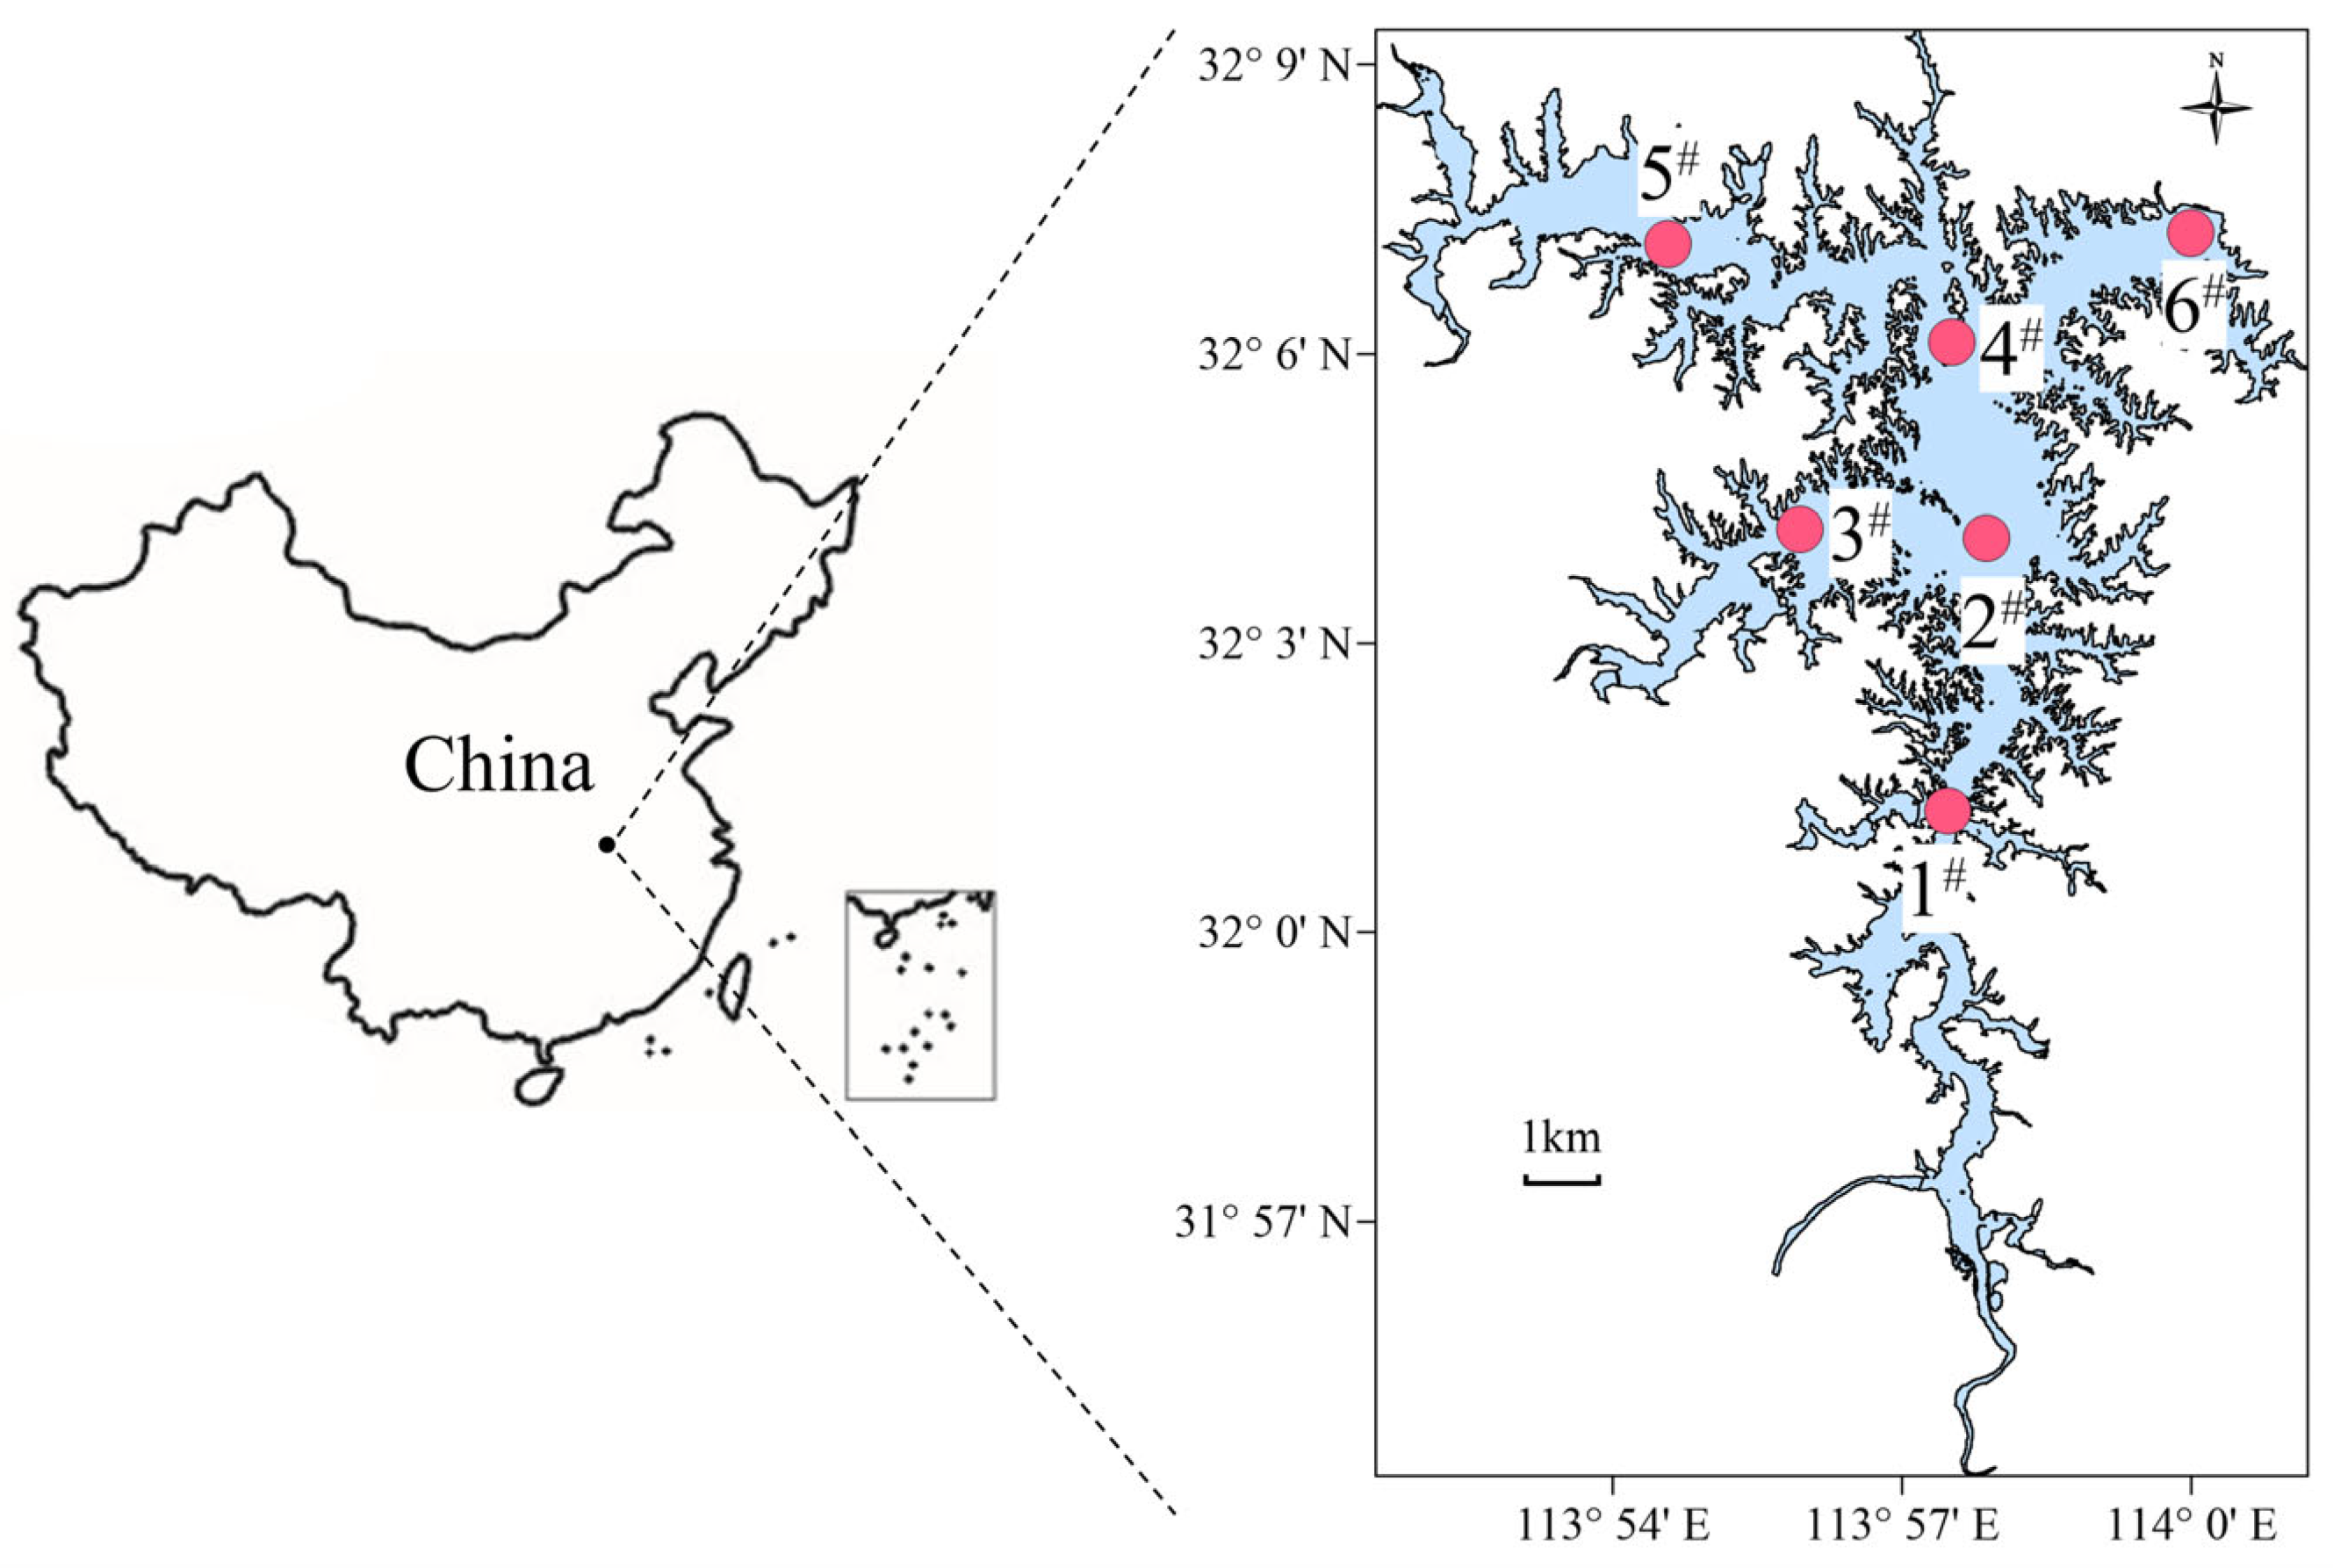
2.1. Study Area

The Nanwan Reservoir was constructed as part of a large-scale hydraulic engineering project in 1955 and serves multiple functions, including flood control, irrigation, tourism, fisheries, and as a drinking water source. Located on the Shi River, a tributary of the Huai River, 6 km southwest of Xinyang City, the reservoir controls a watershed area of 1100 km2, with a total storage capacity of 1.63 billion m3 and a maximum depth of 30 m [20,21]. In 2022, the reservoir’s fishery industry yielded an annual sale of 1000 tons, generating around 25 million yuan (approximately 3.5 million USD). Until 2000, Nanwan Reservoir’s water quality was classified as Class I according to China’s surface water environmental quality standards (GB 3838-2002) (Table S1). However, with the expansion of agriculture and tourism, the water quality declined, reaching Class III in 2016 [22] and occasionally Class IV thereafter [23]. This degradation has led to frequent HAB outbreaks, likely dominated by Microcystis, though studies on its population dynamics in Nanwan Reservoir remain limited.

2.2. Sampling Sites and Sample Collection

Six sampling sites were selected based on the topographical features of the Nanwan Reservoir to cover the entire water body (Figure 1). Stations 1, 3, and 5 represent the inshore areas, Stations 2 and 4 are situated in the central region, while station 6 corresponds to the dam. The monthly field investigations were conducted from January to December 2022, excluding March. The environmental monitoring and sample collection were performed at a depth of approximately 0.5 m [24], to avoid surface pollutants such as fallen leaves and other solid materials.
The water temperature and dissolved oxygen concentrations were measured using a multifunctional water quality analyzer (YSI Incorporated, OH, USA). pH was recorded with a portable pH meter (Shanghai Sanxin Peirui Instrument Technology Co., Ltd, Shanghai, China), and water transparency (SD) was assessed using a Secchi disk. The water samples (5 L) were collected in black plastic containers from each site and transported to the laboratory for analysis of total nitrogen (TN), total phosphorus (TP), permanganate index (CODMn), nitrate nitrogen ( NO 3 -N), nitrite nitrogen ( NO 2 -N), ammonia nitrogen ( NH 4 + -N), and phosphate ( PO 4 3 -P).
The phytoplankton samples were collected using a plankton net with a mesh size of 25 µm and a 20 cm mouth diameter. The sweeping times ranged up to 50 sweeps, depending on the phytoplankton density, typically around 50 times to collect sufficient phytoplankton samples. The collected algal samples were transferred to 100 mL sampling bottles without preservatives and transported to the laboratory within 6 h for microscopic observation to identify Microcystis species. For the quantitative phytoplankton density analysis, 500 mL water samples were collected directly and preserved with ~1.5% Lugol’s solution for subsequent laboratory analysis.

2.3. Nutrient Measurement

The dissolved nutrient concentrations were analyzed using water samples filtered through 0.45 μm polyester fiber membranes (Shanghai Xingya Purification Materials Factory, Shanghai, China). TN and TP were measured directly without pretreatment. TN was determined via alkaline potassium persulfate digestion followed by ultraviolet spectrophotometry (Shanghai Macylab Instrument Co., Ltd., Shanghai, China). TP and PO 4 3 -P were quantified using the molybdenum antimony resistance spectrophotometric method. NH 4 + -N was analyzed using Na’s reagent, while NO 3 -N and NO 2 -N were measured via ultraviolet spectrophotometry. The CODMn was determined using the acidic method. All the procedures followed the guidelines specified in Methods for Monitoring and Analyzing Water and Wastewater [25].

2.4. Species Identification and Population Density

Phytoplankton species were identified using a microscope (Nikon Instruments Inc., Tokyo, Japan) equipped with a microscopic imaging system (Nikon Instruments Inc., Tokyo, Japan). Measurements of Microcystis cell diameters and colony sizes were also conducted. The classification was based on the morphological characteristics of Microcystis, including cell shape, the presence or absence of gas vesicles, colony structure, cell arrangement, and the presence of perforations [7,26].
To estimate the population density, the phytoplankton samples were placed in a 500 mL cylindrical sedimentation chamber and allowed to settle for over 48 h. The supernatant was carefully siphoned off, leaving approximately 80–100 mL. The remaining material was mixed thoroughly and transferred to a new sedimentation chamber for further settling. This process was repeated until the sample volume was concentrated to 10 mL. The concentrated samples were stored at 4 °C until further analysis. For phytoplankton counting, the samples were thoroughly mixed and loaded into a 0.1 mL counting chamber. After a settling period of 5–10 min, Microcystis cells were counted under a microscope ((Nikon Instruments Inc., Tokyo, Japan) at a magnification of 400×. Two slides were prepared and analyzed for each sample, and the average count was calculated. If the difference between the two counts exceeded 15% of their average, a third slide was prepared and counted. The final result was determined by averaging the two closest values among the three counts.

2.5. Data Processing and Statistical Analysis

The density of Microcystis was calculated using the following equation [27]:
N = C s F s × F n × V v × P n
where Cs represents the area of the phytoplankton counting chamber (400 mm2), Fs is the area of one field of view (mm2); Fn denotes the number of fields of view, V is the volume (mL) of the concentrated phytoplankton sample collected from 1 L; v is the volume of the counting chamber (0.1 mL), and Pn is the number of phytoplankton individuals counted in Fn fields of view.
The trophic status of the Nanwan Reservoir was evaluated using the Trophic Level Index (TLI), as described in the previous studies [28,29]. Differences in the TLI among the six sampling stations were analyzed using a one-way analysis of variance (ANOVA) in the R framework (Version 4.3.0). The Kruskal–Wallis test was employed to evaluate the differences in cell densities among the seasons, stations, and their interaction effects using the R framework. A post-hoc Nemenyi test was conducted when the Kruskal–Wallis test indicated a significant difference. A principal component analysis (PCA) was also performed in R to explore the spatial and temporal variations in Microcystis density across different sampling sites and months. To assess the relationship between Microcystis density and environmental factors, a Mantel test (Pearson correlation) was conducted in the R framework. The environmental factors were also correlated using the Mantel test. For months with a Microcystis density of zero (e.g., August), the population density (n) was transformed to n + 1 to ensure applicability. A stepwise multiple regression analysis was performed in SPSS Statistics (Version 26) to identify key environmental variables influencing Microcystis density. The transformed population density n +1 was used in this analysis, which was consistent with the Mantel test. The statistical significance was set at p < 0.05.

3. Results

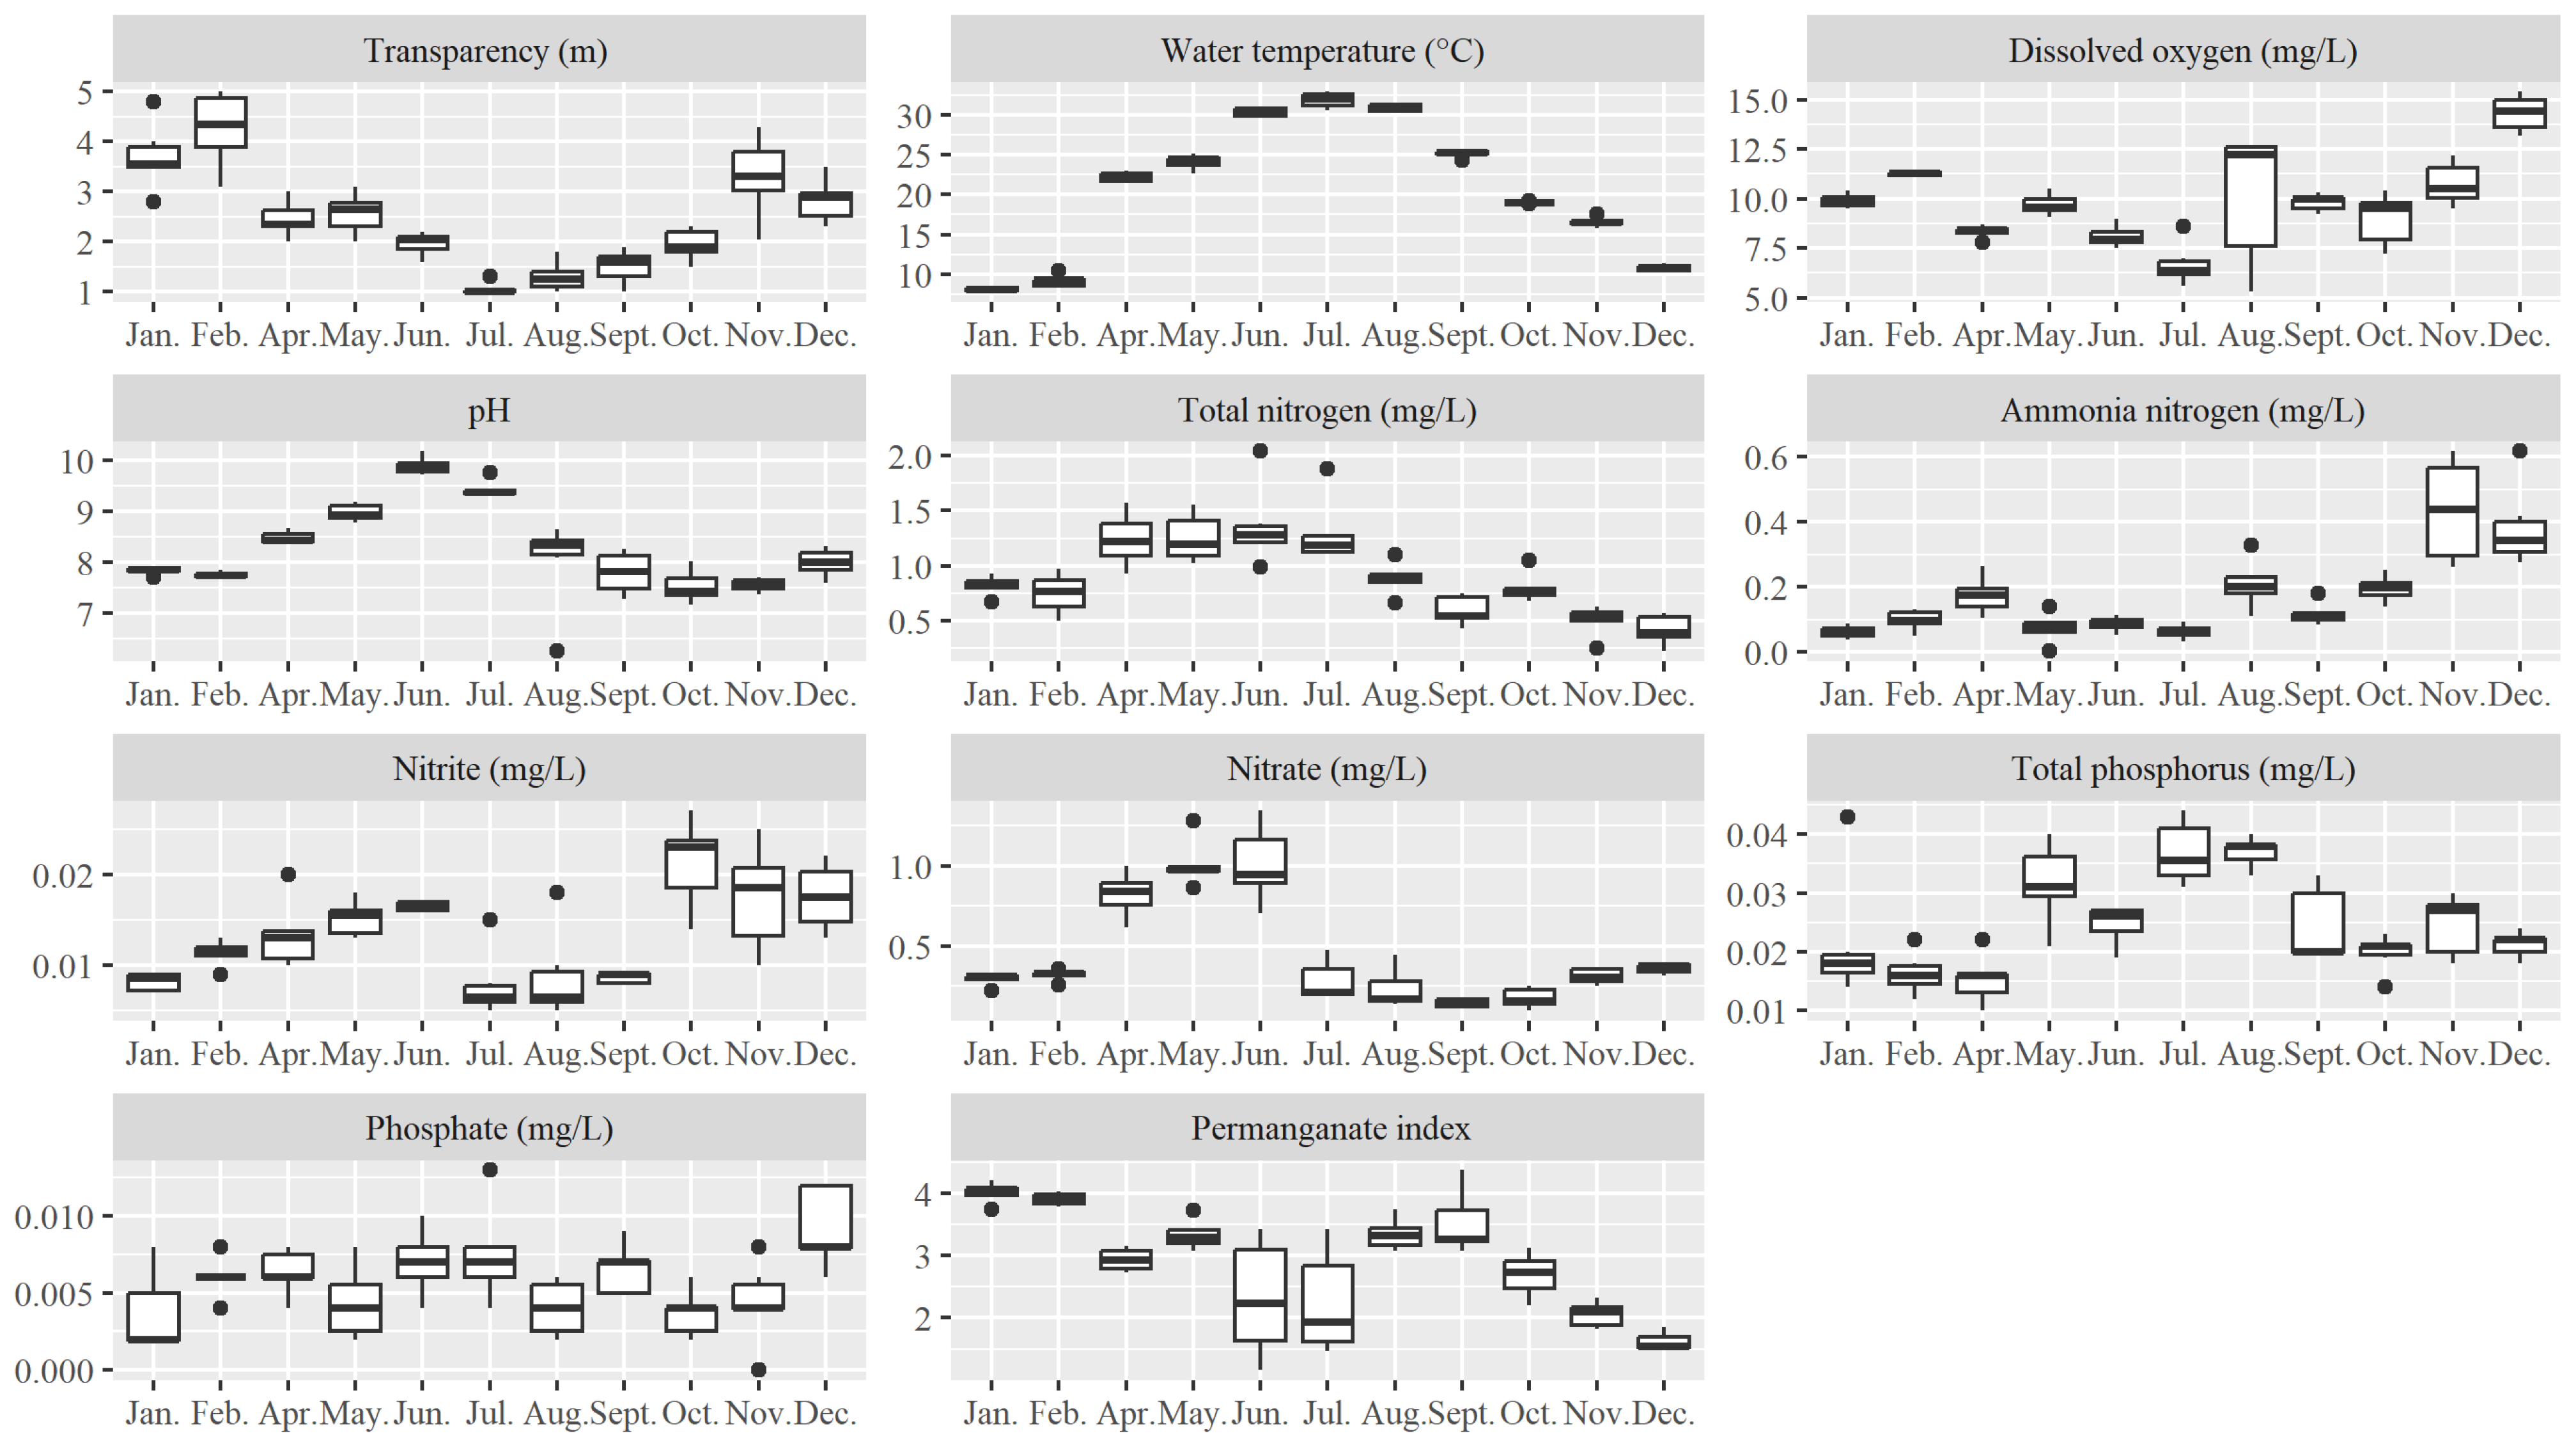
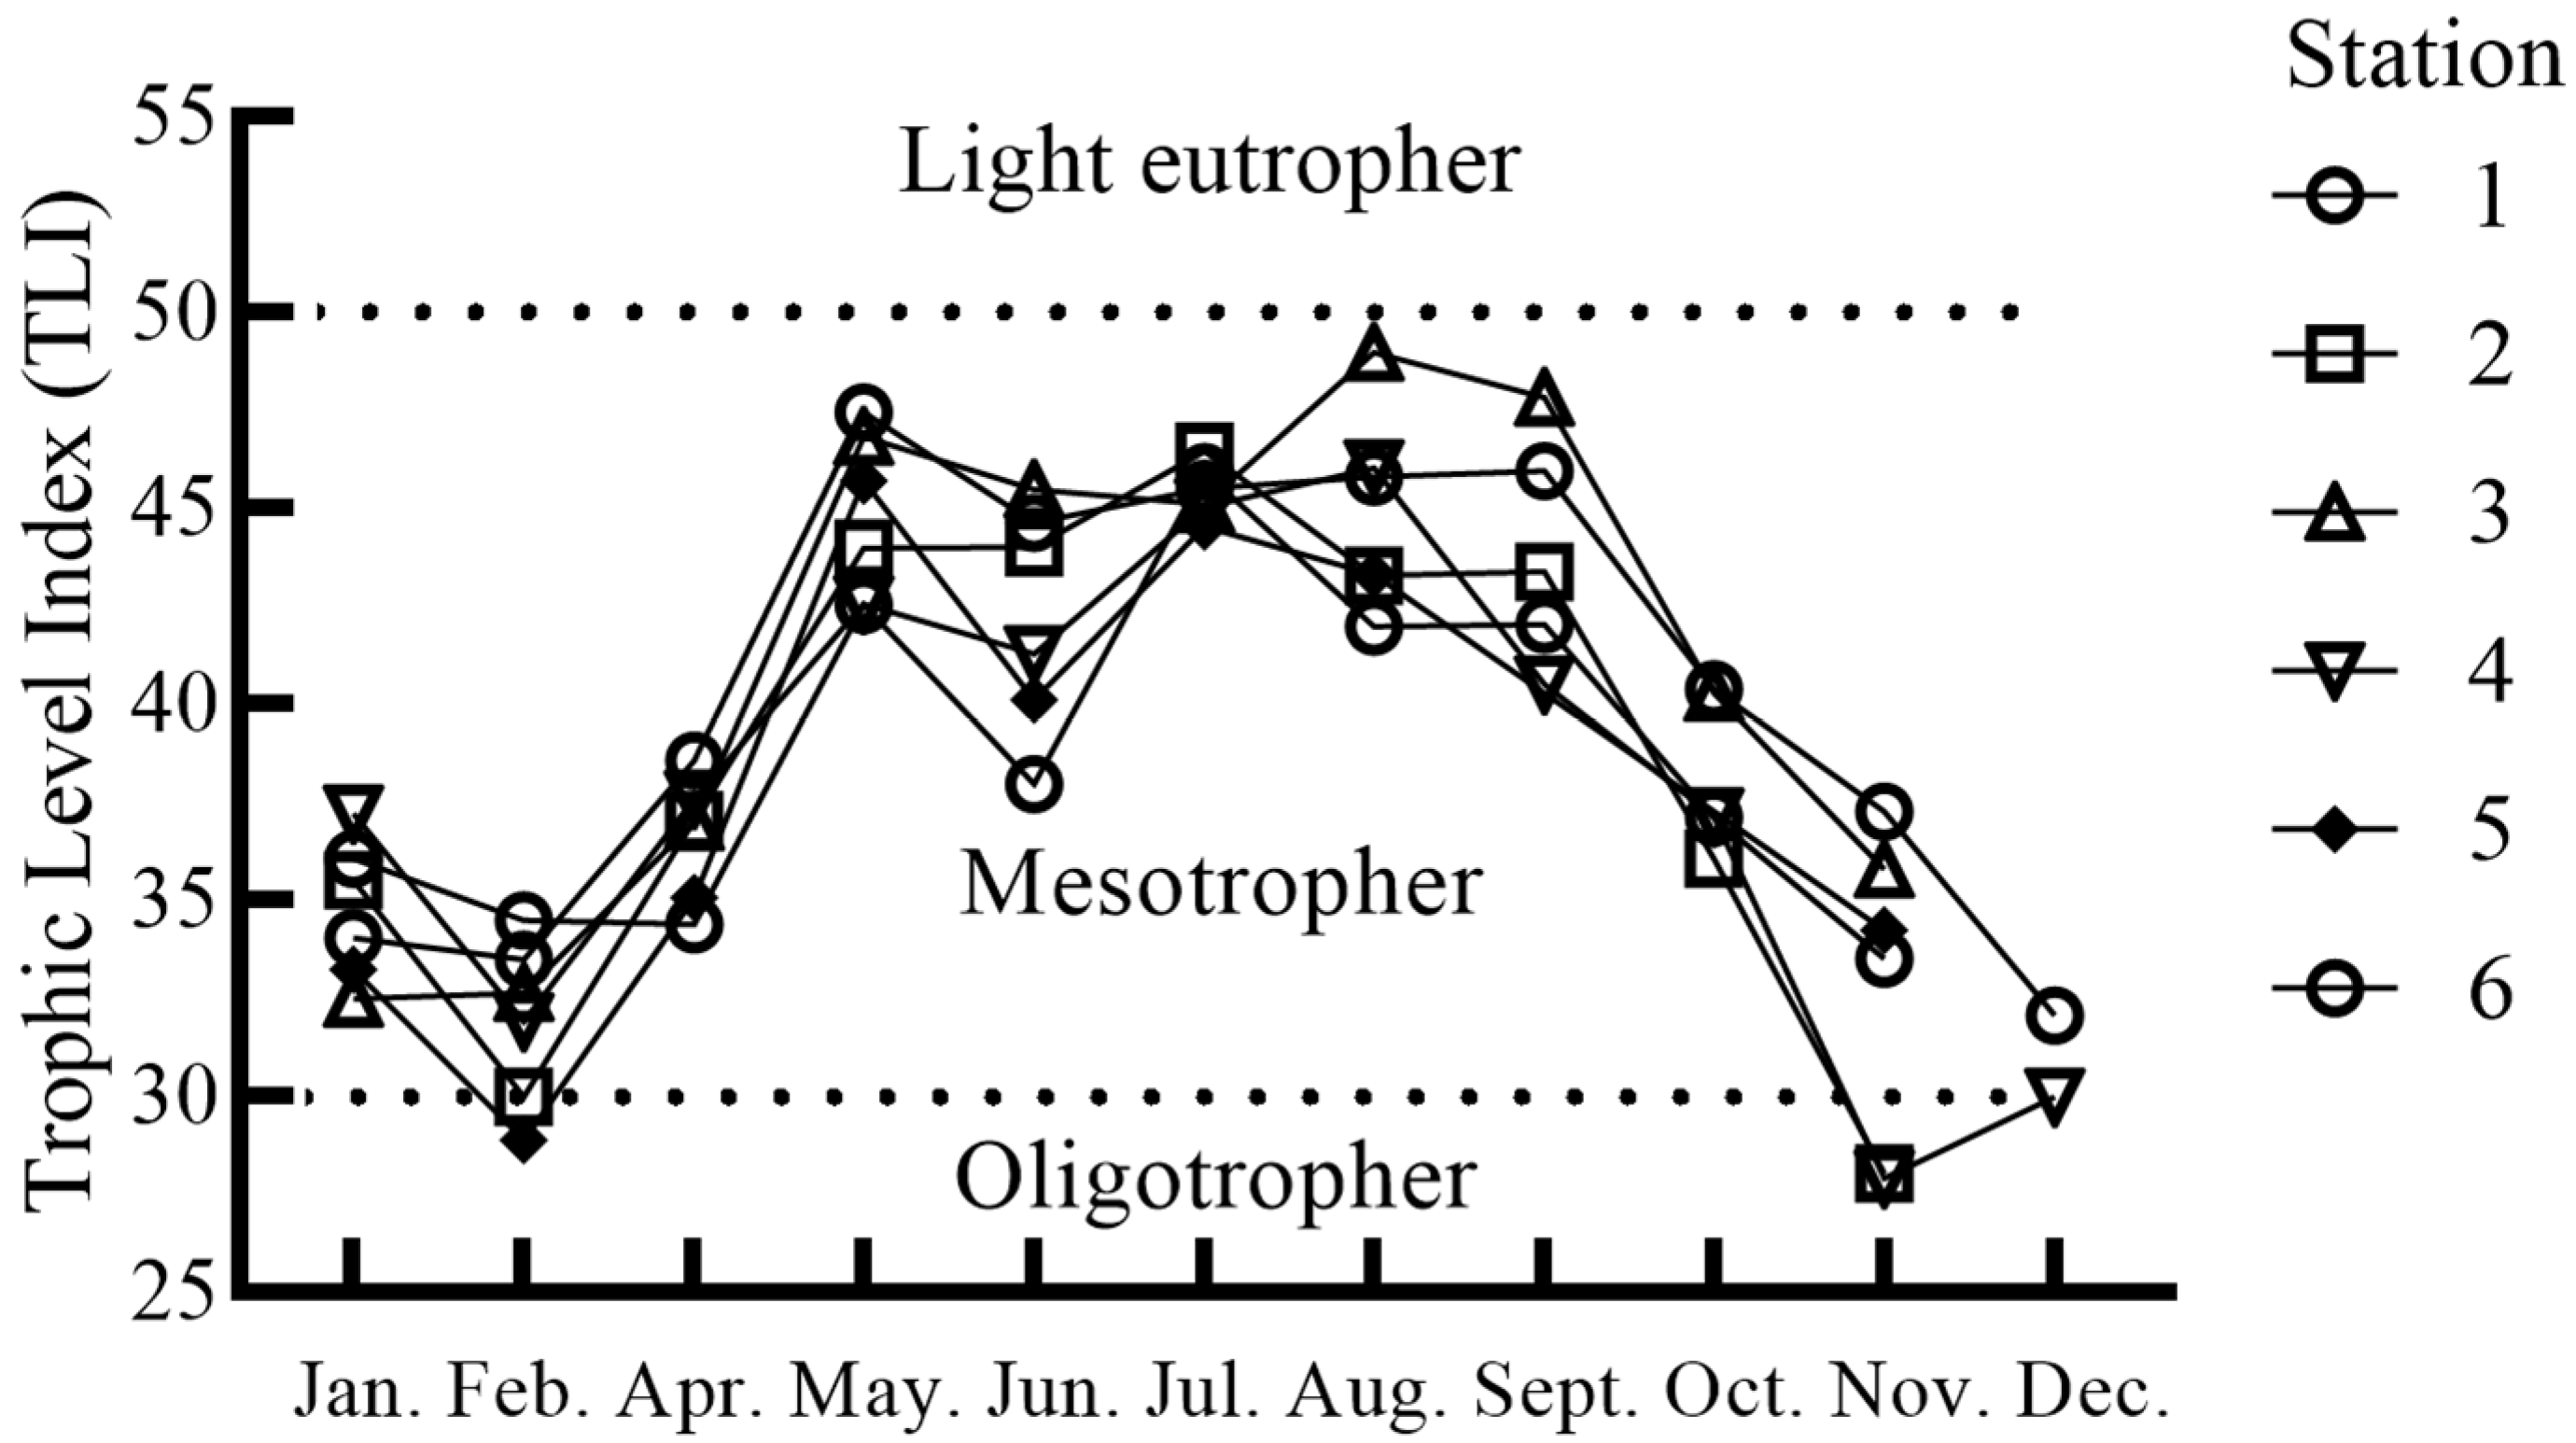
3.1. Monthly Variation of Physicochemical Factors

The water transparency (SD) decreased from January to July, reaching its lowest value in July (1.06 ± 0.05 m), before increasing from July to December (Figure 2). The water temperature exhibited an inverse trend, peaking in July at 31.90 ± 0.16 °C (Figure 2). The dissolved oxygen concentrations remained around 10 mg/L throughout the year, with the lowest value recorded in July (6.67 ± 0.43 mg/L) and the highest in December (14.32 ± 0.37 mg/L) (Figure 2). The pH levels exceeded 7 across all months, with the highest values observed in June and July (9.88 ± 0.07 and 9.43 ± 0.07, respectively) (Figure 2). The TN concentrations were higher in the first half of the year (January–July) than in the second half, averaging 1.12 ± 0.33 mg/L and 0.65 ± 0.22 mg/L, respectively (Figure 2). The NH 4 + -N peaked in November and December at 0.44 ± 0.06 mg/L and 0.38 ± 0.05 mg/L, respectively. The NO 2 -N concentrations increased from January to a peak in June, then dropped sharply from July to September before rising again from October to December. The NO 3 -N concentrations increased steadily from January to June, peaking at 1.01 ± 0.1 mg/L, then decreased sharply in July, remaining relatively low (<0.5 mg/L) until December (Figure 2). The TP concentrations increased from May, peaking in July and August at 0.037 mg/L. The PO 4 3 -P concentrations remained relatively stable throughout the year, ranging between 0.004 and 0.009 mg/L (Figure 2). The CODMn was stable from January to May, showed a decline in June and July, and increased again in August. From September to December, the CODMn decreased, with the highest value in January (4.020 ± 0.063 mg/L) and the lowest in December (1.647 ± 0.076 mg/L).
According to the Environmental Quality Standards for Surface Water in China (GB 3838-2002) (Table S1), the TN levels in the Nanwan Reservoir generally ranged from Class III to IV. However, exceptions were observed; for example, Station 4 in May and Station 6 in July reached Class V, while Station 2 in June exceeded Class V with a concentration of 2.04 mg/L. The NH 4 + -N levels mostly fell within Class I to II, except at Station 1 and 4 in November and Station 2 in December, which reached Class III. The TP levels ranged from Class II to III, with only Station 6 in April falling under Class I. No stations were classified as Class IV or V. The CODMn levels were predominantly within Class I to II, except at Stations 1, 2, 4, and 6 in January, Station 6 in February, and Station 3 in September, which fell under Class III.
The TLI of the Nanwan Reservoir ranged from 27.90 to 48.96 across the six sampling sites (Figure 3). Most stations were classified as mesotrophic throughout the investigation period, except Station 2 and 5 in February and Station 4 in December, which were on the upper edge of the oligotrophic levels. Additionally, Stations 2 and 4 in November were classified as oligotrophic (Figure 3). The annual TLI exhibited a bimodal pattern, with peaks in mid-spring and summer. The average TLI values across the six stations from May to September were 44.83 ± 0.87, 42.23 ± 1.20, 45.40 ± 0.28, 44.88 ± 1.04, and 43.93 ± 1.32, respectively (Figure 3). One-way ANOVA revealed no significant differences in TLI among the six sampling stations (df = 5, F = 0.536, p > 0.05), with the average TLI values ranging from 37.90 ± 1.80 to 41.22 ± 2.02.

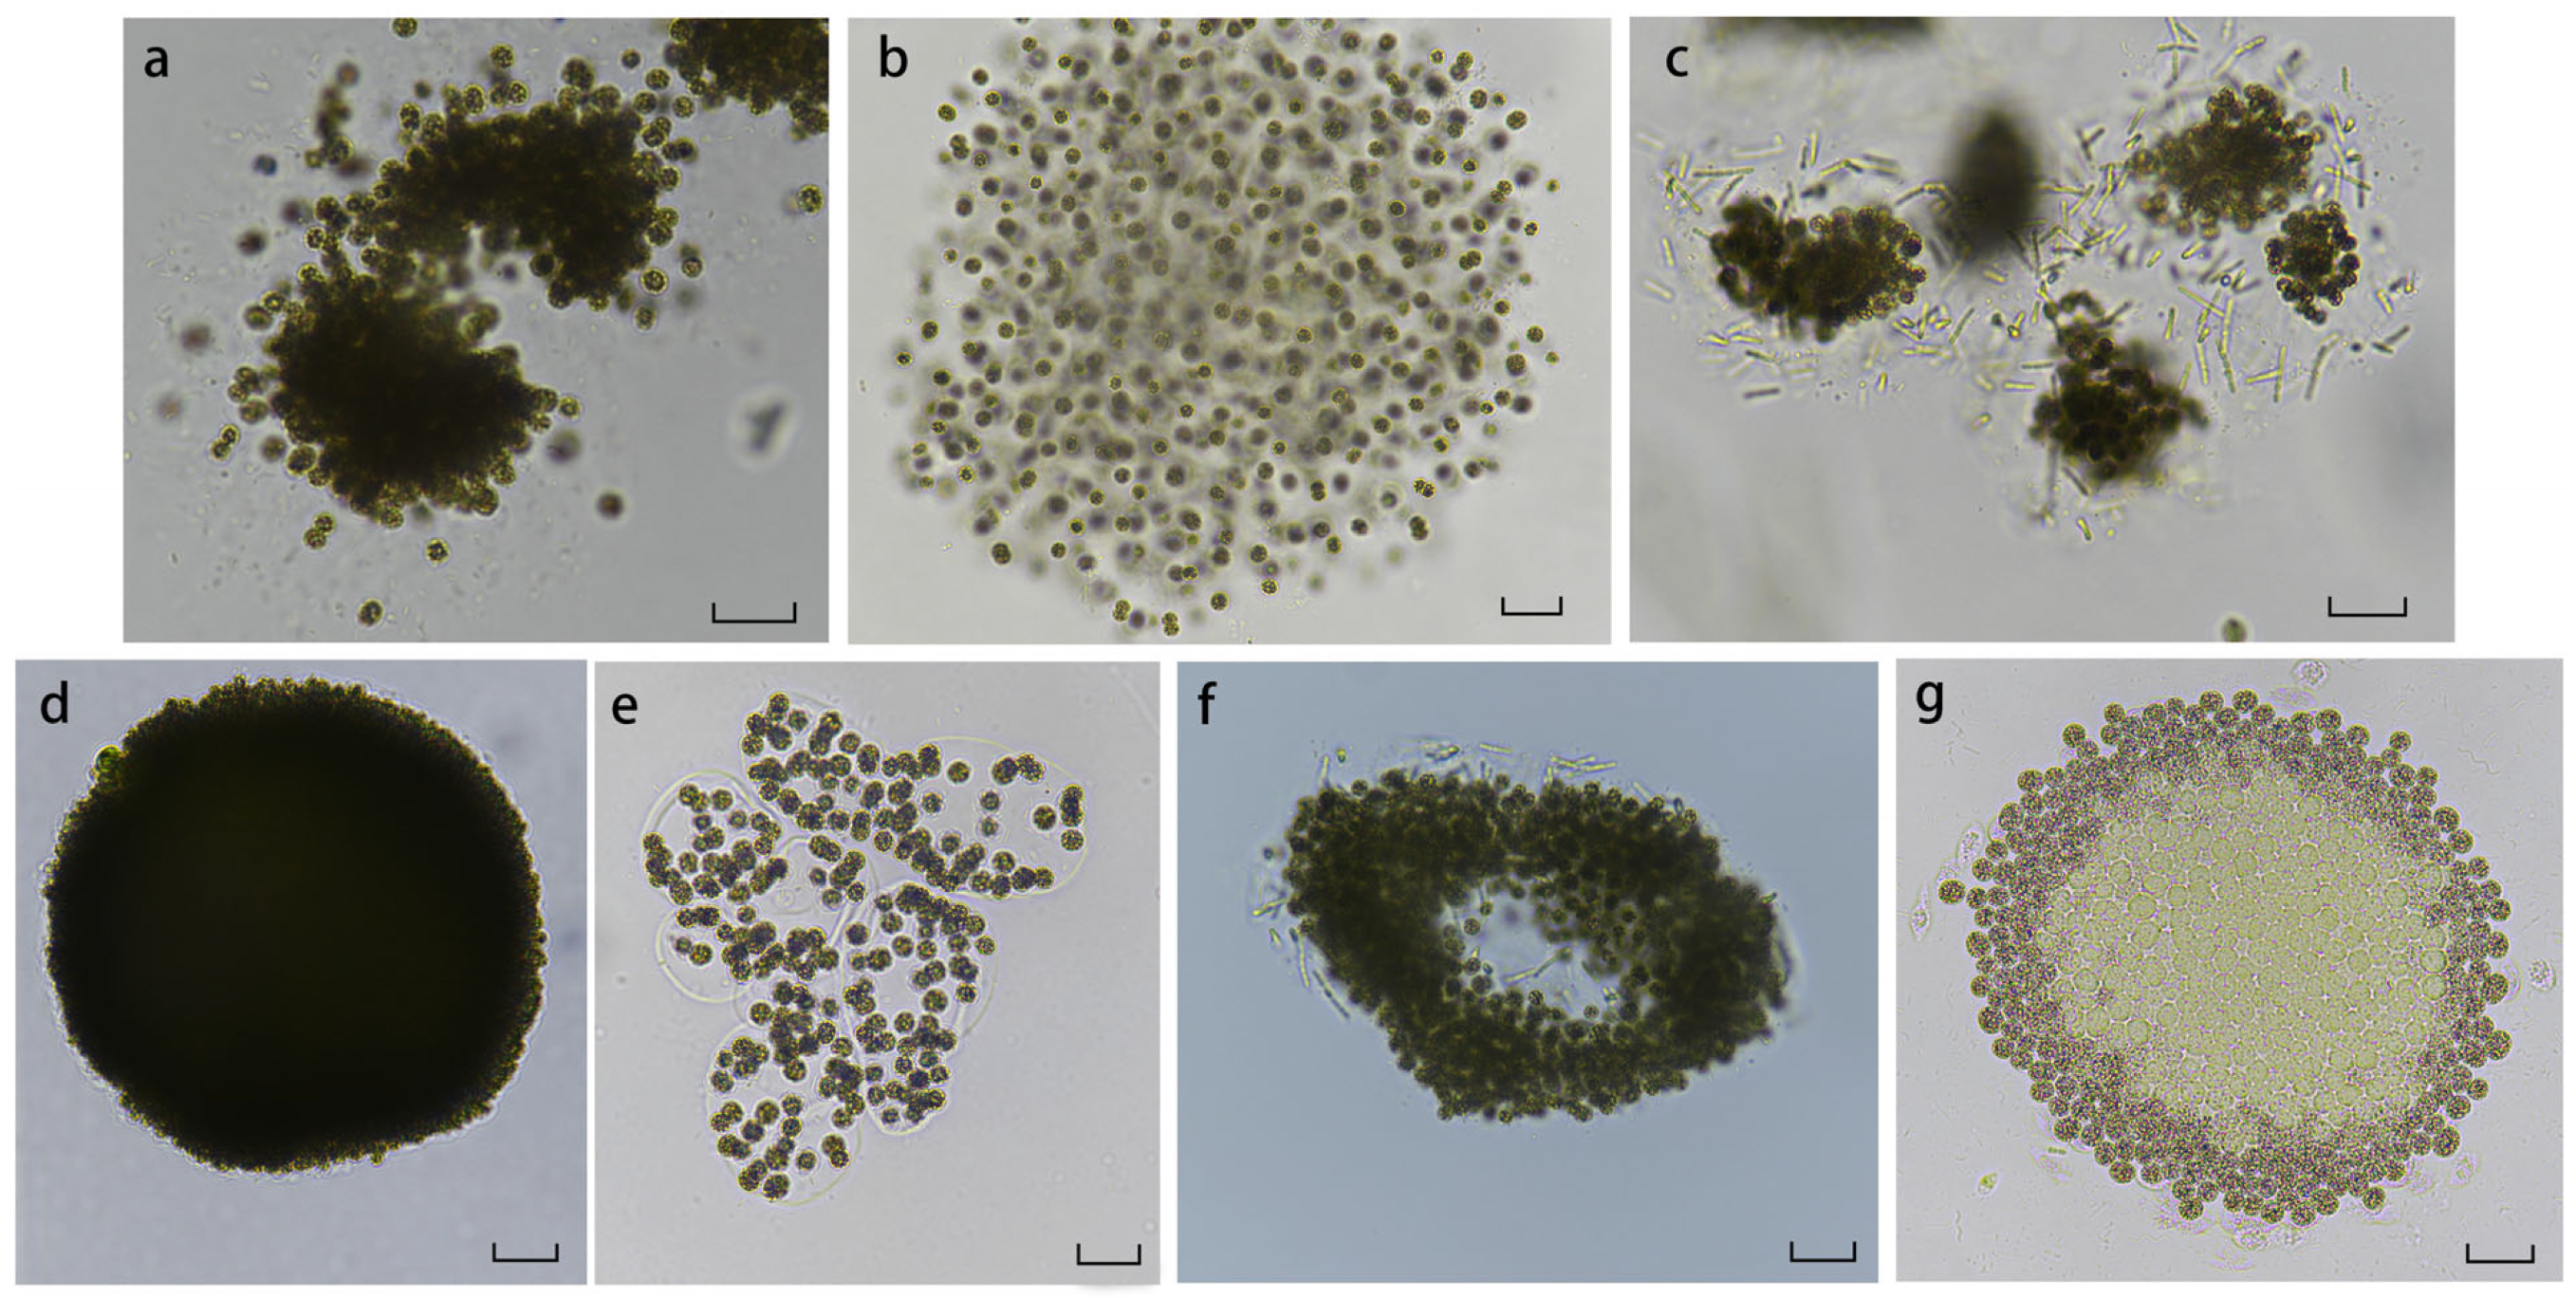
3.2. Characteristics of Microcystis Species

A total of seven Microcystis species were identified in the Nanwan Reservoir (Figure 4). The cells exhibited either spherical or elliptical shapes, depending on the species. The colonies were composed of multiple sub-colonies that aggregated into larger groups, arranged either loosely or tightly within a gelatinous matrix. The gelatinous matrix appeared pale or yellow-green and ranged from firm to fragile. Some colonies displayed noticeable surface iridescence.
The colonies of M. botrys Teiling were elliptical and suspended in the water column. These colonies were interconnected by a pale yellow or light green gelatinous matrix to form irregular aggregates without perforations (Figure 4a). The cells within the matrix were densely packed and arranged radially, with some dispersed outside the colony. The cell diameters ranged from 4.00 to 6.54 µm, with an average of 5.22 ± 0.65 µm.
M. smithii Komárek and Anagnostidis formed freely floating colonies that aggregated into smaller spherical or nearly spherical shapes. The cells were not closely arranged, and the colonies lacked perforations or branched structures (Figure 4b). The gelatinous matrix was colorless or pale yellow-green, making it observable despite indistinct boundaries and a lack of iridescence. The cell diameters ranged from 3.67 to 5.89 µm, with an average of 4.65 ± 0.61 µm, positioning them between M. aeruginosa and M. novacekii in size.
The colonies of M. novacekii (Komárek) Compére were freely floating and displayed spherical or irregular shapes. The colonies were tenuously linked, typically forming irregular aggregates of 3 to 5 colonies connected by a colorless or slightly yellow-green gelatinous matrix (Figure 4c). The matrix, visible to the naked eye, was not tightly connected to the cells and exhibited no iridescence. The cells within the colonies were sparsely arranged, with the central cells more densely packed. The density decreased outward, with the outermost cells free-floating. The spherical cells contained gas vacuoles, with diameters ranging from 2.90 to 5.09 µm and an average of 3.62 ± 0.47 µm.
The colonies of M. firma (Kützing) Schmidle were freely floating, with cells that were flattened, circular, or oval in shape and deep brown in color. The cells were densely packed, making the individual cells indistinguishable (Figure 4d). The colonies lacked perforations or branched structures, and the gelatinous matrix was lightly adhered and inconspicuous. While similar to M. aeruginosa, M. firma differed in that M. aeruginosa forms spherical or irregular colonies with occasional indistinct perforations. Additionally, the gelatinous matrix in M. aeruginosa is tightly associated with peripheral cells, and the cell diameters range from 1.26 to 3.36 µm, with an average of 1.97 ± 0.56 µm.
The colonies of M. wesenbergii (Komárek) Komárek were freely floating, displaying variable morphological characteristics interconnected by a prominent gelatinous matrix, forming diverse shapes such as branched or net-like structures (Figure 4e). The cells within the colonies were relatively large, with a deep green or dark brown color, spherical to near-spherical shapes, and diameters ranging from 4.67 to 8.34 μm, averaging 6.47 ± 0.80 μm. The cells contained gas vacuoles, and the colonies were distinguished by the well-defined gelatinous matrix boundary and the large size of the cells, which facilitate differentiation from other Microcystis species.
The colonies of M. aeruginosa (Kützing) Kützing were freely floating, composed of irregular aggregates of multiple cells with perforations visible within the colonies. The gelatinous matrix also exhibited perforations, giving the colonies a branched or irregular net-like appearance (Figure 4f). The gelatinous matrix was pale yellow, non-iridescent, and loosely connected to the cells, maintaining a distance of over 2 μm. Within the matrix, the cells were relatively densely packed. The cells were spherical, deep green, and ranged from 3.39 to 6.20 μm in diameter, with an average of 4.71 ± 0.62 μm.
A species suspected to be M. flos-aquae (Wittrock) Kirchner was also observed. This species shared similarities with M. flos-aquae, such as loosely arranged spherical to elliptical cells (Figure 4g). However, its cells were larger, with diameters ranging from 4.56 to 7.85 μm and an average of 6.32 ± 0.90 μm. A distinctive feature of this species was the absence of gas vacuoles in the central cells, while the surrounding cells possessed them, marking a significant difference from M. flos-aquae.

3.3. Variation in Microcystis Density

The density of Microcystis exhibited a bimodal pattern, with peaks observed from May to June and October to November (Figure 5a). The highest density, 4.99 × 10⁷ cells/L, was recorded at Station 6 in May, accounting for 48.6% of the total Microcystis population at that time (Figure S1 and Figure 5b). The average densities across the six stations in May and June were 1.71 × 10⁷ and 1.30 × 10⁷ cells/L, respectively, while the densities in October and November were 3.24 × 10⁶ and 6.89 × 10⁶ cells/L, respectively. In contrast, densities during other months were 1–3 orders of magnitude lower, ranging from 3.22 × 10⁴ to 2.80 × 10⁵ cells/L, with no Microcystis detected in August. In February, Microcystis was only detected at Station 3, with a density of 1.93 × 10⁵ cells/L. By November, the majority of the population was concentrated at Station 5, where the density reached 3.57 × 10⁷ cells/L, significantly exceeding that of other stations by 1–2 orders of magnitude (Figure 5b). The Kruskal–Wallis test revealed a significant difference in Microcystis density among seasons (df = 3, H = 18.6, p < 0.05) but no significant difference among stations (df = 5, H = 1.13, p > 0.05) without the interaction effect (df = 15, H = 3.46, p > 0.05). The post-hoc Nemenyi tests indicated that the cell densities in both spring and autumn were significantly higher than in winter (p < 0.05 for both), whereas no significant differences were found among spring, summer, and autumn (p > 0.05 for all). The PCA identified two principal components, PC1 and PC2, accounting for 35.7% and 24.8% of the variance, respectively, with a total explained variance of 60.8% (Figure 6). Both the PC1 and PC2 data shift to different states, particularly during April and July (Figure S2). The annual distribution patterns at Stations 3 and 5 were distinct from other stations (Figure 6 and Figure S3). Station 3 exhibited Microcystis only in February, while Station 5 showed relatively high densities in November (Figure 5 and Figure 6). The annual density characteristics at Stations 2 and 4 were similar (Figure 6 and Figure S3), with notable Microcystis occurrences primarily in September, distinguishing them from other stations (Figure 5 and Figure 6). Meanwhile, Stations 1 and 6 shared similar patterns, with the Microcystis densities predominantly peaking in May (Figure 5 and Figure 6).

3.4. Relationship Between Microcystis Density and Physicochemical Factors

The mantel correlation analysis revealed a significant correlation (p < 0.05) between Microcystis density and several physicochemical factors, including dissolved oxygen concentration, pH, chlorophyll a (Chl. a) concentration, nitrogen concentration (except NH 4 + -N), and CODMn (Figure 7). Among these factors, the strongest correlation was observed with NO 3 -N (correlation coefficient 0.224). Additionally, temperature was strongly positively correlated with Chl. a concentration (R = 0.7, p < 0.05), while TN and pH also exhibited a strong positive correlation (R = 0.7, p < 0.05). In contrast, temperature and SD showed the strongest negative correlation (R = −0.81, p < 0.05). The stepwise regression analysis identified NO 3 -N as the sole significant environmental variable among the 12 tested (Table 1), indicating that Microcystis density is primarily regulated by the NO 3 -N concentration.

4. Discussion

4.1. Microcystis Cell Features and Diversity

As a dominant bloom-forming genus in freshwater lakes, Microcystis has drawn significant attention from researchers and reservoir managers alike [30]. However, its classification faces challenges due to the high ecological variability in phenotypes of the same species across different growth environments and stages [31]. In the Nanwan Reservoir, the cell diameters of M. botrys, M. smithii, and M. wesenbergii are comparable to those reported in Dianchi Lake (Yunnan, China), lakes in Guangzhou (Guangdong, China), and Europe (Table 2). In contrast, the cell diameters of M. novacekii, M. aeruginosa, and M. firma are smaller than those recorded in these locations (Table 2). Notably, the cell diameter of M. flos-aquae in Nanwan Reservoir is larger than those observed in the same regions, likely due to the intraspecific variation influenced by the unique environmental conditions of the reservoir. Different Microcystis species may exhibit similar characteristics under varying environments, and significant differences often exist between laboratory and field populations of the same species [32,33]. Additionally, different strains of the same Microcystis species can include both toxic and non-toxic variants, complicating species identification and classification [34,35]. While molecular techniques have been introduced for Microcystis identification, they face limitations. For instance, the 16S rRNA gene, commonly used for prokaryotic organisms like Microcystis, is highly conserved, making it unsuitable for distinguishing below the species level [10]. Similarly, sequences from the β-subunit gene of DNA gyrase (gyrB) and the intergenic spacer region between two phycocyanin subunits (cpcBA-IGS) have proven ineffective in differentiating among Microcystis species in certain experiments [11,12,13]. Given these limitations, we propose that until the molecular techniques advance further, morphological identification remains the most reliable method for distinguishing Microcystis species.
The species composition and diversity of Microcystis in different regions are closely linked to the local water sources and the eutrophication levels of water bodies. Yu et al. [7] identified ten Microcystis species in Dianchi Lake, while Wang et al. [37] reported three dominant bloom-forming species in the Taiyuan section of the Fenhe River, China: M. aeruginosa, M. novacekii, and M. wesenbergii. In Morocco, Loudiki et al. [38] identified six potentially toxic Microcystis species, including M. aeruginosa f. aeruginosa, M. aeruginosa f. flos-aquae, M. ichtyoblabe, M. pulverea, M. pulverea f. delicatissima, and M. wesenbergii, in reservoirs and natural ponds. The Nanwan Reservoir primarily receives water from the Shihe River, a tributary of the Huaihe River, along with other rivers such as the Feisha River, Xiaoshi River, and Wudao River [39]. These rivers may serve as pathways for introducing various Microcystis species into the reservoir. Additionally, the reservoir’s classification as mesotrophic to eutrophic provides favorable conditions for the growth and proliferation of diverse Microcystis species.

4.2. Variation of Microcystis Density

Based on the cyanobacteria bloom grading standards outlined in the Technical Specification for Classification and Monitoring of Algal Blooms (DB44/T 2261-2020) [40], Microcystis blooms in the Nanwan Reservoir were assessed as follows: May and June were classified as Grade II (no obvious blooms, Table S2), while other months exhibited no blooms. However, Microcystis densities at specific stations—Stations 1, 5, and 6 in May; Stations 1, 4, 5, and 6 in June; Station 1 in January; and Station 5 in November—ranged from 1 × 10⁷ cells/L to 5 × 10⁷ cells/L, meeting the criteria for Grade III blooms, which signify mild blooms. Other stations recorded no obvious blooms or none at all. These findings align with the results of Hu et al. [22], who studied the Nanwan Reservoir in 2016 and reported phytoplankton cell abundances ranging from 0.54 × 10⁶ to 2.45 × 10⁷ cells/L across sampling points, with an average of 7.61 × 10⁶ cells/L. This suggested low phytoplankton density and a minimal risk of significant algal blooms at that time. However, this remains a concern; without effective management measures, large-scale Microcystis blooms may occur in the future, posing challenges for ecological recovery.
Microcystis is typically expected to thrive in warm, sunny seasons. For instance, in Chaohu Lake (Anhui, China), Microcystis spp. was the dominant species during the summer (June to August), exhibiting the highest dominance among phytoplankton [41]. Similarly, in Shanzi Reservoir (Fujian, China), the proportion of Microcystis within the phytoplankton community reached up to 95% in summer, compared to 20–45% in winter, with biomass showing a significant positive correlation with temperature [42]. Warm water has also been identified as a principal driver of Microcystis blooms in the northern part of Lake Taihu (China) during summer [43]. In the Nanwan Reservoir, Microcystis populations were significant in May and June, but surprisingly, a small population was also observed in January, when water temperatures were at their lowest, with an average density of 1.46 × 10⁵ cells/L. This indicates that Microcystis in the Nanwan Reservoir not only proliferates during warm seasons but also exhibits adaptability to colder conditions. A similar pattern was observed in Dianchi Lake, where Microcystis persisted year-round from 2009 to 2010, with a density of 2.75 × 10⁷ cells/L recorded in January [44]. In the Nanwan Reservoir, the Microcystis density peaked in May at 1.71 × 10⁷ cells/L but began to decline from June onwards. Multiple studies suggest that Microcystis can dominate phytoplankton communities across diverse physicochemical conditions due to its vertical migration facilitated by gas vesicles, increased nitrogen availability from anthropogenic sources, the formation of large cell colonies, and its ability to overwinter in sediments [45,46,47]. Interestingly, during the hottest month of August, no Microcystis was detected in the Nanwan Reservoir. Instead, other cyanobacterial species, such as Oscillatoria sp., Pseudanabaena sp., and Dolichospermum sp., dominated the community during this time. The significant proliferation of these species may have occupied the ecological niche of Microcystis, outcompeting it for resources and leading to a population decline. The competitive success of Oscillatoria, Pseudanabaena, and Dolichospermum over Microcystis during summer in the Nanwan Reservoir warrants further investigation to understand the underlying ecological mechanisms.

4.3. Driving Factors of Microcystis Abundance Variation

Eutrophication is a primary driver of Microcystis algal blooms, which are expected to become more intense, frequent, and widespread under suitable conditions [48]. From 2012 to 2020, the water quality of the Nanwan Reservoir generally met the Class III standards, occasionally reaching Class IV [23]. In 2022, apart from TN, the water quality was classified as Class II–III. Compared to the previous studies, the TN content in the reservoir has increased, while other indicators have either remained stable or improved. In comparison to other lakes in China, the water quality of the Nanwan Reservoir is relatively better. For instance, in Lake Chaohu (Anhui, China) in 2020, the water quality ranged from Class III to inferior V, with Microcystis dominating during spring, summer, and autumn [49]. Similarly, Lake Poyang (Jiangxi, China) exhibited Class IV water quality for TP, with TN also classified as Class IV during most of the dry season from 2013 to 2022 [50]. A sediment pollution cleanup project for the Nanwan Reservoir was initiated in March 2021 and completed in December 2022, encompassing the sampling period of this study. The project involved the removal of sediments from the inflowing tributaries and water supply sources, contributing to improved water quality. In 2022, the nutrient levels of the Nanwan Reservoir were classified as mesotrophic, not reaching the eutrophic thresholds. This improvement in the water quality likely explains why Microcystis densities in 2022 did not reach the levels associated with algal blooms.
The density of Microcystis in the Nanwan Reservoir in 2022 was primarily influenced by NO 3 -N, and there was no correlation with PO 4 3 -P (see Figure 7, Table 1). Notably, the distribution patterns of Microcystis density shift to different states after April, coinciding with a drastic increase in NO 3 -N (Figure 2 and Figure S2). Therefore, managing nitrogen inputs is crucial for controlling Microcystis blooms in the Nanwan Reservoir. Although both nitrogen and phosphorus are essential elements for phytoplankton growth, Microcystis is possibly accumulating and storing excess phosphorus in the relatively low phosphorus region [51]. Additionally, Microcystis has a higher maximum uptake rate and storage capacity for phosphorus compared to other algal species [52]. On the other hand, compared to nitrogen, phosphorus is more easily buried in sediments through processes such as adsorption, complexation, flocculation, and sedimentation, forming internal phosphorus [53]. This internal phosphorus can later re-enter the water column through desorption, dissolution, or biological decomposition [54], reducing its dependency on phosphorus availability. Since the Nanwan Reservoir is classified as mesotrophic with abundant nitrogen and phosphorus, the Microcystis density is primarily influenced by nitrogen, which might be due to its lower absorption rate and weaker storage capacity compared to phosphorus. Similar studies have shown that the growth of late summer cyanobacterial blooms in Lake Erie (Michigan & Ohio, US) is regulated by nitrogen constraints [55]. In Maumee Bay, the Microcystis bloom in 2011 began when the nitrate concentrations exceeded 100 μmol/L [56]. In Taechung Reservoir (South Korea), cyanobacteria dominated the algal communities when NO3–N:TP and TN:TP ratios were greater than 26 and 40, respectively [18]. Furthermore, the microcystin-producing Microcystis cells may gain a competitive advantage under conditions of high nitrogen and light availability [57]. This aligns with the findings from western Lake Erie, where multi-year data revealed that the microcystin levels peaked alongside inorganic nitrogen concentrations, while the orthophosphate levels showed no such trend. During the years with reduced inorganic nitrogen loading, the microcystin concentrations were significantly lower [46].
The annual occurrence of Microcystis in the Nanwan Reservoir is also influenced by its geographical characteristics. Stations 2 and 4, located in the central area of the reservoir, exhibited similar annual distribution patterns of Microcystis density, with relatively low densities throughout the year, as suggested by both the PCA and cluster results showing these stations clustering together (Figure 6 and Figure S3). In contrast, Stations 1 and 6 displayed similar patterns, with higher Microcystis densities observed in May (Figure 6 and Figure S1). Notably, Station 5 showed a distinct distribution pattern, with a significantly higher Microcystis density recorded in November, separating it from the other stations (Figure S1). The spatial and temporal distribution analyses revealed that most stations, except Stations 2 and 4, are at high risk of Microcystis blooms. Stations 1, 3, and 5 are located in the inshore areas of the reservoir bays, where restricted water circulation and shallow depths increase the likelihood of nutrient release from sediments, especially during weather disturbances, creating favorable conditions for blooms [58]. Station 6, positioned near the reservoir dam, serves as the drinking water intake for Xinyang City. This area is relatively deep and exhibited a high risk of blooms, particularly in May. The reservoir bays and dam areas demonstrated heightened bloom risks during spring. In reservoir bays, water residence time plays a key role in Microcystis dynamics by affecting the precipitation of suspended solids and nutrients [59], while longer residence times promote phytoplankton population maintenance [60]. The exchange coefficient of Nanwan Reservoir is 0.95 [22], which means that it takes over a year for the water in the reservoir to be fully exchanged. The long residence time of the water provides conditions for the outbreak of Microcystis blooms, especially in inshore areas. Jeong et al. [61] found a significant correlation between phytoplankton growth retention time and water velocity during bloom outbreaks at the Lohdong River dam in South Korea. Their study also suggested that “smart flow control” could effectively prevent blooms. For the Nanwan Reservoir, the distribution of Microcystis suggests that increasing water flow to reduce residence time could help mitigate blooms in inshore areas, such as Stations 1, 3, and 5, while opening floodgates may address blooms near the dam. However, due to the improvements in water quality following the sediment pollution cleanup project, the likelihood of Microcystis blooms in 2022 was relatively low. Managing nitrogen input remains a critical priority for future bloom prevention and reservoir management.

5. Conclusions

The ongoing sediment remediation efforts have significantly improved the water quality in the Nanwan Reservoir, enabling it to maintain a mesotrophic status. This study identified seven common Microcystis species in the reservoir, with population densities not reaching significant bloom levels. Microcystis was detected year-round, including during the colder seasons, highlighting its adaptability to varying environmental conditions. The cell sizes observed in the Nanwan Reservoir differed from those reported in other lakes, such as Dianchi Lake, lakes in Guangzhou, and European water bodies, likely reflecting ecological adaptations to the local environmental conditions. The nitrogen levels, particularly NO 3 -N, were identified as the primary factor influencing the Microcystis population density, underscoring the critical need for effective nitrogen management to prevent future blooms. Reservoir bays and dam areas were identified as high-risk zones for Microcystis blooms. Enhanced monitoring, coupled with targeted operational strategies such as optimizing the water flow and managing the residence times, can contribute to bloom prevention and sustainable management of this large temperate reservoir.

Supplementary Materials

The following supporting information can be downloaded at: https://www.mdpi.com/article/10.3390/w16243569/s1, Figure S1: Monthly Microcystis population density at each sampling station (1–6) in the Nanwan Reservoir in 2022; Figure S2: Principal components based on Microcystis cell density data among six stations in Nanwan Reservoir in 2022; Figure S3: Results of cluster analysis of Microcystis population density at different sampling stations (1–6) in the Nanwan Reser-voir in 2022. Table S1: Water quality parameter concentrations corresponding to different classes of water in lake and reservoir (GB 3838-2002); Table S2: Degree levels of cyanobacteria blooms (DB44/T 2261-2020).

Author Contributions

Writing—review and editing, validation, Y.T.; writing—original draft preparation, data curation, C.J.; conceptualization, supervision, methodology, K.W.; writing—review and editing, X.L.; funding acquisition, L.Z.; investigation, H.Z., J.G. and Y.G.; visualization, C.S.; formal analysis, T.Y. and Y.M. All authors have read and agreed to the published version of the manuscript.

Funding

This research was funded by the Natural Science Foundation of Henan, China (No. 242300420175), the Program for Innovative Research Team at Xinyang Agriculture and Forestry University (No. XNKJTD-016), and the National-level Research Project Support Fund at Xinyang Agriculture and Forestry University (No. pyjj20230108).

Data Availability Statement

The data presented in this study are available upon request from the corresponding author.

Acknowledgments

We would like to express our sincere gratitude to all those who contributed to this research project. Special thanks to the affairs center of Nanwan Reservoir in Xinyang City, Henan Province, China, for their invaluable assistance and cooperation throughout the sampling process. We also extend our appreciation to the researchers and technicians involved in data collection, analysis, and interpretation.

Conflicts of Interest

The authors declare no conflicts of interest.

References

  1. Harke, M.J.; Steffen, M.M.; Gobler, C.J.; Otten, T.G.; Wilhelm, S.W.; Wood, S.A.; Paerl, H.W. A review of the global ecology, genomics, and biogeography of the toxic cyanobacterium, Microcystis spp. Harmful Algae 2016, 54, 4–20. [Google Scholar] [CrossRef] [PubMed]
  2. Paerl, H.W.; Otten, T.G. Harmful Cyanobacterial Blooms: Causes, Consequences, and Controls. Environ. Microbiolol. 2013, 65, 995–1010. [Google Scholar] [CrossRef] [PubMed]
  3. Sinha, A.K.; Eggleton, M.A.; Lochmann, R.T. An environmentally friendly approach for mitigating cyanobacterial bloom and their toxins in hypereutrophic ponds: Potentiality of a newly developed granular hydrogen peroxide-based compound. Sci. Total Environ. 2018, 637–638, 524–537. [Google Scholar] [CrossRef] [PubMed]
  4. Qin, B.; Zhu, G.; Gao, G.; Zhang, Y.; Li, W.; Paerl, H.W.; Carmichael, W.W. A drinking water crisis in Lake Taihu, China: Linkage to climatic variability and lake management. Environ. Manag. 2010, 45, 105–112. [Google Scholar] [CrossRef]
  5. Alonso-Andicoberry, C.; García-Viliada, L.; Lopez-Rodas, V.; Costas, E. Catastrophic mortality of flamingos in a Spanish national park caused by cyanobacteria. Vet. Rec. 2002, 151, 706. [Google Scholar]
  6. Komárek, J.; Komárková, J. Review of the European Microcystis-morphospecies (Cyanoprokaryotes) from nature. Czech Phycol. 2002, 2, 1–24. [Google Scholar]
  7. Yu, G.L.; Song, L.R.; Li, R.H. Taxonomic notes on water bloom forming Microcystis species (Cyanophyta) from China—An example from samples of the Dianchi Lake. Acta Phytotax. Sin. 2007, 45, 727–741, (In Chinese with English Abstract). [Google Scholar] [CrossRef]
  8. Zhang, J.Y.; Zhu, B.C.; Wu, Z.J.; Xu, T.; Lu, Z.h. Microcystis panniformis-A newly recorded species of Microcystis in China. J. Lake Sci. 2012, 24, 647–650, (In Chinese with English Abstract). [Google Scholar]
  9. Lv, X.J.; Cheng, Y.; Zhang, S.L.; Hu, Z.W.; Xiao, P.; Zhang, H.; Geng, R.Z.; Li, R.H. Polyphasic Characterization and Taxonomic Evaluation of a Bloom-Forming Strain Morphologically Resembling Radiocystis fernandoi (Chroococcales, Cyanobacteria) from Lake Erhai, China. Diversity 2022, 14, 816. [Google Scholar] [CrossRef]
  10. Wu, Z.X.; Gan, N.Q.; Song, L.R. Genetic diversity: Geographical distribution and toxin profiles of Microcystis strains (Cyanobacteria) in China. J. Integr. Plant Biol. 2007, 49, 262–269. [Google Scholar] [CrossRef]
  11. Bolch, C.J.; Blackburn, S.I. Isolation and purification of Australian isolates of the toxic cyanobacterium Microcystis aeruginosa Kütz. J. Appl. Phycol. 1996, 8, 5–13. [Google Scholar] [CrossRef]
  12. Xu, S.; Sun, Q.; Zhou, X.; Tan, X.; Xiao, M.; Zhu, W.; Li, M. Polysaccharide biosynthesis-related genes explain phenotype-genotype correlation of Microcystis colonies in Meiliang Bay of Lake Taihu, China. Sci. Rep. 2016, 6, 35551. [Google Scholar] [CrossRef]
  13. Liu, H.; Zhang, Q.; Li, M.; Hu, R.; Lei, L. Sequence analysis of gyrB Gene from Microcystis in Lake Taihu and Tangxi Reservoir (Guangdong Province). J. Lake Sci. 2010, 22, 221–226, (In Chinese with English Abstract). [Google Scholar]
  14. Xiao, M.; Li, M.; Reynolds, C.S. Colony formation in the cyanobacterium Microcystis. Biol. Rev. 2018, 93, 1399–1420. [Google Scholar] [CrossRef]
  15. Cellamare, M.; Duval, C.; Drelin, Y.; Djediat, C.; Touibi, N.; Agogué, H.; Leboulanger, C.; Ader, M.; Bernard, C. Characterization of phototrophic microorganisms and description of new cyanobacteria isolated from the saline-alkaline crater-lake Dziani Dzaha (Mayotte, Indian Ocean). FEMS Microbiol. Ecol. 2018, 94, fiy108. [Google Scholar] [CrossRef] [PubMed]
  16. Brunberg, A.-K.; Blomqvist, P. Recruitment of Microcystis (Cyanophyceae) from Lake Sediments: The importance of Littoral Inocula. J. Phycol. 2003, 39, 58–63. [Google Scholar] [CrossRef]
  17. Ma, J.R.; Qin, B.Q.; Wu, P.; Zhou, J.; Niu, C.; Deng, J.M.; Niu, H.L. Controlling cyanobacterial blooms by managing nutrient ratio and limitation in a large hyper-eutrophic lake: Lake Taihu, China. J. Environ. Sci. 2015, 27, 80–86. [Google Scholar] [CrossRef]
  18. An, K.G.; Jones, J.R. Factors regulating bluegreen dominance in a reservoir directly influenced by the Asian monsoon. Hydrobiologia 2000, 432, 37–48. [Google Scholar] [CrossRef]
  19. Ma, J.; Brookes, J.D.; Qin, B.; Paerl, H.W.; Gao, G.; Wu, P.; Zhang, W.; Deng, J.; Zhu, G.; Zhang, Y. Environmental factors controlling colony formation in blooms of the cyanobacteria Microcystis spp. in Lake Taihu, China. Harmful Algae 2014, 31, 136–142. [Google Scholar] [CrossRef]
  20. Yu, G.Z.; Su, H.; Liu, X.C.; Zhao, C.M.; Gao, H.; Huang, K. Effects of function changes of the large reservoirs in Xinyang of Henan Province on water qualities—Usig Nanwan Reservoir as an example. Areal Res. Dev. 2009, 28, 115–119, (In Chinese with English Abstract). [Google Scholar] [CrossRef]
  21. Fu, M.; Wang, Z.; Liang, X. Floristic composition and plant community diversity of water-level fluctuation zone of Nanwan Reservoir. Desalination Water Treat. 2023, 291, 233–241. [Google Scholar] [CrossRef]
  22. Hu, J.; Chi, S.; Hu, J. Studies on stress response of phytoplankton community in Nanwan Reservoir based on ABC curves. Trans. Oceanol. Limnol. 2022, 44, 64–72, (In Chinese with English Abstract). [Google Scholar]
  23. Sun, G.; Duan, J.; Zhao, J. Water quality evaluation and influencing factor analysis of Nanwan Reservoir with a bayesian model based on AHM-CRITIC combination weighting. Pearl River 2023, 44, 84–93+103, (In Chinese with English Abstract). [Google Scholar]
  24. Zuo, J.; Yang, S.; Grossart, H.-P.; Xiao, P.; Zhang, H.; Sun, R.; Li, G.; Jiang, H.; Zhao, Q.; Jiao, M.; et al. Sequential decline in cyanobacterial, total prokaryotic, and eukaryotic responses to backward flow in a river connected to Lake Taihu. Water Res. 2024, 269, 122784. [Google Scholar] [CrossRef] [PubMed]
  25. Wei, F.S. Methods for Monitoring and Analyzing Water and Wastewater, 4th ed.; China Environmental Science Press: Beijing, China, 2002. (In Chinese) [Google Scholar]
  26. Hu, H.J.; Wei, Y.X. The Freshwarter Algae of China-Systematics, Taxonomy and Ecology; Science Press: Beijing, China, 2006; pp. 62–68. (In Chinese) [Google Scholar]
  27. Zhao, W. Hydrobiology, 2nd ed.; Agricultural Press of China: Beijing, China, 2005; pp. 16–31. (In Chinese) [Google Scholar]
  28. Liu, H.; He, B.; Zhou, Y.; Kutser, T.; Toming, K.; Feng, Q.; Yang, X.; Fu, C.; Yang, F.; Li, W. Trophic state assessment of optically diverse lakes using Sentinel-3-derived trophic level index. Int. J. Appl. Earth Obs. Geoinform. 2022, 114, 103026. [Google Scholar] [CrossRef]
  29. Li, R.; Xiao, K.; Zhao, G.; Huang, X.; Li, Z.; Wu, H.; Huang, X.; Pan, Y.; Liang, L. Comprehensive assessment of eutrophication and the mechanisms driving phytoplankton blooms in multifunctional reservoirs. Water 2024, 16, 1752. [Google Scholar] [CrossRef]
  30. Cook, K.V.; Li, C.; Cai, H.; Krumholz, L.R.; Hambright, K.D.; Paerl, H.W.; Steffen, M.M.; Wilson, A.E.; Burford, M.A.; Grossart, H.P. The global Microcystis interactome. Limnol. Oceanogr. 2020, 65, S194–S207. [Google Scholar] [CrossRef]
  31. Zhu, W.; Zhou, X.; Chen, H.; Gao, L.; Xiao, M.; Li, M. High nutrient concentration and temperature alleviated formation of large colonies of Microcystis: Evidence from field investigations and laboratory experiments. Water Res. 2016, 101, 167–175. [Google Scholar] [CrossRef]
  32. Sun, Q.; Zhu, W.; Li, M.; Tan, X. Morphological changes of Microcystis aeruginosa colonies in culture. J. Limnol. 2016, 75, 14–23. [Google Scholar] [CrossRef]
  33. Otsuka, S.; Suda, S.; Li, R.; Matsumoto, S.; Watanabe, M.M. Morphological variability of colonies of Microcystis morphospecies in culture. J. Gen. Appl. Microbiolol. 2000, 46, 39–50. [Google Scholar] [CrossRef]
  34. Carrillo, E.; Ferrero, L.M.; Alonso-Andicoberry, C.; Basanta, A.; Martín, A.; López-Rodas, V.; Costas, E. Interstrain variability in toxin production in populations of the cyanobacterium Microcystis aeruginosa from water-supply reservoirs of Andalusia and lagoons of Doñana National Park (southern Spain). Phycologia 2003, 42, 269–274. [Google Scholar] [CrossRef]
  35. Neilan, B.A. Detection and identification of cyanobacteria associated with toxic blooms: DNA amplification protocols. Phycologia 1996, 35, 147–155. [Google Scholar] [CrossRef]
  36. Li, Y.; Zhou, Y.; Cen, J.; Lü, S.; Hu, H. Taxonomic study on Microcystis (Cyanophyta) from some scenic lakes in Guangzhou. J. Trop. Subtrop. Bot. 2010, 18, 405–414, (In Chinese with English Abstract). [Google Scholar]
  37. Wang, J.; Shi, Y.; Liu, Q.; Li, Z.; Zhang, M.; Xie, S. Taxonomic and molecular phylogenetics of bloom-forming algae from the Taiyuan section of Fenhe River, China. J. Lake Sci. 2018, 30, 1332–1342, (In Chinese with English abstract). [Google Scholar]
  38. Loudiki, M.; Oudra, B.; Sabour, B.; Sbiyyaa, B.; Vasconcelos, V. Taxonomy and geographic distribution of potential toxic cyanobacterial strains in Morocco. Ann. Limnol. 2002, 38, 101–108. [Google Scholar] [CrossRef]
  39. You, B. Assessment on present situation for sites of drinking water sources at Nanwan Reservoir in Xinyang city and countermeasures for protection. Water Resour. Prot. 2001, 4, 45–47+73, (In Chinese with English Abstract). [Google Scholar]
  40. DB44/T 2261-2020; Technical Specification for Classification and Monitoring of Algal Blooms. Guangdong Provincial Local Standard. Guangdong Market Supervision Administration: Guangzhou, China, 2020. (In Chinese)
  41. Zhu, C.; Yang, X.; Zhao, B.; Zhang, M.; Zhang, F. Spatiotemporal dynamics of phytoplankton and cyanotoxins in Chaohu Lake during summer cyanobacterial blooms of 2017. Environ. Monit. China 2018, 34, 103–112, (In Chinese with English Abstract). [Google Scholar]
  42. Su, Y.; Lin, J.; Lin, W.; Lan, R.; Cheng, Y.; Lin, Q.; Zhang, Y. Spatial and temporal dynamics of cyanobacteria Microcystis in Shanzi Reservoir of Fujian Province. J. Fujian Norm. Univ. (Nat. Sci. Ed.) 2016, 32, 63–69, (In Chinese with English Abstract). [Google Scholar]
  43. Liu, X.; Lu, X.; Chen, Y. The effects of temperature and nutrient ratios on Microcystis blooms in Lake Taihu, China: An 11-year investigation. Harmful Algae 2011, 10, 337–343. [Google Scholar] [CrossRef]
  44. Wu, Y.; Li, L.; Gan, N.; Zheng, L.; Ma, H.; Shan, K.; Liu, J.; Xiao, B.; Song, L. Seasonal dynamics of water bloom-forming Microcystis morphospecies and the associated extracellular microcystin concentrations in large, shallow, eutrophic Dianchi Lake. J. Environ. Sci. 2014, 26, 1921–1929. [Google Scholar] [CrossRef]
  45. Ger, K.A.; Urrutia-Cordero, P.; Frost, P.C.; Hansson, L.-A.; Sarnelle, O.; Wilson, A.E.; Lürling, M. The interaction between cyanobacteria and zooplankton in a more eutrophic world. Harmful Algae 2016, 54, 128–144. [Google Scholar] [CrossRef] [PubMed]
  46. Gobler, C.J.; Burkholder, J.M.; Davis, T.W.; Harke, M.J.; Johengen, T.; Stow, C.A.; Van de Waal, D.B. The dual role of nitrogen supply in controlling the growth and toxicity of cyanobacterial blooms. Harmful Algae 2016, 54, 87–97. [Google Scholar] [CrossRef]
  47. Kitchens, C.M.; Johengen, T.H.; Davis, T.W. Establishing spatial and temporal patterns in Microcystis sediment seed stock viability and their relationship to subsequent bloom development in Western Lake Erie. PLoS ONE 2018, 13, e0206821. [Google Scholar] [CrossRef]
  48. Dick, G.J.; Duhaime, M.B.; Evans, J.T.; Errera, R.M.; Godwin, C.M.; Kharbush, J.J.; Nitschky, H.S.; Powers, M.K.A.; Vanderploeg, H.A.; Schmidt, K.C. The genetic and ecophysiological diversity of Microcystis. Environ. Microbiolol. 2021, 23, 7278–7313. [Google Scholar] [CrossRef] [PubMed]
  49. Yan, S.; Yao, Y.; Li, D.; Sun, T.; Leng, X. The influence of water quality on spatial-temporal pattern of phytoplankton diversity in Chaohu Lake. Wetl. Sci. Manag. 2024, 20, 50–54, (In Chinese with English Abstract). [Google Scholar]
  50. Sun, J.; Wang, J.; Yang, Y.; Chen, J.; Zhou, Q.; Zhong, W. Temporal and spatial characteristics and abnormal changes of nitrogen and phosphorus in Poyang lake and the impact pathways. Jiangxi Hydraul. Sci. Technol. 2024, 50, 199–205, (In Chinese with English Abstract). [Google Scholar]
  51. Chaffin, J.D.; Bridgeman, T.B.; Heckathorn, S.A.; Mishra, S. Assessment of Microcystis growth rate potential and nutrient status across a trophic gradient in western Lake Erie. J. Great Lakes Res. 2011, 37, 92–100. [Google Scholar] [CrossRef]
  52. Kromkamp, J.; van den Heuvel, A.; Mur, L.R. Phosphorus uptake and photosynthesis by phosphate-limited cultures of the cyanobacterium Microcystis aeruginosa. Br. Phycol. J. 1989, 24, 347–355. [Google Scholar] [CrossRef]
  53. Duhamel, S.; Nogaro, G.; Steinman, A.D. Effects of water level fluctuation and sediment–water nutrient exchange on phosphorus biogeochemistry in two coastal wetlands. Aquat. Sci. 2017, 79, 57–72. [Google Scholar] [CrossRef]
  54. Chen, M.; Ding, S.; Chen, X.; Sun, Q.; Fan, X.; Lin, J.; Ren, M.; Yang, L.; Zhang, C. Mechanisms driving phosphorus release during algal blooms based on hourly changes in iron and phosphorus concentrations in sediments. Water Res. 2018, 133, 153–164. [Google Scholar] [CrossRef]
  55. Chaffin, J.D.; Bridgeman, T.B.; Bade, D.L. Nitrogen constrains the growth of late summer cyanobacterial blooms in Lake Erie. Adv. Microbiol. 2013, 3, 16–26. [Google Scholar] [CrossRef]
  56. Chaffin, J.D.; Davis, T.W.; Smith, D.J.; Baer, M.M.; Dick, G.J. Interactions between nitrogen form, loading rate, and light intensity on Microcystis and Planktothrix growth and microcystin production. Harmful Algae 2018, 73, 84–97. [Google Scholar] [CrossRef] [PubMed]
  57. Schampera, C.; Hellweger, F.L. Nitrogen availability controls response of microcystin concentration to phosphorus reduction: Evidence from model application to multiple lakes. Harmful Algae 2024, 139, 102711. [Google Scholar] [CrossRef] [PubMed]
  58. Li, N.; Wang, J.; Yin, W.; Jia, H.; Xu, J.; Hao, R.; Zhong, Z.; Shi, Z. Linking water environmental factors and the local watershed landscape to the chlorophyll a concentration in reservoir bays. Sci. Total Environ. 2020, 758, 143617. [Google Scholar] [CrossRef]
  59. Qin, Q.; Shen, J. Physical transport processes affect the origins of harmful algal blooms in estuaries. Harmful Algae 2019, 84, 210–221. [Google Scholar] [CrossRef]
  60. Burford, M.A.; Johnson, S.A.; Cook, A.J.; Packer, T.V.; Taylor, B.M.; Townsley, E.R. Correlations between watershed and reservoir characteristics, and algal blooms in subtropical reservoirs. Water Res. 2007, 41, 4105–4114. [Google Scholar] [CrossRef]
  61. Jeong, K.-S.; Kim, D.-K.; Joo, G.-J. Delayed influence of dam storage and discharge on the determination of seasonal proliferations of Microcystis aeruginosa and Stephanodiscus hantzschii in a regulated river system of the lower Nakdong River (South Korea). Water Res. 2007, 41, 1269–1279. [Google Scholar] [CrossRef]
Figure 1. Location of Nanwan Reservoir in Xinyang, China, and six sampling sites (red circle).
Water 16 03569 g001
Figure 2. Box plots of monthly physicochemical factors at six sampling sites in Nanwan Reservoir in 2022.
Water 16 03569 g002
Figure 3. Monthly trophic level index (TLI) at six sampling sites in Nanwan Reservoir in 2022.
Water 16 03569 g003
Figure 4. Seven Microcystis species collected from Nanwan Reservoir (a. M. botrys; b. M. smithii; c. M. novacekii; d. M. firma; e. M. wesenbergii; f. M. aeruginosa; g. Suspected M. flos-aquae). Scale bar = 20 μm.
Water 16 03569 g004
Figure 5. Monthly Microcystis population density (a) and relative abundance (b) among six sampling sites in Nanwan Reservoir in 2022.
Water 16 03569 g005
Figure 6. Ordination biplots exhibiting the distribution pattern of population density of Microcystis at different stations.
Water 16 03569 g006
Figure 7. Mantel Test showed the correlation between Microcystis cell density (Mic.density) and environmental factors.
Water 16 03569 g007
Table 1. The best model of stepwise multiple regression for the population density of Microcystis for the pooled data from the six stations.
Model, R2 = 0.2
VariablesnCoefficientSEStandardized Coefficienttp
Intercept58−1,139,422.01,954,975.8 −0.5830.562
NO 3 -N5811,298,762.13,348,257.50.4113.375<0.01
Note: All independent variables are shown in Figure 7. SE denotes standard error.
Table 2. Cell diameters (μm) of Microcystis across different regions. Average ± standard deviation and ranges are provided.
Microcystis SpeciesNanwan Reservoir (This Study)Dianchi
(Yunnan, China) [7]
Lakes in Guangzhou (Guangdong, China) [36]Europe [6]
M. botrys5.22 ± 0.65
4.00 to 6.54
5.4 ± 0.51
4.3 to 6.5
4.0 to 6.04.9 to 6
M. novacekii3.62 ± 0.47
2.90 to 5.09
4.9
3.7 to 5.8
3.5 to 6.22.4 to 6
M. smithii4.65 ± 0.61
3.67 to 5.89
4.3 ± 0.73
2.5 to 6.0
2.2 to 5.53.2 to 5.6
M. wesenbergii6.47 ± 0.80
4.67 to 8.34
6.4 ± 0.74
4.5 to 8.1
4.5 to 7.54 to 8.5
M. flos-aquae6.32 ± 0.90
4.56 to 7.85
4.6
3.7 to 4.9
3.0 to 5.83.5 to 4.8
M. aeruginosa4.71 ± 0.62
3.39 to 6.20
5.3 ± 0.59
3.8 to 6.3
3.5 to 6.04 to 6.5
M. firma1.97 ± 0.56
1.26 to 3.36
3.0 ± 0.35
2.0 to 3.7
2.0 to 3.52 to 3.7
Disclaimer/Publisher’s Note: The statements, opinions and data contained in all publications are solely those of the individual author(s) and contributor(s) and not of MDPI and/or the editor(s). MDPI and/or the editor(s) disclaim responsibility for any injury to people or property resulting from any ideas, methods, instructions or products referred to in the content.

