Article

Identification of the Driving Factors to Algal Biomass in Lake Dianchi: Implications for Eutrophication Control

1
Changjiang Basin Ecology and Environment Monitoring and Scientific Research Center, Changjiang Basin Ecology and Environment Administration, Ministry of Ecology and Environment, Wuhan 430010, China
2
Yunnan Ecological and Environmental Monitoring Center, Kunming 650034, China
*
Authors to whom correspondence should be addressed.
Water 2024, 16(23), 3485; https://doi.org/10.3390/w16233485
Submission received: 8 October 2024 / Revised: 19 November 2024 / Accepted: 28 November 2024 / Published: 3 December 2024

Abstract

:
Accurate analysis of spatiotemporal variations in algal biomass and their underlying causes is crucial for controlling algal blooms and enhancing aquatic ecological quality. The present study, spanning 2011 to 2020, was conducted across 10 sites in Lake Dianchi, where peak algal biomass levels occur from May to September, with higher concentrations in the lake’s northern zones compared to other areas. Employing Spearman’s correlation analysis, generalized additive models (GAMs), and random forest (RF) techniques, the relationships between algal biomass and water quality indicators were investigated. Spearman’s correlation analysis revealed a positive relationship between chlorophyll a (Chla) and total phosphorus (TP) across various spatial scales. RF analysis identified TP as the most influential factor on a lake-wide scale; while in localized RF models, organic pollution-related indicators (COD, CODMn, and BOD5) and TP consistently emerged as the primary predictors of Chla at most sites. GAM results indicated spatially variable and nonlinear responses of algal biomass to predictors, reinforcing TP’s significance lake-wide and at many localized scales. This comprehensive analytical approach provides valuable insights into the role of water quality factors and nonlinear dynamics, thereby advancing our understanding of the relationships between algal biomass and environmental conditions. These findings are pivotal for the development of scientifically informed strategies for lake management and conservation.

1. Introduction

The over-proliferation of algae represents a global concern, as toxic algae produce harmful toxins that threaten the health of both humans and animals [1]. Moreover, while non-toxic varieties may not produce direct toxins, they can still lead to reduced oxygen levels in water (hypoxia), which causes fish kills and negatively impacts aquatic ecosystems [2]. Furthermore, excessive algae can result in a decline in biodiversity by altering habitat conditions and reducing the available oxygen for other organisms; in severe cases, this can even lead to ecosystem destruction [3]. This issue also imposes considerable economic burdens on communities, encompassing expenses associated with water treatment, diminished revenues from tourism and recreational activities, as well as declining property values [1,4]. Shallow lakes situated in proximity to human settlements are highly susceptible to algal biomass over-proliferation, influenced by a range of environmental factors [5]. Hence, identifying these factors is imperative for the effective management and protection of eutrophic lake ecosystems. However, natural spatial variability in water quality within lakes and reservoirs, driven by climate, hydrodynamics, pollutant inputs, and bathymetry [6], underscores the necessity of comprehending the spatial heterogeneity of these factors in order to enhance control over eutrophication.
Lake Dianchi, located in the southwest of China, is the largest freshwater lake in Yunnan province and one of the famous plateau lakes of China. Since the 1980s, rapid transformation from oligotrophic to hypereutrophic conditions has occurred [7]. Several factors have contributed to the eutrophication of Dianchi Lake. On the natural side, the lake is fed by numerous inflowing rivers, while it has only one outflowing river (the Haikou River). This situation results in a long water exchange cycle, and the relatively shallow depth of the lake makes it prone to the accumulation of pollutants [8]. Additionally, anthropogenic factors play a significant role. The main sources of pollution in Dianchi Lake stem from the large population and the irrational exploitation of resources. Specifically, industrial pollution, agricultural runoff, and other domestic waste have directly threatened the water quality of Dianchi Lake and are primary contributors to its eutrophication [7,8,9]. The total phosphorus and total nitrogen levels have increased from 0.09 to 0.10 mg/L and 0.19–1.16 mg/L in the 1980s to 0.12–0.33 mg/L and 1.47–2.68 mg/L at the beginning of this century, respectively [7]. Phytoplankton density reached 107 to 108 cells/L, with cyanobacteria becoming the dominant species [7]. This shift has drawn significant attention to the lake’s water quality, particularly concerning cyanobacterial blooms, prompting extensive research and discussion. Despite governmental efforts through policy development and regulatory measures aimed at enhancing the ecological environment of the Dianchi watershed, challenges persist in effectively addressing algal bloom occurrences. Pollution control initiatives have shown some success; however, the issue of algal blooms remains unresolved [8,10,11]. And the positive feedback effect of cyanobacterial organic matter accumulation in sediments on lake eutrophication has been revealed in Dianchi [12]. Therefore, the control of eutrophication in Dianchi Lake must consider the impact of algal blooms.
Since 2010, the Chinese central government has implemented policies and resource management strategies aimed at mitigating eutrophication in Dianchi Lake to reduce the negative impact of cyanobacterial blooms on ecosystems and water resources. The planning for water pollution prevention and control in key river basins (2011–2015), released by Ministry of Ecology and Environment (MEE) in 2012, outlines several crucial conservation initiatives [13]. A comprehensive strategy has been proposed, encompassing external water transfers, water conservation, and recycling within the Lake Dianchi basin, alongside ecological restoration efforts for the lake itself. Key components include the implementation of the Niulanjiang–Dianchi water replenishment project, enhancements to rain and pollution diversion pipe networks, and strengthened nitrogen and phosphorus treatment in sewage plants. Moreover, efforts aim to increase the utilization of reclaimed water in Kunming City and Anning City’s main urban areas, while strictly regulating non-point source pollution from the lake’s eastern, western, and southern catchments. To assess the efficacy of these measures and facilitate timely adjustments if needed, a current assessment of the factors driving algal biomass in Lake Dianchi is essential.
Lake Dianchi, covering an area of 298 km2, necessitates spatially varied assessments of monitoring data due to its inherent spatial heterogeneity [6], an aspect that has received comparatively less research attention. Furthermore, the relationship between organisms and their environment often exhibits nonlinear dynamics, challenging traditional statistical methods like linear regression in accurately capturing underlying trends. Generalized additive models (GAMs) offer a means to depict specific response relationships between variables but are susceptible to issues such as outlier sensitivity and collinearity [14]. In contrast, random forest (RF), a machine learning method, proves adept at revealing nonlinear effects, is robust against outliers and collinearity, and is capable of ranking variable importance, thereby addressing the limitations of GAMs [5,15].
This study examines the relationship between algal biomass (represented by chlorophyll a) and water quality indicators across 10 monitoring sites from 2011 to 2020 in Lake Dianchi. Correlation analysis, random forest (RF), and generalized additive models (GAMs) were utilized to investigate the drivers of algal biomass and elucidate mechanisms underlying algal bloom formation at both local and lake-wide scales. The findings presented offer a comprehensive and robust perspective for effectively managing algal blooms in Lake Dianchi.

2. Material and Methods

2.1. Study Area

Lake Dianchi is a shallow plateau lake located in Yunnan Province, China (latitude 24°40′~25°2′ N; longitude 102°35′~120°48′ E). Lake Dianchi has an average depth of 5 m, an elevation of 1886 m, and a surface area of 298 km2. The main inflow is Panlongjiang River in the northeast and the lake drains out through Tanglangchuan River in the southeast [16]. Lake Dianchi is divided into two main sections: Caohai, comprising 2.5% of the total lake area, and Waihai, which constitutes the remaining 97.5%. These sections are separated by the artificial Haigeng dam (see Figure 1), with the Xiyuan tunnel facilitating connectivity between them.
All the monitoring sites are national control water quality monitoring sites. The CHZX and DQ sites (with water depths of 1–2 m) are located in Caohai, while the other monitoring sites, with water depths of 3–5 m, are situated in the Waihai. Among these, the CHZX, DQ, and HWZ sites are adjacent to the main urban area of Kunming, and the HKX section is relatively close to the outlet of Dianchi Lake (Haikou River). The DCN site is the southernmost monitoring point. The monitoring sites basically cover all the main areas of Dianchi Lake.

2.2. Data Source

The dataset utilized in this study was sourced from Yunnan Ecological and Environmental Monitoring Center, encompassing data from 10 designated sampling sites distributed monthly across Lake Dianchi. Each site was subject to monitoring across 13 key parameters: chlorophyll-a (as Chla), water temperature (WT), pH, conductivity (Cond), Secchi depth (SD), dissolved oxygen (DO), the permanganate index (CODMn), ammonia nitrogen (NH3N), total nitrogen (TN), total phosphorus (TP), chemical oxygen demand (COD), and fluoride. January 2011–December 2020 was selected as the studied period to ensure the consistency and continuity of data, covering the same period as the “12th and 13th Five Year Plan”.

2.3. Study Methodology

The statistical analysis in this study was conducted at both local and lake-wide scale. At the local scale, a site-by-site analysis was employed to assess the relationship between chlorophyll-a (Chla) and various environmental factors. Conversely, analysis at the lake-wide scale involved aggregating data from all sites for comprehensive analysis. Detailed descriptions of the statistical methodologies employed in this research can be found in Section 2.3.1, Section 2.3.2 and Section 2.3.3.

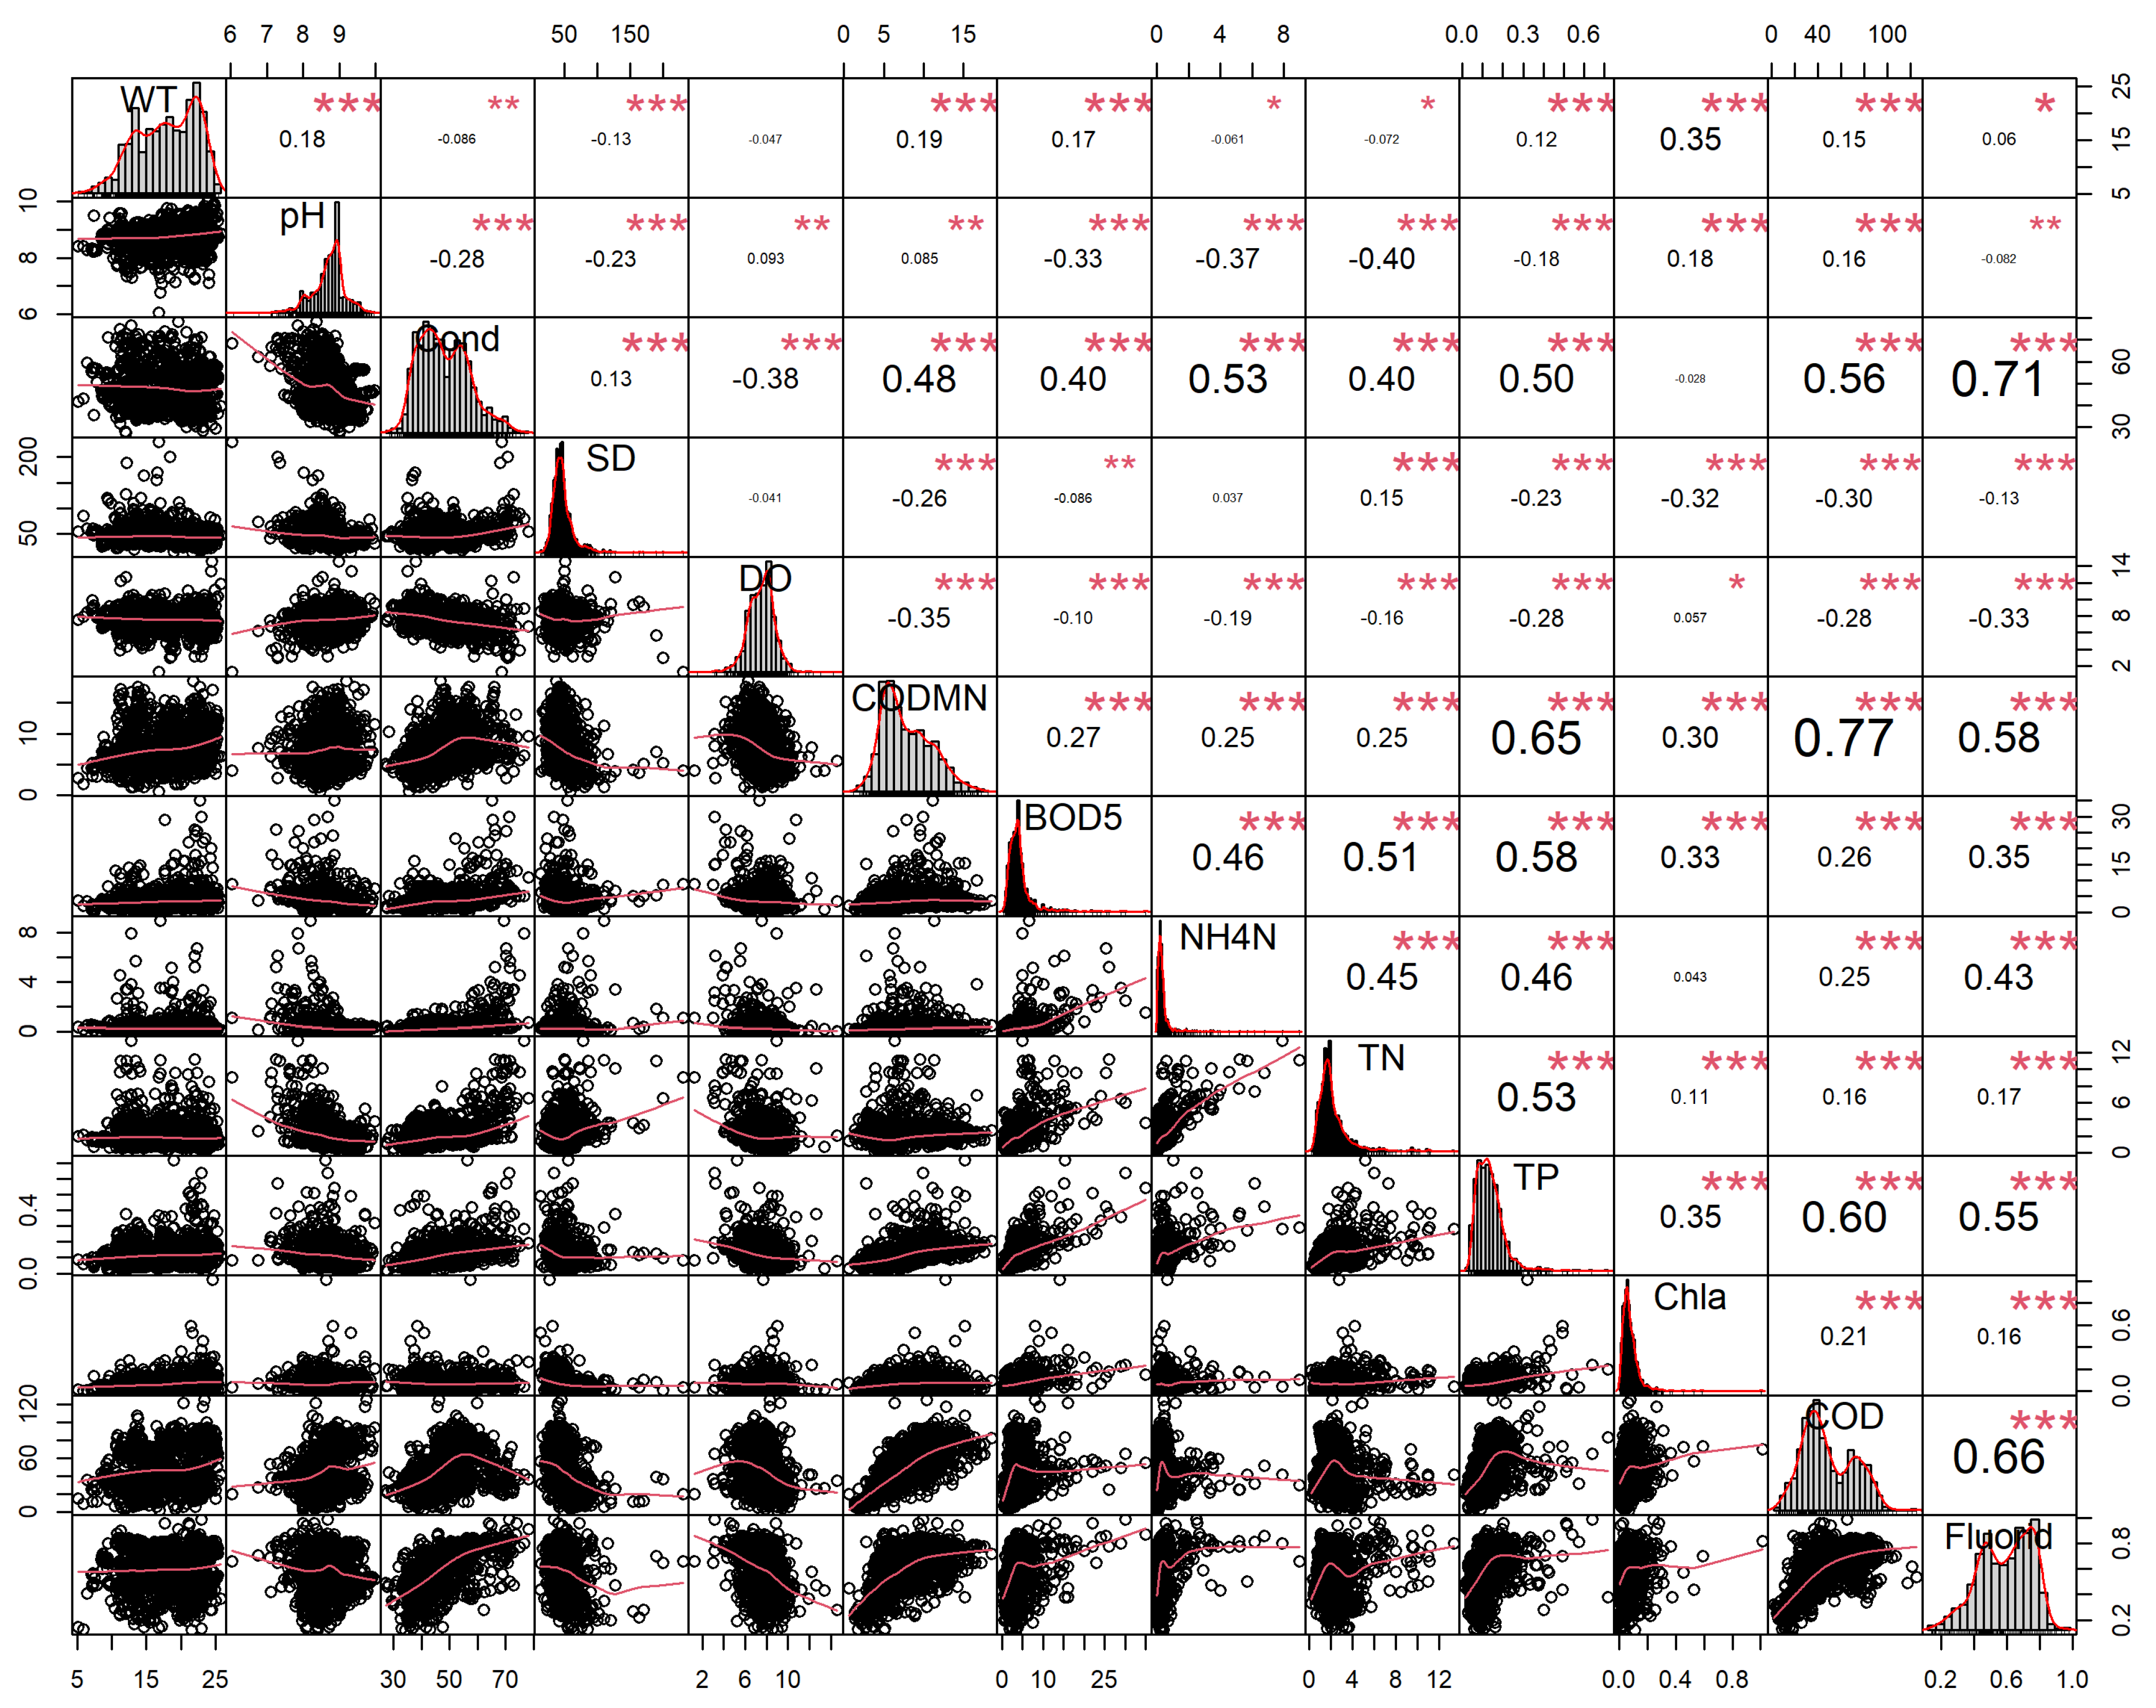
2.3.1. Correlation Analysis

Spearman’s rank correlation method was employed in this study to explore relationships among various indicators, as the data used did not conform to a normal distribution. Spearman’s rank correlation was performed in ‘PerformanceAnalytics’ package [17] of R software version: 4.2.1.

2.3.2. Random Forest Analysis

The random forest (RF) model has proven highly effective for both classification and regression tasks [18], being particularly suited to capturing nonlinear relationships among variables and exhibiting robustness against outliers. Consequently, RF models have gained widespread adoption across various disciplines, often outperforming traditional statistical approaches [15,19].
In this study, RF models were employed to assess the impact of environmental variables on algal biomass variation, with chlorophyll-a (Chla) serving as the response variable. The analysis included 15 explanatory variables: 12 nutrients and physicochemical indexes (refer to Table 1), along with 3 spatial–temporal variables (Month, Year, Site). Model performance was evaluated using the coefficient of determination (R2), while predictor importance was assessed based on increases in mean squared error (MSE). Parameters such as mtry, ntree, and nodesize were adjusted to optimize model accuracy. The RF modeling was conducted using the ‘randomForest’ package [17,20] of R software version: 4.2.1.

2.3.3. Generalized Additive Model Analysis

Algal biomass, represented by chlorophyll-a (Chla), was modeled using a Gaussian generalized additive model (GAM) with an identity link function. Chla served as the response variable, while the remaining 15 variables (see Table 1), including sampling time (Year and Month) and location (Site), were treated as covariates to mitigate their potential interference effects. The GAMs were fitted using the ‘mgcv’ package (version 1.8-24) [21] implemented in R (version 4.2.1). The GAM structure is as follows:
g μ Y = β 0 + f 1 x 1 + + f m x m
where g(.) is the connection function, μ(Y) is the expected value of the response variable, β 0 is a constant, and f i x i is a smooth function of the explanatory variable x i (i = 1, 2, … m).
Prior to incorporating any covariates into the model, Cleveland dot plots were employed to detect outliers across all variables. Variables showing outliers were log-transformed accordingly. Additionally, collinearity among the explanatory variables was assessed using variance inflation factors (VIFs) derived from the global models. Variables with high VIF values were sequentially removed until all remaining variables exhibited VIF values below 3 [14,22].
Following the establishment of non-correlated variables, a stepwise backward selection process, commencing from an initial full model, was employed to derive optimal models based on their Bayesian information criteria (BIC) values [23]. A lower BIC value indicates a better fit of the model to the data [14]. Starting from the complete model, the covariate with the highest nonsignificant p-value was eliminated, and the data were re-evaluated using the reduced model. If this iteration yielded a reduced BIC value, the model was retained, and the process continued by removing the covariate with the highest p-value removed. This iterative procedure persisted until the removal of any covariate led to a higher BIC value. In instances where eliminating the least significant covariate resulted in an elevated BIC value, subsequent less significant terms were removed, continuing until no further reductions in BIC were achieved. Diagnostic plots were also generated to assess the model fitting performance [14].

3. Results

3.1. Evaluation of Lake-Wide Scale

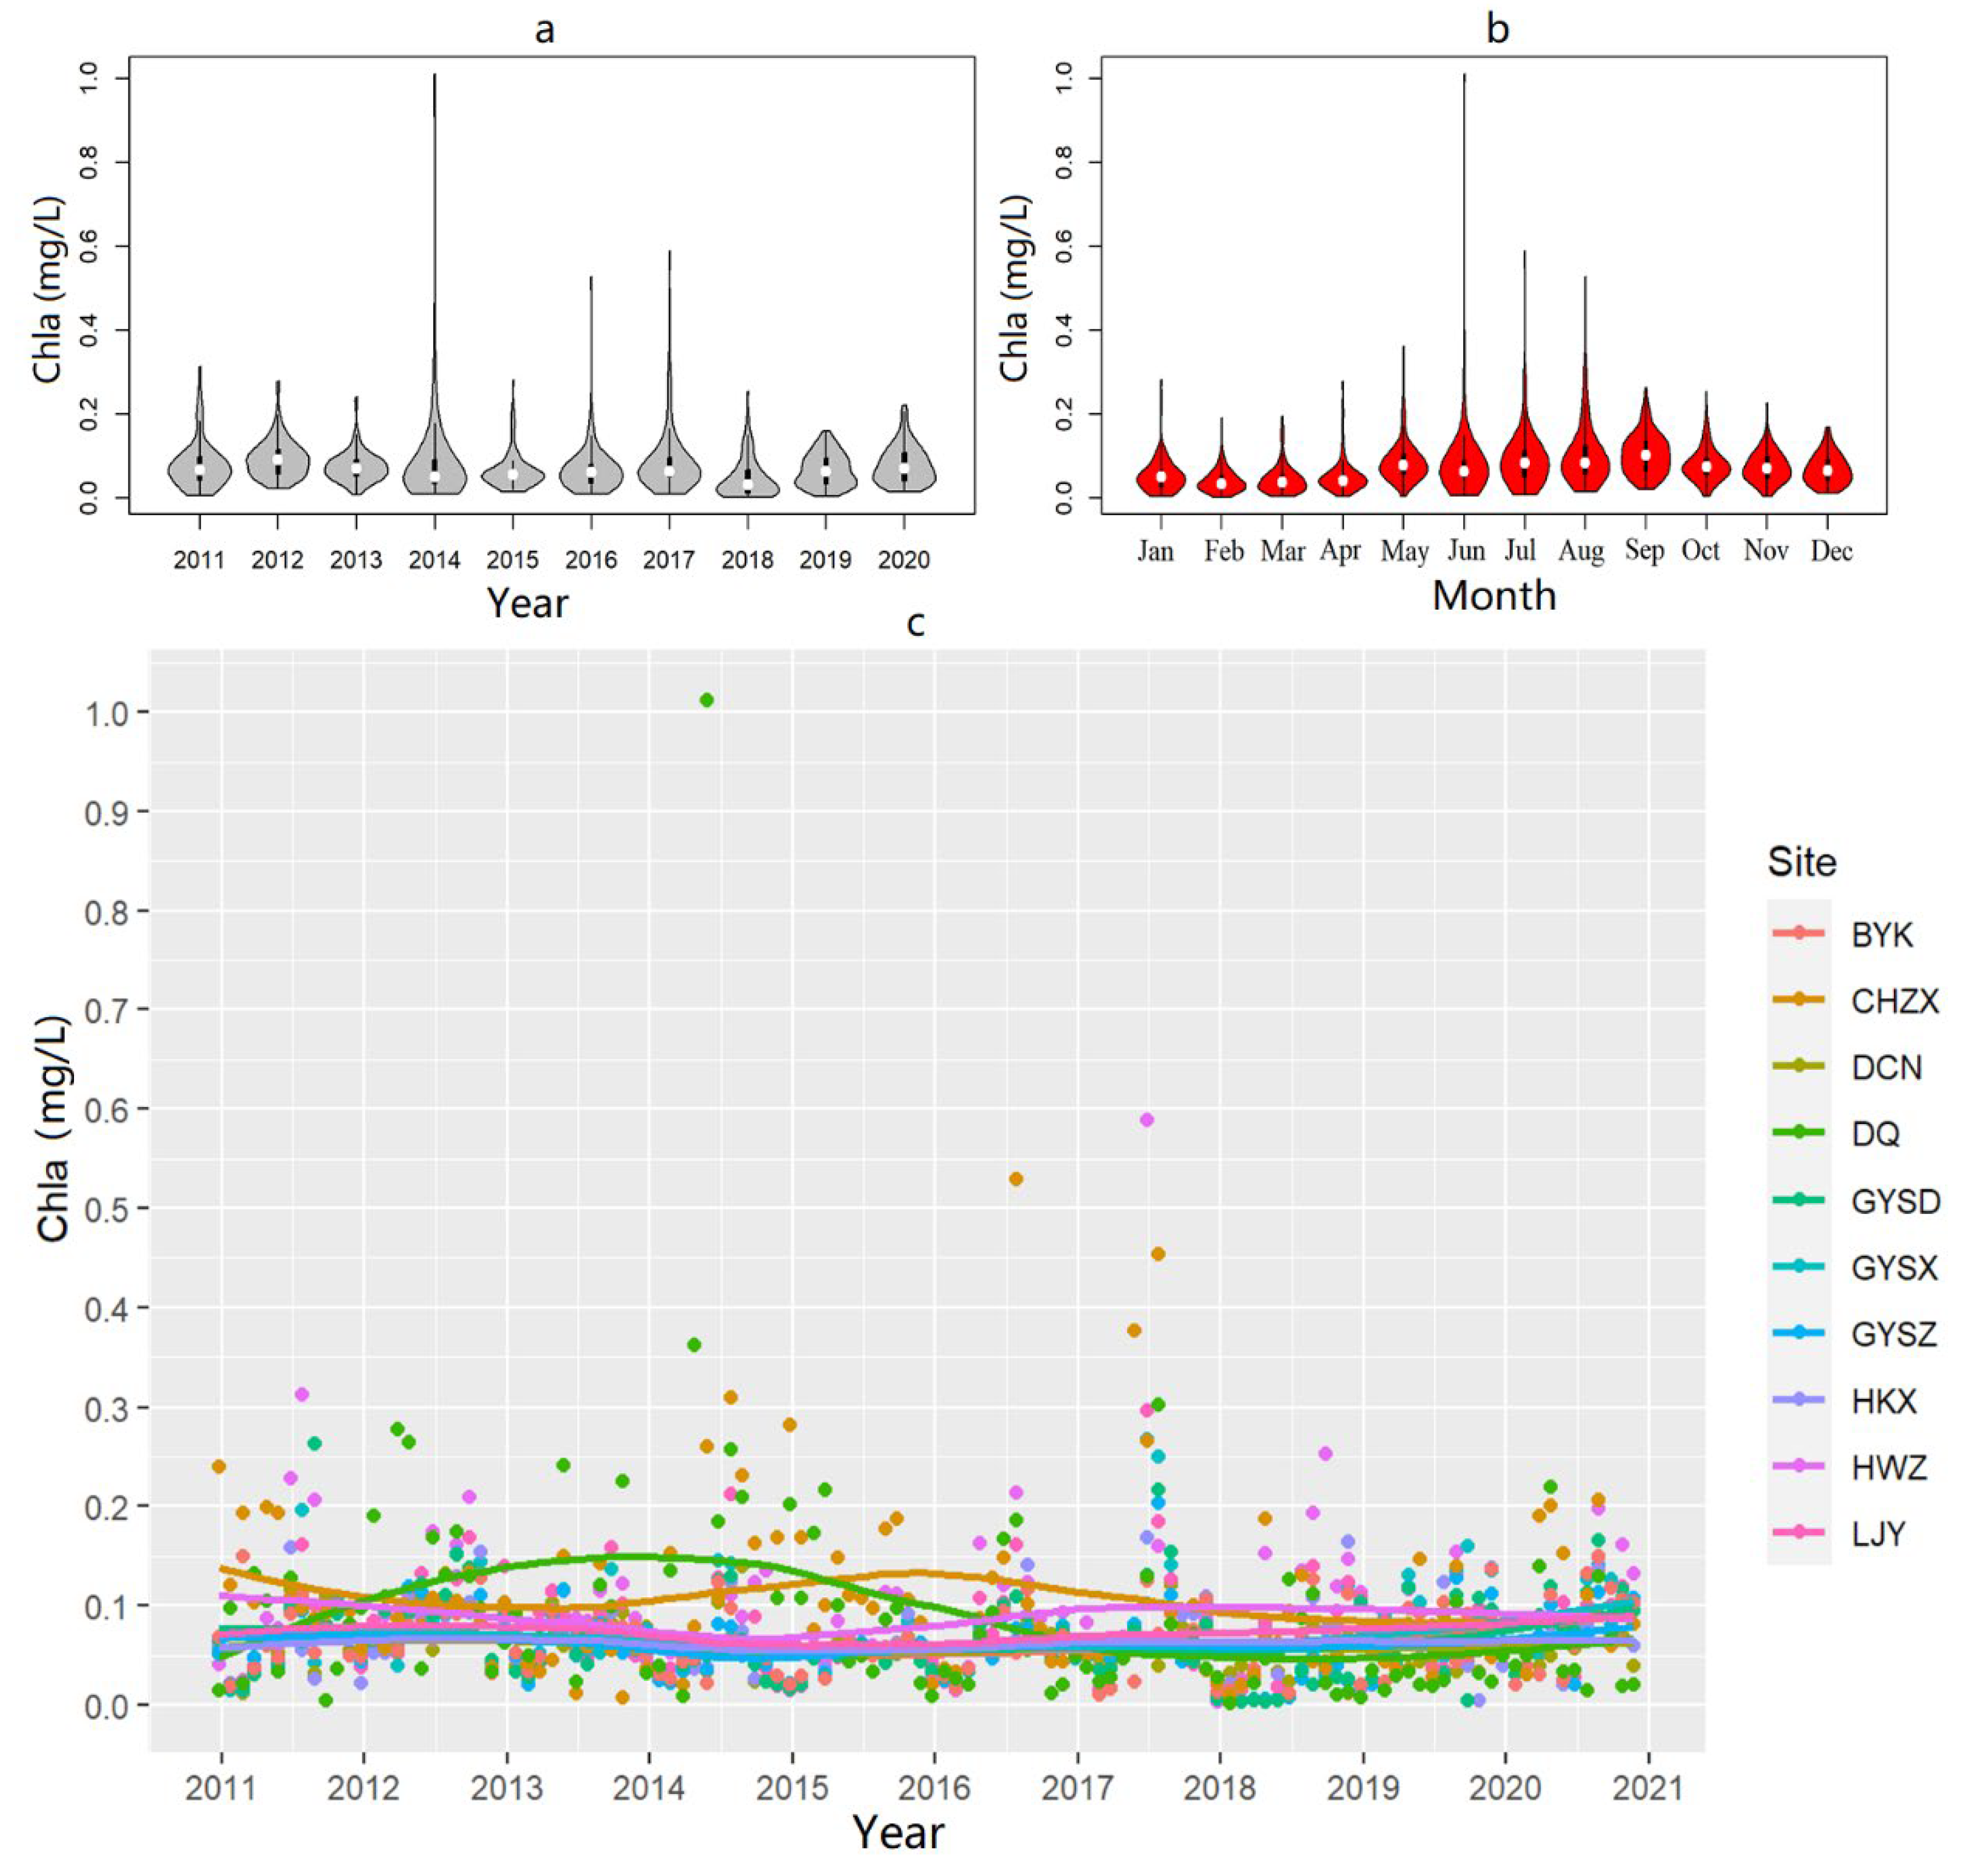
3.1.1. Descriptive Summary

The data include monthly water quality monitoring records from 10 monitoring sites spanning from 2011 to 2020, totaling 1200 observations. The descriptive summary of all variables in Lake Dianchi has been detailed in Table 1. Chla concentrations ranged from 0.002 mg/L to 1.01 mg/L, with a mean of 0.074 mg/L. The annual average Chla concentration gradually decreased from 2011 to 2017, with 2018 marking the lowest value in the past decade. After 2018, the concentration began to gradually increase (Figure 2a). Monthly average data revealed higher Chla concentrations from May to September, while lower concentrations were observed in the remaining months (Figure 2b).
TP concentrations ranged from 0.015 mg/L to 0.72 mg/L, with a mean of 0.125 mg/L, indicating the presence of abundant nutrients in the water. TN levels ranged from 0.20 mg/L to 13.40 mg/L, with a mean of 2.22 mg/L. NH3N concentrations ranged from 0.015 mg/L to 8.99 mg/L, with a mean of 0.39 mg/L. BOD5 values ranged from 0.20 mg/L to 35.00 mg/L, with a mean of 3.99 mg/L. CODMn values ranged from 0.60 mg/L to 18.50 mg/L, with a mean of 7.73 mg/L, indicating varying organic contamination levels. COD values ranged from 2.00 mg/L to 125.00 mg/L, with a mean of 47.83 mg/L. DO levels ranged from 1.26 mg/L to 14.6 mg/L, with a mean of 7.56 mg/L. Conductivity values varied between 27.30 µS/cm and 78.30 µS/cm, with a mean of 47.96 µS/cm. The pH values ranged from 6.04 to 9.98, with a mean of 8.71. Fluoride concentrations ranged from 0.12 mg/L to 0.99 mg/L, with a mean value of 0.59 mg/L. At the whole-lake scale, the annual mean concentrations of fluoride, Cond, NH3N, BOD5, COD, CODMn, TN, and TP show a gradual decreasing trend, while the DO concentration slightly increases. The changes in WT, pH, and SD do not show any obvious annual pattern (Figure S1).
The results of the lake-wide Spearman’s rank correlation analysis revealed a notably significant (p < 0.001) positive correlation between Chla and WT, pH, CODMn, BOD5, TN, TP, COD, and fluoride. Additionally, Chla exhibited a highly significant (p < 0.001) negative correlation with SD, as illustrated in Figure 3.

3.1.2. Random Forest Analysis

Both increases in mean squared error (%) (MSE%) and increments in node purity (IncNodePurity) indicated that TP, BOD5, Month, and WT emerged as the most significant predictors (Figure 4a). Among the non-nutrient indices, Month and WT were particularly notable for their high ranking (Figure 4a). The trained random forest (RF) model demonstrated a robust performance with an R2 of 0.94, explaining 54.58% of the deviation (Figure 4b).

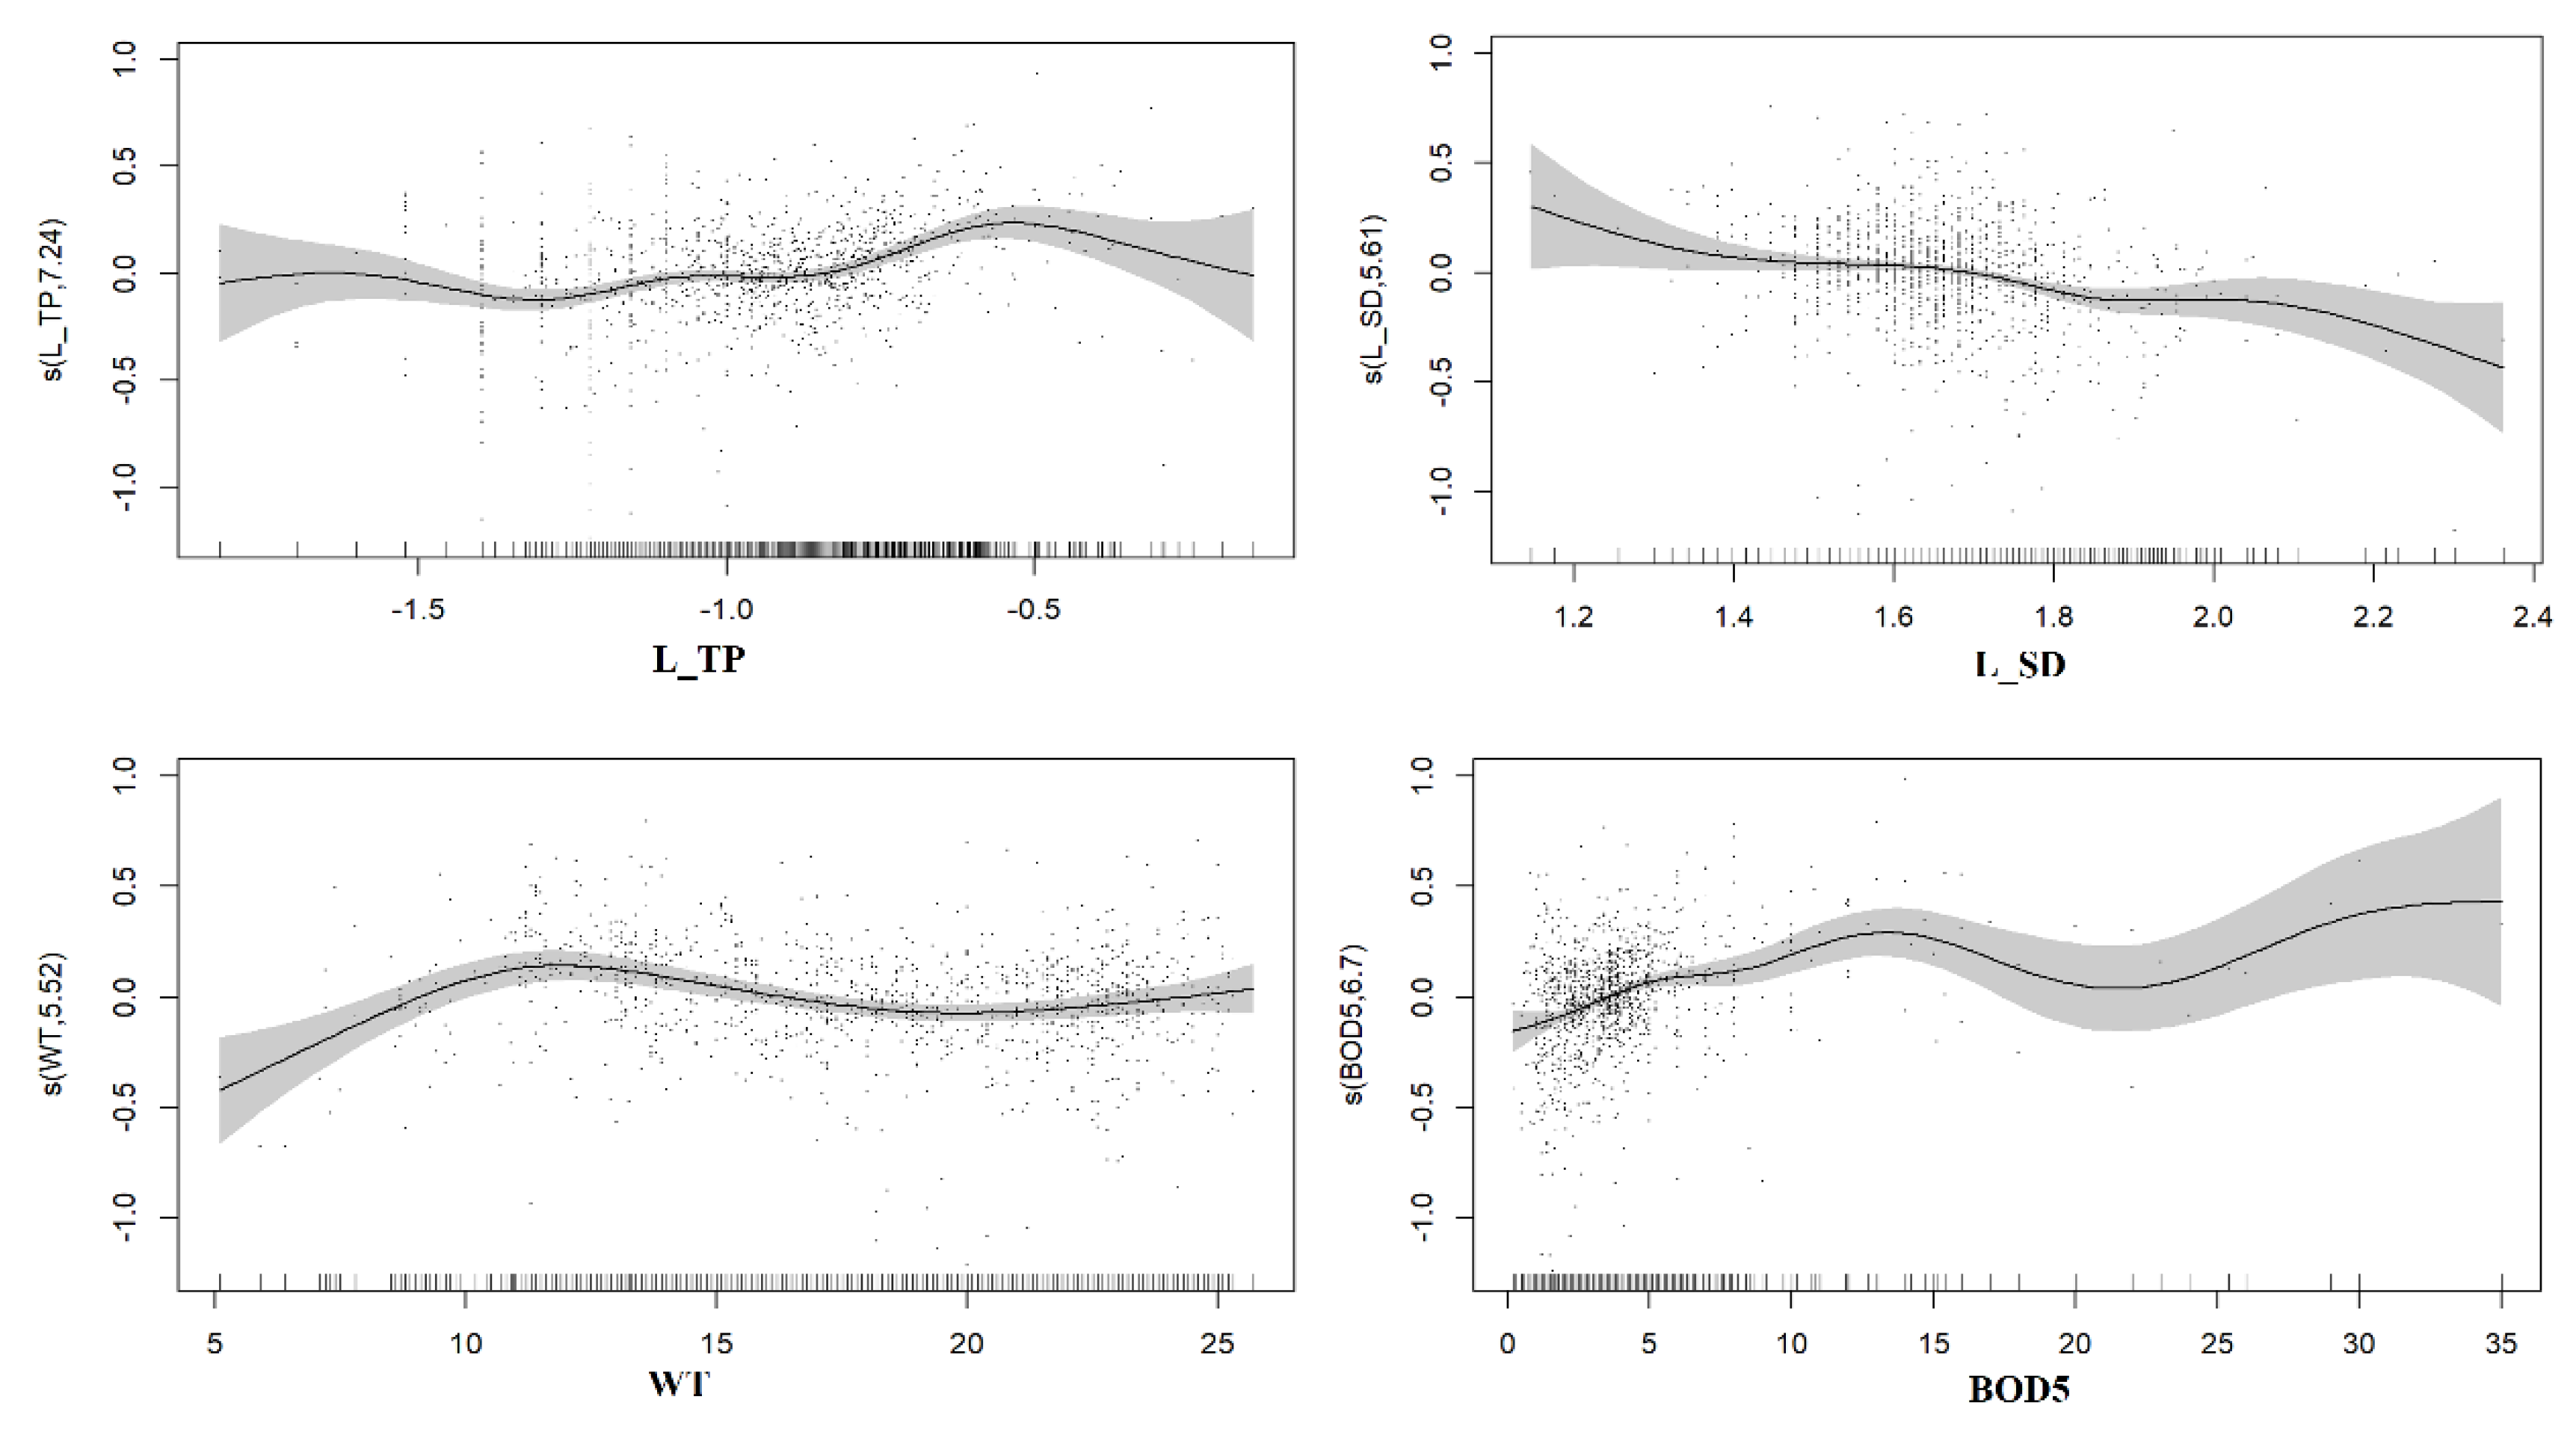
3.1.3. Generalized Additive Model Analysis

The optimal GAM incorporated L_TP, L_SD, WT, and BOD5, explaining 51.6% of the deviance with an R2 of 0.49 (Table 2). Lake-wide GAM results indicated that Chla exhibited a nonlinear response to variations in TP (p < 0.001, Table 2 and Figure 5). Furthermore, the GAM showed that Chla had a gradually decreasing response to increases in SD (p < 0.001, Table 2 and Figure 5), consistent with the Spearman correlation results (Figure 3). The findings also suggested the presence of a threshold in Chla’s response to WT: when WT was below approximately 12 °C, Chla demonstrated a significant linear increase in response to rising WT. However, beyond this threshold (~12 °C), the promotive effect of WT on Chla diminished. Additionally, Chla responded positively to increases in BOD5 up to a value of 13 (p < 0.001, Table 2 and Figure 5).

3.2. Evaluation of Local Scale

3.2.1. Descriptive Summary

In terms of spatial variations, the highest Chla concentrations in Lake Dianchi were observed at the DQ site (exceeding 1.00 mg/L), followed by the HWZ site (over 0.55 mg/L) and the CHZX site (over 0.50 mg/L), indicating pronounced algal blooms in the northern littoral and the near-shore zones of the lake (Figure 1 and Figure 2c). Conversely, other sites exhibited Chla concentrations within lower ranges (Figure 2c).
Regarding temporal variability, apart from the DQ and CHZX sites, Chla concentrations in the remaining eight sites displayed similar multi-year fluctuation trends (Figure 2c). These trends indicated that Chla concentrations reached their lowest points in 2015 before steadily increasing from 2016 to 2021 (Figure 2c). Notably, the DQ and CHZX sites showed distinct peaks in Chla concentrations in 2014 and 2016, respectively.
The 10-year mean values of WT, fluoride, pH, DO, COD, and CODMn in the Caohai area (corresponding to the DQ and CHZX sites) are lower than those in Waihai, while the 10-year mean values of TN, TP, Cond, BOD5, and SD in the Caohai area are higher than those in Waihai (Figure S2).
Spearman correlation analysis (Figures S3–S12) revealed significant (p < 0.01) positive correlations between Chla and variables such as WT, CODMn, and TP across most sites (Figures S3–S12). Conversely, Chla exhibited negative correlations with SD across all studied sites (Figures S3–S12).

3.2.2. Random Forest Analysis

RF models revealed spatially heterogeneous distributions of primary predictors influencing Chla concentrations on a local scale (Figure 6). Specifically, SD emerged as the primary predictor of Chla at the DQ and CHZX sites, while Year played a key predictive role at the GYSD, GYSZ, and GYSX sites, and Month was significant in the remaining five sites (Figure 6). Organic pollution related indicators (COD, CODMn, BOD5) and inorganic nutrient TP consistently appeared as the primary predictors of Chla in most sites (Figure 6), underscoring its substantial predictive capacity for Chla concentrations. In addition, the fluoride concentrations at the three sampling sites—GYS, ZGYSD, and BYK—are also among the top five predicted factors (Figure 6).

3.2.3. Generalized Additive Model Analysis

GAM analysis revealed spatially heterogeneous responses of algal biomass (Chla) to explanatory variables at the local scale. Across sites such as DCN, HKX, BYK, GYSZ, LJY, HWZ, and CHZX, total phosphorus (TP) emerged as the primary predictor of Chla, indicating a positive relationship between Chla and TP levels, except at the HWZ site. Phosphorus is essential for aquatic organisms and often limits primary lake productivity.
Additionally, GAMs highlighted a consistent relationship between Chla and Secchi depth (SD) at sites including HKX, GYSX, CHZX, and DQ, with lake-wide GAMs showing the negative response of Chla to SD increase.
Furthermore, Chla responded positively to total nitrogen (TN) increases in HKX and BYK, but exhibited a negative response to TN increases at the CHZX site (Figure 7).

4. Discussion

4.1. Spatiotemporal Variation in Algal Biomass in Dianchi Lake

Since the 1980s, Lake Dianchi has been recognized as a large, shallow, eutrophic plateau lake, primarily due to increased nutrient input [24,25,26]. According to the lake nutrient criteria established by the Ministry of Ecology and Environment (MEE) of China in 2020, the maximum concentrations of chlorophyll-a (Chla), total nitrogen (TN), and total phosphorus (TP) that do not endanger the lake’s water body function are 0.0034 mg/L, 0.58 mg/L, and 0.029 mg/L, respectively. However, the mean concentrations of Chla (0.074 mg/L), TN (2.22 mg/L), and TP (0.125 mg/L) in Lake Dianchi significantly exceed these thresholds. Specifically, the mean Chla levels (0.074 mg/L, Table 1) far surpass the “acceptable” hazardous algal bloom level (Chla < 0.02 mg/L) [27]. Thus, it is evident that the concentration of nitrogen and phosphorus nutrients declined in the Dianchi Lake (Figure S1) but are still relatively high, and further measures are still needed to reduce them, especially in Waihai (Figure S2). During the period of the “12th and 13th Five Year Plan”, China undertook extensive measures to improve water quality in Lake Dianchi. To alleviate the eutrophication of Dianchi, Yunnan Province invested in the construction of the Niulanjiang–Dianchi water diversion project to replenish high-quality water resources to the lake [28]. The Niulanjiang–Dianchi water diversion project was initiated in late 2013 for Waihai and extended to Caohai in 2015, and by the end of March 2019 the total water transfer volume of the project had reached 3.041 billion cubic meters, equivalent to the storage capacity of two Dianchi lakes [29]. Efforts such as wastewater treatment, pollution interception, and transboundary water transfer have significantly reduced both external and internal nutrient concentrations [29,30]. However, simply reducing nutrient concentrations alone is insufficient to effectively mitigate eutrophication. Based on the results of this study, future eutrophication control should place greater emphasis on the management of pollutants, especially for organic matter, fluorides, and water temperature. Additionally, eutrophication management in Lake Dianchi is a complex system task that requires the integration of biological and chemical methods for comprehensive management [31].
Spatially, except for the three northern sites (DQ, CHZX, and HWZ), the other sites exhibited relatively lower Chla concentrations (Figure 2c), indicating less frequent and severe algal blooms, consistent with previous studies [32]. The DQ and CHZX sites are located in Caohai (Figure 1). Caohai, with a depth of 1–2 m, due to its proximity to the main urban area of Kunming and due to being separated from Waihai by the Haigeng Dam, has received a significant amount of external nutrient input [33]. This has led to severe eutrophication in the water body and continuous algal blooms for several decades in Caohai [33]. The northern part of the Waihai area (corresponding to the HWZ site), which is also close to the main urban area, experiences eutrophication due to nutrient inputs from rivers [9,33]. Additionally, in the summer and autumn seasons, when the temperatures are high and suitable for algae growth, the southwest monsoon further exacerbates the accumulation of algae [8,33]. Temporally, the Chla variation trends across eight sites in Waihai showed a notable decrease in 2015, followed by a steady increase from 2016 to 2020 (Figure 2c). Peaks at the DQ and CHZX sites in 2014 and 2016, respectively, indicate heavier algal biomass in the Caohai area during those times. The operation of the Niulanjiang–Dianchi water diversion project has reduced the concentration of nitrogen and phosphorus nutrients in the water of Dianchi [33], likely contributing to the reduction in chlorophyll-a concentration before 2016. However, the subsequent rise in Chla concentration since 2018 (Figure 2a) suggests that algae are highly adaptable, and solving this issue may require more than a lake-wide strategy.

4.2. Key Factors That May Influence the Algal Biomass

Since correlation does not imply causation, when selecting key factors, the intersection of the results from the RF and GAM analyses was chosen to identify the major potential influencing factors on Chla concentration. At the lake-wide scale, the results of both RF and GAM showed similar results, indicating significant relationships between TP, SD, BOD5, WT, and Chla concentration. At the local scale, there were differences between the RF and GAM results; however, SD, CODMn, TP, COD, and fluoride were identified by both models as possible important factors influencing Chla concentration. The response pattern of GAMs and RF in this study indicates that spatially heterogeneous eutrophication management is necessary, rather than a uniform lake-wide policy.
Eutrophic lakes frequently exhibit elevated concentrations of TN, TP, and Chla alongside low SD, indicative of significant organic pollution characterized by high CODMn and BOD5 levels in the water [34].
Algal growth requires sufficient light conditions [35], which typically leads to a positive correlation between Chla and SD. However, in this study, SD was found to negatively correlate with Chla and was identified as a crucial explanatory variable in both GAMs and correlation analyses (Figure 3, Figure 4, Figure 5, Figure 6, Figure 7 and Figures S3–S12). The proliferation of algal cells can directly increase water turbidity and decrease transparency [36]. Despite light availability being a primary factor for algal growth [5], high plankton densities (108 cells/L) [7] significantly reduce the water transparency in Lake Dianchi [24,37], thereby establishing the aforementioned relationship.
Published data suggest that fluoride can either inhibit or promote algae population growth, depending on its concentration, exposure duration, and algal species [38]. At the lake-wide scale, the Spearman’s correlation results indicated that relatively low fluoride levels (mean = 0.61 mg/L, Table 1) were associated with enhanced algae growth (Figure 3). RF models for specific local sites (GYSD, GYSZ, and BYK) also identified fluoride as a significant contributor to algal biomass. Previous studies have reported substantial fluoride emissions during phosphate fertilizer production near Lake Dianchi, with fluoride entering the water column via rainfall and eventually settling into sediments [26]. Additionally, local-scale GAM analyses (HWZ and GYSX, Figure 7) revealed an inverse relationship between Chla concentration and fluoride levels, suggesting spatial variability in the fluoride–algal relationship. This highlights the need for further investigation into the complex role of fluoride in algae dynamics. Given these observations, fluoride could be considered in the management of eutrophication in Lake Dianchi, although additional research is needed to clarify its precise effects under different environmental conditions.
Water temperature (WT) profoundly influences aquatic ecosystems and serves as a key driver of algal blooms [1,10]. Compared to earlier studies, the average water temperature in Lake Dianchi has risen from 17.5 °C [36] to 18.1 °C (Table 1). Additionally, an increasing trend in water temperature in Lake Dianchi was documented by a previous study [10]. Given global warming trends [39], escalating water temperatures in Lake Dianchi warrant heightened attention. Previous research has indicated that rising water temperatures significantly contribute to algal bloom development in Dianchi Lake [10,40]. WT exhibited a highly significant (p < 0.001) correlation with Chla (Figure 3 and Figures S3–S12). GAMs demonstrated a nonlinear relationship between Chla and WT, while RF underscored WT’s importance. Consequently, authorities should closely monitor water temperatures in the Lake Dianchi watershed, especially amidst current global warming trends.
Significant positive correlations (p < 0.001) between CODMn, BOD5, TN, TP, and Chla were observed (Figure 3), which indicated that the nutrient loading (nitrogen and phosphorus) and organic pollution played important roles in algal proliferation. Across most sites, Chla also exhibited notable positive correlations (p < 0.01) with WT, CODMn, and TP (Figures S3–S12), suggesting algae’s dependency on essential nutrients for growth and reproduction [40]. Moreover, Chla responded positively to increasing BOD5 levels up to 13 (p < 0.001, Table 2 and Figure 5), highlighting the contribution of organic nutrients to algal growth. The influence of BOD5 warrants further investigation.
The nonlinear relationship between Chla and TP (Figure 5) illustrates fluctuating Chla concentrations over time and threshold effects [41]. Prior research [24] suggests that reducing lake TP levels to economically feasible minima represents a cost-effective restoration strategy. However, caution is advised based on the nonlinear Chla-TP relationship (Figure 5).
Global studies on Chla-TP dynamics in lakes generally indicate that Chla concentrations rise with increasing TP levels [41,42]. Despite a declining trend in TP levels in Lake Dianchi form 2011 to 2020 [29], Chla concentrations have remained persistently high (Figure 2a), indicating an ongoing surplus of phosphorus available for algal growth in the lake’s current state.
The accumulation of organic pollutants in the environment poses significant challenges, impacting aquatic ecosystem stability and posing a threat to human health and the environment [43]. While organic pollution indicators may not be the most dominant factors, all models in this study indicate their significant influence on algal biomass. Hence, understanding the impact of organic pollution on algal biomass is crucial. In Lake Dianchi, agricultural runoff, leaf litter, and urban runoff are primary sources of dissolved organic carbon, while sewage effluent contributes substantially organic materials [44]. In terms of external factors, changes in land use within the watershed [45] and increased sewage input are principal factors driving elevated COD levels in Dianchi Lake [44]. With regard to internal influences, cyanobacterial organic matter accumulation in sediments serves as a significant source of organic matter [12].
Historically, strategies to control algal blooms have primarily targeted nitrogen and phosphorus. However, as outlined in Kunming’s “14th Five-Year Plan” for water ecological environment protection, COD has emerged as a pivotal factor affecting Dianchi Lake water quality. Addressing excessive algae growth and improving water quality necessitates a thorough examination of organic pollutant dynamics and their impact on algal biomass. Furthermore, sediments in Lake Dianchi are characterized by a high concentration of organic matter, which is predominantly derived from aquatic plants and plankton and is dominated by native organic matter [46]. The positive feedback effect of cyanobacterial organic matter accumulation in sediments on lake eutrophication has been demonstrated in Lake Dianchi [12]. The decomposition of such abundant organic matter in the sediments will have a long-term impact on the physico-chemical properties of the lake, which may provide a continuous supply of nutrients for algal growth. Thus, from the perspective of algal bloom management, proactive measures are essential for developing effective strategies to reduce both internal and external organic pollutants.
Besides water quality, the biomass of algae is influenced by various environmental, such as climate change [1,10], internal pollution [8,12], and water exchange rates [8]. However, this paper focuses solely on the impact of water quality changes on algal biomass, which does present certain limitations. Nonetheless, changes in other factors may lead to alterations in water quality parameters, and since algae grow directly in the water, their biomass accumulation is directly impacted by water quality. Through the analysis of water quality data, the paper still provides meaningful insights into its effect on algal biomass.

5. Conclusions

At the lake-wide scale, the annual mean concentrations of fluoride, Cond, NH3N, BOD5, COD, CODMn, TN, and TP exhibit a gradual decreasing trend, while the DO concentration shows a slight increase. On a local scale, in the Caohai area, the concentrations of DO, fluoride, COD, and CODMn are relatively lower compared to Waihai, while TN, TP, Cond, and BOD5 are relatively higher. Therefore, when developing pollutant control strategies, adjustments should be made to account for the regional differences within the lake.
This study identified key environmental factors influencing algal biomass in Lake Dianchi by employing a combination of correlation analysis, generalized additive models (GAMs), and random forest (RF) models. The current findings suggest that algal biomass is more substantial in the northern zones compared to other areas of the lake. Spearman’s correlation analysis revealed a positive association between Chla and TP. In the lake-wide RF models, TP, SD, WT, and BOD5 emerged as strong predictors of algal biomass. At a local scale, organic pollution-related indicators (COD, CODMn, and BOD5) and TP consistently emerged as the primary predictors of Chla at most sites. Furthermore, the GAM results indicated that the response of algal biomass to these predictors varies spatially and follows nonlinear trends.
Although significant associations were found between various environmental factors and algal biomass, it is important to note that correlation does not imply causation. The results demonstrate patterns of association, but further experimental or longitudinal studies are required to establish causal relationships definitively. This study provides a relatively robust methodology for analyzing the relationship between algal biomass and its influencing factors, offering valuable insights for future research and for informing governmental decision-making in the management and protection of Lake Dianchi and similar large, shallow, eutrophic lakes.

Supplementary Materials

The following supporting information can be downloaded at: https://www.mdpi.com/article/10.3390/w16233485/s1, Figure S1: Barplot of interannual variation of all variables; Figure S2: Barplot of mean water quality parameters at each sampling point; Figure S3: Results of Spearman’s rank correlation analysis for CHZX site; Figure S4: Results of Spearman’s rank correlation analysis for DQ site; Figure S5: Results of Spearman’s rank correlation analysis for HWZ site; Figure S6: Results of Spearman’s rank correlation analysis for LJY site; Figure S7: Results of Spearman’s rank correlation analysis for GYSD site; Figure S8: Results of Spearman’s rank correlation analysis for GYSZ site; Figure S9: Results of Spearman’s rank correlation analysis for GYSX site; Figure S10: Results of Spearman’s rank correlation analysis for HKX site; Figure S11: Results of Spearman’s rank correlation analysis for DCN site; Figure S12: Results of Spearman’s rank correlation analysis for BYK site.

Author Contributions

J.H.: conceptualization, methodology, software, writing—original draft; J.Z.: writing—review and editing; N.W.: writing—review and editing; Y.D.: writing—review and editing, supervision; S.H.: writing—review and editing, supervision. All authors have read and agreed to the published version of the manuscript.

Funding

This work was supported by grants from the Joint Study on Ecological Environment Protection and Restoration of the Yangtze River (Phase II) (Grant No. 2022-LHYJ-02-0509-04) and the National Key Research and Development Program of China (Grant No. 2021YFC3201002).

Data Availability Statement

Data will be made available on request.

Conflicts of Interest

The authors declare no conflicts of interest.

References

  1. Brookes, J.D.; Carey, C.C. Ecology: Resilience to Blooms. Science 2011, 334, 46–47. [Google Scholar] [CrossRef] [PubMed]
  2. Mallin, M.A.; Johnson, V.L.; Ensign, S.H.; MacPherson, T.A. Factors Contributing to Hypoxia in Rivers, Lakes, and Streams. Limnol. Oceanogr. 2006, 51, 690–701. [Google Scholar] [CrossRef]
  3. Glibert, P.M. Eutrophication, Harmful Algae and Biodiversity—Challenging Paradigms in a World of Complex Nutrient Changes. Mar. Pollut. Bull. 2017, 124, 591–606. [Google Scholar] [CrossRef] [PubMed]
  4. Dodds, W.K.; Bouska, W.W.; Eitzmann, J.L.; Pilger, T.J.; Pitts, K.L.; Riley, A.J.; Schloesser, J.T.; Thornbrugh, D.J. Eutrophication of U. S. Freshwaters: Analysis of Potential Economic Damages. Environ. Sci. Technol. 2009, 43, 12–19. [Google Scholar] [CrossRef]
  5. Zhang, J.; Zhi, M.; Zhang, Y. Combined Generalized Additive Model and Random Forest to Evaluate the Influence of Environmental Factors on Phytoplankton Biomass in a Large Eutrophic Lake. Ecol. Indic. 2021, 130, 108082. [Google Scholar] [CrossRef]
  6. Missaghi, S.; Hondzo, M.; Melching, C. Three-Dimensional Lake Water Quality Modeling: Sensitivity and Uncertainty Analyses. J. Environ. Qual. 2013, 42, 1684–1698. [Google Scholar] [CrossRef]
  7. Wang, Y.; Wang, W.; Wang, Z.; Li, G.; Liu, Y. Regime Shift in Lake Dianchi (China) during the Last 50 Years. J. Oceanol. Limnol. 2018, 36, 1075–1090. [Google Scholar] [CrossRef]
  8. Zhang, T.; Zeng, W.H.; Wang, S.R.; Ni, Z.K. Temporal and Spatial Changes of Water Quality and Management Strategies of Dianchi Lake in Southwest China. Hydrol. Earth Syst. Sci. 2014, 18, 1493–1502. [Google Scholar] [CrossRef]
  9. Fu, D.; Xu, Z.; Wu, X.; Zhao, L.; Zhu, A.; Duan, C.; Chadwick, D.R.; Jones, D.L. Land Use Effects on Soil Phosphorus Behavior Characteristics in the Eutrophic Aquatic-Terrestrial Ecotone of Dianchi Lake, China. Soil Tillage Res. 2021, 205, 104793. [Google Scholar] [CrossRef]
  10. Yang, K.; Yu, Z.; Luo, Y.; Yang, Y.; Zhao, L.; Zhou, X. Spatial and Temporal Variations in the Relationship between Lake Water Surface Temperatures and Water Quality—A Case Study of Dianchi Lake. Sci. Total Environ. 2018, 624, 859–871. [Google Scholar] [CrossRef]
  11. Zhang, S.; Wang, W.; Zhang, K.; Xu, P.; Lu, Y. Phosphorus Release from Cyanobacterial Blooms during Their Decline Period in Eutrophic Dianchi Lake, China. Environ. Sci. Pollut. Res. 2018, 25, 13579–13588. [Google Scholar] [CrossRef] [PubMed]
  12. Wang, J.; Chen, Q.; Huang, S.; Wang, Z.; Li, D. Cyanobacterial Organic Matter (COM) Positive Feedback Aggravates Lake Eutrophication by Changing the Phosphorus Release Characteristics of Sediments. Sci. Total Environ. 2023, 892, 164540. [Google Scholar] [CrossRef] [PubMed]
  13. Ministry of Ecology and Environment. The Planning for Water Pollution Prevention and Control in Key River Basins (2011–2015); Ministry of Ecology and Environment: Beijing, China, 2012; p. 478. [Google Scholar]
  14. Zuur, A.; Ieno, E.N.; Walker, N.; Saveliev, A.A.; Smith, G.M. Mixed Effects Models and Extensions in Ecology with R; Springer Science & Business Media: New York, NY, USA, 2009; ISBN 0387874585. [Google Scholar]
  15. Li, X. Using “Random Forest”for Classification and Regression. Chinese J. Appl. Entomol. 2013, 50, 1190–1197. [Google Scholar]
  16. Yu, X. Preliminary Study on the Historical Geography of Dianchi Lake. Yunan Geogr. Environ. Res. 1999, 11, 7–15. [Google Scholar]
  17. Peterson, B.G.; Carl, P.; Boudt, K.; Bennett, R.; Ulrich, J.; Zivot, E.; Cornilly, D.; Hung, E.; Lestel, M.; Balkissoon, K. Package ‘Performanceanalytics’. R Team Coop. 2018, 3, 13–14. [Google Scholar]
  18. Biau, G.; Scornet, E. A Random Forest Guided Tour. Test 2016, 25, 197–227. [Google Scholar] [CrossRef]
  19. Zeng, Q.; Liu, Y.; Zhao, H.; Sun, M.; Li, X. Comparison of Models for Predicting the Changes in Phytoplankton Community Composition in the Receiving Water System of an Inter-Basin Water Transfer Project. Environ. Pollut. 2017, 223, 676–684. [Google Scholar] [CrossRef]
  20. Liaw, A.; Wiener, M. Classification and Regression by RandomForest. R J. 2002, 2, 18–22. [Google Scholar]
  21. Wood, S.N. Generalized Additive Models: An Introduction with R; CRC Press: New York, NY, USA, 2017; ISBN 1498728340. [Google Scholar]
  22. Zuur, A.F.; Ieno, E.N.; Elphick, C.S. A Protocol for Data Exploration to Avoid Common Statistical Problems. Methods Ecol. Evol. 2010, 1, 3–14. [Google Scholar] [CrossRef]
  23. Chen, J.; Chen, Z. Extended Bayesian Information Criteria for Model Selection with Large Model Spaces. Biometrika 2008, 95, 759–771. [Google Scholar] [CrossRef]
  24. Liu, X. The Identification of Nutrient Limitations on Eutrophication in Dianchi Lake, China. Water Environ. J. 2017, 31, 592–597. [Google Scholar] [CrossRef]
  25. Luo, M.; Duan, C.; Shen, X.; Yang, L. Environmental Degradation and Loss of Species Diversity in Dianchi Lake. Mar. Fish. 2006, 28, 71–78. [Google Scholar]
  26. Li, H.; Wang, Y.; Shi, L.Q.; Mi, J.; Pan, X.J. Distribution and Fractions of Phosphorus and Nitrogen in Surface Sediments from Dianchi Lake, China. Int. J. Environ. Res. 2012, 6, 195–208. [Google Scholar]
  27. Xu, H.; Paerl, H.W.; Qin, B.; Zhu, G.; Hall, N.S.; Wu, Y. Determining Critical Nutrient Thresholds Needed to Control Harmful Cyanobacterial Blooms in Eutrophic Lake Taihu, China. Environ. Sci. Technol. 2015, 49, 1051–1059. [Google Scholar] [CrossRef]
  28. He, J.; Wu, X.; Zhang, Y.; Zheng, B.; Meng, D.; Zhou, H.; Lu, L.; Deng, W.; Shao, Z.; Qin, Y. Management of Water Quality Targets Based on River-Lake Water Quality Response Relationships for Lake Basins—A Case Study of Dianchi Lake. Environ. Res. 2020, 186, 109479. [Google Scholar] [CrossRef]
  29. Huang, J.; Wang, Y.; Deng, X.; Shi, Z.; Yang, C. Characteristics of Spatial and Temporal Variation of Water Quality and Nutritional Status in Dianchi Lake. Yangtze River 2022, 53, 61–67. [Google Scholar]
  30. Liu, Y.; Jiang, Q.; Sun, Y.; Jian, Y.; Zhou, F. Decline in Nitrogen Concentrations of Eutrophic Lake Dianchi Associated with Policy Interventions during 2002–2018. Environ. Pollut. 2021, 288, 117826. [Google Scholar] [CrossRef]
  31. Lakshmikandan, M.; Li, M.; Pan, B. Cyanobacterial Blooms in Environmental Water: Causes and Solutions. Curr. Pollut. Reports 2024, 10, 606–627. [Google Scholar] [CrossRef]
  32. Wan, N.; Song, L.; Wang, R.; Liu, J. The Spatio-Temperal Distribution of Algal Biomass in Dianchi Lake and Its Impact Factors. Acta Hydrobiol. Sin. 2008, 32, 188. [Google Scholar]
  33. Wang, J.H.; Li, C.; Xu, Y.P.; Li, S.Y.; Du, J.S.; Han, Y.P.; Hu, H.Y. Identifying Major Contributors to Algal Blooms in Lake Dianchi by Analyzing River-Lake Water Quality Correlations in the Watershed. J. Clean. Prod. 2021, 315, 128144. [Google Scholar] [CrossRef]
  34. Jin, X. Analysis of Eutrophication State and Trend for Lakes in China. J. Limnol. 2003, 62, 60–66. [Google Scholar]
  35. Havens, K.E.; Jin, K.R.; Iricanin, N.; James, R.T. Phosphorus Dynamics at Multiple Time Scales in the Pelagic Zone of a Large Shallow Lake in Florida, USA. Hydrobiologia 2007, 581, 25–42. [Google Scholar] [CrossRef]
  36. Hou, G.; Song, L.; Liu, J.; Xiao, B.; Liu, Y. Modeling of Cyanobacterial Blooms in Hypereutrophic Lake Dianchi, China. J. Freshw. Ecol. 2004, 19, 623–629. [Google Scholar] [CrossRef]
  37. Jing, Y.; Zhang, Y.; Hu, M.; Chu, Q.; Ma, R. MODIS-Satellite-Based Analysis of Long-Term Temporal-Spatial Dynamics and Drivers of Algal. Remote Sens. 2019, 11, 2582. [Google Scholar] [CrossRef]
  38. Camargo, J.A. Fluoride Toxicity to Aquatic Organisms: A Review. Chemosphere 2003, 50, 251–264. [Google Scholar] [CrossRef]
  39. Nieves, V.; Willis, J.K.; Patzert, W.C. Recent Hiatus Caused by Decadal Shift in Indo-Pacific Heating. Science 2015, 349, 532–535. [Google Scholar] [CrossRef]
  40. Goldman, J.C. Physiological Processes, Nutrient Availability, and the Concept of Relative Growth Rate in Marine Phytoplankton Ecology. In Primary Productivity in the Sea; Springer: Boston, MA, USA, 1980; pp. 179–194. [Google Scholar] [CrossRef]
  41. Chen, Q.; Wang, S.; Ni, Z.; Guo, Y.; Liu, X.; Wang, G.; Li, H. No-Linear Dynamics of Lake Ecosystem in Responding to Changes of Nutrient Regimes and Climate Factors: Case Study on Dianchi and Erhai Lakes, China. Sci. Total Environ. 2021, 781, 146761. [Google Scholar] [CrossRef]
  42. Reeder, B.C. Primary Productivity Limitations in Relatively Low Alkalinity, High Phosphorus, Oligotrophic Kentucky Reservoirs. Ecol. Eng. 2017, 108, 477–481. [Google Scholar] [CrossRef]
  43. Ben Chekroun, K.; Sánchez, E.; Baghour, M. The Role of Algae in Bioremediation of Organic Pollutants. Int. Res. J. Public Environ. Health 2014, 1, 19–32. [Google Scholar]
  44. Guo, W.; Yang, F.; Li, Y.; Wang, S. New Insights into the Source of Decadal Increase in Chemical Oxygen Demand Associated with Dissolved Organic Carbon in Dianchi Lake. Sci. Total Environ. 2017, 603–604, 699–708. [Google Scholar] [CrossRef]
  45. Huang, C.; Wang, X.; Yang, H.; Li, Y.; Wang, Y.; Chen, X.; Xu, L. Satellite Data Regarding the Eutrophication Response to Human Activities in the Plateau Lake Dianchi in China from 1974 to 2009. Sci. Total Environ. 2014, 485–486, 1–11. [Google Scholar] [CrossRef]
  46. He, J.; Zhang, Y.; Wu, X.; Yang, Y.; Xu, X.; Zheng, B.; Deng, W.; Shao, Z.; Lu, L.; Wang, L.; et al. A Study on the Relationship between Metabolism of Cyanobacteria and Chemical Oxygen Demand in Dianchi Lake, China. Water Environ. Res. 2019, 91, 1650–1660. [Google Scholar] [CrossRef]
Figure 1. Land cover and sampling sites in Lake Dianchi.
Water 16 03485 g001
Figure 2. (a) Violin plot of multi-year Chla concentrations at all sites. (b) Violin plot of multi-month Chla concentrations at all sites. The white point represents the mean value. (c) The multi-year Chla variations of each site. Solid lines of different colors represent different variation trends of Chla at each site, points represent the monitored Chla concentration values.
Water 16 03485 g002
Figure 3. Results of Spearman’s rank correlation analysis for all sites. Signif. codes: ‘***’ 0.001, ‘**’ 0.01, ‘*’ 0.05.
Water 16 03485 g003
Figure 4. (a) Predictor importance ranking for the RF model. The importance of each predictor is measured by the increment in the mean squared error (MSE) (left) and node purity (right) of each predictor. (b) Prediction of chlorophyll concentration by the RF model.
Water 16 03485 g004
Figure 5. Results of lake-wide GAM. Solid lines represent smoothed response relationships from GAMs, and shaded areas are 95% confidence intervals. Gray points represent residuals.
Water 16 03485 g005
Figure 6. Predictor importance ranking for RF models at each site. Only TOP 5 predictors in RF models are displayed.
Water 16 03485 g006
Figure 7. Results of GAMs for each site. Solid lines represent smoothed response relationships from GAMs, and shaded areas are 95% confidence intervals. Gray points represent residuals.
Water 16 03485 g007
Table 1. Descriptive summary of all indicators in Lake Dianchi.
VariablesMinMedianMeanMaxsd
Chla (mg/L)0.0020.0610.0741.0120.061
WT (℃)5.118.518.125.74.4
pH6.048.788.719.980.45
Cond (ms/m)27.3046.7047.9678.39.24
SD (cm)14.045.047.9230.017.5
DO (mg/L)1.267.647.5614.601.27
CODMn (mg/L)0.607.007.7318.503.23
BOD5 (mg/L)0.203.453.9935.003.15
NH3N (mg/L)0.0150.240.398.990.67
TN (mg/L)0.201.822.2213.401.54
TP (mg/L)0.0150.1130.1250.7180.073
COD (mg/L)2.0042.0047.83125.0022.37
Fluoride (mg/L)0.120.610.590.990.16
Table 2. Summary of GAM results.
Explained VariablesExplanatory Variables
(X)edfDeviance ExplainedR2 (adj)
L_ChlaTL_TP7.24 ***51.60%0.49
L_SD5.61 ***
WT5.52 ***
BOD56.70 ***
ChlaDCNTP1.55 ***50.10%0.39
ChlaHKXCond1.00 *70.60%0.58
L_SD1.00 *
L_DO2.86 **
L_NH3N8.08 ***
TN1.00 **
L_TP2.77 **
ChlaBYKL_TN3.08 .53.70%0.42
TP1.00 **
ChlaGYSXCond1.00 **78.60%0.72
SD1.00 *
L_NH3N3.65 ***
L_Fluoride2.23 **
L_ChlaGYSZL_TP5.64 *69.40%0.61
L_ChlaGYSDL_BOD57.54 *71.60%0.63
L_ChlaLJYL_TP2.38 ***58.10%0.48
L_ChlaHWZL_TP2.65 ***65.20%0.54
Fluoride5.47 **
L_ChlaCHZXL_WT3.52 *72.50%0.61
L_SD2.10 **
L_TN2.16 .
L_TP1.00 *
L_COD6.04 .
L_ChlaDQL_WT4.02 ***73.10%0.64
L_pH1.07 *
L_SD2.10 ***
L_CODMn1.00 *
L_BOD52.15 **
Note: ‘T’ indicates total sites. ‘ChlaDCN’ means Chla at DCN site. ‘L_’ indicates logarithm transformation. Signif. codes: ‘***’ 0.001, ‘**’ 0.01, ‘*’ 0.05, ‘.’ 0.1.
Disclaimer/Publisher’s Note: The statements, opinions and data contained in all publications are solely those of the individual author(s) and contributor(s) and not of MDPI and/or the editor(s). MDPI and/or the editor(s) disclaim responsibility for any injury to people or property resulting from any ideas, methods, instructions or products referred to in the content.

