Article

Analysis of Fluid–Structure Coupling of Sudden Water Deformation in Tunnels Under Construction

1
College of Geosciences and Engineering, North China University of Water Resources and Electric Power, Zhengzhou 450046, China
2
China Construction Fifth Engineering Bureau, Zhengzhou 450047, China
*
Author to whom correspondence should be addressed.
Water 2024, 16(23), 3479; https://doi.org/10.3390/w16233479
Submission received: 19 October 2024 / Revised: 15 November 2024 / Accepted: 19 November 2024 / Published: 3 December 2024
(This article belongs to the Section Hydraulics and Hydrodynamics)

Abstract

:
Analyzing the mechanisms of soil instability in tunnels due to sudden water ingress is essential for construction safety. This kind of problem belongs to the category of seepage deformation, mostly due to the near tunnel range of water pipeline blowing cracks and heavy rainfall flooding rainwater into the tunnel. Distinguished from general infiltration behavior, the relevant problems have the characteristics of rapid occurrence and short action time. This study develops a 3D fluid–solid coupling model for soil deformation in tunnels with water ingress, grounded in Biot’s theory and Darcy’s law while considering water level variations within the tunnel. The governing equations are discretized in space and time, and the model’s accuracy is validated through comparison with actual measurements from a Zhengzhou subway project. The study analyzes pore pressure, stress-deformation responses, and surface settlement patterns in surrounding soil and rock mass under soil–water coupling. The findings show that (1) the tunnel cavern, as a seepage source, has minimal impact on the lateral settlement trough width, while seepage mainly affects the vertical deformation of surrounding rock; (2) pressure dissipation exhibits hysteresis in clay strata; (3) water ingress increases soil saturation and decreases effective stress, resulting in persistent surface settlement until drainage. There is a minimal discrepancy between model-calculated and measured settlements.

1. Introduction

During subway shield tunneling, frequent occurrences of soil settlement and deformation pose a significant hidden danger caused by factors like soil immersion in tunnels, rainfall infiltration, and ruptures in underground piping networks [1]. The stability of saturated soil subjected to water immersion has always been a challenging problem [2], affecting both tunnel safety and stability and causing adverse effects on the surrounding environment due to excessive surface settlement.
Table 1 presents several examples of water-related accidents in subway tunnels. Therefore, research into the sudden instability of submerged ground in tunnels holds significant theoretical and practical importance.
Many researchers have extensively investigated tunnel soil stability under soil–water interaction [3,4]. Wang [5] used an autonomous test system to study the failure of the surrounding rock under different rainfall intensities and durations. Tao [6] analyzed the deformation and stress characteristics of lining structures when the stratum top is immersed in water based on field monitoring and investigation. They also compared the types of surface settlement caused by unilateral and uniform water immersion on the shield side. Liu [7] developed a Random Forest model for predicting seepage risk using sample data and validated its accuracy through a subway case study. The biggest feature of physical system rainfall experiments is the ability to manually control rainfall conditions and develop specific working conditions to conduct research on rainfall infiltration. Multiple types of working conditions and various factors can be set for analysis. Qin [8] considering the influence of water content on the strength and deformation of expansive soil, studied the impact of rainfall on the soil pressure in shield tunnels within expansive soil layers and proposed recommended values for soil pressure in shield tunnels caused by rains. Bezuijen analyzed groundwater flow during tunnel excavation in semi-confined and unconfined aquifers, considering the influence of groundwater flow and mud foam penetration on tunnel surfaces [9]. Studying soil behavior under different rainfall conditions based on physical properties such as soil moisture content and permeability provides a scientific basis for tunnel design and predicts risks during the construction phase.
Advancements in computer technology have greatly improved numerical simulations’ computational power, allowing for detailed modeling of fluid–solid coupling in tunnels under complex geological conditions [10]. The fluid–structure coupling mechanism is a complex interaction between fluid permeability, soil deformation, and structural response. Changes in fluid pressure can cause soil deformation, which in turn affects the flow path of the fluid. In tunnel engineering, fluid–structure coupling numerical simulation integrates the basic principles of fluid dynamics, soil mechanics, structural mechanics, and other disciplines. Parameters are assigned to the model materials, and general numerical calculation methods such as finite element method (FEM) and finite difference method (FDM) are used to analyze the deformation of soil and changes in fluid pressure under coupling effects.
Xie [11] constructed a fluid–solid coupling model to analyze the impact of tunnel construction disturbances and rainwater infiltration on slope stability, concluding that rainwater infiltration significantly affects embankment slope stability, reducing safety factors. Guo [12] analyzed the deformation of the surrounding rock and the stress characteristics of support structures during rainwater infiltration based on actual tunnel engineering projects. Zhang et al. [13] proposed a time-varying complex variable method for tunnel excavation, considering the rainfall infiltration mechanism, to predict surrounding soil deformation and stress during heavy rainfall. This method successfully predicted surface settlement, soil settlement, and horizontal displacement. Therefore, the safety control of tunnel construction under heavy rainfall should not be neglected. Yang et al. [14] analyzed tunnel collapse mechanisms based on layered saturated soil seepage, focusing on the impact of seepage on tunnel deformation and stability. They proposed countermeasures, such as surcharge back-pressure and reinforcement, to address these collapses. It can be seen that extreme weather or other causes of water seepage, soil–water interaction caused by surface settlement, soil deformation, displacement, and other disasters are particularly important. It is of great significance to the risk prevention of tunnel construction. Scholars have conducted various explorations on the stability of soil–water interaction in shield tunnels using methods such as model tests and numerical simulations, enhancing the understanding of related engineering issues.
Existing studies have focused on the effects of more common earth–water interactions, such as rainfall infiltration and groundwater flow, on tunnel soil stability. However, the complexity of urban infrastructure, the increase in extreme weather events, especially heavy rainstorms, changes in groundwater sources, and the bursting of aqueducts have greatly increased the risk of triggering sudden water encounters in tunnels. Characterized by rapid occurrence, short duration of action, and severe damage, they are extraordinary conditions. Sudden earth–water interactions and seepage sources accumulate inside tunnels are hardly studied, and the empirical applicability of related methods is low. Therefore, it is of great practical significance and engineering value to study the influence of extreme weather and sudden water sources on the stability of soil bodies in tunnel construction.
This study introduces the condition of short-term water level fluctuations within tunnels to analyze changes in soil stress–strain, pore pressure, and other parameters, with the aim of providing insights into the control of sudden water encounters in tunnels. The main research contents of this paper include the following: (1) Based on Biot’s theory and Darcy’s law, considering water level changes within the tunnel, a fluid–solid coupling mathematical model is established using MIDAS GTS NX finite element software. (2) The accuracy of the model is verified by comparing measured soil settlement with the calculated values. (3) The process of pore water pressure changes and the deformation patterns of surrounding rock under the action of the seepage field in tunnel soil are analyzed.

2. Research Methods

2.1. Biot’s Theory

The theory of fluid–solid coupling in porous media derives from Biot’s consolidation theory for saturated soils, which describes the interaction between pore fluid and solid skeleton when saturated soil or porous media are subjected to external forces. Assuming relative motion between pore fluid and solid skeleton and elastic deformation of the soil, Equations (1) and (2) below represent the consolidation differential equation and the continuity equation, respectively [15].
G 2 ω x G 1 2 v x ω x x + ω y y + ω z z + u x = 0 ,
G 2 ω y G 1 2 v y ω x x + ω y y + ω z z + u y = 0 ,
G 2 ω z G 1 2 v z ( ω x x + ω y y + ω z z ) + u z = γ .
t ω x x + ω y y + ω z z + K γ ω 2 = 0
where G is the shear modulus, 2 is the Laplacian operator, ω x , ω y , and ω z are the displacements in three directions, v is Poisson’s ratio, u is the water pressure, γ is the specific weight of soil, K is the permeability coefficient of soil, and γ ω is the particular weight of water.
To account for the nonlinear behavior of fluid flow and solid deformation, the consolidation equation and continuity equation from the above equation are discretized in the form of increments over a time step Δ t :
A - A A T Δ tA + B Δ δ Δ u = S S t Δ t   Δ Q
where A - is the solid stiffness matrix, S represents the equivalent joint load, A′ is the strain–seepage coupling matrix, S t is the equilibrium load arranged over time, Δ δ is the displacement increment at the nodes, A is the seepage matrix, B is the free-area integral matrix, Δ Q is the flow increment matrix, and Δ u is the increment in pore water pressure at the nodes.

2.2. Darcy Percolation Theory

Darcy’s seepage law was proposed by the French engineer Henry Darcy in 1856. This law represents an empirical principle that governs fluid flow through porous media, such as soil, rock, sand, and other substances, and is used to predict fluid flow conditions within these media. Fluid flow is primarily controlled by the pore structure of the porous medium. The relationship between the flow rate (q) and soil permeability is expressed as
q = k × i × A ,
where i = h / L , i represents hydraulic gradient. A denotes the cross-sectional area of the seepage flow. Darcy’s law, expressed in terms of seepage velocity, is
v = q A = k h L = k × i ,
it clarifies the relationship between seepage velocity ( v ) and hydraulic gradient ( i ). In Equations (3) and (4), h stands for the difference in water level (or head loss) across the seepage flow.
L signifies the length of the seepage flow path. These equations allow for the derivation of the soil permeability coefficient.
k = V × L A × Δ h × t ,
where k represents the soil permeability coefficient, and V denotes the volume of water that permeates through the specimen within a time interval t . Δ h represents the water level difference, A denotes the cross-sectional area of the seepage flow, and L signifies the length of the seepage flow path.

2.3. Boundary and Initial Conditions

Setting boundaries and initial conditions for numerical models is crucial for ensuring the accuracy and reliability of simulations and is a necessary step in solving the model. Specifically, the initial displacement, stress, and water level conditions are defined as follows [16].
S ( x , y , z , t ) | t = 0 = 0 ,
σ cz = γ s z ;   σ cx = σ cy = K 0 γ s z ,
H ( x , y , z , t ) | t = 0 = H 0 ( x , y , z ) ,
where S is the displacement; K 0 is the lateral pressure coefficient; σ cx , σ cy , and σ cz indicate the stresses in the x, y, and z directions, respectively;   γ s represents the bulk density of soil; z is the depth of calculation; and H 0 is the initial water level condition.
In fluid–solid coupling analysis, the solid structure produces displacement and deformation behavior under the action of fluid, and the displacement boundary is divided into free boundary and fixed boundary. Under specific working conditions, the model boundary can be deformed freely and can be set as free boundary when it is not limited by external force. Fixed boundaries, on the other hand, cannot be displaced and are usually used to simplify the model. At the interface where water and soil are in contact, the soil displacement affects the fluid flow, and the fluid pressure also acts on the soil. In fluid–solid coupling, the displacement of the solid boundary is usually affected by fluid pressure and shear. The seepage boundary is then determined according to the permeability characteristics of the modeled solid boundary and is generally set to permeable and impermeable boundaries.
The fluid–solid interaction (FSI) model requires separate boundary conditions for both the fluid and soil components. Displacement constraints are applied to the model boundaries, with the top boundary designated as a free boundary due to practical engineering considerations. The left, right, and lower boundaries are subject to normal fixed constraints. In this tunnel model, water accumulates directly within the tunnel, making the surrounding rock permeable, while the bottom of the model is impermeable.

2.4. Model Establishment
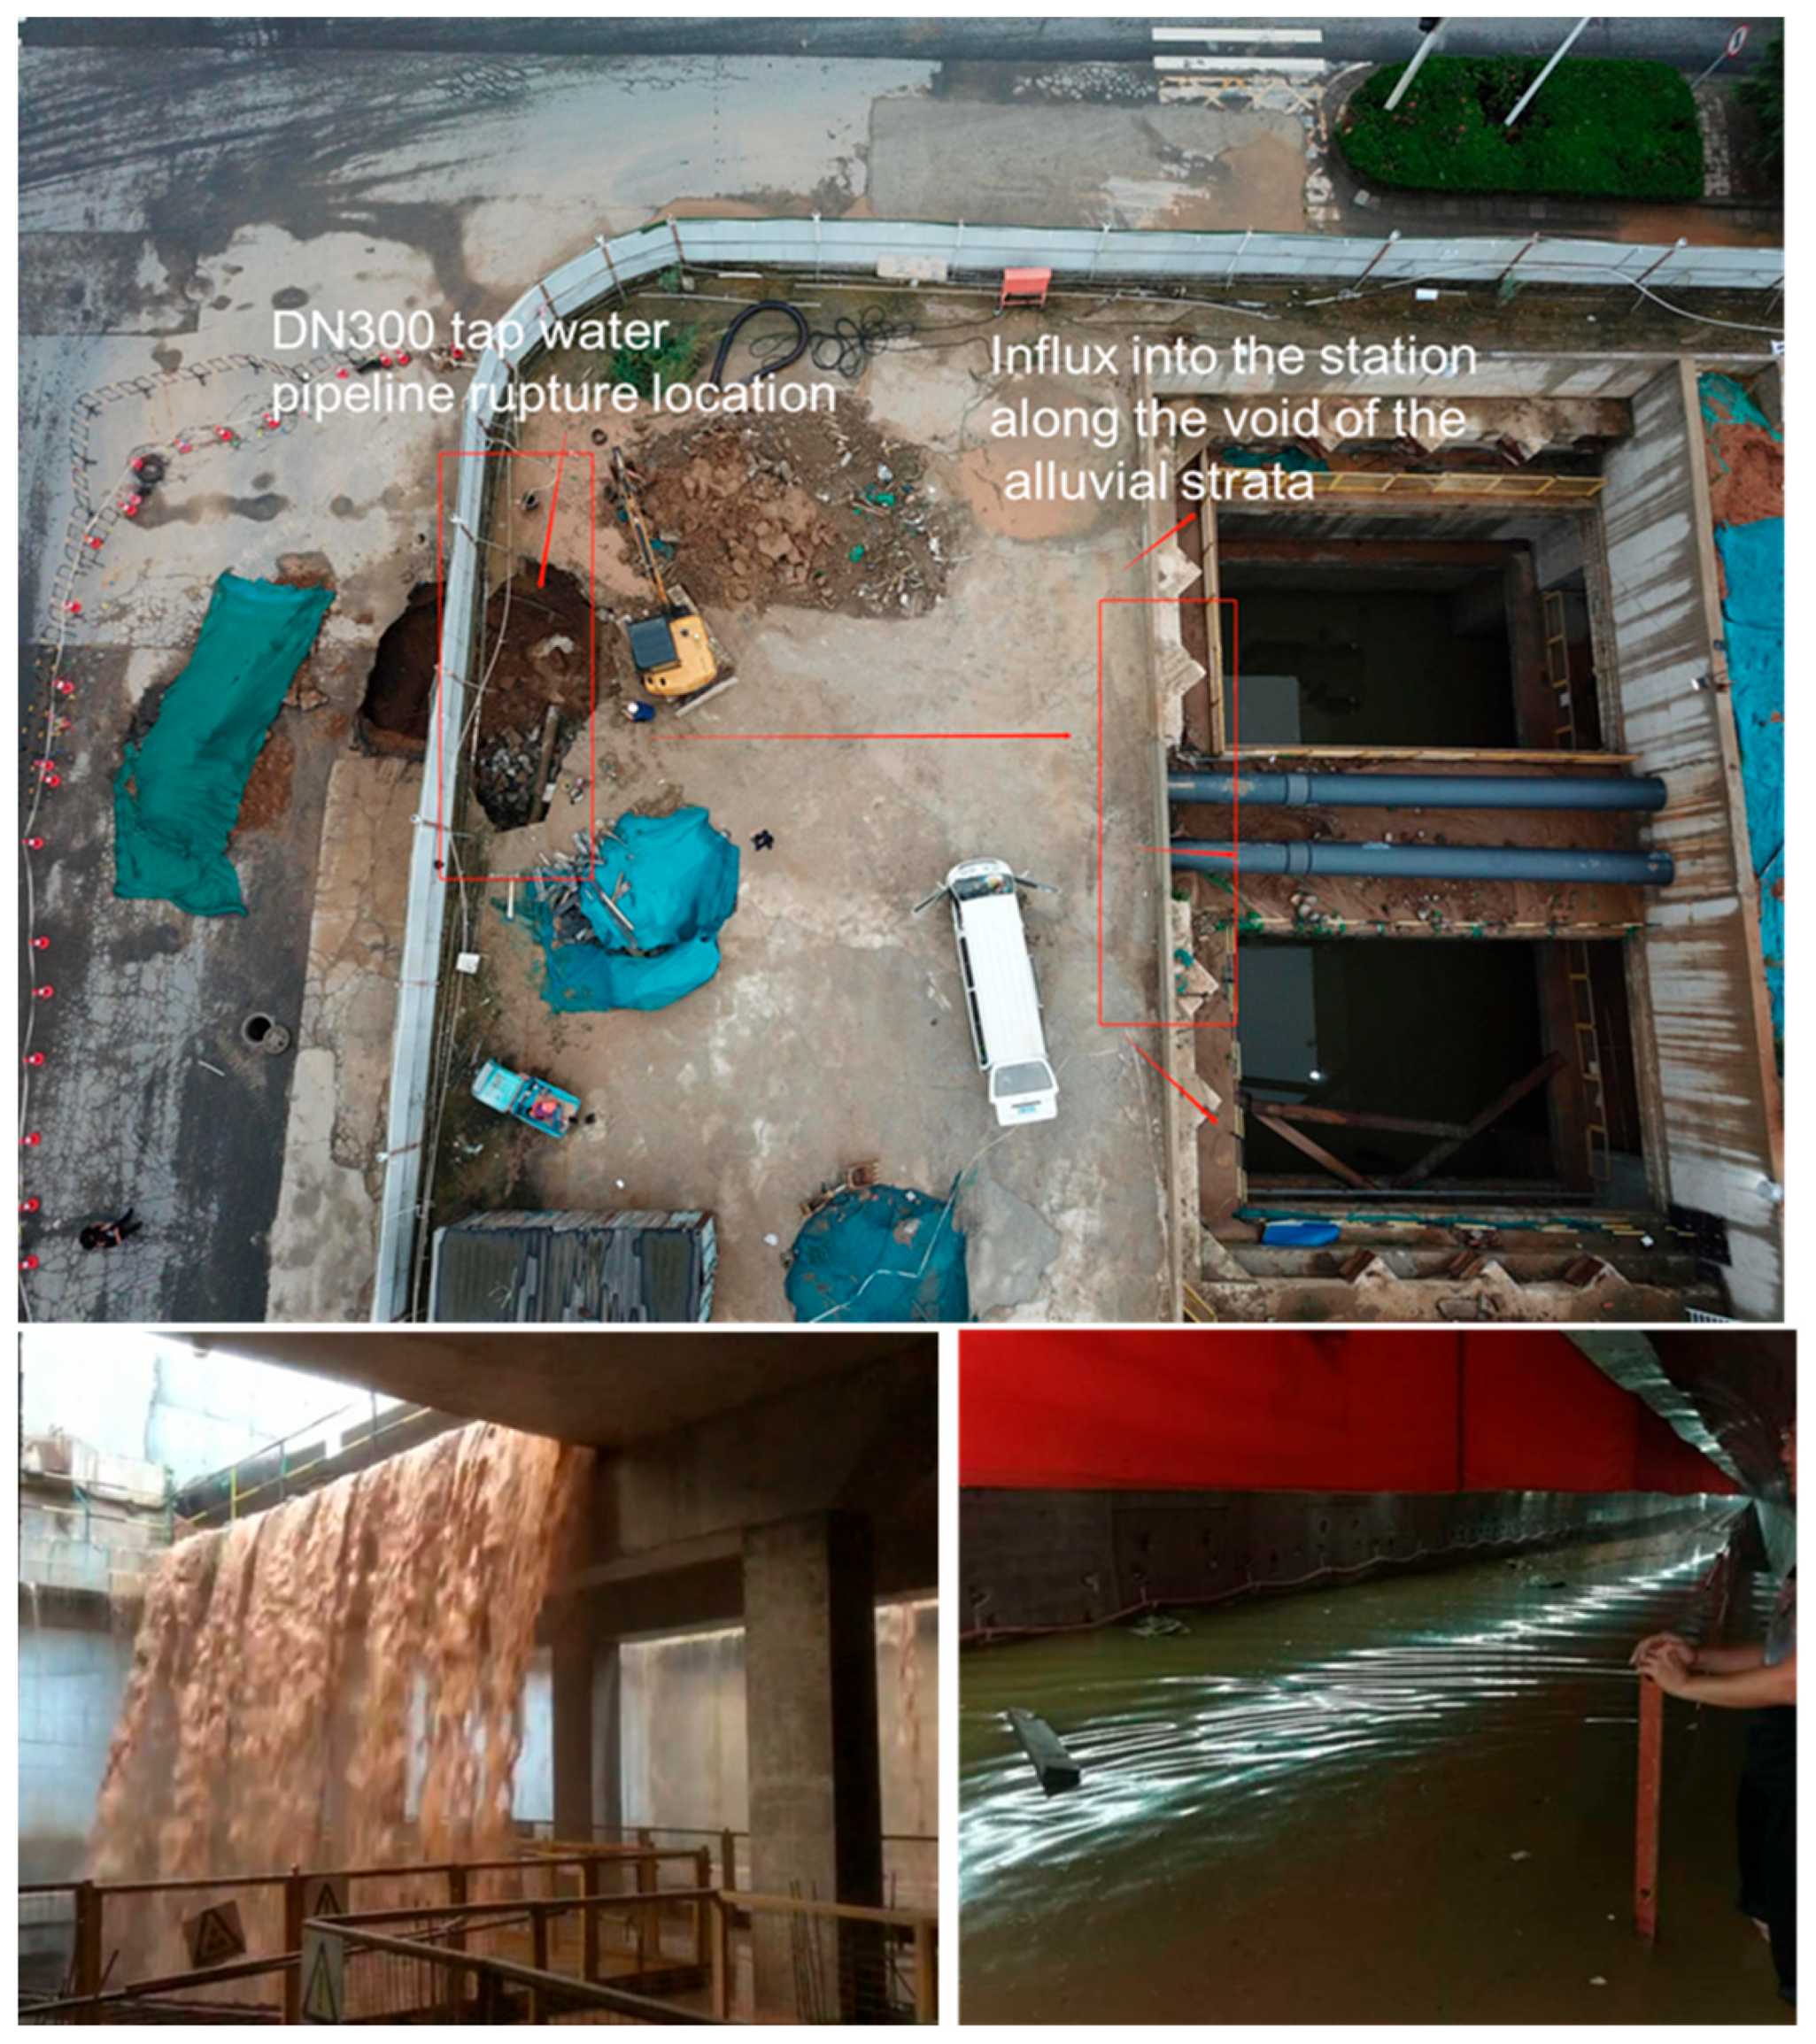
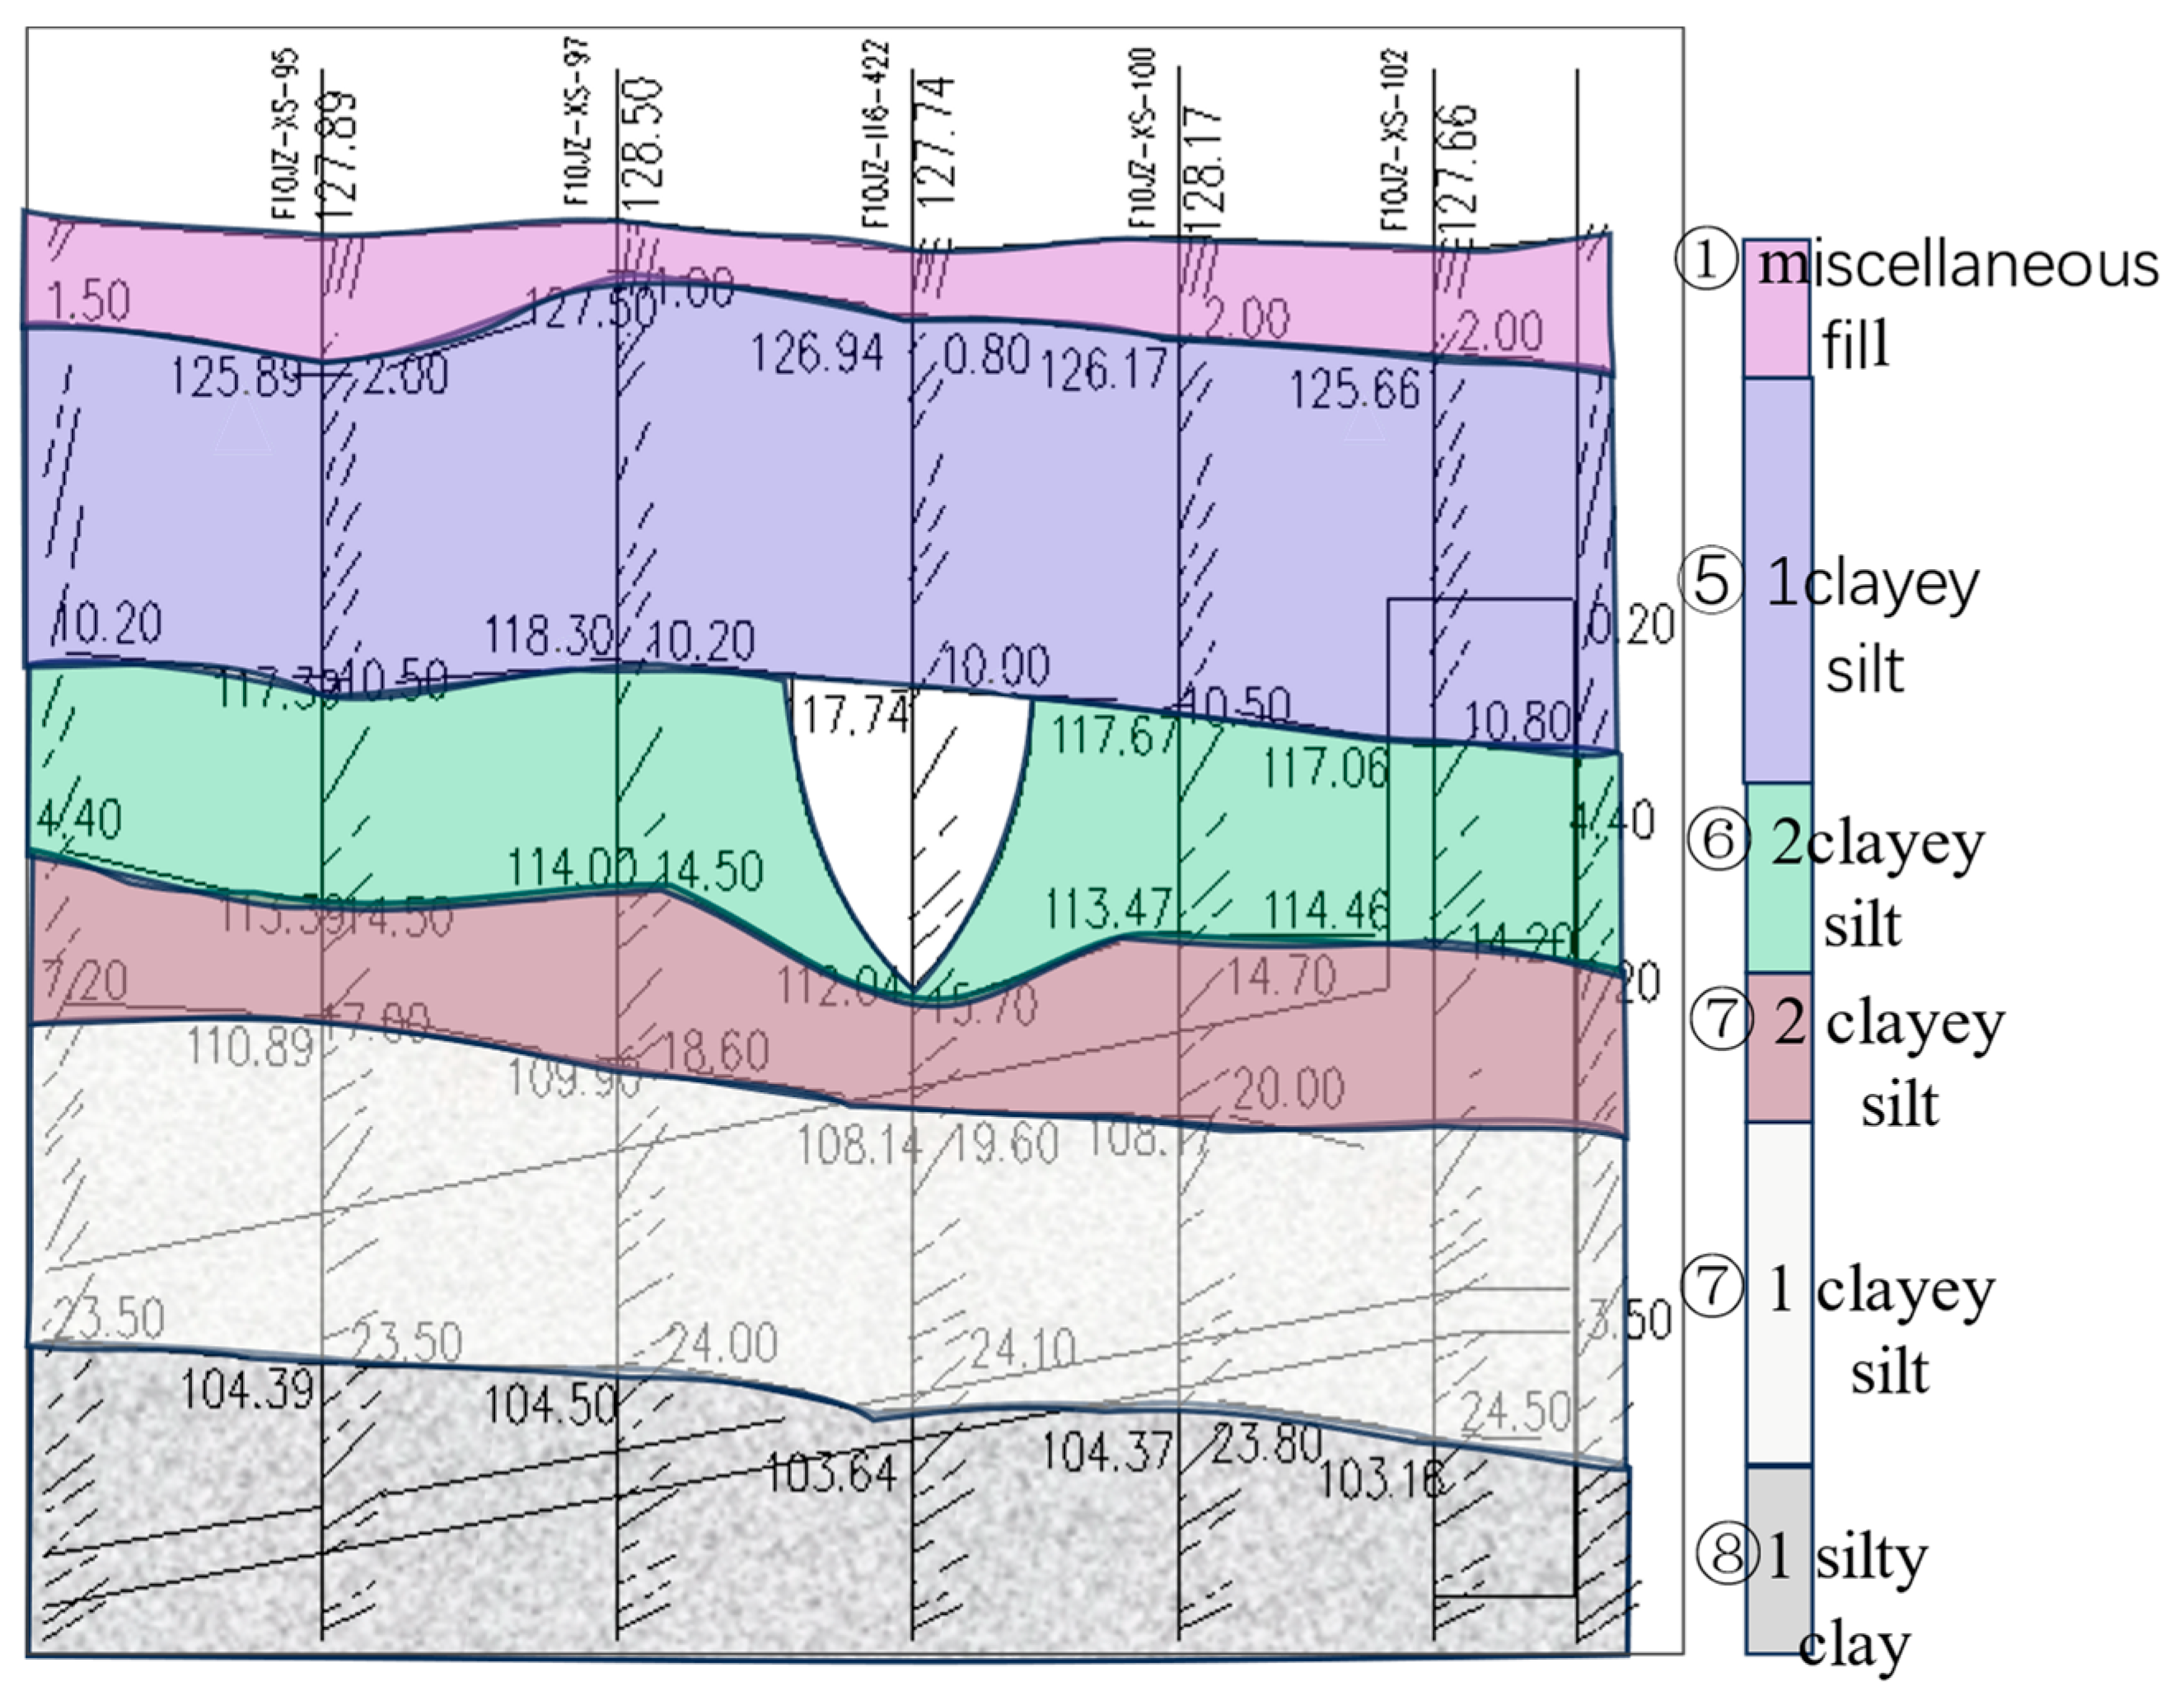
2.4.1. Background

The left line of a specific Zhengzhou Metro section, spanning from mileage ZDK28 + 810.301 to ZDK31 + 770.766, totals 2960.180 m in length. The line’s longitudinal slope forms a “V”-shaped profile featuring a maximum gradient of 27‰. The studied section is located on Line 14 of Zhengzhou Metro in China, as shown in Figure 1. During construction, a tap water pipeline ruptured. The water-filling position of the tunnel is located at the west end of the starting station, and the water flows into the tunnel along the void formation. A large amount of water accumulated in the cave, and the shield machine at the face of the tunnel was flooded, as shown in Figure 2. In a short period of time, there was a “double warning” danger of settlement and deformation rate in the surface settlement monitoring.
The geological conditions encountered during the tunnel’s traverse, from the top to the bottom, are depicted in Figure 3 of the Geological Profile Diagram. The tunnel’s crown is primarily located within the Silty Clay Layer ⑦1 and Silty Clay Layer ⑧11. The groundwater consists of pore water within Quaternary loose accumulations, primarily occurring in the clayey silt and silty clay alluvial–pluvial deposits situated below depths ranging from 31.87 to 34.23 m from the ground surface. The normal groundwater level is located below the base of the interval tunnel.

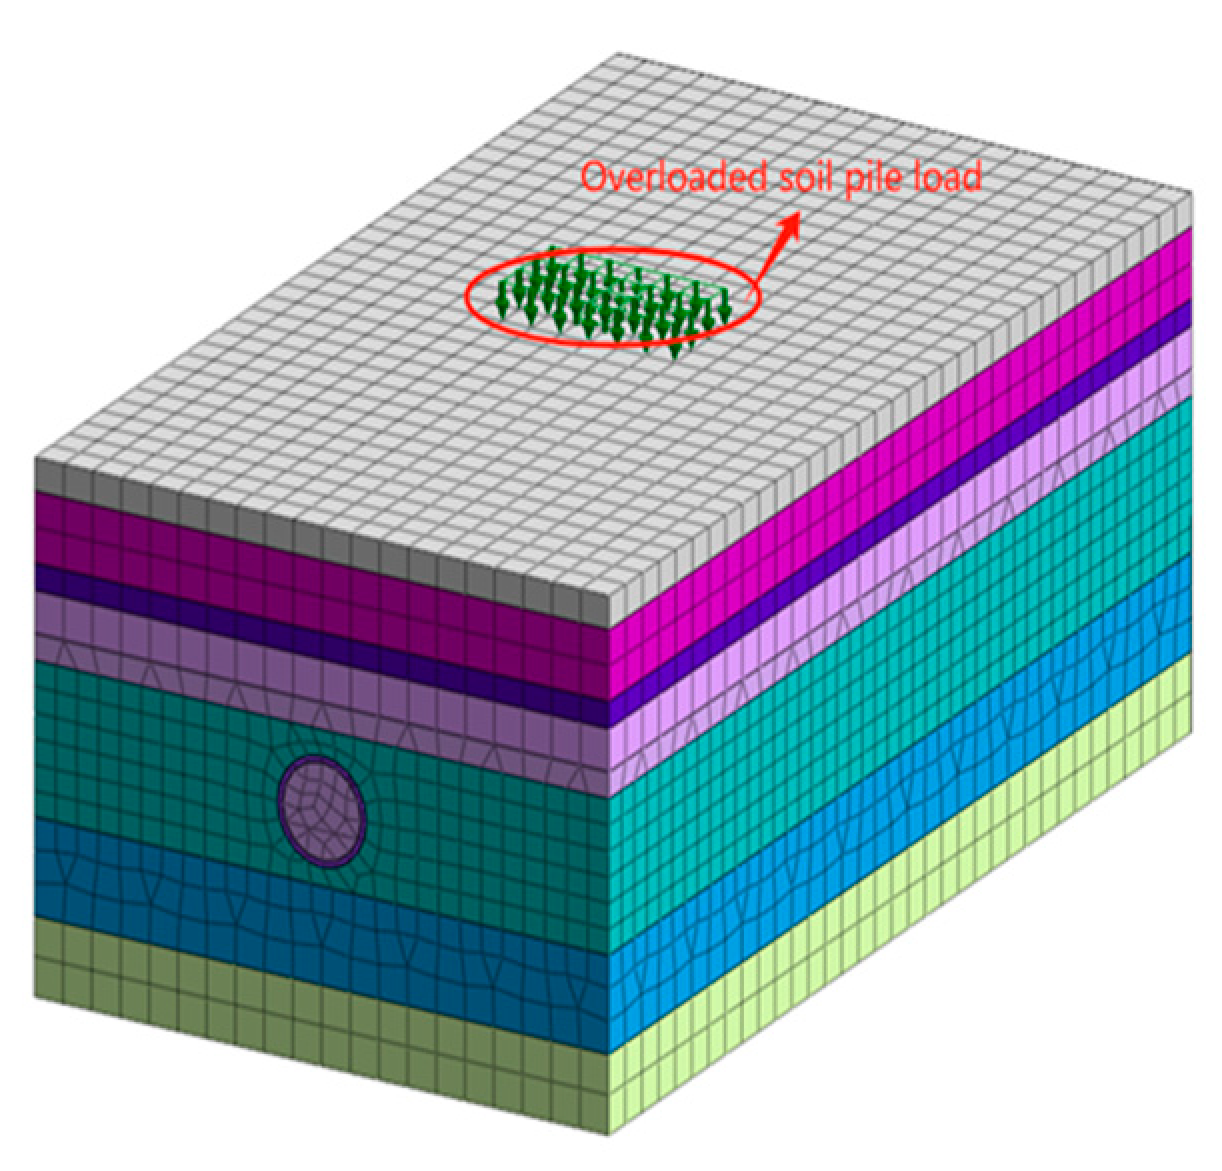
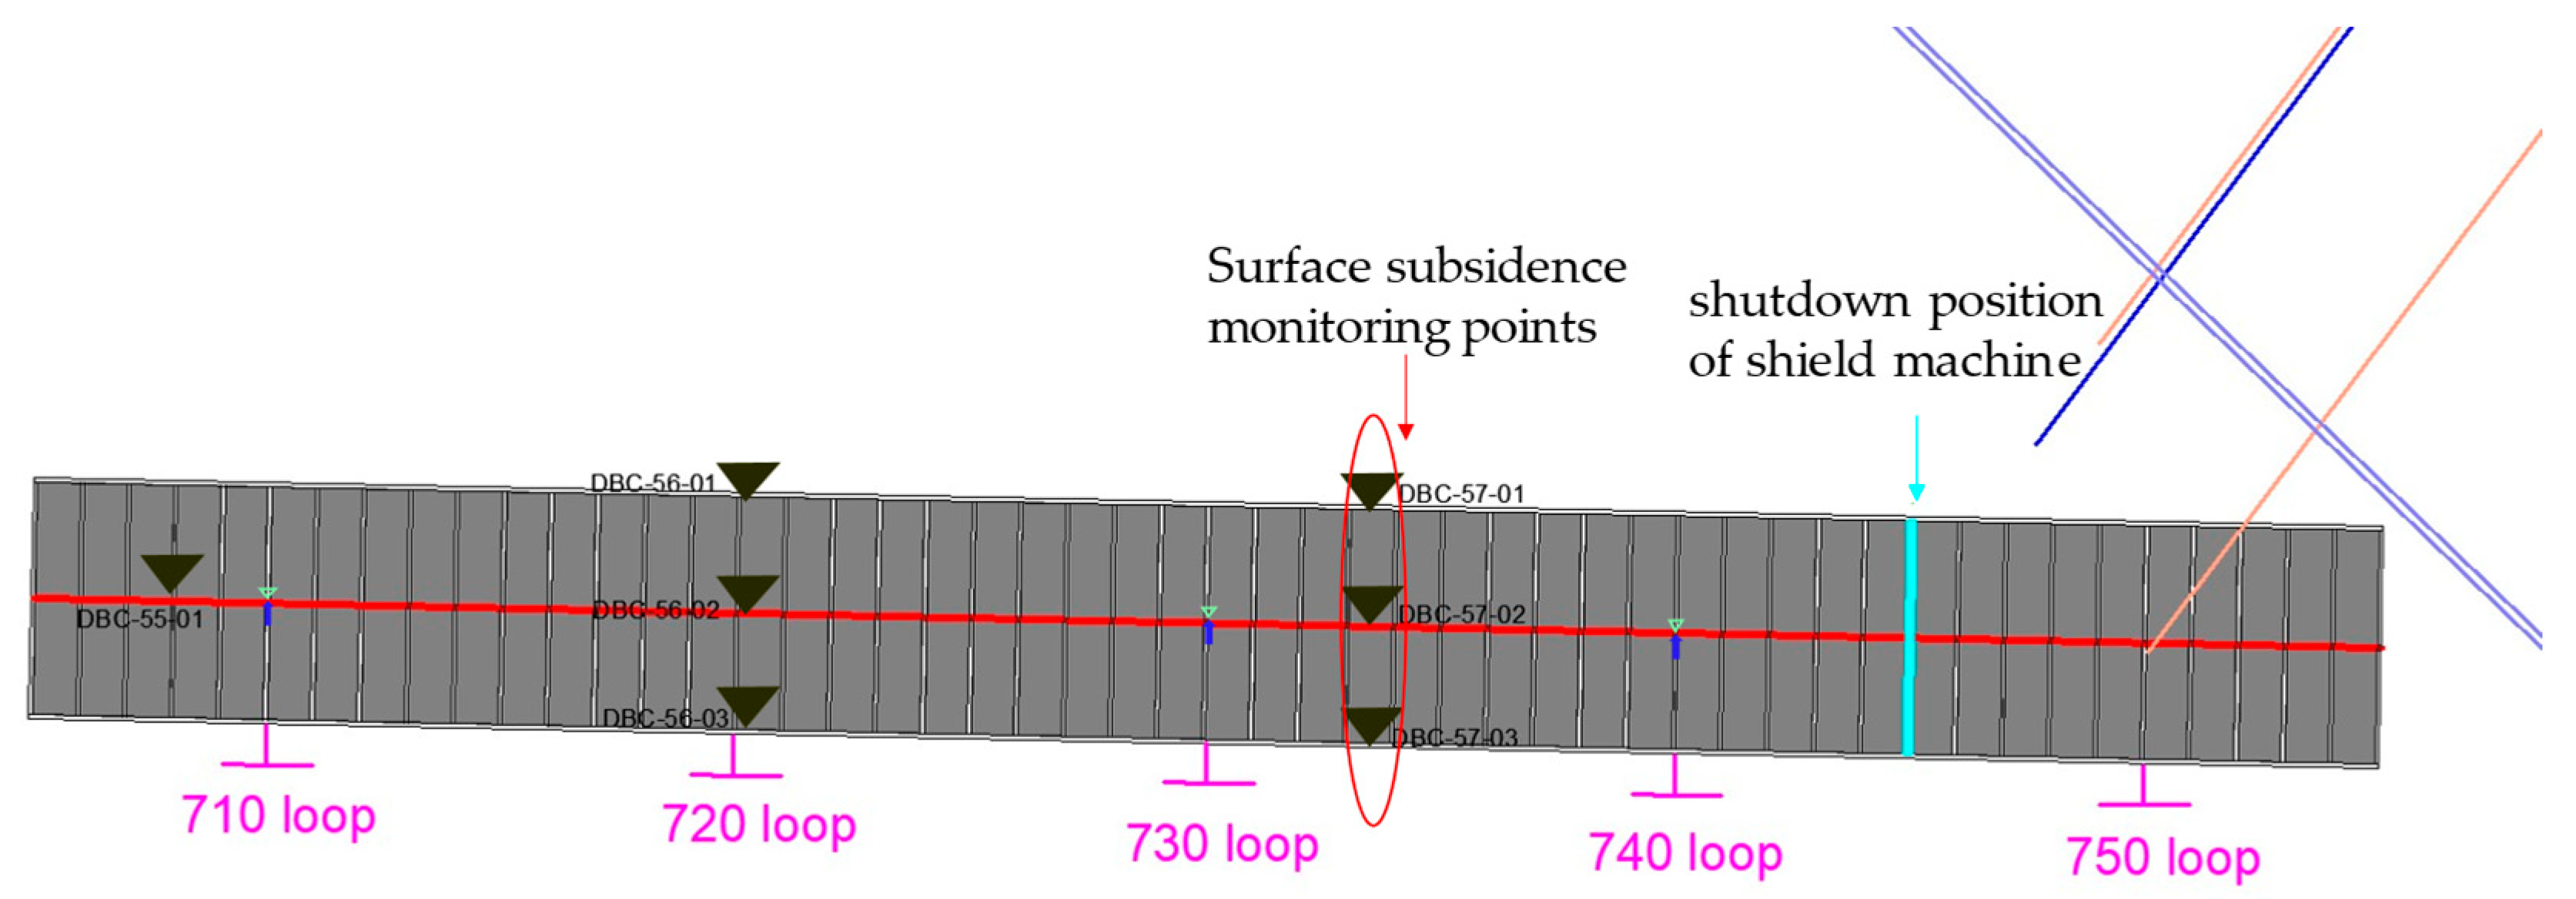
2.4.2. Numerical Modeling

The study area is a tunnel under construction. The numerical model is developed to analyze the coupled characteristics of tunnel immersion and drainage processes based on a simplified shield tunneling excavation. The MIDAS finite element software is used to establish a fluid–solid coupling model that accounts for variations in tunnel water levels. Water seepage follows Darcy’s law, and node head is used to regulate the water level. Based on the Saint-Venant principle [17], the overall model dimensions are set to 69 m × 40 m × 30 m (length, width, height), with 16,580 nodes and 23,539 elements. Taking into account computational time and the focused research focus, the mesh is refined and coarsened accordingly. The mesh division of the model is shown in Figure 4. In situations where there is a large amount of water accumulation in such tunnels for a short period of time, the deformation of the tunnel is transmitted from the internal water head boundary to the surrounding area. The initial water head condition is a curved water head boundary with a specific shape along the bottom surrounding rock within the range of water level height, so the node water head is determined by both the pressure position water head and the pressure water head. The pumping and drainage process involves setting time steps to gradually lower the water head below the bottom of the surrounding rock. Due to the fact that this research case is a tunnel under construction, the calculation of the model is simplified to the normal excavation stage before the tunnel encounters water and the fluid–structure coupling stage after encountering water. For the silty clay stratum, a modified Mohr–Coulomb elastoplastic constitutive model is selected, accounting for both compression and shear hardening behaviors. Based on geological surveys and empirical parameters from nearby tunnels, the soil layer parameters are determined, as shown in Table 2 [18,19,20]. The values of elastic modulus are obtained through conversion using relevant soil mechanics formulas.
E = E 0 = E S ( 1 2 μ K 0 ) = E S ( 1 2 μ 2 / ( 1 μ ) ) ,
where Equation (10) is a widely used trial method for elastic modulus [21], with a value approximately 2.5 times the compressive modulus. In the formula, E represents elastic modulus, Es represents compressive modulus, and μ represents Poisson’s ratio.

3. Results

In order to ensure a data-representative data extraction for analyzing the outcomes of various factors in the fluid–solid interaction process, monitoring points are strategically placed along the vertical axial directions above the tunneling direction across the monitored cross-sections. In particular, this study focuses on the monitoring points located directly above the tunnel axis and the left and right shoulder lines. Figure 5 illustrates the arrangement of these monitoring points (DBC in the diagram).

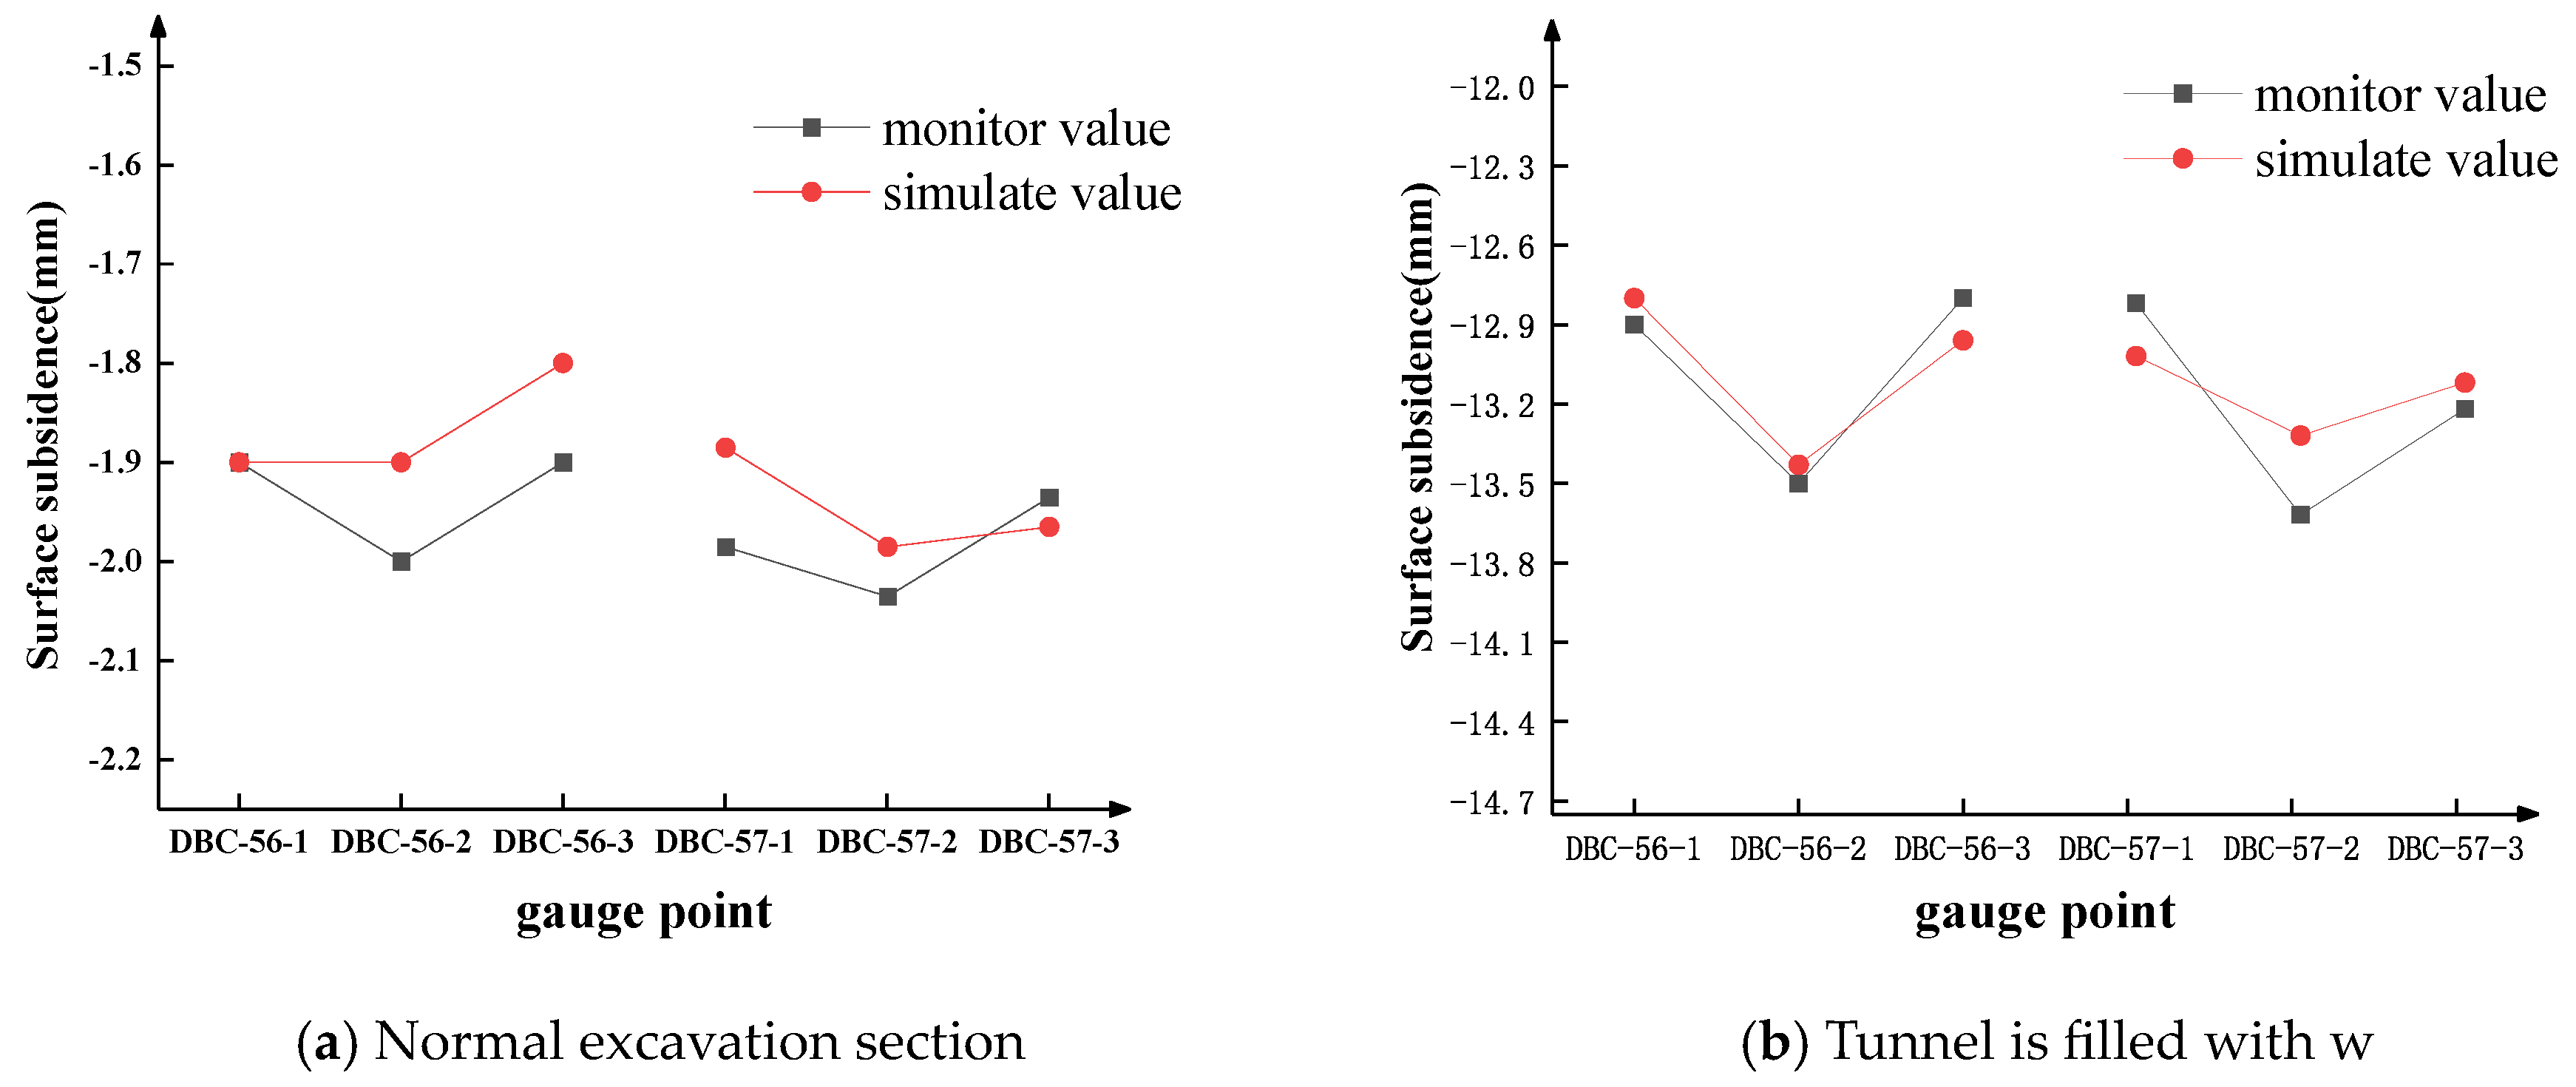
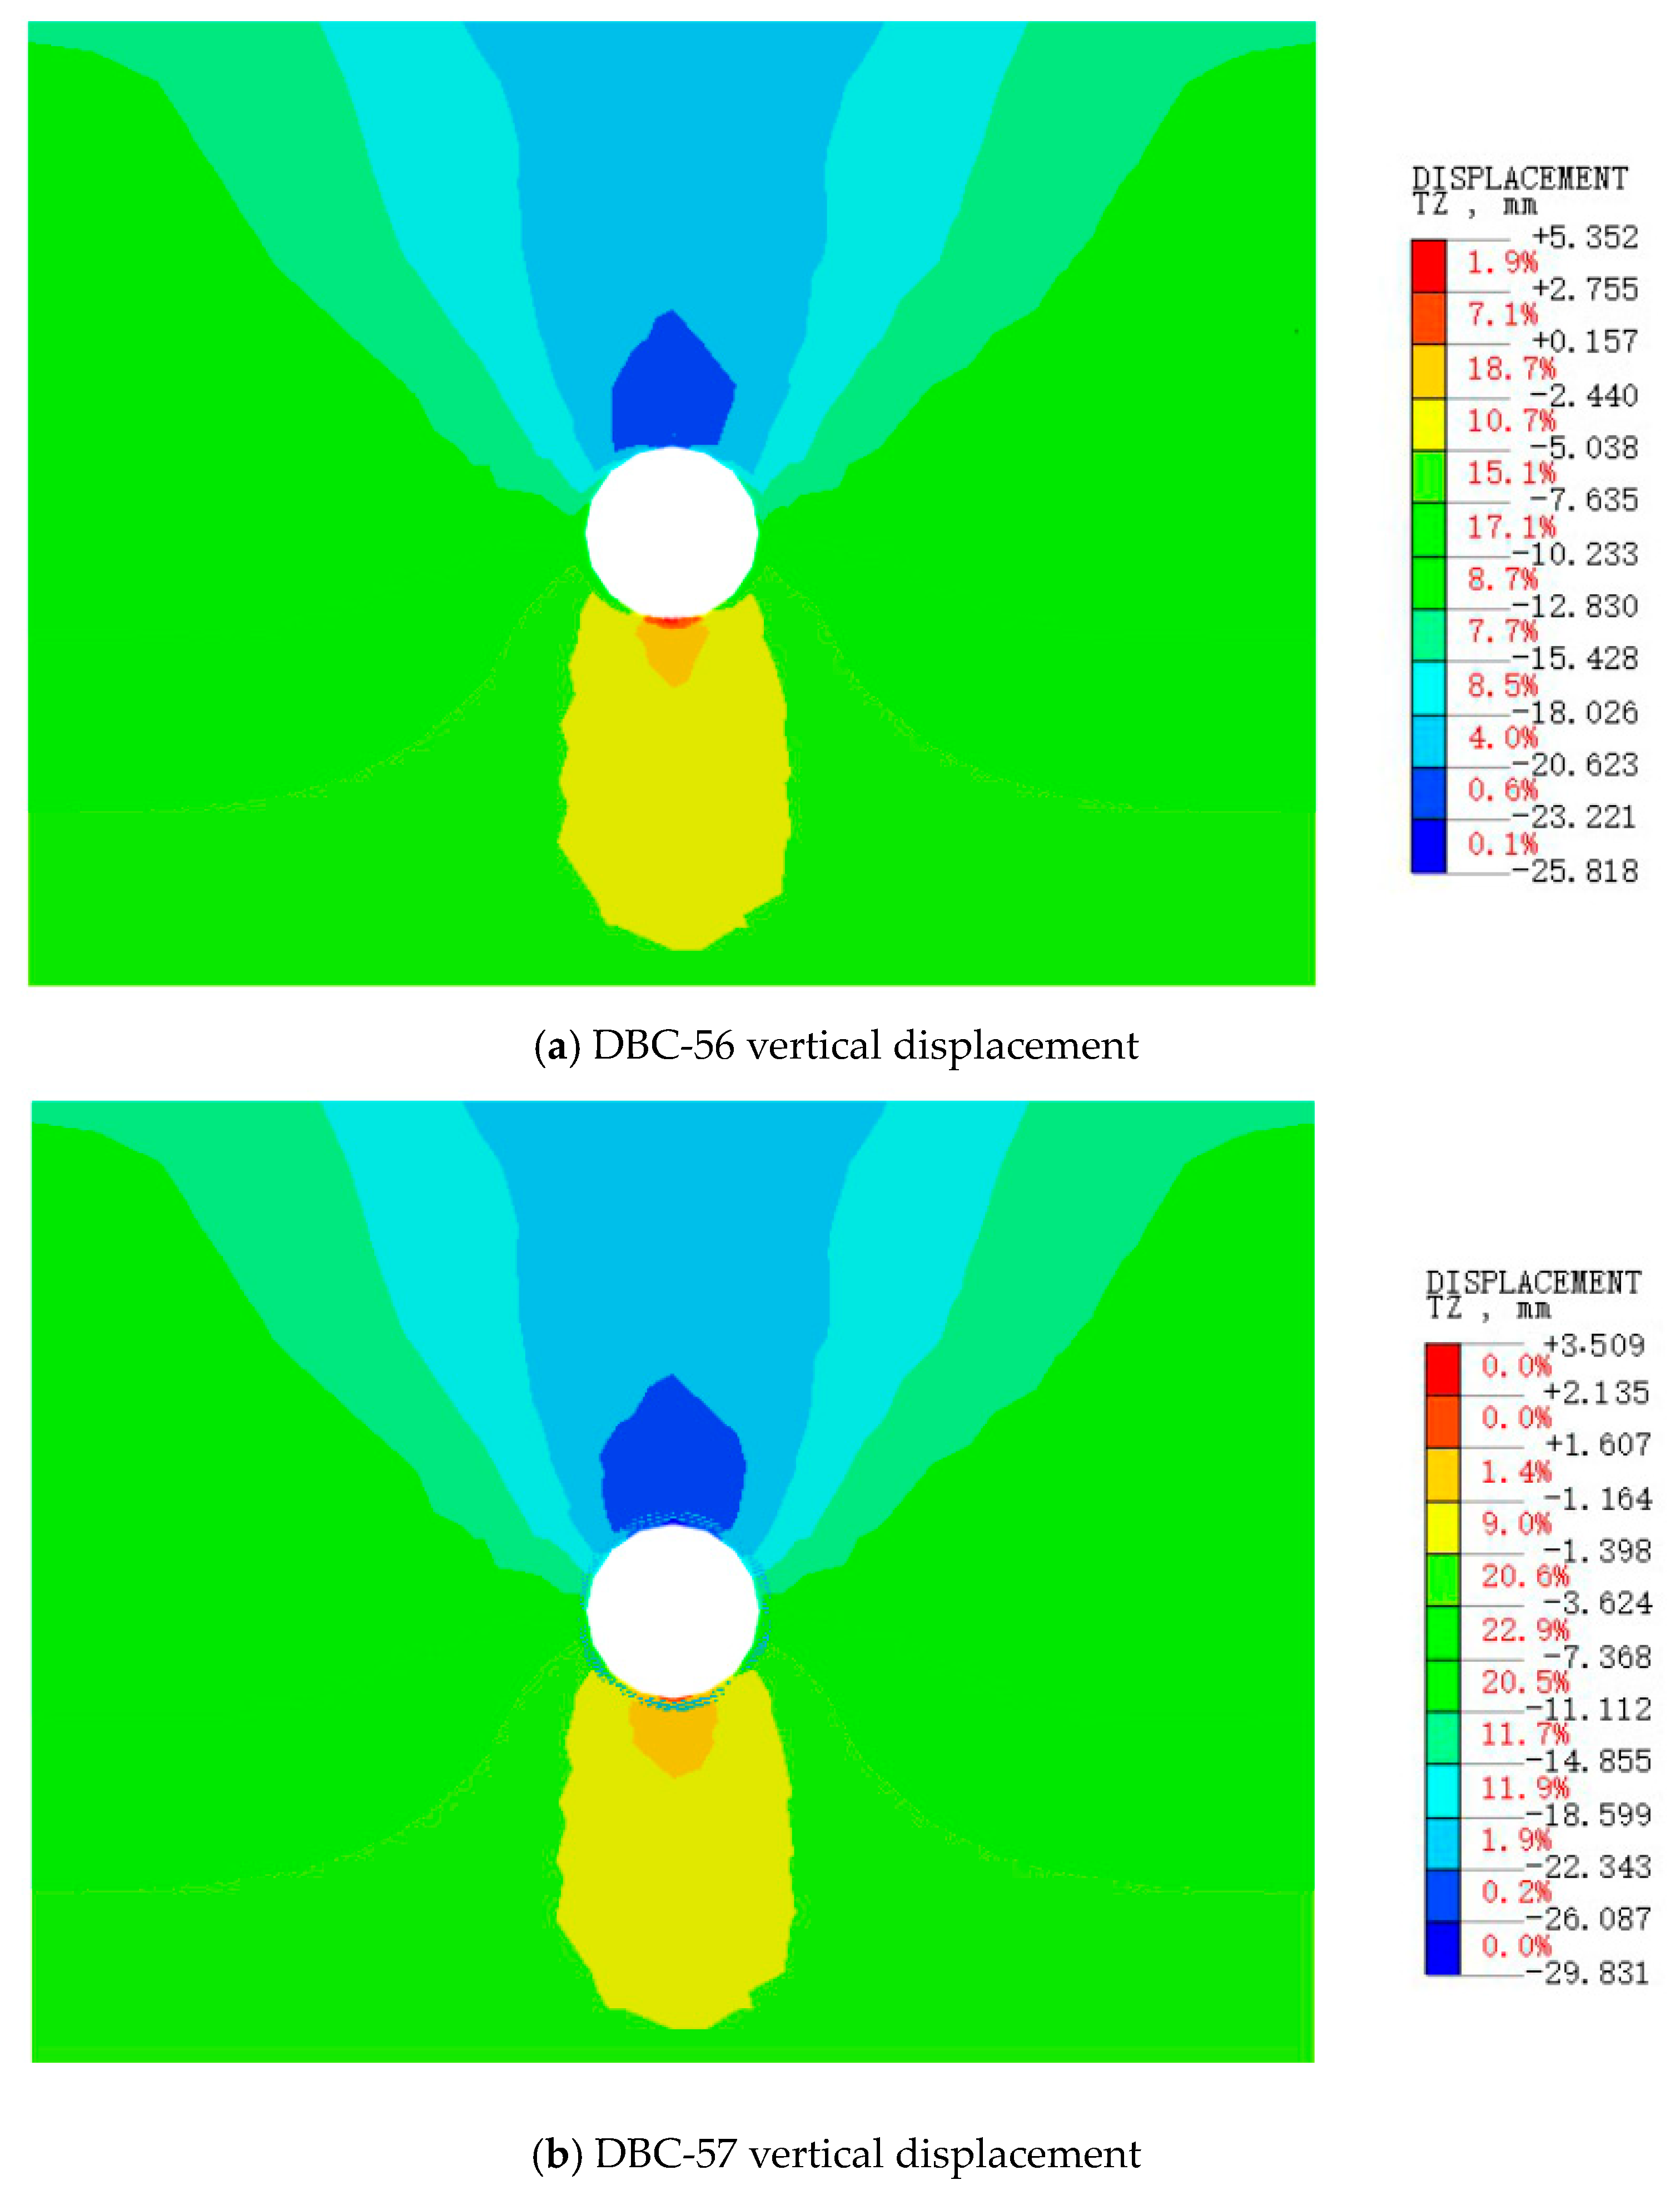
3.1. Model Validation and Vertical Settlement Analysis

Rigorous control of ground settlement impacts on structural integrity, and the surrounding built environment is imperative during shield tunneling construction for subway tunnels. Figure 6 extracts data from surface settlement monitoring points on monitoring sections DBC-56 and DBC-57 for comparative analysis. The overall surface settlement deformation map of the tunnel before and after encountering water shows that the settlement on the central axis is slightly greater than that on the left and right shoulder lines, which conforms to general rules. There is a slight discrepancy. Analysis suggests that, firstly, numerical models make certain assumptions during the modeling and calculation process. Secondly, there are errors in the on-site monitoring data themself, including the accuracy of measuring instruments, the rationality of measurement methods, and the rationality of data processing. It is evident from the figure that the monitored and calculated values of settlement, both during normal excavation and instability-induced settlement after water ingress, align closely. This fully demonstrates the reliability of the model.
The interaction between the soil (which deforms upon water immersion in the tunnel) and the internal fluids results in a surface settlement curve throughout the entire process, as shown in Figure 7. The width and the magnitude of surface settlement in shield tunnels are influenced by various factors, including the physical and mechanical properties of the surrounding rock and soil, groundwater conditions, and construction parameters. As shown in Figure 7, upon water immersion, the settlement trough widens slightly with minimal variation and nearly remains stable during the pumping and drainage phase. The analysis indicates that the initial water source is within the tunnel and initially affects the near-tunnel surrounding rock through soil–water coupling. As the seepage force of water and volumetric strain of the soil develops, it is evident that the soil deformation is significantly transmitted in the vertical direction, with limited influence in the horizontal direction. This critical deformation characteristic distinguishes it from conditions such as large-area rainfall infiltration in the soil above the tunnel.
Figure 8 shows the vertical displacement contour maps of monitoring sections 56 and 57 after submersion of the tunnel. Combining Figure 7 and Figure 8, significant deformation in the surrounding rock and soil is evident after tunnel immersion, with surface settlement reaching 13.5 mm. During the pumping and drainage, fluid movement in the seepage field increases settlement, reaching 25.82 mm at the surface. The displacement contour maps show maximum displacement at the tunnel vault for both sections. In section 57, close to the tunnel face, the surrounding rock displacement is about 30 mm, which is close to the warning value. During pumping and drainage, excessive deformation and settlement in the surrounding rock and soil require reinforcement measures to ensure safety.

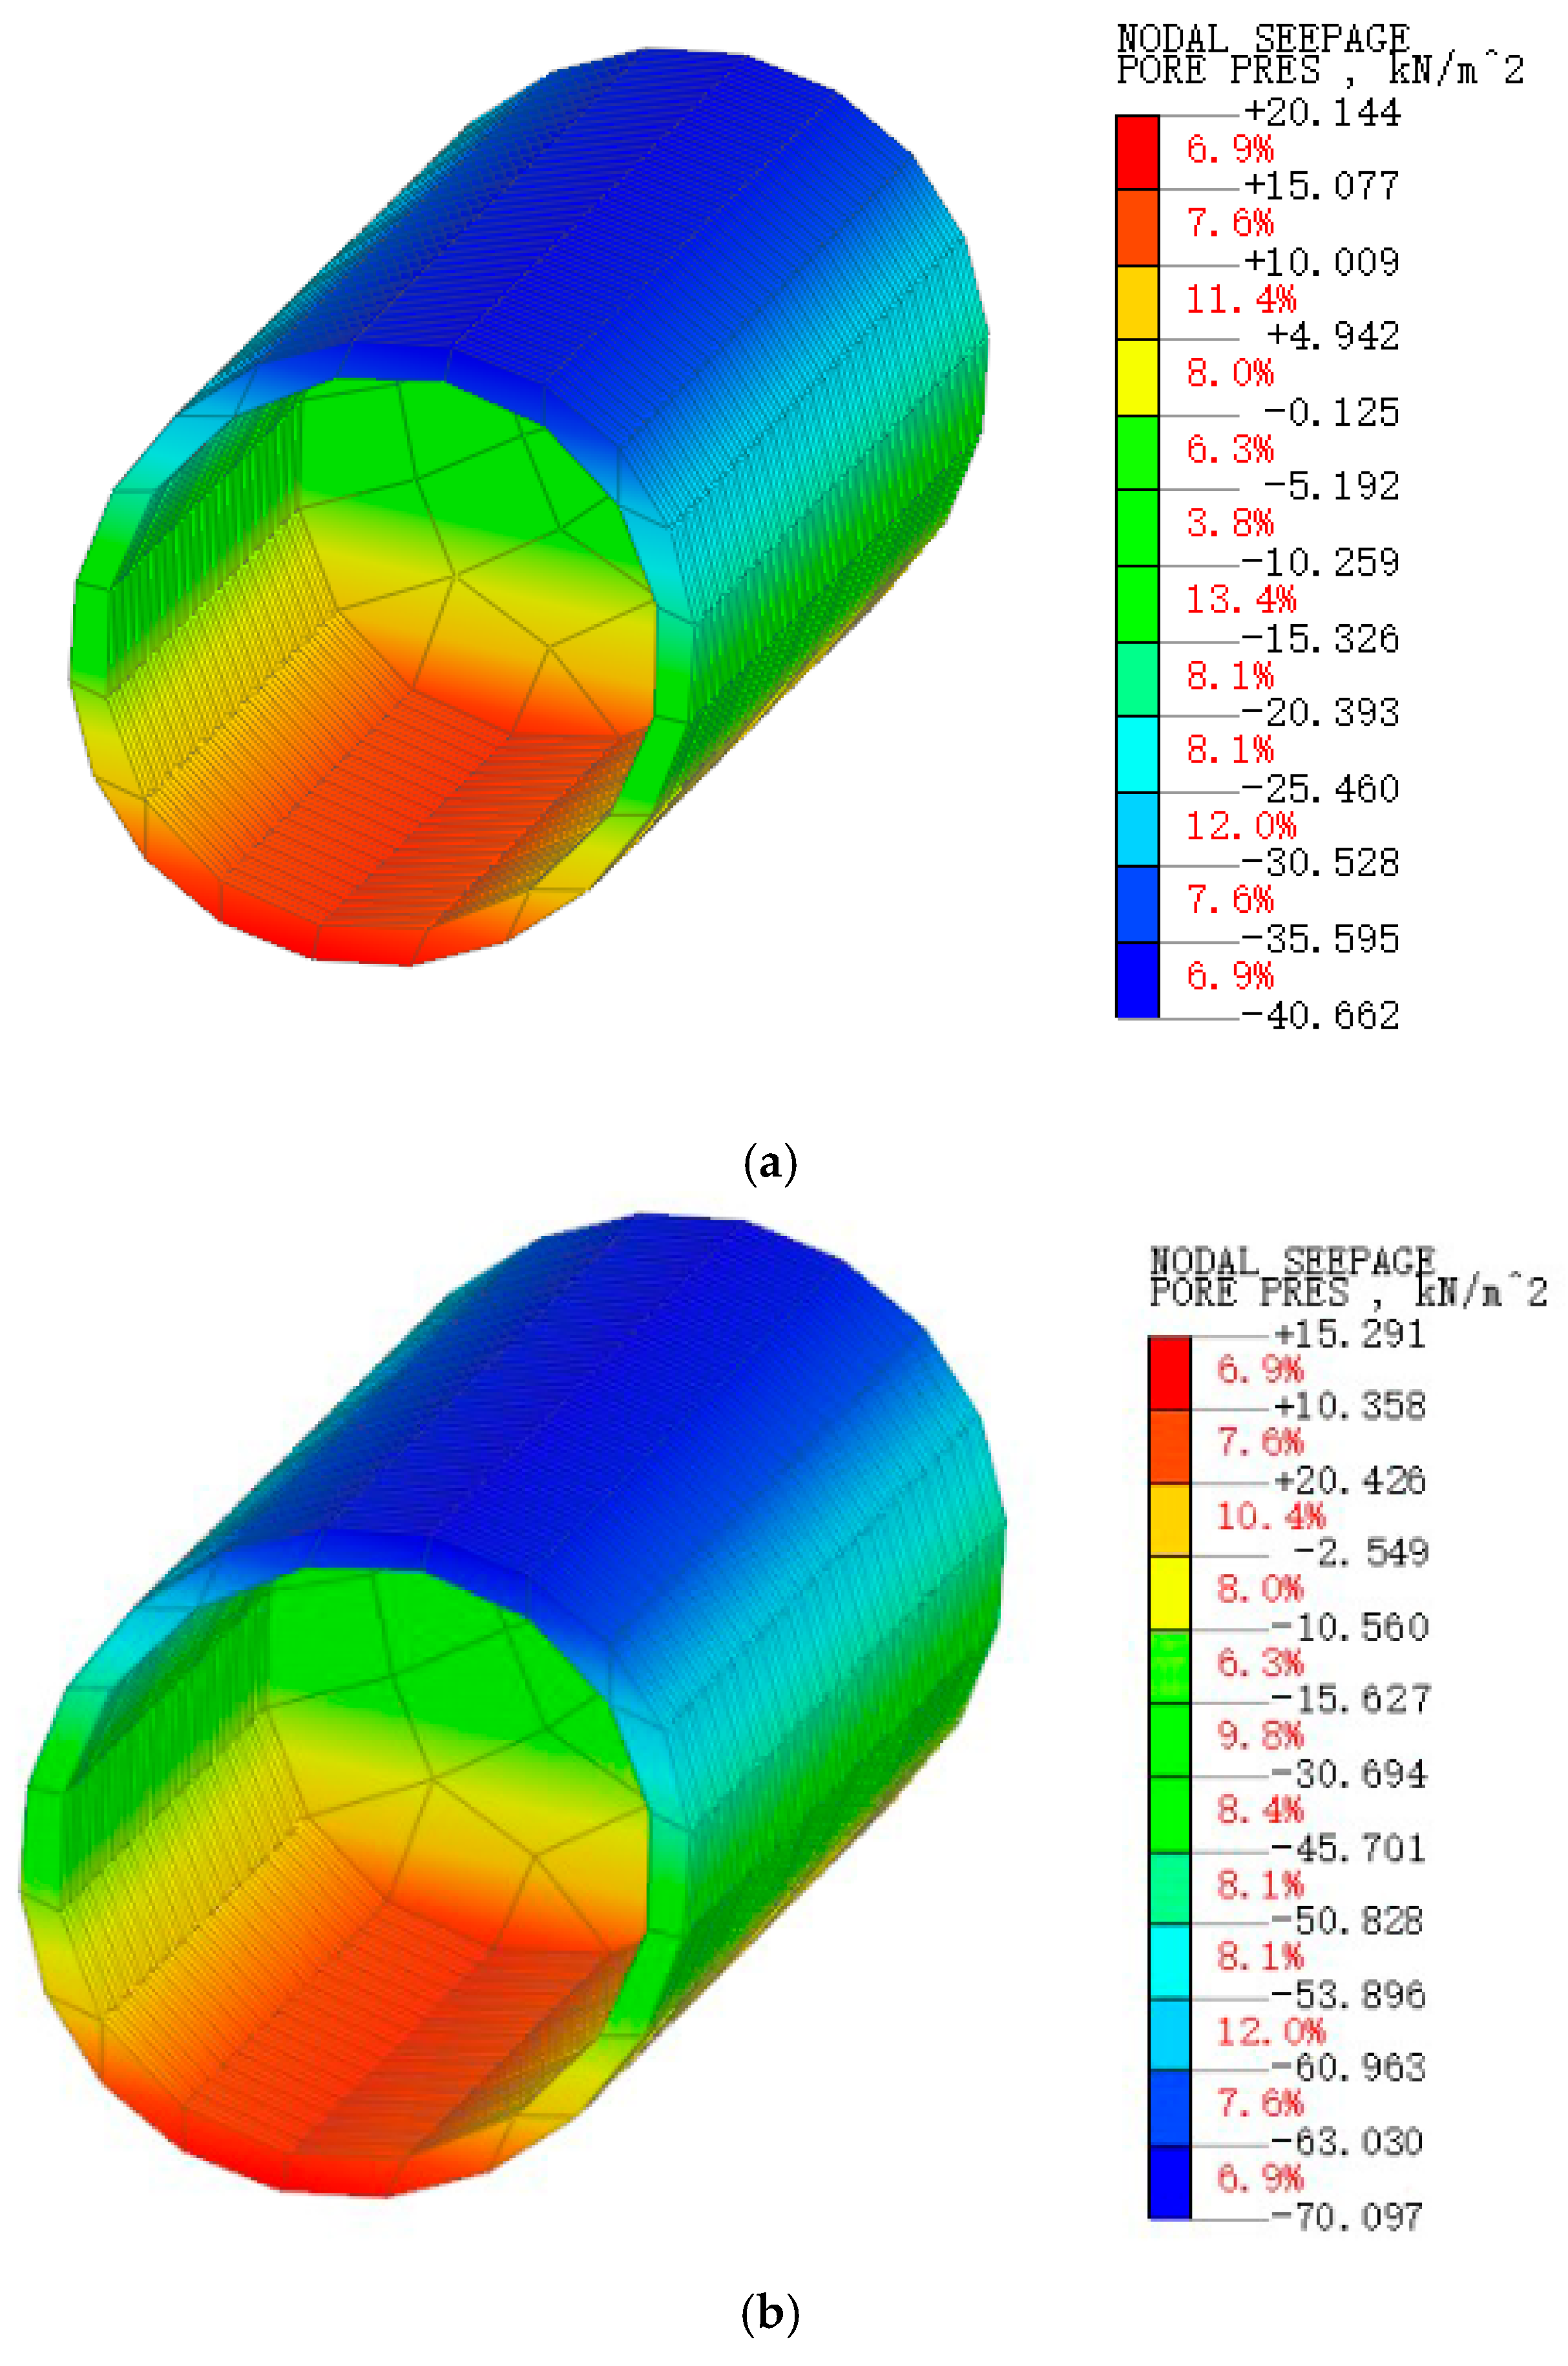
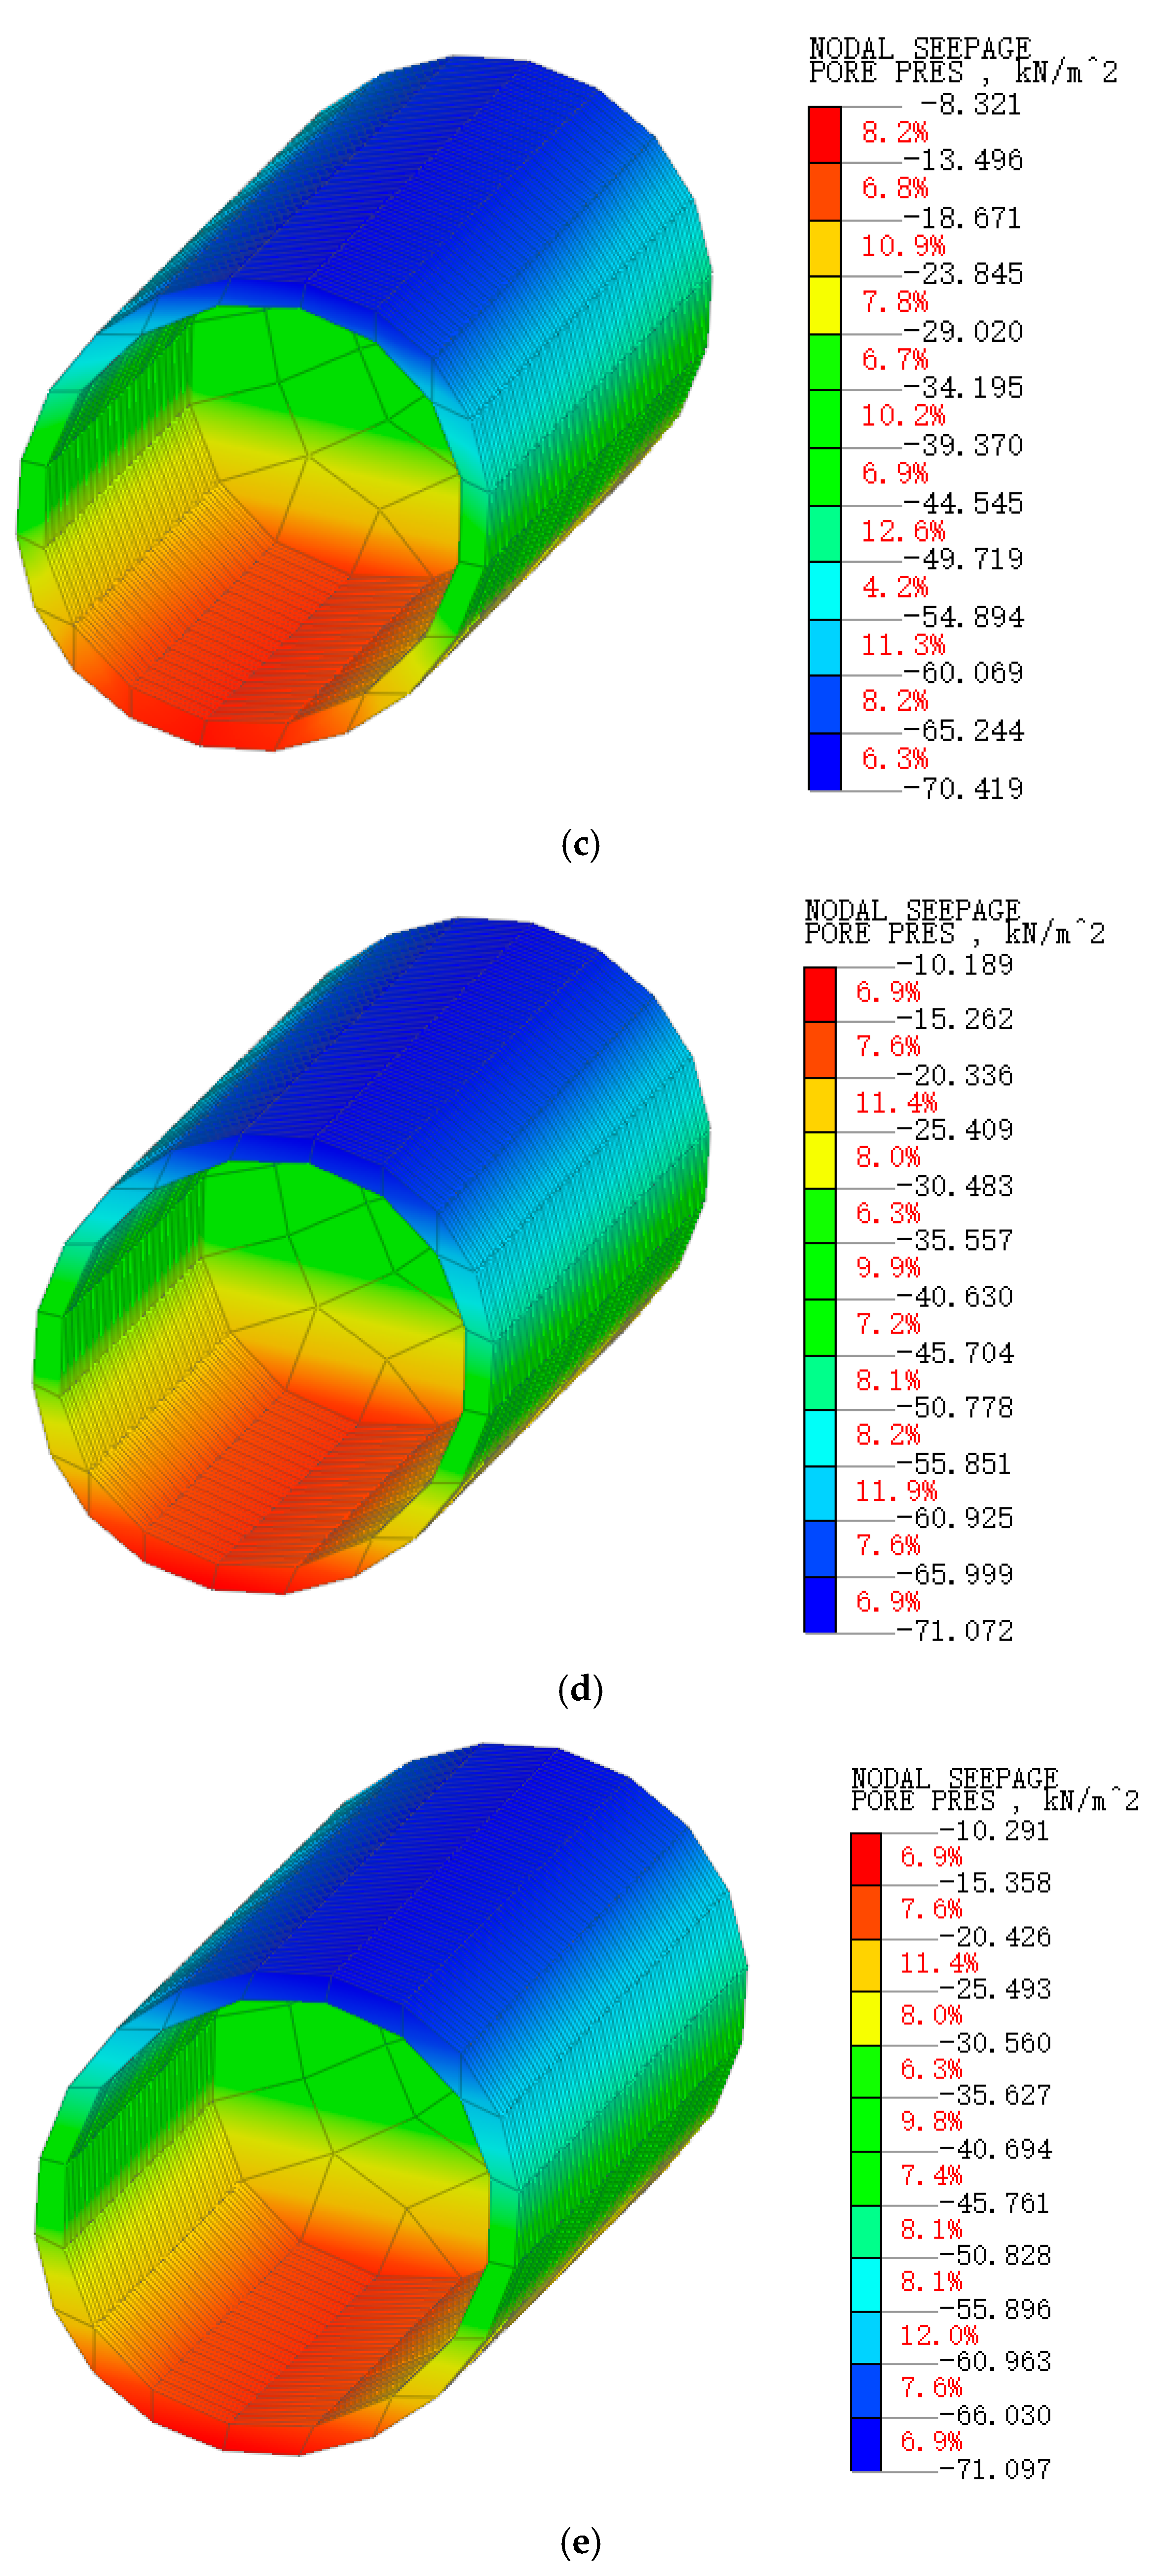
3.2. Pore Water Pressure Changes

In low-permeability clays, the rates of pore water pressure buildup and dissipation significantly affect soil settlement and deformation. In shield tunneling projects, these processes can account for up to 40% of total settlement [22]. Figure 9 shows pore pressure variations at different time steps (ts) during the immersion and dewatering of the tunnel chamber and surrounding rock. Figure 10 shows pore pressure variation curves at the invert and surrounding rock on both sides of the water accumulation surface in the tunnel chamber. Figure 9 and Figure 10 show that the maximum pore pressure of 20.1 kPa occurs at the invert near the tunnel face after immersion, while the minimum pore pressure of −40.6 kPa is recorded at the far end.
The upper soil mass of the entire surrounding rock has low water content and possesses a higher matric potential compared to the lower part, aligning the resultant contour map with actual tunnel conditions upon water encounter. During dewatering, the pore pressure at the tunnel invert decreases to 15.3 kPa at the first ts, then drops to −8.3 kPa at the second ts, and temporarily stabilizes at −10.2 kPa, −10.3 kPa, and −10.3 kPa for the third, fourth, and fifth ts, respectively. This indicates that the groundwater level has descended below the tunnel chamber by the second ts and that the pore pressure remains relatively stable after the third ts, gradually dissipating over a longer period.
In the first time step (ts), the pore pressure drops by 4.8 kPa, a 24% decrease, which is significantly slower than the rate of decrease observed in the second ts. The tunnel traverses a silty clay stratum composed of clayey soil with a plasticity index of 10 to 17 and a clay particle content of 30% to 50%. This soil exhibits a low permeability coefficient, and time dependency is a crucial feature of its deformation [23]. The transmission of water pressure in low-permeability clay requires time, resulting in a lag phenomenon in pore pressure changes.
Figure 11 shows the seepage flow path of the water accumulated in the cavern. It can be observed that after the tunnel is flooded, a seepage surface forms in the soil from the water head boundary, altering the seepage boundary conditions and consequently modifying the pore pressure in the soil. The establishment of seepage channels and the presence of hydraulic gradients sustain fluid movement within the seepage field, leading to increased settlement. Upon completion of dewatering, the flow vectors diminish, and the pore pressure attains a stable state.

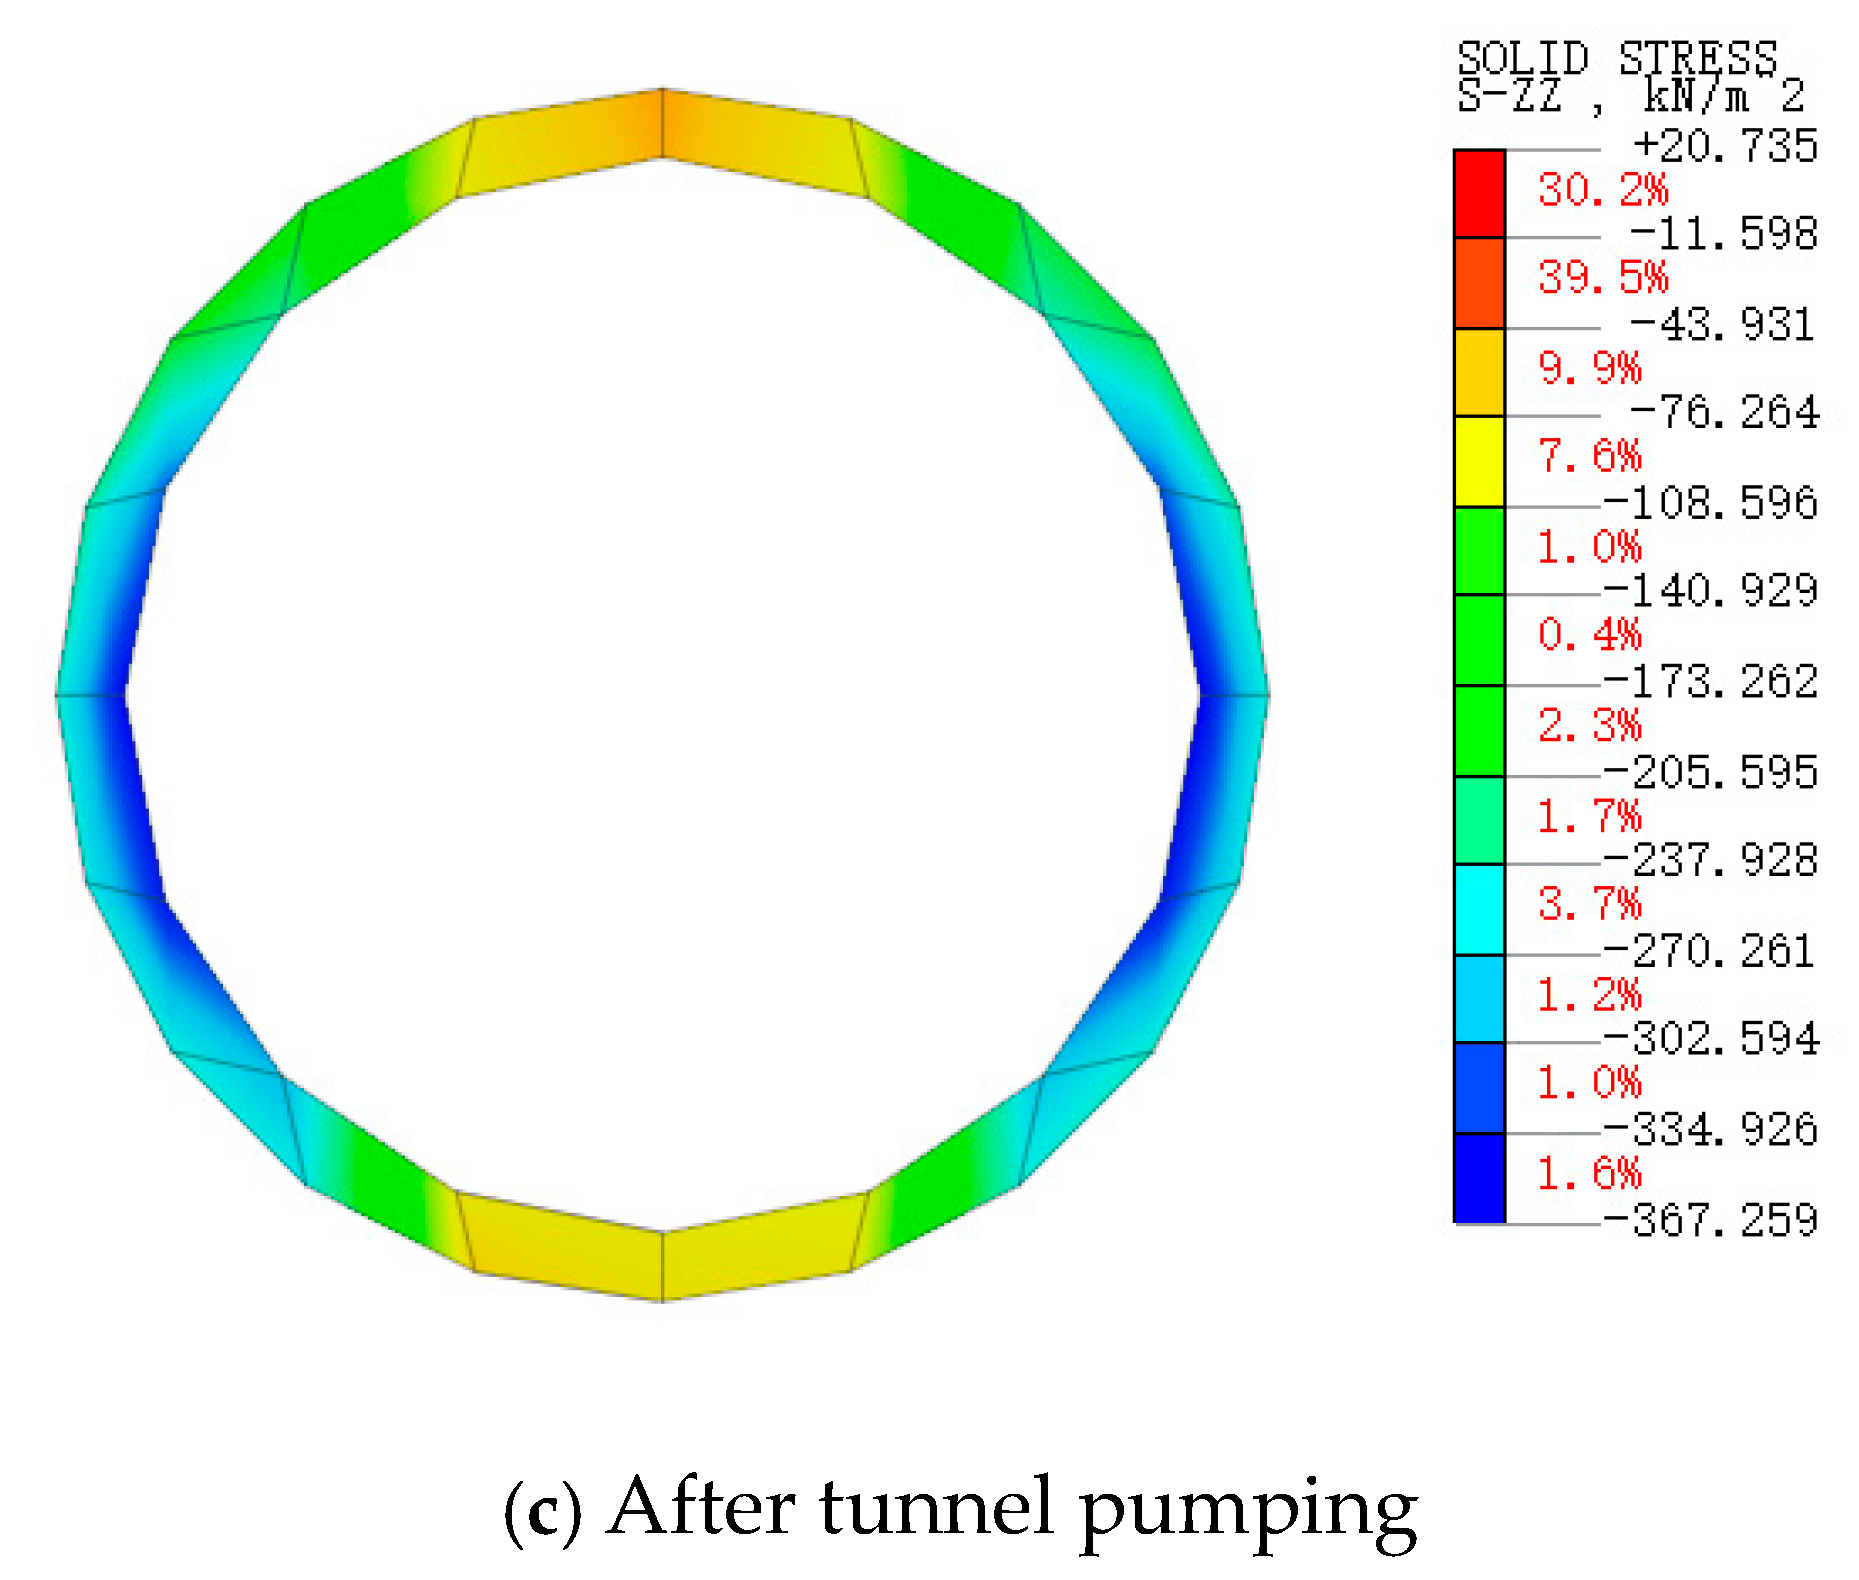
3.3. Changes in Surrounding Rock Stress

Silty clay naturally has good strength properties. However, when exposed to water and saturation, its mechanical properties change significantly compared to its natural state. In 1978, Fredlund [24] proposed a theoretical formula to describe the strength of unsaturated soils, clarifying the relationship between net normal stress ( σ n u a ) , matric suction ( u a u w ) , and soil strength.
τ f = c + ( σ n u a ) tan φ + ( u a u w ) tan φ b ,
where c’ is the effective cohesion; τ f is the shear strength; σ n stands for the normal stress; φ’ is the effective internal friction angle; and φ is the friction increment associated with matric suction; u a and u w represent air pressure and air–water pressure, respectively.
Figure 12 shows the stress variations in the surrounding rock at the tunnel face, comparing pre- and post-water immersion conditions. Stress variations in the surrounding rock, as shown in Figure 12, are evident before and after water immersion. The largest percentage of stress concentration occurs within a range of 38.2%, indicating that most of the surrounding rock is under compression. The maximum compressive stress is 365 kPa, located at the arch waist. Near the tunnel face at the crown, a slight tensile state with a stress of 20.4 kPa emerges locally. After water immersion, the maximum compressive stress drops to 352.1 kPa, a decrease of 12.9 kPa. Following dewatering and drainage, the stress state almost returns to its original level. Unsaturated soil immersion increases saturation, altering the stress state of the surrounding rock and gradually filling pores with water. Based on the above relationships, the matric suction decreases, resulting in reduced stress and a significant decrease in surrounding rock strength. Additionally, according to the principle of effective stress, as the moisture content increases, the soil cohesion, effective internal friction angle, and effective stress decrease. Macroscopically, this manifests as a reduction in soil-bearing capacity and the occurrence of significant settlement and deformation of the soil.

4. Discussion

This paper is based on research and summaries of domestic and foreign subway water collapse events, with a special focus on Zhengzhou Subway Line 14, where a sudden water inrush occurred at an interval station, resulting in settlement warning engineering examples, as a case study. Considering the changes in water and drainage levels, theoretical analysis and flow–solid coupling numerical methods are used to investigate the physical and mechanical characteristics of the tunnel surrounding rock and soil before and after the water inrush and reveal the evolution mechanism of tunnel water surrounding rock instability, surface settlement warning, and other disasters in the tunnel as a seepage source. A preliminary study to fill the research gap under such special working conditions.
It should be pointed out that the tunnel in this study traverses a stratum of silty clay with distinctive mechanical properties, and whether there is the same destabilization damage mode or differences in other strata can be explored by constructing physical models and numerical simulations in the subsequent work.
At the current stage of shield tunnel construction, the pore space between the tube sheet and the soil body is often filled by synchronized grouting materials, and scholars have also studied the grouting materials from the aspects of viscosity, mobility, and change behavior in different soil yells [17,25,26], and the reasonable grouting layer has a positive effect on waterproofing. However, sudden water sources usually bring strong water–soil interactions, which rapidly change the moisture state of the soil and its permeability and trigger the rapid destabilization of the soil body. Therefore, the selection and optimization of grouting materials, the method of after-the-fact grouting reinforcement, the monitoring of tunnel construction, and early risk warning under the conditions of sudden water source or similar to Zhengzhou 7.20 extraordinarily heavy rainfall are still worthy of further research and attention [27].

5. Conclusions

Based on Biot’s theory and seepage theory, this study establishes a fluid–solid coupling model for the sudden inflow of water into a cavern on a shield tunnel foundation. The analysis of the physical and mechanical properties of the surrounding rock and soil around the tunnel, before and after water immersion, yields the following conclusions:
(1)
The sudden flood invasion in tunnels is different from the continuous seepage behavior of rainfall in the upper part. As a seepage source, the sudden water encounter in the tunnel chamber has little effect on the width of the settlement groove due to the structural shape of the tunnel and the infiltration path of the water flow. The deformation of the surrounding rock is primarily transmitted vertically, with horizontal transmission being controllable. Significant settlement deformation persists until drainage is completed.
(2)
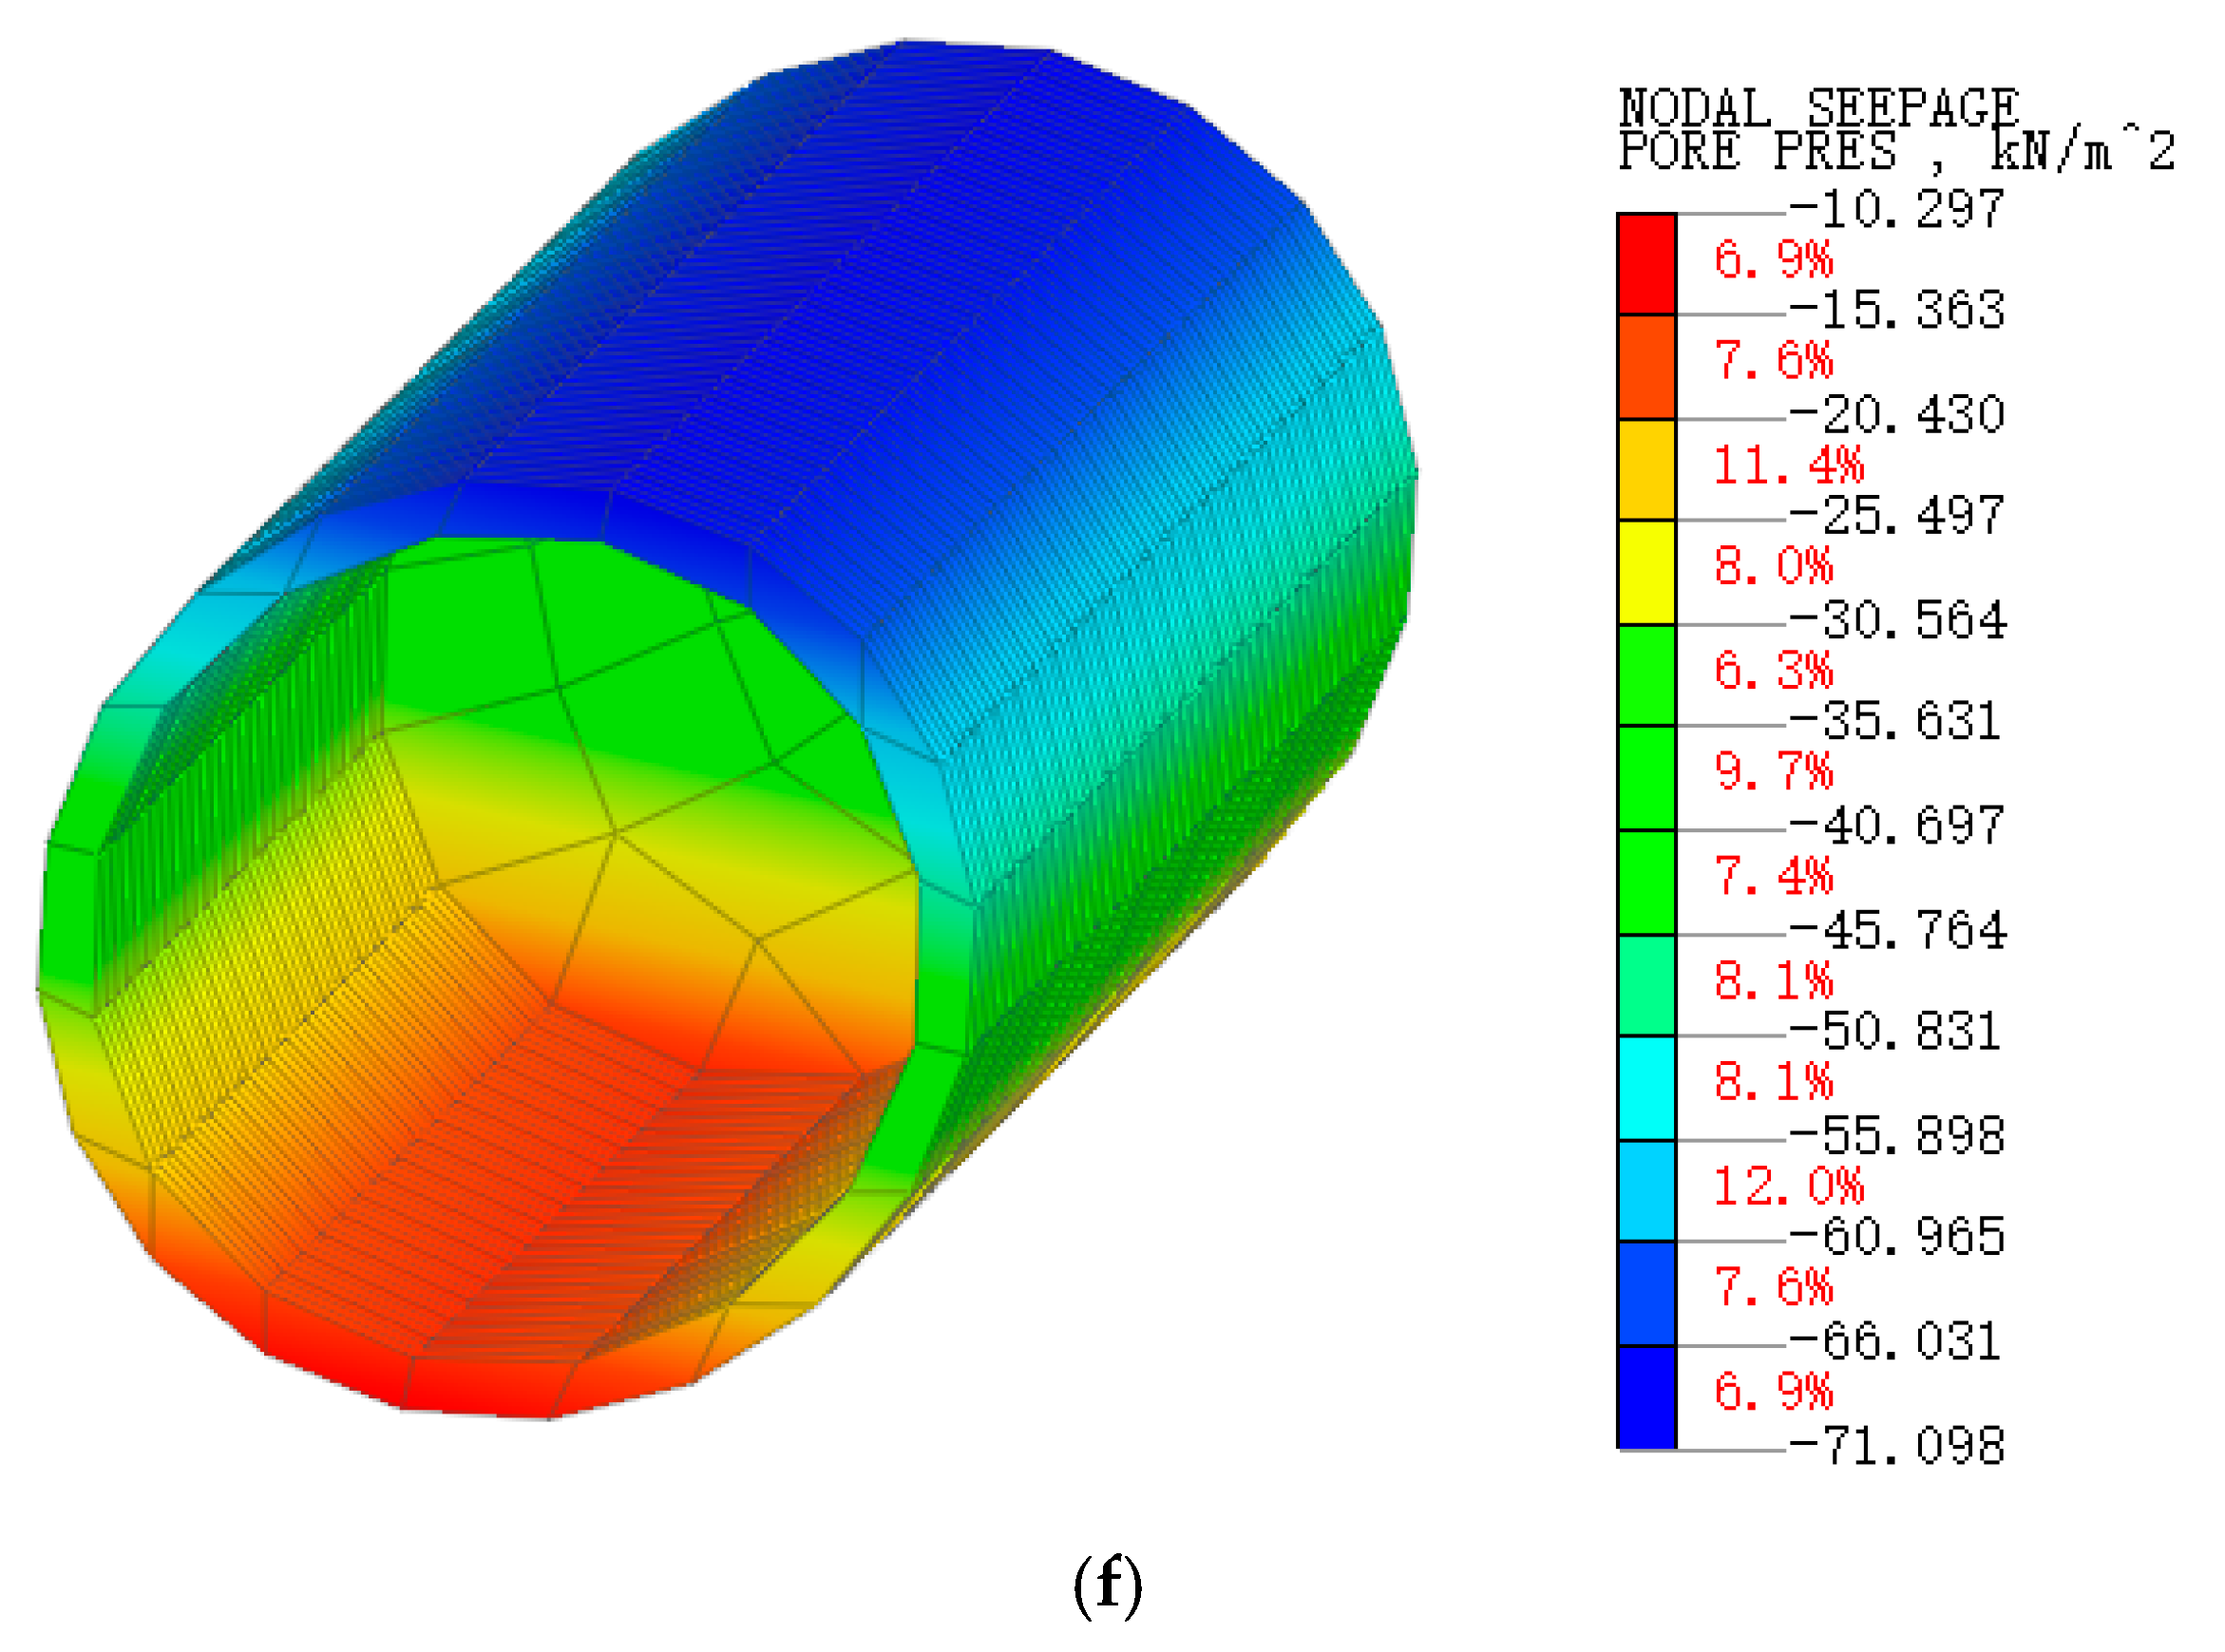
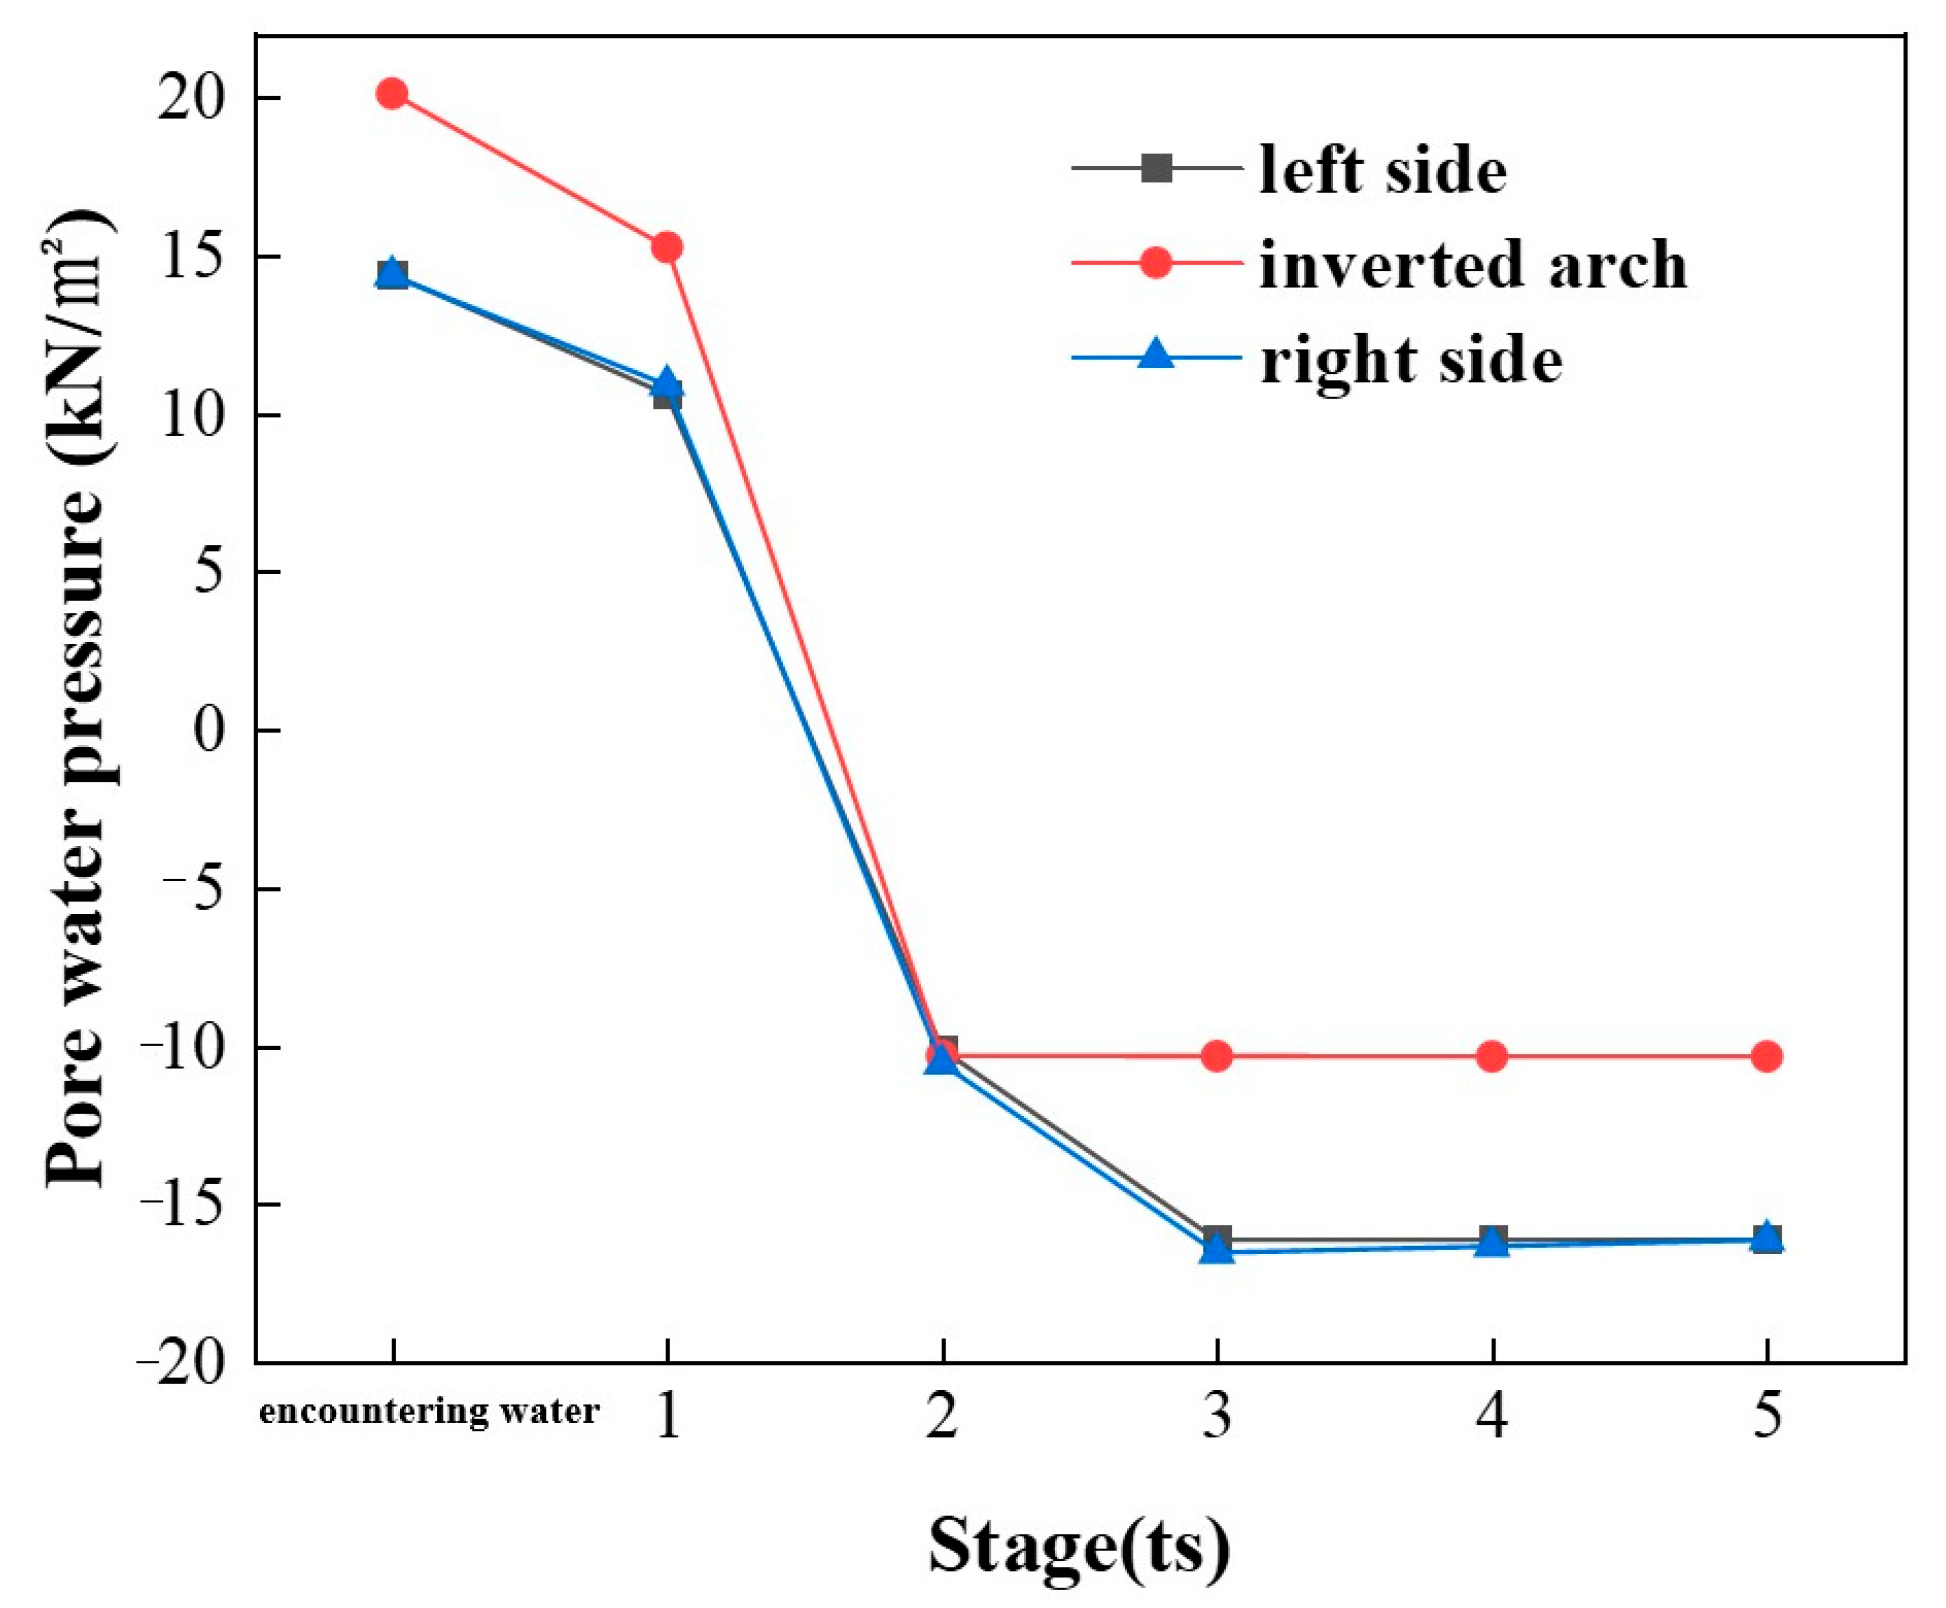
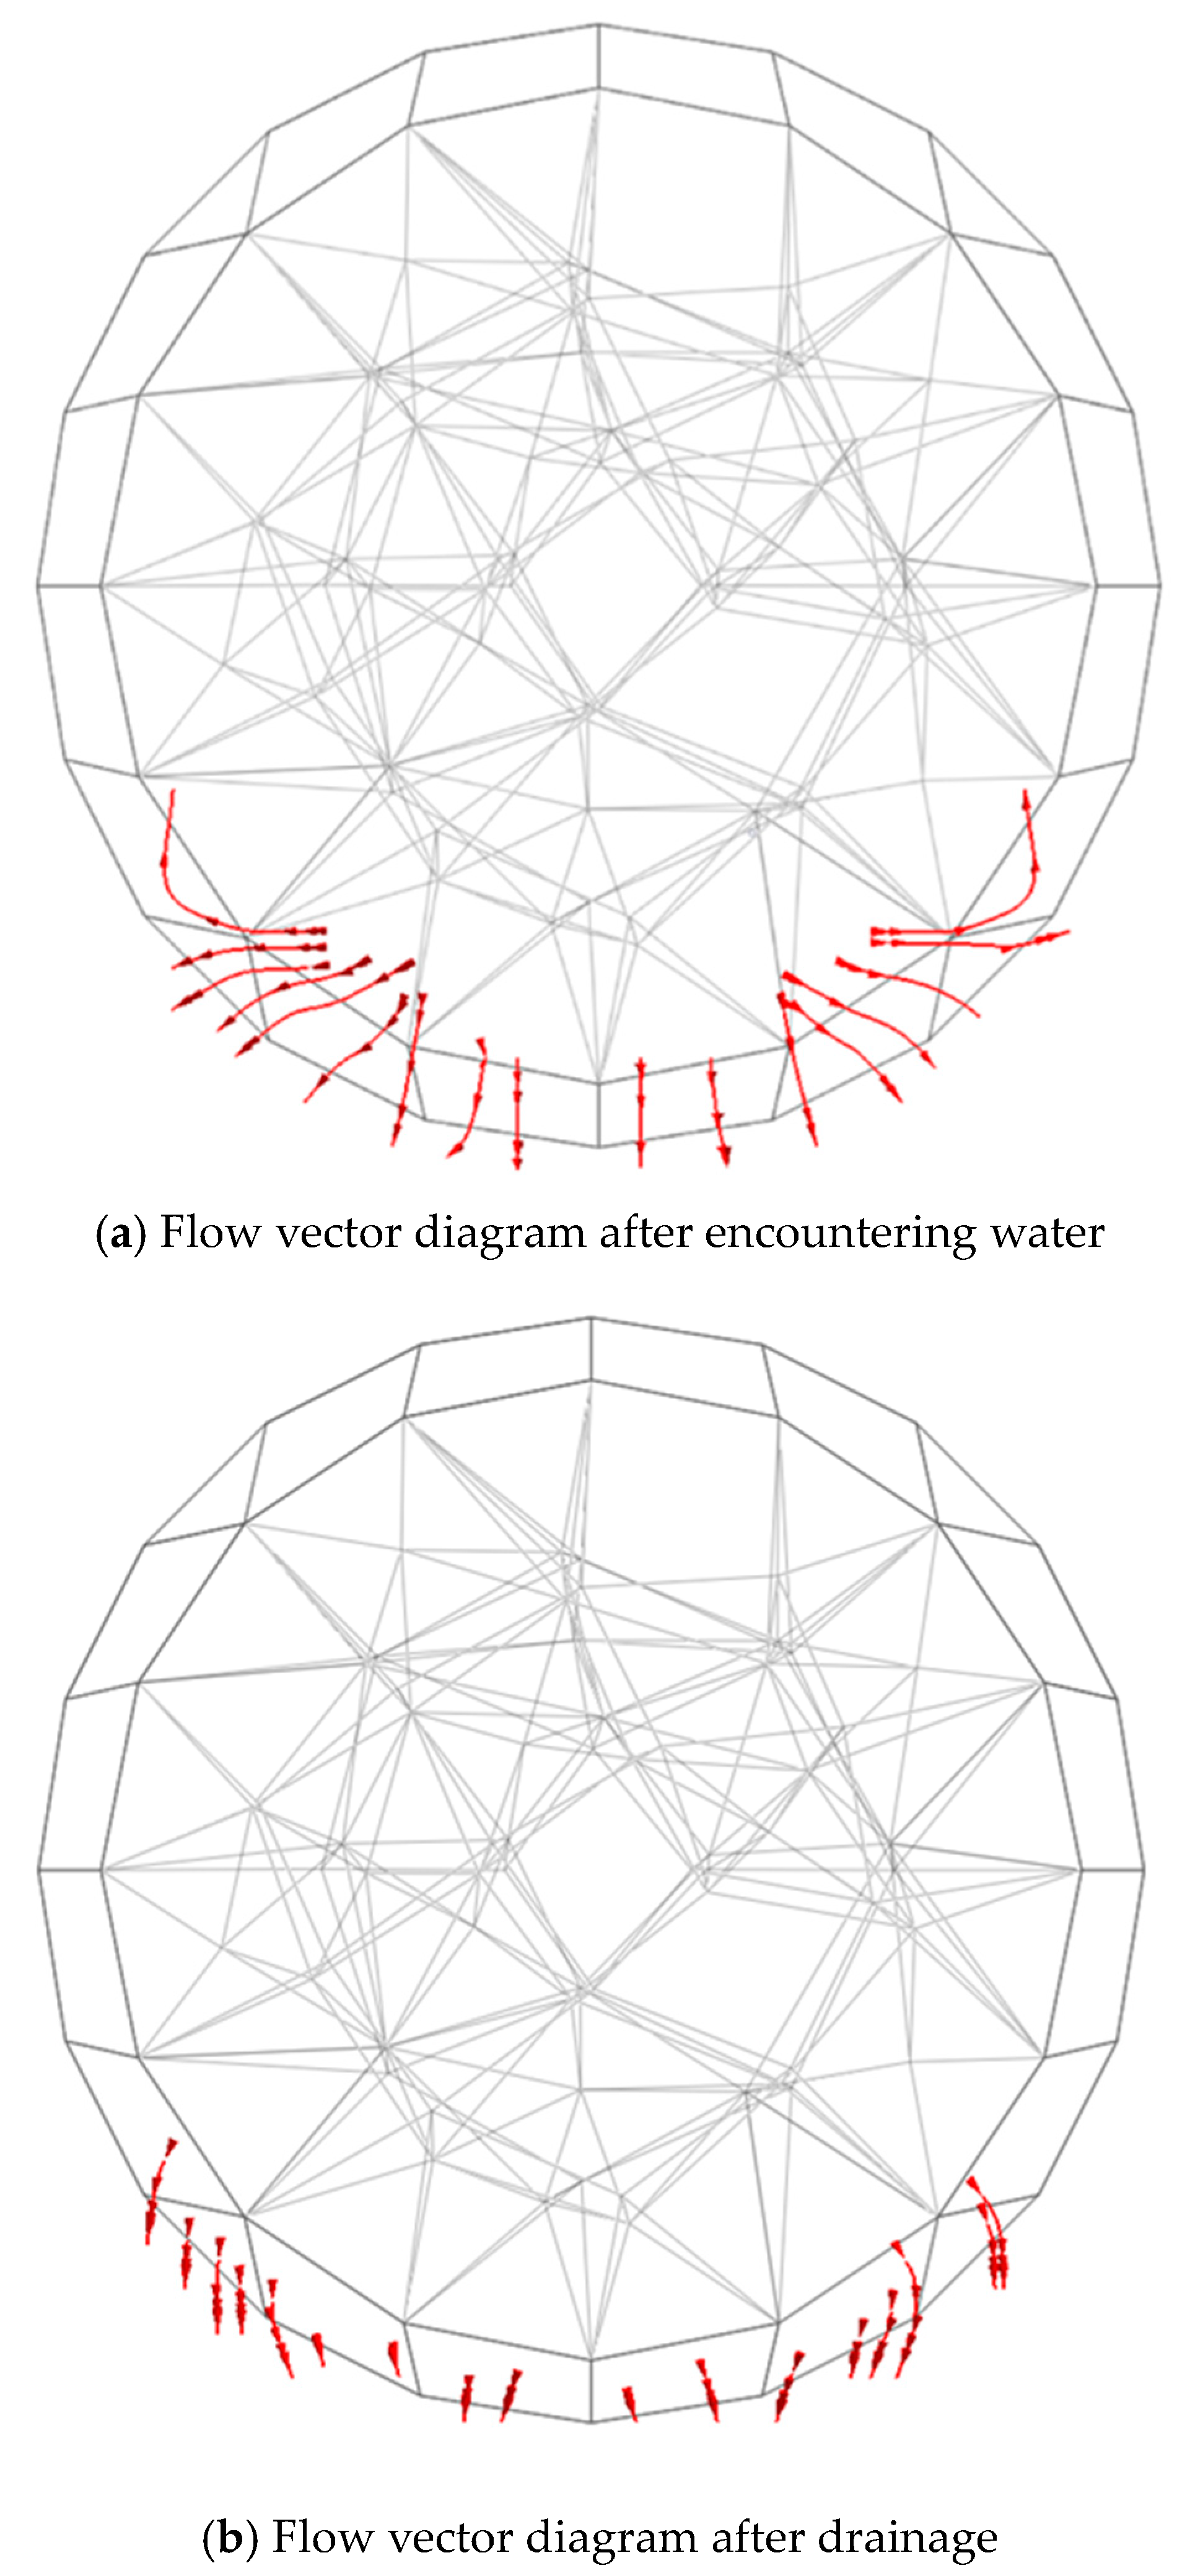
After the accumulation of water in the tunnel, the moisture state and permeability of the soil will rapidly change, and the coupling of soil and water will affect each other, manifested macroscopically as severe surface subsidence. A seepage surface emerges from the water head boundary of the cavern, extending towards the interior of the surrounding rock, where the inverted arch bottom experiences the highest pore pressure. The uppermost soil layer exhibits considerable matric suction. In clay strata characterized by low permeability, the transmission of water pressure displays time-dependent characteristics, resulting in a delay in the dissipation of pore water pressure. As the water level decreases, the flow vectors diminish, and the pore water pressure gradually stabilizes.
(3)
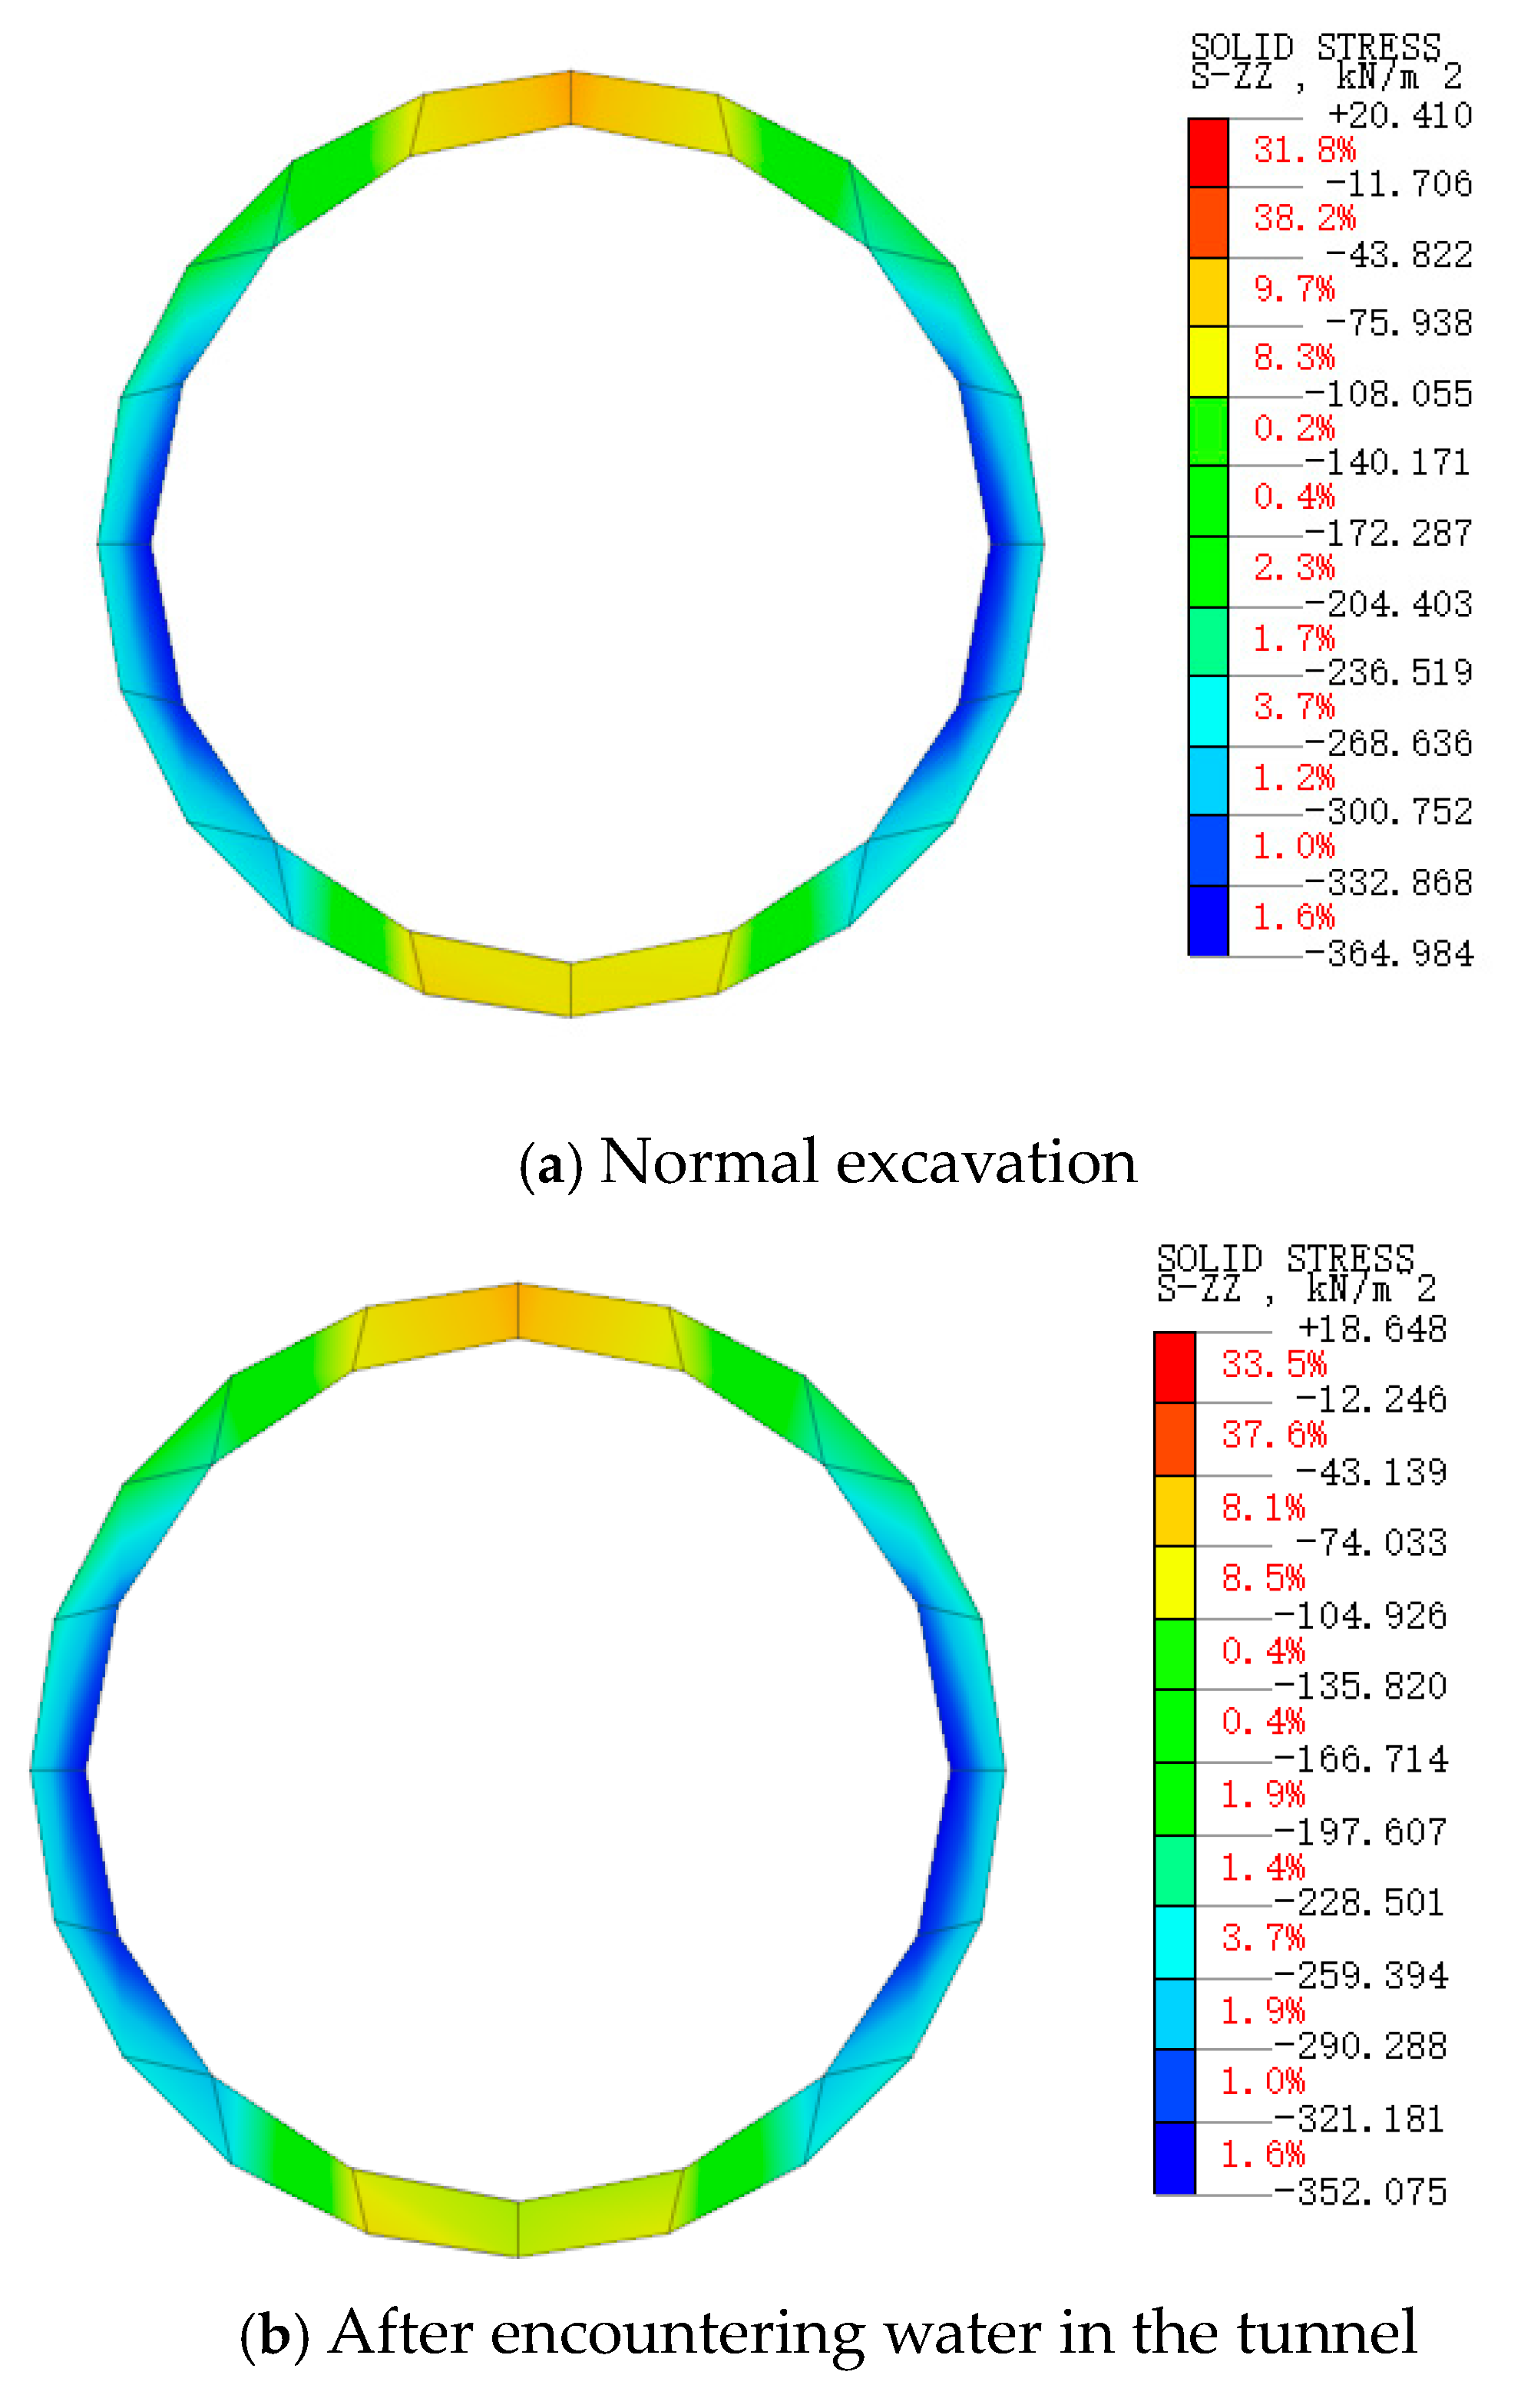
Following immersion, the saturation level of the surrounding rock and soil mass around the tunnel rises, leading to a decrease in stress and bearing capacity. As the water level drops and pore water pressure dissipates, the stress gradually recovers. However, there will still be gradual and slight soil deformation. This study provides valuable insights for the analysis of sudden water encounters in tunnels, seepage analysis originating from caverns, and disaster control measures.

Author Contributions

Conceptualization, J.D. and Y.Z.; methodology, Z.W. (Zhongkai Wang); software, Z.W. (Zhongkai Wang); validation, J.D., Z.W. (Zhongkai Wang) and Z.W. (Zhongnan Wang); formal analysis, Y.Z.; resources, Z.W. (Zhongnan Wang); writing—original draft preparation, Z.W. (Zhongkai Wang); writing—review and editing, J.D. All authors have read and agreed to the published version of the manuscript.

Funding

This research received no external funding.

Data Availability Statement

Data are contained within the article.

Conflicts of Interest

Author Zhongnan Wang was employed by the company China Construction Fifth Engineering Bureau. The remaining authors declare that the research was conducted in the absence of any commercial or financial relationships that could be construed as a potential conflict of interest.

References

  1. Peng, T. Characteristics of Seepage Field in an Underground Engineering Area and Analysis of Water Source of Structural Leakage. J. Acta Geologica Sichuan 2020, 40, 98–102. [Google Scholar]
  2. Lu, C.Y. Study on Failure Behavior of SDDC Artificial Foundation due to Water Permeation. Master’s Thesis, Xi’an University of Architecture and Technology, Xi’an, China, 2019. [Google Scholar]
  3. Wang, X.F.; Wu, J.H.; Wang, Y.L. Test on Soil Deformation Caused by Water Pumping and Artificial Recharge. J. Eng. Geol. 2016, 24, 1161–1167. [Google Scholar]
  4. Zheng, J.J.; Zhao, K. Influence on Stability of Loess Subway Tunnel in Flooded Surrounding Rock. J. China Railw. Soc. 2011, 33, 91–95. [Google Scholar]
  5. Wang, Y.; Zheng, S.; Li, Y.; Wang, Y.; Huang, Y. The failure characteristics around shallow buried tunnels under rainfall conditions. Geomat. Nat. Hazards Risk 2021, 12, 363–380. [Google Scholar] [CrossRef]
  6. Tao, D. Study on the Mechanical Behavior of Construction of Shallow Shield Tunnel and Influence of Local Groundwater Immesion. Master’s Thesis, Anhui Jianzhu University, Hefei, China, 2021. [Google Scholar]
  7. Liu, Y.; Chen, H.; Zhang, L.; Wang, X. Risk prediction and diagnosis of water seepage in operational shield tunnels based on random forest. J. Civ. Eng. Manag. 2021, 27, 539–552. [Google Scholar] [CrossRef]
  8. Yan, Q.; Li, Y.; Yuan, Y. Research on the Evolution Mechanism of Large Deformation of Expansive Loess Tunnel under Rainfall. J. Math. Probl. Eng. 2022, 2022, 9930738. [Google Scholar] [CrossRef]
  9. Bezuijen, A. Keynote Lecture: Soil-water-tunnel interaction at the front face of a TBM. In Geotechnics for Sustainable Infrastructure Development; Springer: Singapore, 2020; pp. 207–220. [Google Scholar]
  10. Kavvadas, M.; Litsas, D.; Vazaios, I.; Fortsakis, P. Development of a 3D finite element model for shield EPB tunnelling. Tunn. Undergr. Space Technol. 2017, 65, 22–34. [Google Scholar] [CrossRef]
  11. Xie, W. Impact analysis of rainfall infiltration on the deformation mechanism and stability of roadbed slope. J. Xi’an Univ. Archit. Technol. 2020, 52, 470–477. [Google Scholar]
  12. Guo, Z.S. A Thesis Submitted in Partial Fulfilment of the Requirements for the Degree of Master of Engineering. Master’s Thesis, Huazhong University of Science and Technology, Wuhan, China, 2016. [Google Scholar]
  13. Zhang, Z.; Huang, M.; Pan, Y.; Li, Z.; Ma, S.; Zhang, Y. Time-dependent analyses for ground movement and stress field induced by tunnelling considering rainfall infiltration mechanics. J. Tunn. Undergr. Space Technol. 2022, 122, 104378. [Google Scholar] [CrossRef]
  14. Zhao, Y.; Meng, R.; Wei, H.; Qing, Y. Analysis of tunnel collapse mechanism and grouting reinforcement measures under the unsaturated seepage effect. J. Chin. Harb. Eng. 2022, 42, 11–15. [Google Scholar] [CrossRef]
  15. Li, H.; He, Y.; Fan, G.; Li, T.; Pastor, M. Recent developments of generalized plasticity models for saturated and unsaturated soils. J. Water Sci. Eng. 2011, 4, 329–344. [Google Scholar]
  16. Luo, Z.; Zeng, F. Finite element numerical simulation of land subsidence and groundwater exploitation based on visco-elasticplastic Biot’s consolidation theory. J. Hydrodyn. 2011, 23, 615–624. [Google Scholar] [CrossRef]
  17. Wang, Z.N. Stress-Strain Characteristics and Settlement control of soil During Tunnel Excavation Reinforced by Clay Shock Method. Master’s Thesis, North China University of Water Resources and Electric Power, Zhengzhou, China, 2022. [Google Scholar]
  18. Liu, H.R. Study on the Influence Applied to Surrounding Environment Induced by the Shield Construction of Zhengzhou Metro. Master’s Thesis, Henan University of Technology, Zhengzhou, China, 2016. [Google Scholar]
  19. Wang, B.G.; Bi, Y.T.; Tan, X.J.; Zhu, P.J.; Hou, R.B. Numerical and experimental analysis of shield tunnels with super-close oblique crossing over existing tunnel. J. Geotech. Investig. Surv. 2023, 51, 1–7+20. [Google Scholar]
  20. Du, M.F.; Man, J.Q.; Yi, L.B.; Zhu, D.D. Study on the Impact of Underpass Construction at Different Diagonal Intersection Angles in a Shield Tunnel Section of Zhengzhou Metro on Railways. J. Mod. Tunn. Technol. 2020, 57, 466–472. [Google Scholar] [CrossRef]
  21. Yu, L.P. Analysis of Soil’s Elastic Modulus Values Based on FLAC3D Simulation. J. Water Resour. Archit. Eng. 2010, 66, 135–136. [Google Scholar]
  22. Song, J.; Miao, L.; Dai, S.; Ma, Y. 3D coupled mechanical and hydraulic analysis of pore water pressure disturbed by shield tunnelling. Chin. J. Geotech. Eng. 2013, 35, 302–312. [Google Scholar]
  23. Zhou, J.; Shi, D.D.; Jia, M.C.; Cui, J.H. In-situ test study on low-energy dynamic consolidation method to improve a silty clay ground. Rock Soil Mech. 2007, 28, 2359–2364. [Google Scholar] [CrossRef]
  24. Fredlund, D.G.; Morgenstern, N.R.; Widger, R.A. The shear strength of unsaturated soils. Can. Geotech. J. 1978, 15, 313–321. [Google Scholar] [CrossRef]
  25. Liu, W.; Liang, J.; Xu, T. Tunnelling-induced ground deformation subjected to the behavior of tail grouting materials. Tunn. Undergr. Space Technol. 2023, 140, 105253. [Google Scholar] [CrossRef]
  26. Liang, J.; Liu, W.; Yin, X.; Li, W.; Yang, Z.; Yang, J. Experimental study on the performance of shield tunnel tail grout in ground. Undergr. Space 2025, 20, 277–292. [Google Scholar] [CrossRef]
  27. Dong, W.; Huang, H.; Zhong, M.; Wang, H.; Hua, F. Monitoring and early warning mechanism of flood invasion into subway tunnels based on the experimental study of flooding patterns. J. Intell. Constr. 2024, 22, 9180011. [Google Scholar] [CrossRef]
Figure 1. Subway line interval map.
Water 16 03479 g001
Figure 2. Diagram of tunnel encountering water.
Water 16 03479 g002
Figure 3. Geological cross-section of the starting point.
Water 16 03479 g003
Figure 4. Model grid division diagram.
Water 16 03479 g004
Figure 5. Layout of monitoring points.
Water 16 03479 g005
Figure 6. Comparison of surface subsidence between monitoring values and simulated values.
Water 16 03479 g006
Figure 7. Surface subsidence curve.
Water 16 03479 g007
Figure 8. Vertical displacement cloud map of the monitoring section.
Water 16 03479 g008
Figure 9. Changes in pore water pressure of caverns and surrounding rocks. (a) Diagram of pore pressure after immersion of cavern and surrounding rock in water. (b) A 1 ts pore pressure cloud diagram. (c) A 2 ts pore pressure cloud diagram. (d) A 3 ts pore pressure cloud diagram. (e) A 4 ts pore pressure cloud diagram. (f) A 5 ts pore pressure cloud diagram.
Water 16 03479 g009aWater 16 03479 g009bWater 16 03479 g009c
Figure 10. Trend of pore water pressure changes at certain points.
Water 16 03479 g010
Figure 11. Flow path diagram.
Water 16 03479 g011
Figure 12. Periodic stress variation diagram.
Water 16 03479 g012aWater 16 03479 g012b
Table 1. Examples of subway tunnel water accidents.
YearWater-Related Accident CasesConsequences
2024Water and Sand Inrush in Xi’an Metro Line 8Road subsidence, followed by collapse.
2024Water and Sand Inrush at the Construction Site of Wuhan Metro Line 12Large-scale road settlement caused the suspension of the Xiao-Wu Intercity Railway.
2019Water Inrush in Kolkata Metro, IndiaSurrounding buildings were severely damaged or collapsed, threatening the lives and property of residents.
2017Groundwater Inrush into Tunnel in Seoul, South KoreaSevere water accumulation inside the tunnel caused ground settlement and collapse.
Table 2. Soil layer parameters.
Soil LayerE/kPaMoisture Content/%Poisson’s Ratio vγ/(kN·m−3)C
/kPa
φ /(°)Initial Pore Ratio
Miscellaneous fill31,50021.00.2718.64.010.00.610
sandy soil31,20017.80.2820.114.921.30.618
sandy soil31,50018.50.3019.416.024.00.617
silty clay32,10020.60.2819.320.016.00.658
clayey silt31,80019.30.2919.317.023.00.634
silty clay32,40021.00.3219.422.016.00.668
silty clay32,70021.30.3019.523.015.80.672
sandy soil32,40021.80.3019.426.016.10.671
Disclaimer/Publisher’s Note: The statements, opinions and data contained in all publications are solely those of the individual author(s) and contributor(s) and not of MDPI and/or the editor(s). MDPI and/or the editor(s) disclaim responsibility for any injury to people or property resulting from any ideas, methods, instructions or products referred to in the content.

