Article

Assessing Non-Point Source Pollution in a Rapidly Urbanizing Sub-Basin to Support Intervention Planning

by
Endaweke Assegide
1,2,3,*,
Tena Alamirew
1,3,
Greg O’Donnell
4,
Bitew K. Dessie
3,
Claire L. Walsh
4 and
Gete Zeleke
3
1
Ethiopian Institute of Water Resource, Addis Ababa University, Addis Ababa P.O. Box 150461, Ethiopia
2
School of Architecture and Civil Engineering, Adama Science and Technology University, Adama P.O. Box 1888, Ethiopia
3
Water and Land Resource Center, Addis Ababa P.O. Box 3880, Ethiopia
4
School of Engineering, Newcastle University, Newcastle upon Tyne NE1 7RU, UK
*
Author to whom correspondence should be addressed.
Water 2024, 16(23), 3447; https://doi.org/10.3390/w16233447
Submission received: 19 August 2024 / Revised: 28 October 2024 / Accepted: 30 October 2024 / Published: 29 November 2024
(This article belongs to the Section Urban Water Management)

Abstract

:
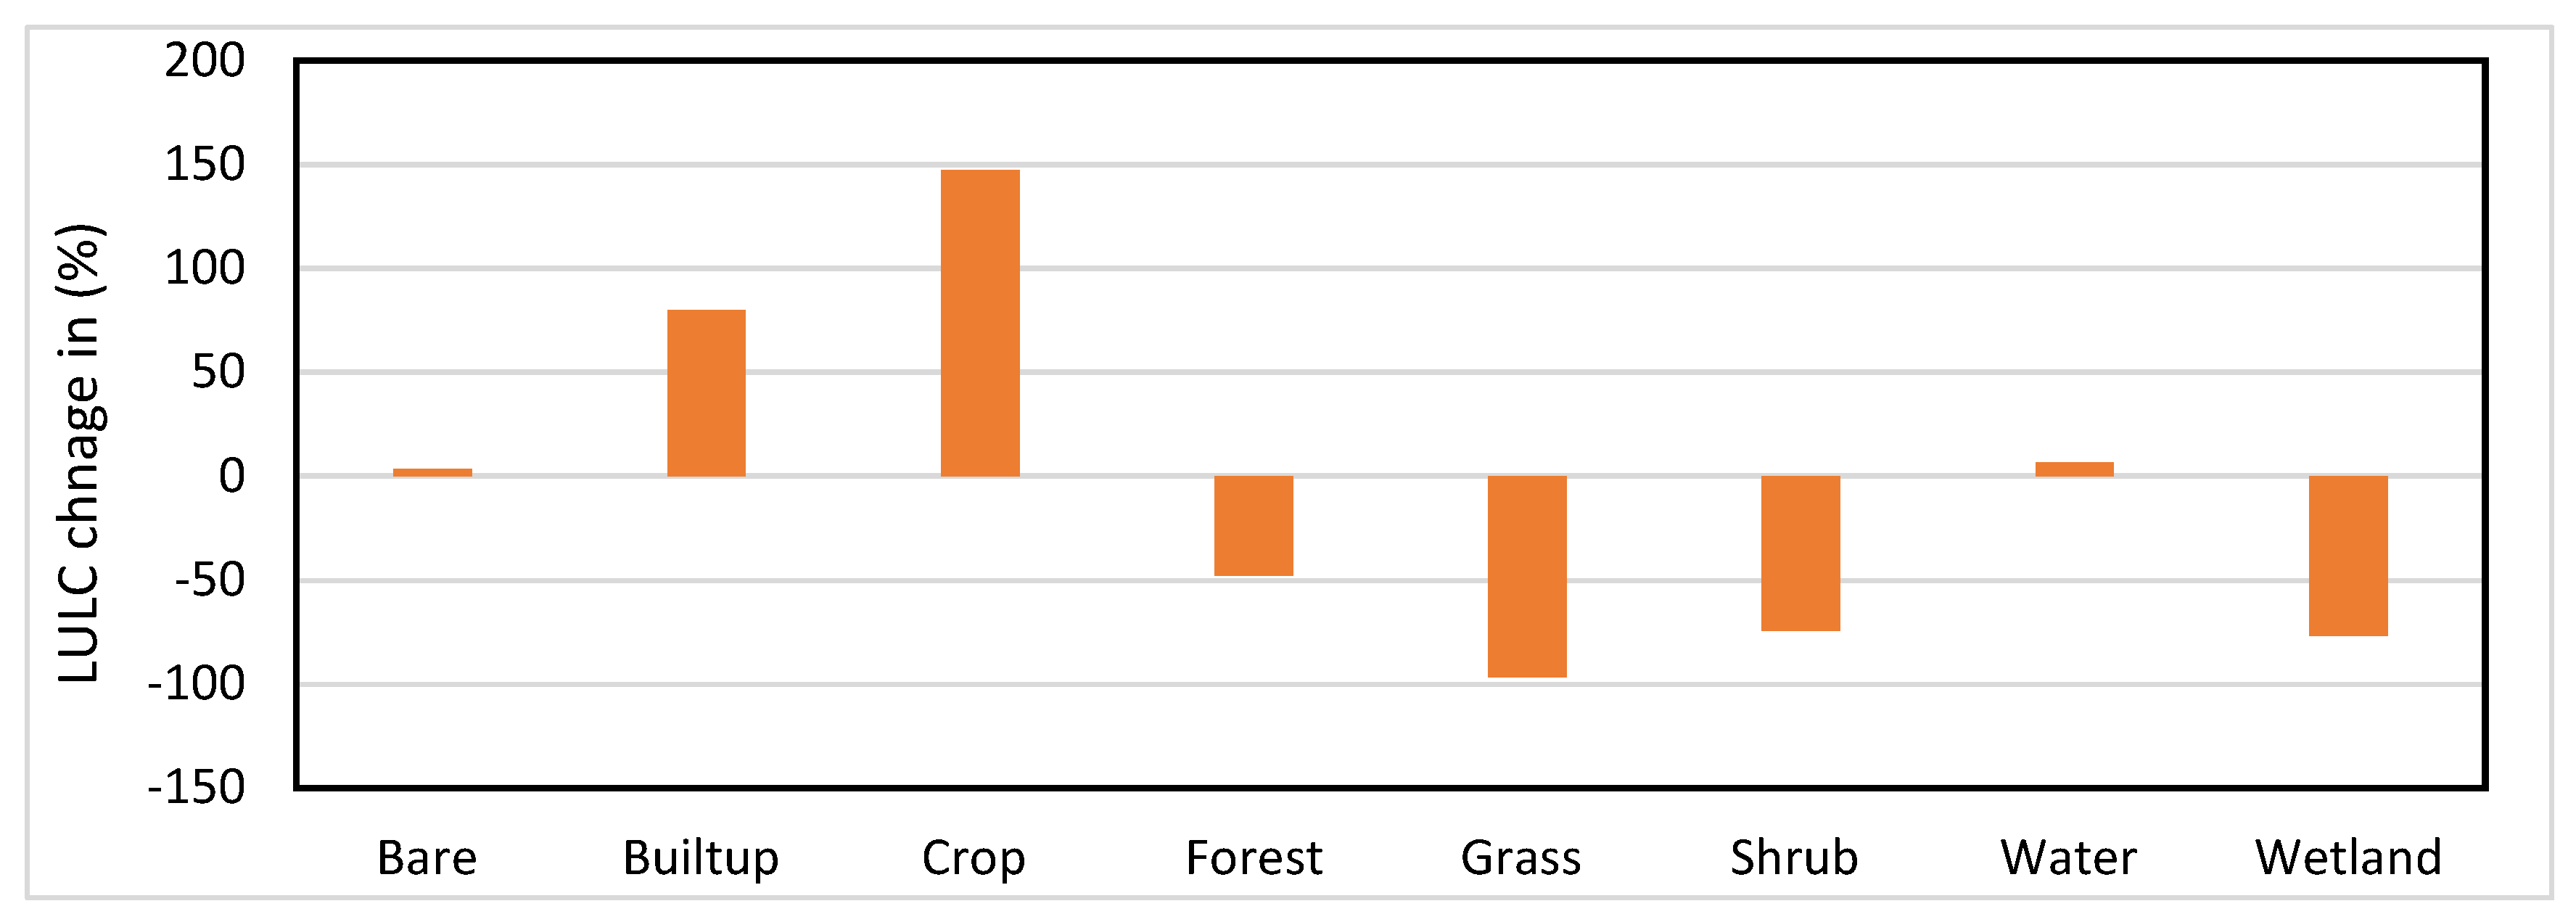
Non-point sources of pollution (NPSPs) originating from runoff from contaminated agricultural and populated areas are becoming a growing concern in developing countries, endangering the environment and public health. This requires systematic investigation, including modelling the likely impact using an appropriate hydrological model. This study quantified the spatiotemporal variation of the NPSP and prioritised the most vulnerable sub-watersheds for intervention planning. We investigated the effects of land use and cover (LULC) conversion on runoff generation and NPSP loads in terms of sediment, phosphate, total nitrogen, total phosphorus, and nitrate loading using the SWAT model. The principal source of data utilised to assess the change in NPSP loads was the 2003 and 2023 LULC. The analysis of the results showed that grassland and shrubland substantially changed, with 96.7% and 74.4% reductions, respectively, while the increase in agricultural land was 147.3% and that of built-up areas increased by 80.14%. The mean yearly increase in sediment yield ranges from 25.46 to 27,298.75 t, while the mean yearly increase in surface runoff ranges from 183.1 mm to 487.9 mm. The minimum recorded runoff was 10.69 mm (5.1%) in WS03, while the highest was 123.3 mm (66.5%) in WS02. The NO3 load increased from 127.6 to 20,739.7 kg, and the PO43− load increased from 3.12 to 2459.7 kg. The TN load increased from 4465.5 to 482,014.5 kg, and the TP load increased from 1383.5 to 133,641.3 kg. The monthly analysis of nitrate loading revealed that the “Belg” season has the highest nitrate load than the rainy season, probably due to nitrification. The findings clearly showed that the inputs applied to the farms were not effectively utilised for the intended purpose. Hence, efforts must be made to ensure that nutrients remain in the catchment through an appropriate land management intervention.

1. Introduction

For aquatic ecosystems and related functions, clean water availability and quality are critical [1]. Throughout human history, rivers have been of utmost importance. They are essential in providing the water needed for many industries, including the agricultural sector and human consumption; water is considered an important socioeconomic artery of society [2]. River water is a fundamental natural resource, important to many human endeavours, and is at the heart of modern society’s environmental problems. Rivers and lakes are known to be more vulnerable due to contamination. To safeguard these resources, it is crucial to identify the source of pollutants and implement effective methods for their prevention or elimination. Some activities relating to human activities degrade the quality of surface waters and impair their use for households, farming, productive enterprises, and other purposes [3]. The release of diffuse sources of pollutants has a major impact on the river water quality of the river system. The interplay of watershed characteristics, hydrological processes, and agricultural practices ultimately influences the loss of nutrients to surface waterways [4]. Controlling non-point source contamination is challenging because many different factors cause it. The most polluted surface waters are typically caused by diffuse sources of pollutants, which usually consist of other forms of phosphorus and nitrogen [5].
Numerous studies have demonstrated that surface and groundwater contamination may be significantly worsened by natural processes controlled by river flow, including salt, erosion, and releases of nitrogen and phosphorus [6]. During the rainy season, surface runoff collects contaminants that pollute and alter surface water’s biophysical and sometimes chemical characteristics [7]. When contaminants from identifiable sources find their way into rivers, they are quickly identified and provided with the proper care. However, diffuse source contamination occurs when contaminants from the soil, farming lands, slums, and polluted lands [8] enter water bodies because of scouring and leaching from rainfall-runoff occurrences [9]. According to Assegide et al. [10], diffuse source contamination studies in Ethiopia are limited. There has not been much research using the proof to determine how agriculture affects water quality. One of the main study gaps in the country in general and in the basin in specific is determining the relative contributions from diffuse and point sources. There has not been much research using evidence to determine how agriculture affects the quality of surface waters. Additionally, one of the main causes of Ethiopia’s recent increases in water sedimentation and problems with water quality is the country’s rapidly disappearing ecosystems and changing land use as a result of intensifying agriculture. Nevertheless, no study has measured how much the LULC variation affects the NPSP load [11].
Ethiopia’s recent rise in the deposition of soil and water pollution problems is mainly driven by agricultural intensification, which is causing the swift destruction of ecosystems and land-use dynamics [11]. The increase in the use of pesticides and fertilisers to improve crop production is the primary cause of contamination [12]. The average annual use of fertiliser in Ethiopia has been reported to have increased from 250 million kg in 2003/4 to about 850 million kg. in 2015/6 [13], about a 3.4-fold increase in less than 10 years. Diffuse contaminants pose a significant threat to water quality and pose an uncontrollable water pollution issue [14]. Varying temporal and spatial contaminant loads, intricate systems, and random as well as uneven events are characteristics of NPS [15].
As Sebilo stated [16], “the soil organic matter pool and soil microbial biomass” absorb the leftover nitrogen fertiliser in cropland; of the fertiliser, 40–60% is absorbed by the crops and eliminated before harvesting [16]. Jenkinson [17] reports that 71% of all N input fertiliser and non-fertiliser is harvested annually, while the soil–plant system loses 29%. In the context of the study area, cereal nitrogen uptake is typically low; about thirty to forty percent of the N fertilisers used are harvested. The remaining nitrogen applied is lost through absorption and washed into the soil, where the frequent over-application of nitrogen can pollute natural ecosystems. Additionally, high N fertiliser costs lead to significant direct economic losses for growers due to the loss of N [18]. Nitrate is removed from soil layers by irrigation and rain. Consequently, the weather, soil structure, and texture affect its prevalence in the soil. In sandy soils, it might be higher than in clay soils. According to Giordano [19], some irrigated vegetables, such as lettuce plants, only absorbed 38.4% of the 150 kg/ha of nitrogen applied; the remaining 61.6% remained in the soil. It is more detrimental when vegetable-growing areas are located near waterways.
Complex and unpredictable diffuse source pollutants are very challenging to model due to their restricted capacity. However, due to the need for massive amounts of input data, modelling becomes prohibitively expensive, and calibration becomes very challenging; as a result, the usage of the physically based model is limited [9]. The compiled monitoring data merely show the output and do not go into detail about the reasons behind the alterations, so they fail to clarify the processes in and of themselves. Hence, SWAT can provide a full description of watershed processes through simulations, convert input data into output indications, and determine the quantity and quality of water [20].
Understanding the degree of geographical variation in erosion and related causes can be aided by describing the main methods for assessing soil erosion and the corresponding erosion rates. On cultivated LULC, average erosion rates are estimated to be between 50 and 179 t/ha/year [21]. In the Ethiopian highlands, extreme cases can result in soil loss of up to 300 t/ha [22]. According to Tamene [23], Ethiopia’s rate of yearly soil loss varies from 0 to 220 t/ha. Ethiopia loses 1.5 billion tonnes of topsoil annually [24], with an average sediment production of 21.43 tonnes/ha/year in the middle and upper Awash [25].
The hydrodynamic properties of the water largely determine the spatiotemporal variation in water quality that various types of lakes and rivers exhibit [26]. To address the environmental problems of the current land administration, decision-makers should use modelling techniques on a sub-catchment basis to evaluate the potential implementation of top management techniques and alternative scenarios [1]. The primary goal of the current investigation is to examine changes in LULC and their effects on runoff and non-point source pollutant loads (sediment, total nitrogen, total phosphorus, and nitrate). Further, it has also attempted to quantify spatiotemporal diffuse source pollutants and map the sub-watersheds according to pollutant loads.

2. Study Area

The western edge of the main Ethiopian Rift is where the upper Awash basin (upstream of Koka Reservoir) is situated in central Ethiopia, between 8°23′09″ and 9°18′14″ latitude and 37°57′15″ and 38°41′08″ longitude. The climate is considered humid to sub-humid in the highlands and semiarid in the lowlands, with an average yearly temperature range of 15 to 20 °C. An average annual precipitation, strongly controlled by elevation, varies from 800 to 1400 mm. In Ethiopia, the primary wet period, Kiremt, typically lasts from June to September. It is followed by “Belg”, which occurs from March to May [27]. At least 15.7 million people, or almost 17% of Ethiopia’s total population, live in the upper Awash basin (UAB), which also contains Addis Ababa, the country’s capital [28] (see Figure 1). This has put pressure on the catchment of resources related to land and water [29].

3. Data and Methods

3.1. SWAT Model

Arnold (1998) created the physically grounded, geographically semi-distributed SWAT watershed model [30]. It operates continuously and facilitates the modelling of physical processes inside a watershed. SWAT simulates and predicts runoff, sediment load, and use of agricultural chemicals for big and intricate watersheds using different soil and LULC overextended times [31]. The hydrological and pollutant processes of precipitation, streamflow, sediments, and loads of phosphorus and nitrogen are all simulated by SWAT [32]. Each hydrological response unit’s (HRU) hydrological components are computed using water balance, which also provides the main streamflow and hydrological balance. In the model, the hydrology is separated into two stages: the land phase regulates water flow to the main channel, while the routing phase governs water movement within the network of channels [20].
Equation (1) for water balance provides the foundation for the hydrological cycle in the land phase of the SWAT simulation [33]:
S W t = S W o + i = 1 t R d a y Q s u r f E a W s e e p Q g w
As mentioned by Tessema [33], “SWt is the final soil water content (mm), SWo is the initial soil water content on day i (mm), t is the time (days), Rday is the amount of precipitation on day i (mm), Qsurf is the amount of surface runoff on day i (mm), Ea is the amount of evapotranspiration on day i (mm), wseep is the amount of water entering the vadose zone from the soil profile on day i (mm), Qgw is the amount of return flow on day i (mm)”.
The model offers two approaches to surface runoff computation: as Alves stated, the “Soil Conservation Service (SCS) curve number (CN)” method [30] and the “Green & Ampt infiltration” method [31]. Since the second approach needs sub-daily precipitation data, the SCS CN technique was applied in this investigation. The CN is a comparison parameter between 0 and 100. For a specific landscape status, it depicts the soil, LULC, and antecedent soil moisture conditions. Based on mean “antecedent soil moisture conditions” (CN2), the typical SWAT technique employs CNs for different soils and land cover situations. Two distinct approaches to computing the retention parameter are incorporated into the model. Field capacity, wilting point, and saturation water content are indicators of the amount of water in the soil horizon, and these can be used to adjust the retaining parameter as part of the initial procedure. As with the other approach, the retention parameter can be allowed to alter in line with the total plant evapotranspiration, which determines the daily curve number mainly depending on the previous climate. This study used the latter approach [33].
Potential evapotranspiration (PET) can be estimated using three methods: Hargreaves, Priestley–Taylor, and Penman–Monteith, which require air temperature, solar radiation, relative humidity, and wind speed [7,34,35]. The Penman–Monteith and variable storage [36] coefficient methods were used to estimate runoff and ET, respectively.
Because the curve number approach was applied, the difference between runoff and precipitation is used to determine how much water passes through the soil horizon. Modelling the infiltration rate in fewer time steps is problematic because of the daily timeframe of the rainfall data. Kinematic storage models compute lateral subsurface flow from a saturated area of soil horizons, contributing to streamflow, but base flow, part of streamflow, has its origin from recharged shallow aquifers through percolation. Water that enters the shallow aquifer is considered removed from the system; in SWAT, base flow is only allowed to enter the reach if the volume of water stored in the shallow aquifer surpasses the minimum limit the user has selected. The Manning equation defines the flow’s velocity and rate [33].

3.2. Model Setup

The model configuration was carried out utilising ArcSWAT version 10.21.10_5.24, released on 19 August 2020, an ArcGIS extension of a menu-driven interface for SWAT. Using the 30 m DEM, the watershed was first defined, then split into 37 sub-watersheds, and the drainage patterns were examined. Using the limit area choice to define a sub-watershed’s minimum area, the stream definition was created, which was 8000 ha. At the moment, two sub-catchment pour points were manually created: one station for the calibration and validation of flow and sediment data and another for the validation of flow and sediment data as well as calibration and validation of nutrients to confirm being similar to monitored and modelled data. Second, HRUs were defined using LULC, soil, and slope datasets, with multiple HRUs defined using a 20-10-20 [37] threshold for optimal criteria in each sub-watershed. Third, to simulate soil, weather, plant cover, management operations, and urban activities, meteorological data were inserted to build data tables, and a built-in database was needed for model setup. In addition to this, the amount at which fertilisers are applied was updated by editing a default input table for plant growth. Finally, to conduct the SWAT modelling procedure, dates ranging from January 1979 to December 2019 were set up; see Table 1 for the input data. For every sub-watershed, the SWAT auto-irrigation choice was implemented.

3.3. Data Collection and Processing

Monthly sediment from 1992 to 2018 was calculated using sediment data from two chosen surface-water observation points in the upper Awash River Basin (Hombole and Melka Kunture gauging stations). LOADEST can be a useful tool for estimating loads and filling in those gaps and missing data [38]. Using the Load Estimator (LOADEST) tool, data gaps or missing data were filled using regression techniques describing the data on stream flow and suspended material gathered at the chosen observation points [39], as revealed in Figure 2. LOADEST aids in the creation of regression models that estimate nutrient loads over a user-defined time interval. It is used to generate the continuous time series of each constituent load. These models are based on streamflow, time, and additional user-specified variables [40,41]. Regression techniques are statistical methods used to model the relationship between a dependent variable and one or more independent variables. Among the statistical techniques in the LOADEST, simple linear regression was used to estimate sediment based on the observed data; this could be used to relate the dependent variable (sediment concentrations) and the independent variable (flow rates) [42]. In SWAT modelling, LOADEST has been widely used to estimate monthly or annual loads and to create continuous data from discrete data [41,43,44].

3.4. LULC Mapping and LULC Change Analysis

Utilising the supervised classification approach, LULC variations were mapped. Sentinel 2A image bands with 10 m spatial resolution satellite imagery were the primary source for layer stacking and image sub-setting using the study area boundary. Second, before image classification, the LULC categories were determined by field observation experiences, previous knowledge, and visual inspection of the image and the Google Earth images. Subsequently, representative training areas for every LULC category were chosen from uniform pixels in the satellite image. Lastly, their areas were determined, and the maximum probability classification was applied using the area of interest. The LULC change in the study region was analysed using the LULC data from 2003 and 2023 as input for the change detection analysis. A Sankey diagram is a visualisation used to depict the change from the 2003 set of values to 2023.

3.5. Calibration, Parameterisation, and Uncertainty Analysis

SWAT-CUP is a freeware package developed by Abbaspour [45] that allows applying distinct methods to improve the SWAT model. Additionally, the SWAT-CUP software version 5.1.6 allows for uncertainty and sensitivity analysis of various hydrological parameters [46,47]. As stated by [38,40,46,47,48,49,50], “the optimizing algorithms include Generalized Likelihood Uncertainty Estimation (GLUE), Parameter Solution (PararSol), Markov Chain Monte Carlo (MCMC), and Sequential Uncertainty Fitting version 2 (SUFI2)”. The computational speed of the SUFI2 algorithm is very high, and previous studies have found it to be better than the other algorithms in determining uncertainty [50,51,52,53,54]. In this study, the SUFI-2 algorithm was utilised to assess the sensitivity of the model inputs [48] before calibration.

3.5.1. Sensitivity Analysis

Finding the important parameters that influence model performance during calibration is the primary goal of the sensitivity analysis [49]. By measuring how quickly model outputs alter in response to given modifications in the parameters of the model, sensitivity analysis aids in observing the parameters that are most sensitive and, consequently, the driving watershed processes [50]. Equation (2) represents the multiple regression used in SUFI2 for calculating the parameters’ sensitivity, which uses Latin hypercube sampling from user-defined parameter ranges versus the objective function values [51].
g = α + i = 1 m β i b i    
where g is the objective function, α and β are the variables, and bi is the parameter. The sensitivity of bi is determined using the t-test, and the significance of parameter sensitivity is determined by the value of p [52,53].
The sensitivity analysis considered 14 input parameters, including flow, sediment, nitrate, total nitrogen, and total phosphorus, and started with baseline values gathered from the literature [53].
The p-factor, computed at the 2.5% and 97.5% levels of the cumulative dispersion of the output variable obtained using Latin hypercube sampling, is the proportion of the historical data related by the 95% prediction uncertainty (95PPU) [54]. The r-factor is the product of the standard deviation of the observed data and the mean width of the 95PPU band [54]. According to Misaghi et al. [54], based on the circumstances, an r-factor value of roughly 1.0 and a “P-factor” value of >0.7 are acceptable for streamflow simulation.
The parameters calculated by the SWAT and the monitored data must be included because this process is executed in tandem with the calibration process. This is required because the sensitivity is determined based on the objective function variations that assess the efficacy of the model calibration [51]. Unlike one-at-a-time sensitivity analysis, SWAT-CUP employs global sensitivity analysis, which involves altering the parameters [54].
We considered observed and simulated data as well as the most sensitive parameters to alter streamflow, sediment, and water quality in the area; the greater value of the t-stat and the smaller p-value were taken as more sensitive parameters during the analysis.

3.5.2. Calibration and Validation

The p-factor in SUFI-2 ranges from 0 to 100%, representing the percent of observations, and the r-factor from 0 to infinity, representing the thickness of the 95PPU [55]. A simulation that accurately matches observed data has a p-factor of 1 and an r-factor of zero [45], with a desirable r-factor value of less than 1 [55]. The strength of calibration is judged relative to these benchmark values. The model calibration and validation were conducted using daily river flow data [56]. Monthly sediment and nutrient data were utilised for calibration and validation purposes.
Model performance evaluation needs distinct datasets for diverse environmental circumstances [57], with attributes and observation periods varying, especially in Ethiopian highlands, where long-term, high-quality data are scarce. The study uses field observation data from 1979 to 2001 for calibration and 2002 to 2018 for validation for the entire simulation period (Figure 2), with a five-year warmup period [58] and daily streamflow sediment yield and nutrient load for calibration/validation. Calibration was performed for sub-watershed number 33 (Hombole station) and watershed outlet number 23 (Melka Kunture gauging station) using observed monthly mean sediment and flow data (Figure 1). Nutrients were calibrated at Melka Kunture; no water quality data were available at Hombole [59]. Watershed models are better suited for multisite calibration for sites with no hydrological connectivity. Avoiding the need for multiple points for calibration is another method for using nested watershed sampling sites in model calibration. Use the remaining nested sites for model validation and the non-nested sites for calibration [60].
Firstly, the hydrological component was calibrated, then the sediment component [61], and finally, the nutrient component.

3.6. The SWAT Model Performance Assessment

The degree of a model’s accuracy, consistency, and flexibility must be taken into consideration while assessing its performance [57]. The evaluation of SWAT hydrologic and pollutant estimations can be performed using a wide range of statistical methods; for example, Moriasi (2007) [57] lists around 15 statistical tests that can be used to evaluate the accuracy of watershed simulation models. Statistical evaluation should carefully consider daily and monthly data characteristics as well as other properties of the model output to customise statistical analysis for the given application. To simulate observed streamflow, the model’s efficiency and performance were evaluated by a variety of metrics, including the p-factor, r-factor, coefficient of determination (R2), Nash–Sutcliffe (NSE), percent bias (PBIAS), and observation standard deviation ratio (RSR) [57]. Earlier SWAT research usually used the Nash–Sutcliffe coefficient and the R2 coefficient for evaluation [62]. In addition, graphical techniques were used in this study. Legates and McCabe [63] assert that graphical methods are necessary for a proper model evaluation. Model bias, variations in peak flow timing and amplitude, and recession curve form can all be detected with the use of visual analysis [64].
The NSE ranges from −∞ to +1, where a value of 1 indicates full agreement between the observed and simulated results. The overall likelihood of the simulation results to differ from the observed data, either more or less, is measured by PBIAS. Zero demonstrates accurate simulation; positive values show underestimation bias, and negative values signify overestimation bias [57]. The ratio of the root mean square error (RMSE) to the observed data’s standard deviation is known as the standard deviation ratio (RSR). It ranges from a high positive value to the ideal value of 0. The model simulation performance improves with decreasing RSR and decreasing RMSE [65]. The suggested ranges explain the model’s performance, as shown in Table 2 [66].
N S E = 1 i = 1 N Q i , m Q i , s 2 i = 1 N Q i , m Q m ¯ 2
R S R = i = 1 n ( Q m Q s ) 2 i = 1 n Q m Q ¯ 2
P B I A S = 100 i = 1 N Q i , s Q i , m i = 1 N Q i , m
While Qs is simulated runoff, Qm is measured runoff.

4. Results and Discussion

4.1. Changes in the Land Use and Land Cover

With Google Earth images and local knowledge of the area, an accuracy assessment of the LULC classification was performed for each of the corresponding periods. The classification’s overall accuracy was 91.2%. The proportion of the entire area, as well as its spatial variation of the eight LULC types for 2003 and 2023, are shown in Figure 3. The results show that agricultural land covers 31.46% and 77.9%, shrub land covers 58.4% and 14.9%, forest covers 4.06% and 2.13%, and the built-up area covers 2.52% and 4.54% for 2003 and 2023, respectively. In the study area, cropland has the major contribution with a loss of grassland, shrub, forest, and wetland, respectively (Figure 4 and Figure 5), showing the LULC.
The study area experienced a decrease in forest land due to agricultural expansion, while the built-up area gradually increased from 2.01% to 15.51% throughout the study period. This is due to the rise in urbanisation and interest in land for commercial or industrial purposes. The overall LULC change between 2003 and 2023 statistics for each year and sub-catchment is presented in Table S1.
The analysis shows that during the past 20 years, there has been an increase in built-up area and agricultural land while there has been a significant reduction in wetlands, water, forests, shrubs, and grasslands. Agricultural land increased by 147.29% throughout the study period, followed by built-up area by 80.15%. This results from population growth, which raises the demand for land for investment, legal and unofficial settlements, and various agricultural products like cereal crops. The forest, grassland, and shrubland were diminished by 47.55%, 96.7%, and 74.37%, respectively. This might be due to deforestation activities and the clearing of shrubland that have been made for investment, urbanisation, and farming. The direction of transformation from one LULC to another LULC, the percentage of transformation, and the change matrix are presented in Figure 4 and Figure 5.

4.2. Hydrological Model Output

4.2.1. Analysing Sensitivity

Thirteen hydrological, ten sediment-related, and nine nutrient-related factors were chosen for further SWAT calibration as a result of the sensitivity analysis. Table 3 lists the ranking of 14 parameters based on their smaller p-value and a higher absolute value of the t-stat. The identified parameters broadly correspond to previous studies in this geographical region [67]. Each parameter’s relative significance is determined using the t-test and p-value values. The t-stat is the ratio of the parameter coefficient to its standard error. Parameters with a p-value less than 0.05 are taken as sensitive. The relative significance of each parameter is ascertained using the t-test and p-value. With a p-value of less than 0.05, parameters are considered sensitive. The t-stat measures the ratio of a parameter coefficient to its standard error.

4.2.2. Calibration and Validation of Streamflow

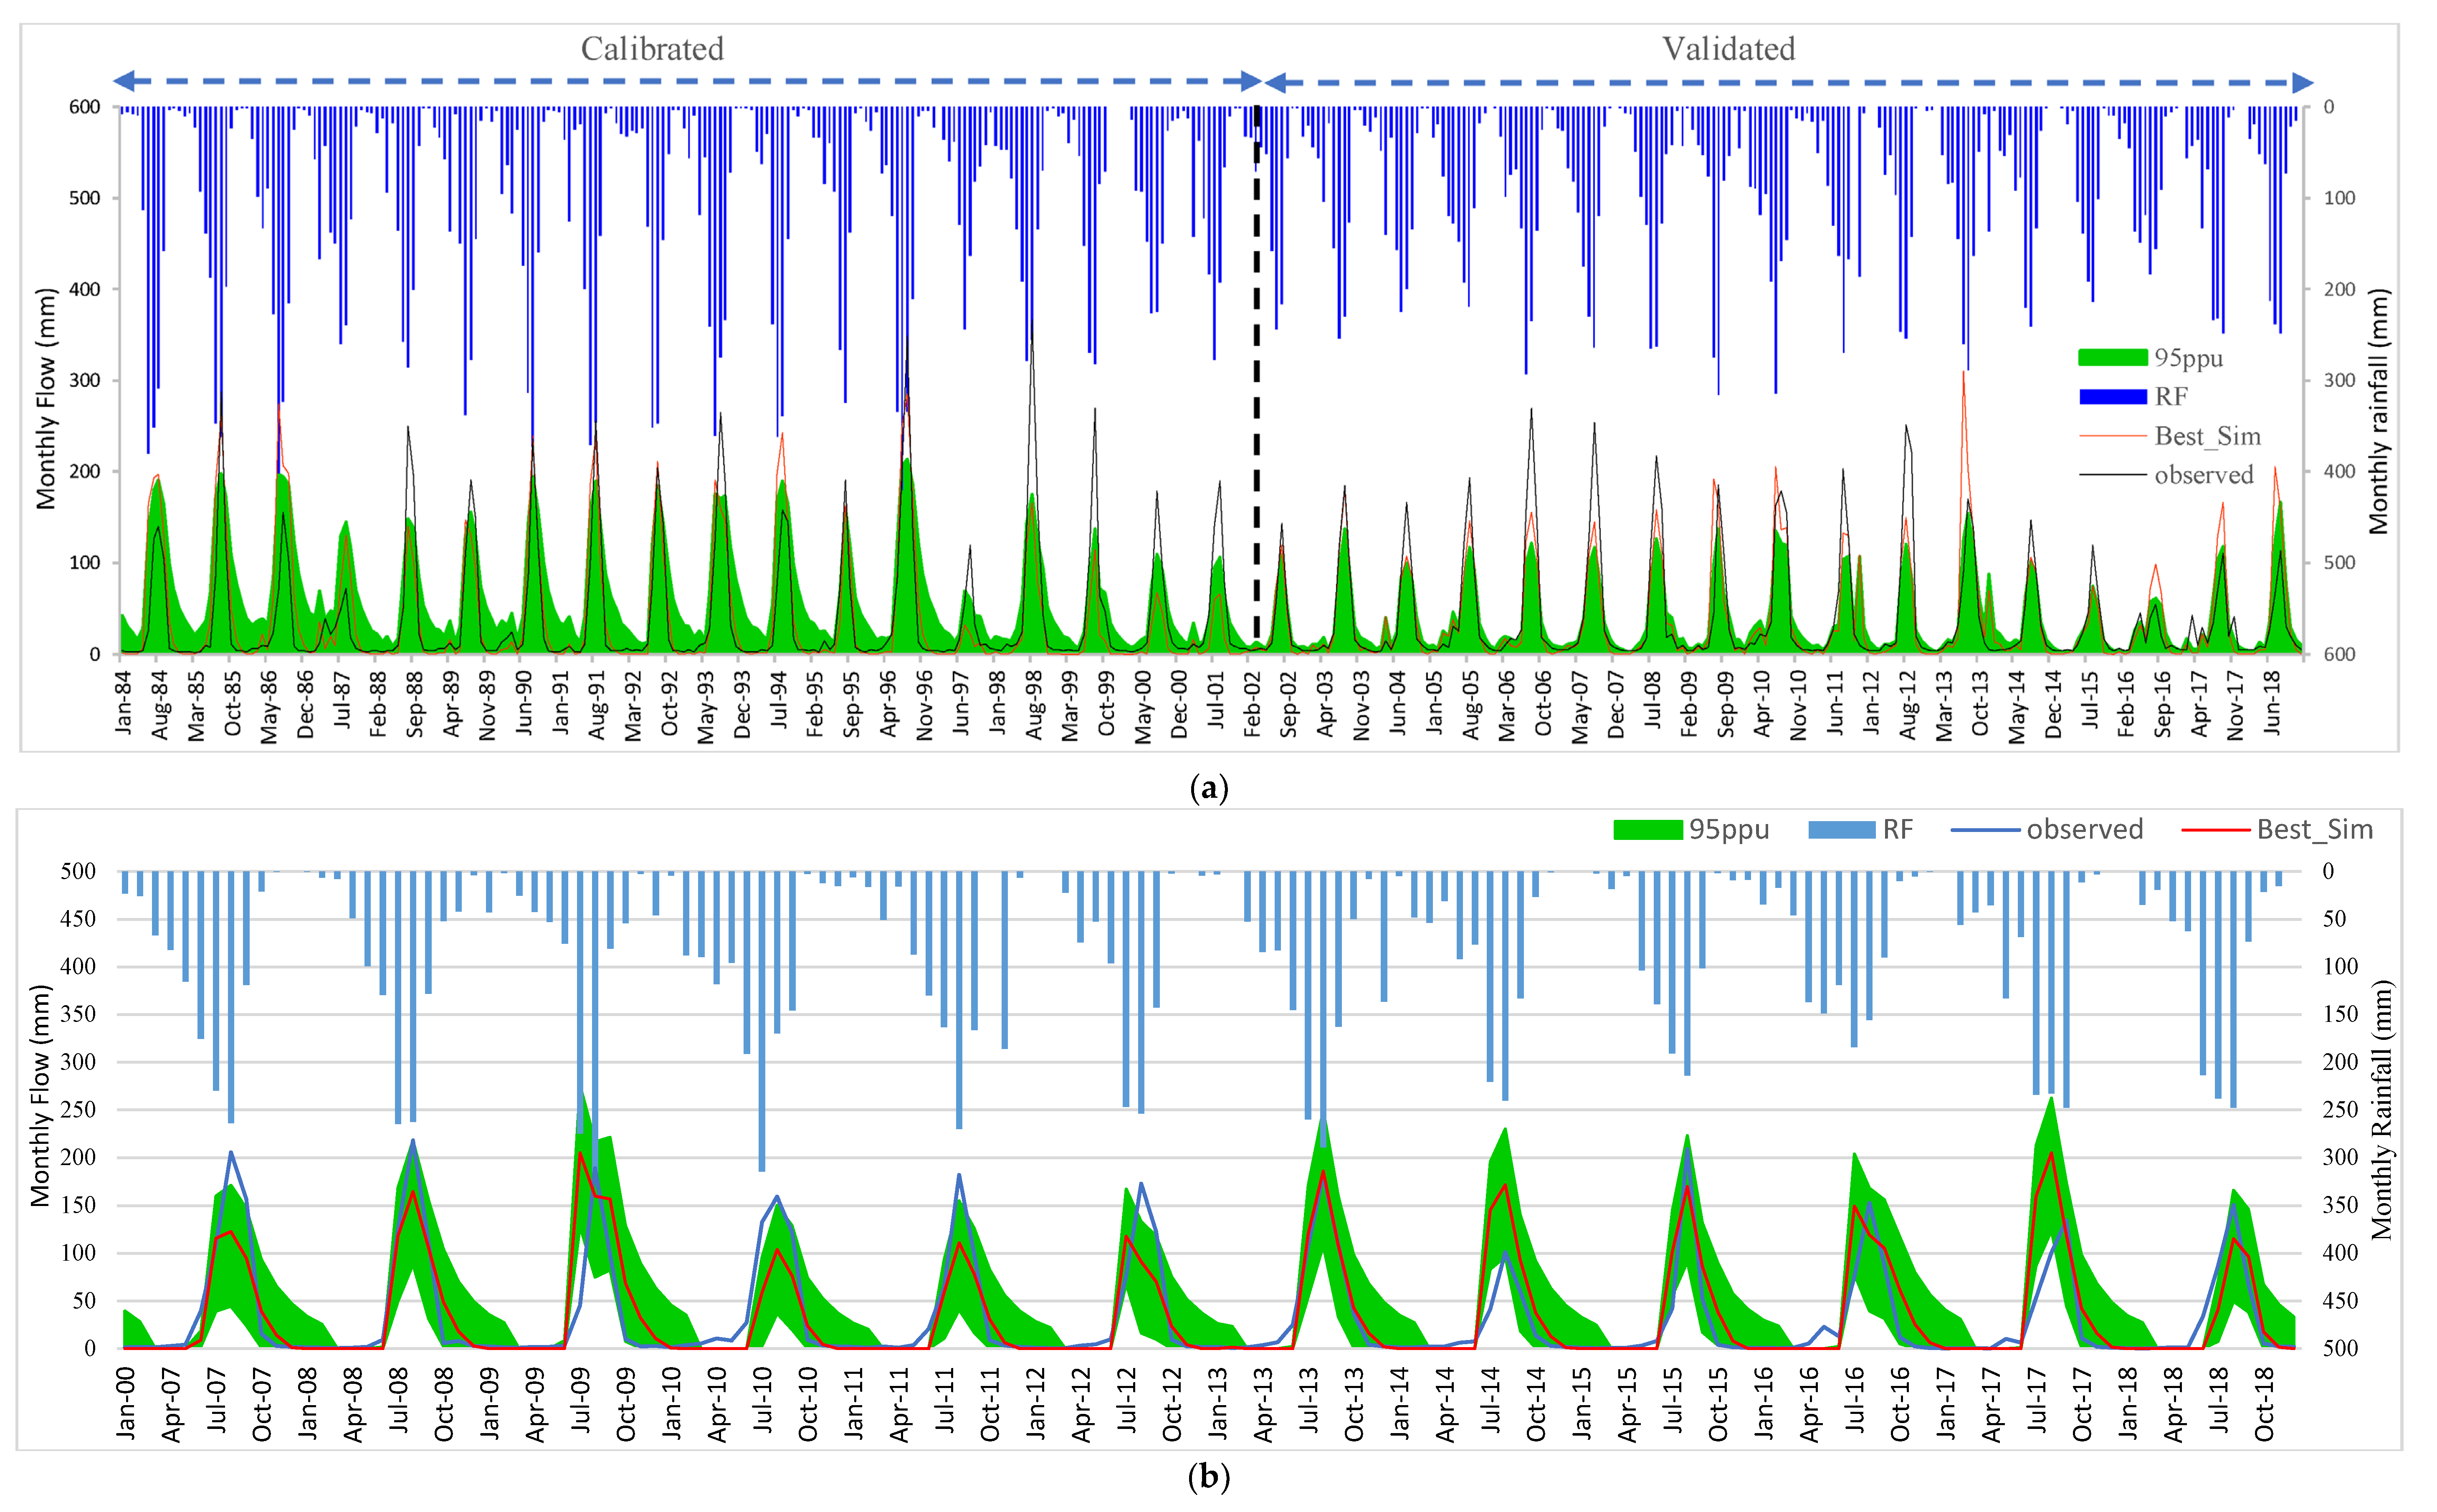
The calibration and validation were conducted using daily streamflow data at the Hombole gauging station with the fourteen most influential model parameters, as shown in Table 4 [72]. The monthly runoff calibration and validation results (Figure 6a) show a p-factor of 0.94 and r-factor of 0.94 during the calibration period (1979–2001) and a p-factor of 0.92 and r-factor of 0.8 during the validation period (2002–2018). The Melka Kunture gauging station, used for validation, had a p-factor of 0.63 and an r-factor of 0.94 from 2002 to 2018, as shown in Figure 6b.
A p-factor of above 0.70 and an r-factor of under 1.5, according to Abbaspour [73], indicate that the model accurately simulates streamflow. During the calibration and validation phases, a significant portion of the data was enclosed by the 95PPU at Melka Kunture, 0.63. For the calibration and validation period at Hombole, the PBIAS was very good, the NSE was good, and the RSR was good, following the evaluation criteria proposed by Moriasi [74], as shown in Table 4.
Visually, flow models at calibration sites generally compared well to observed flow data, except in 1986 and 1994, as shown in Figure 6. Similarly, the flow simulations for the validation periods generally matched the measured flow records, except for the years 2013 and 2016–2018 at Hombole (Figure 6). The input uncertainty connected to rainfall data and measured flow data is most likely the cause of differences between simulated and measured flows.
The model, according to the results, accurately represents the flow characteristics in the upper Awash basin. The scatter plot (Figure 7a) shows the relationship between observed and simulated flows, with moderate correlation at Hombole during calibration.

4.2.3. Calibration and Validation of the Sediment Load

Once the SWAT hydrological model performance was deemed satisfactory, it was calibrated and was used to evaluate the sediment and nutrient yield modelling in the upper Awash.
The data were bracketed for calibration and validation periods at the Hombole gauge station, with 0.82 and 0.76 as the p-values of the monthly sediment data, respectively. The Melka Kunture observatory recorded a 0.74 p-value of the data being bracketed during the validation period. The calculated R-factors for the monthly sediment yield were 0.71 for the calibration, 0.63 for the validation periods at the Hombole gauge station, and 0.94 for the validation period at the Melka Kunture gauge. Except for the validation PBIAS value, which is within the satisfactory range, the indicators at the Melka Kunture gauge station are within the range of good to very good performance levels (Figure 8 and Table 5). All statistical indices obtained values during the calibration period were higher, except the PBIAS.
It is recognised that there is inherent uncertainty in the observed data [57]. The simulated sediment load was compared to the observed sediment load on an annual basis. The observed sediment ranged from 1.16 t/ha/yr. to 70.41 t/ha/yr., whereas the calibrated model predicted values in the 9.9 t/ha/yr. to 81 t/ha/yr. The yearly mean sediment yield of upper Awash during the 1984–2018 period result shows about 33.01 t/ha/yr (Figure 9). The mean yearly sediment yield in this research at the sub-basin level is generally consistent with earlier findings. For instance, the final result agrees with Chekol [75], upper Awash sub-basin, upstream of Koka dam, who reported an average annual sediment yield predicted in the range of 8 to 46 tonnes/ha/yr. with an eighteen-year average of 21.5 tonnes/ha/year Jilo [76] in the lower Awash basin, indicated that the annual range of sediment output was 3.28 to 51.77 t/ha/year Gonfa [71], in the Mojo sub-basin (WS10, WS13, WS16-WS18, WS20, WS24, WS25, WS32, and WS33), the estimated soil loss rate ranges from 2 to 204 t/ha/year. The upper limit of the sediment yield does not agree with this study, but the annual average predicted rate of soil loss was 21.97 t/ha/year, which is relatively in agreement with the average value of this study.

4.2.4. Soil Erosion Rate Spatial Distribution

It is challenging to determine the proper erosion severity classes for all soil types and environments. Five classes are recommended in Table 6, which are for soil management purposes and should ideally be further refined to describe the combination of erosion and deposition in a particular environmental setting. For example, in the case of gully and rill erosion, the depth and spacing may need to be recorded; for sheet erosion, the loss of topsoil; for dunes, the height; and for deposition, the thickness of the layer.
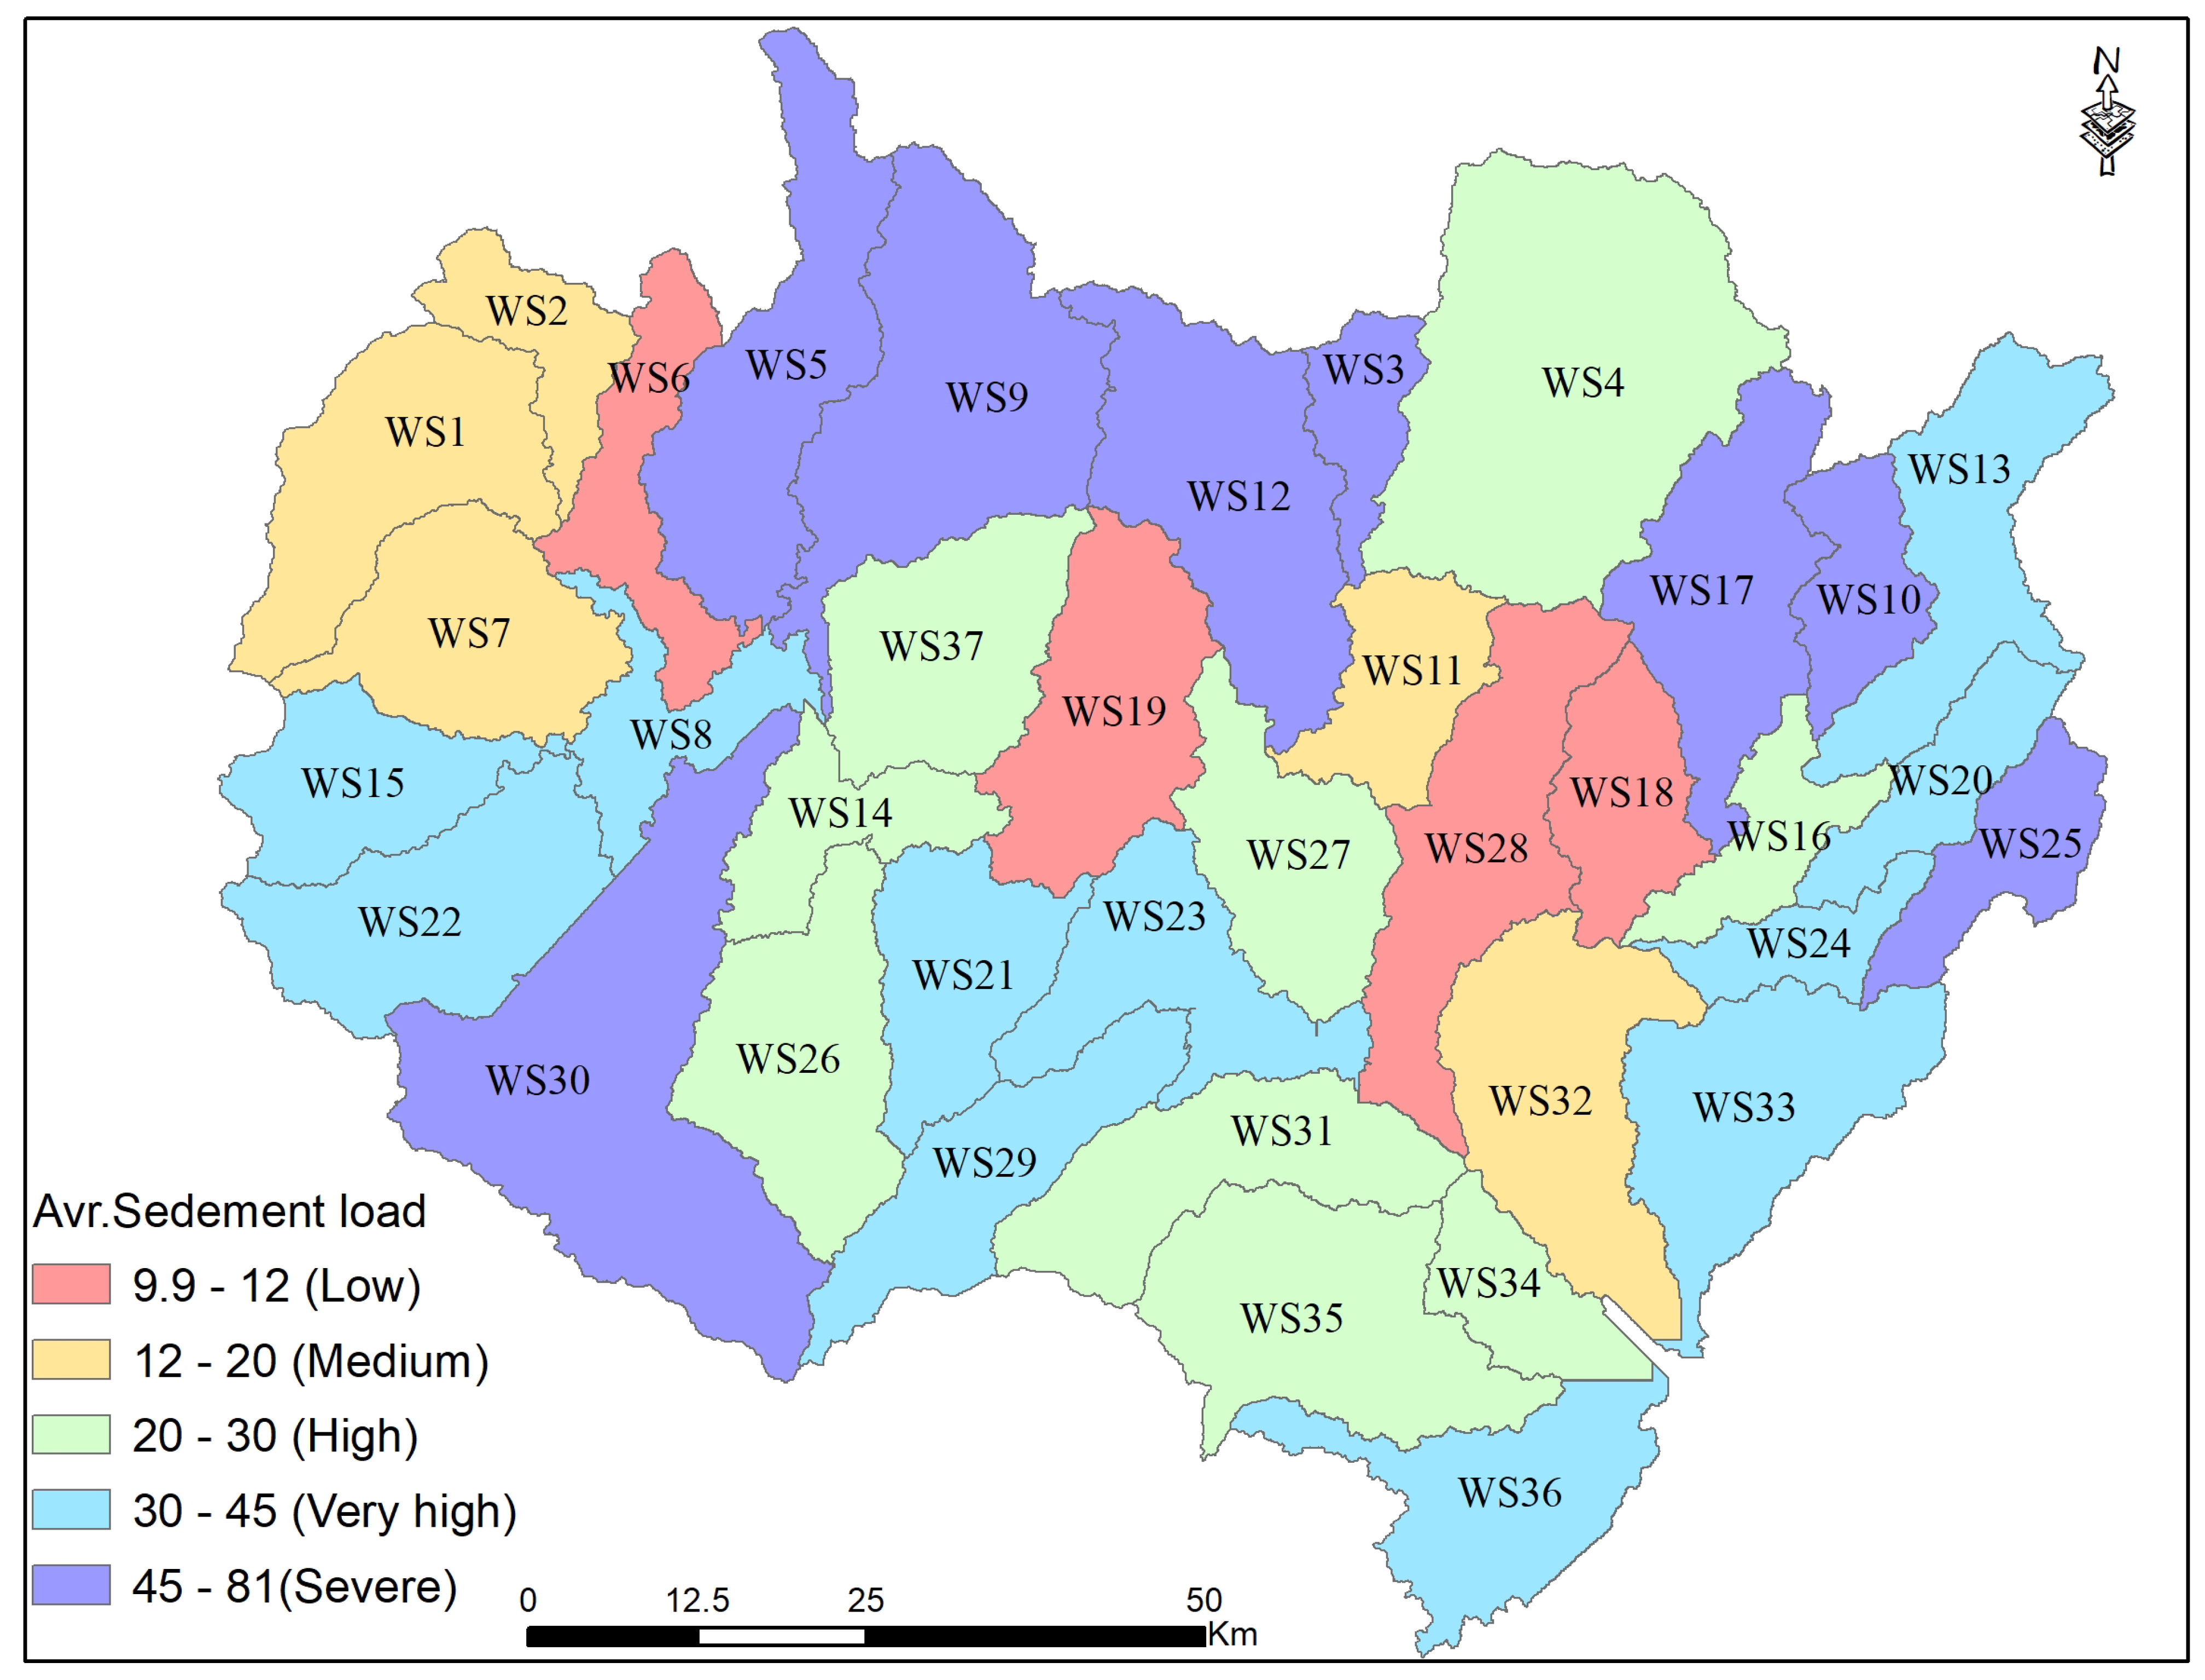
Figure 10 shows spatial variations of sediment load among the 37 sub-watersheds, WS03, SW05, SW09, SW10, SW12, SW17, and SW30, which cover about 27.9% of the area and are categorised into the severe class. This can be due to the steep topography nature of the watersheds. Sediment severity classes ranging from moderate to extremely severe are about 86% of the watershed, identified as hotspot areas for soil erosion. The remaining 14.4% is considered the low severity class.

4.2.5. Nutrient Load Calibration and Validation

Information regarding the application rates/timings of nitrogen and phosphorus fertiliser applications to row croplands was provided by local farmers. The local farmers indicated that, on average, 100–120 kg/ha of urea and 50–75 kg/ha of di-ammonium phosphate (DAP) were applied to the cropland throughout the growing period, respectively. Figures do not include fertiliser application in irrigated vegetable production. This study considers only the fertiliser application on cereal crop production lands. In addition to this, the nutrient loss resulting from applications of manure was believed to originate primarily from livestock. The LULC map of grazing land that is now in place, which designates grassland as the grazing area presented in Figure 3, was used to disperse the amount of manure in the watershed. The amount of manure applied to HRU was determined by looking at the area where the livestock were grazing.
The model predictions were evaluated for both the calibration and validation periods using the graphical comparisons and statistical methods mentioned and the performance rating (shown in Table 2). The model underestimated the TN and TP loads during high flow years, particularly in the upper Awash watershed at the Melka Kunture gauging station, as shown in Figure 1 and Figure 2.
The nutrient loads for the period 2011–2019 were calibrated using the SWAT-CUP software to the observations available at Melka Kunture. According to Moriasi’s [57] evaluation criteria, the result showed good and very good metrics for the calibration period and good and very good metrics for the validation period. In the stages of the calibration phase, the PBIAS for NO3, PO43−, TN, and TP load indicated very good performance; over the validation time, the PBIAS again fell within the very good performance rating range. The PBIAS in the stage calibration phase for TN and the validation phase for TP showed better performance compared to the other nutrients.
Except for TP, which had a satisfactory simulation result of an NSE value of 0.54, the Melka Kunture gauging station’s NSE data at the calibration stage revealed good simulations for the nutrients. Except for the NSE value of the NO3 simulation, the NSE values were higher in the validation period. PO43− and TP RSR values demonstrated very good simulation performance throughout the calibration period; NO3 and TN RSR values, on the other hand, showed good simulation performance (shown in Table 7). During the validation period at Melka Kunture, the simulation performance for NO3 was very strong throughout, whereas PO43−, TN, and TP demonstrated good performance.
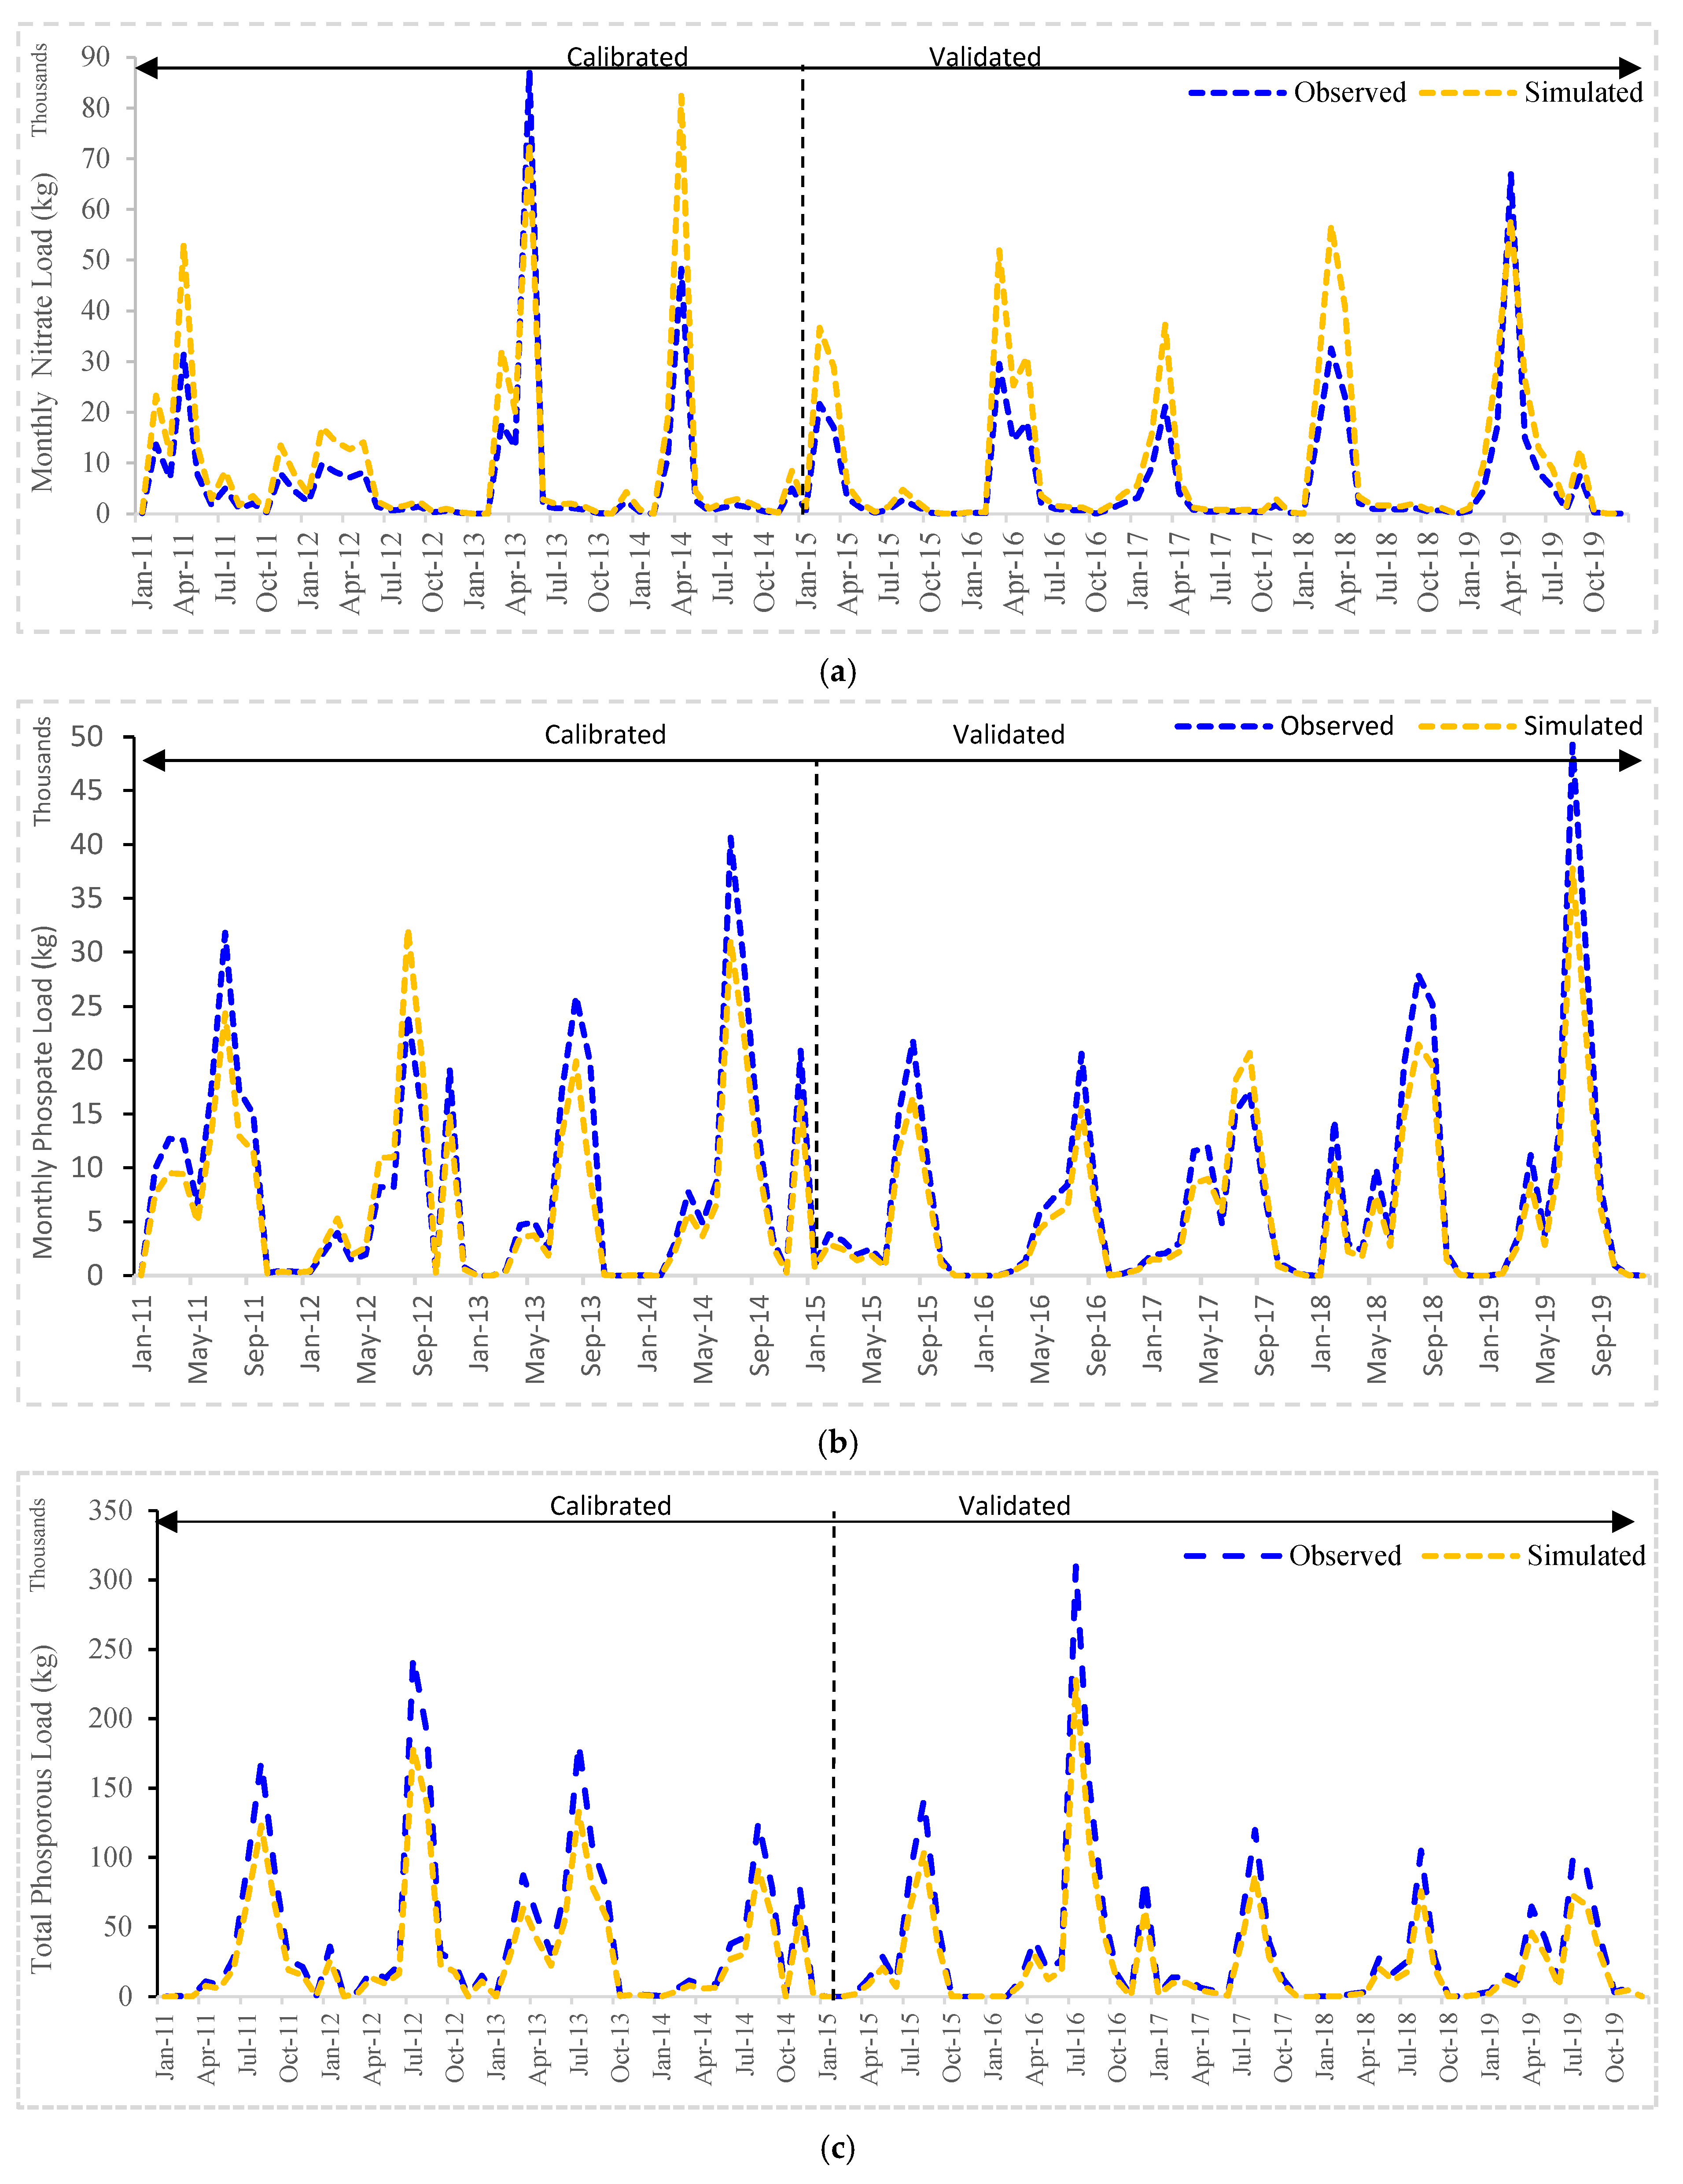
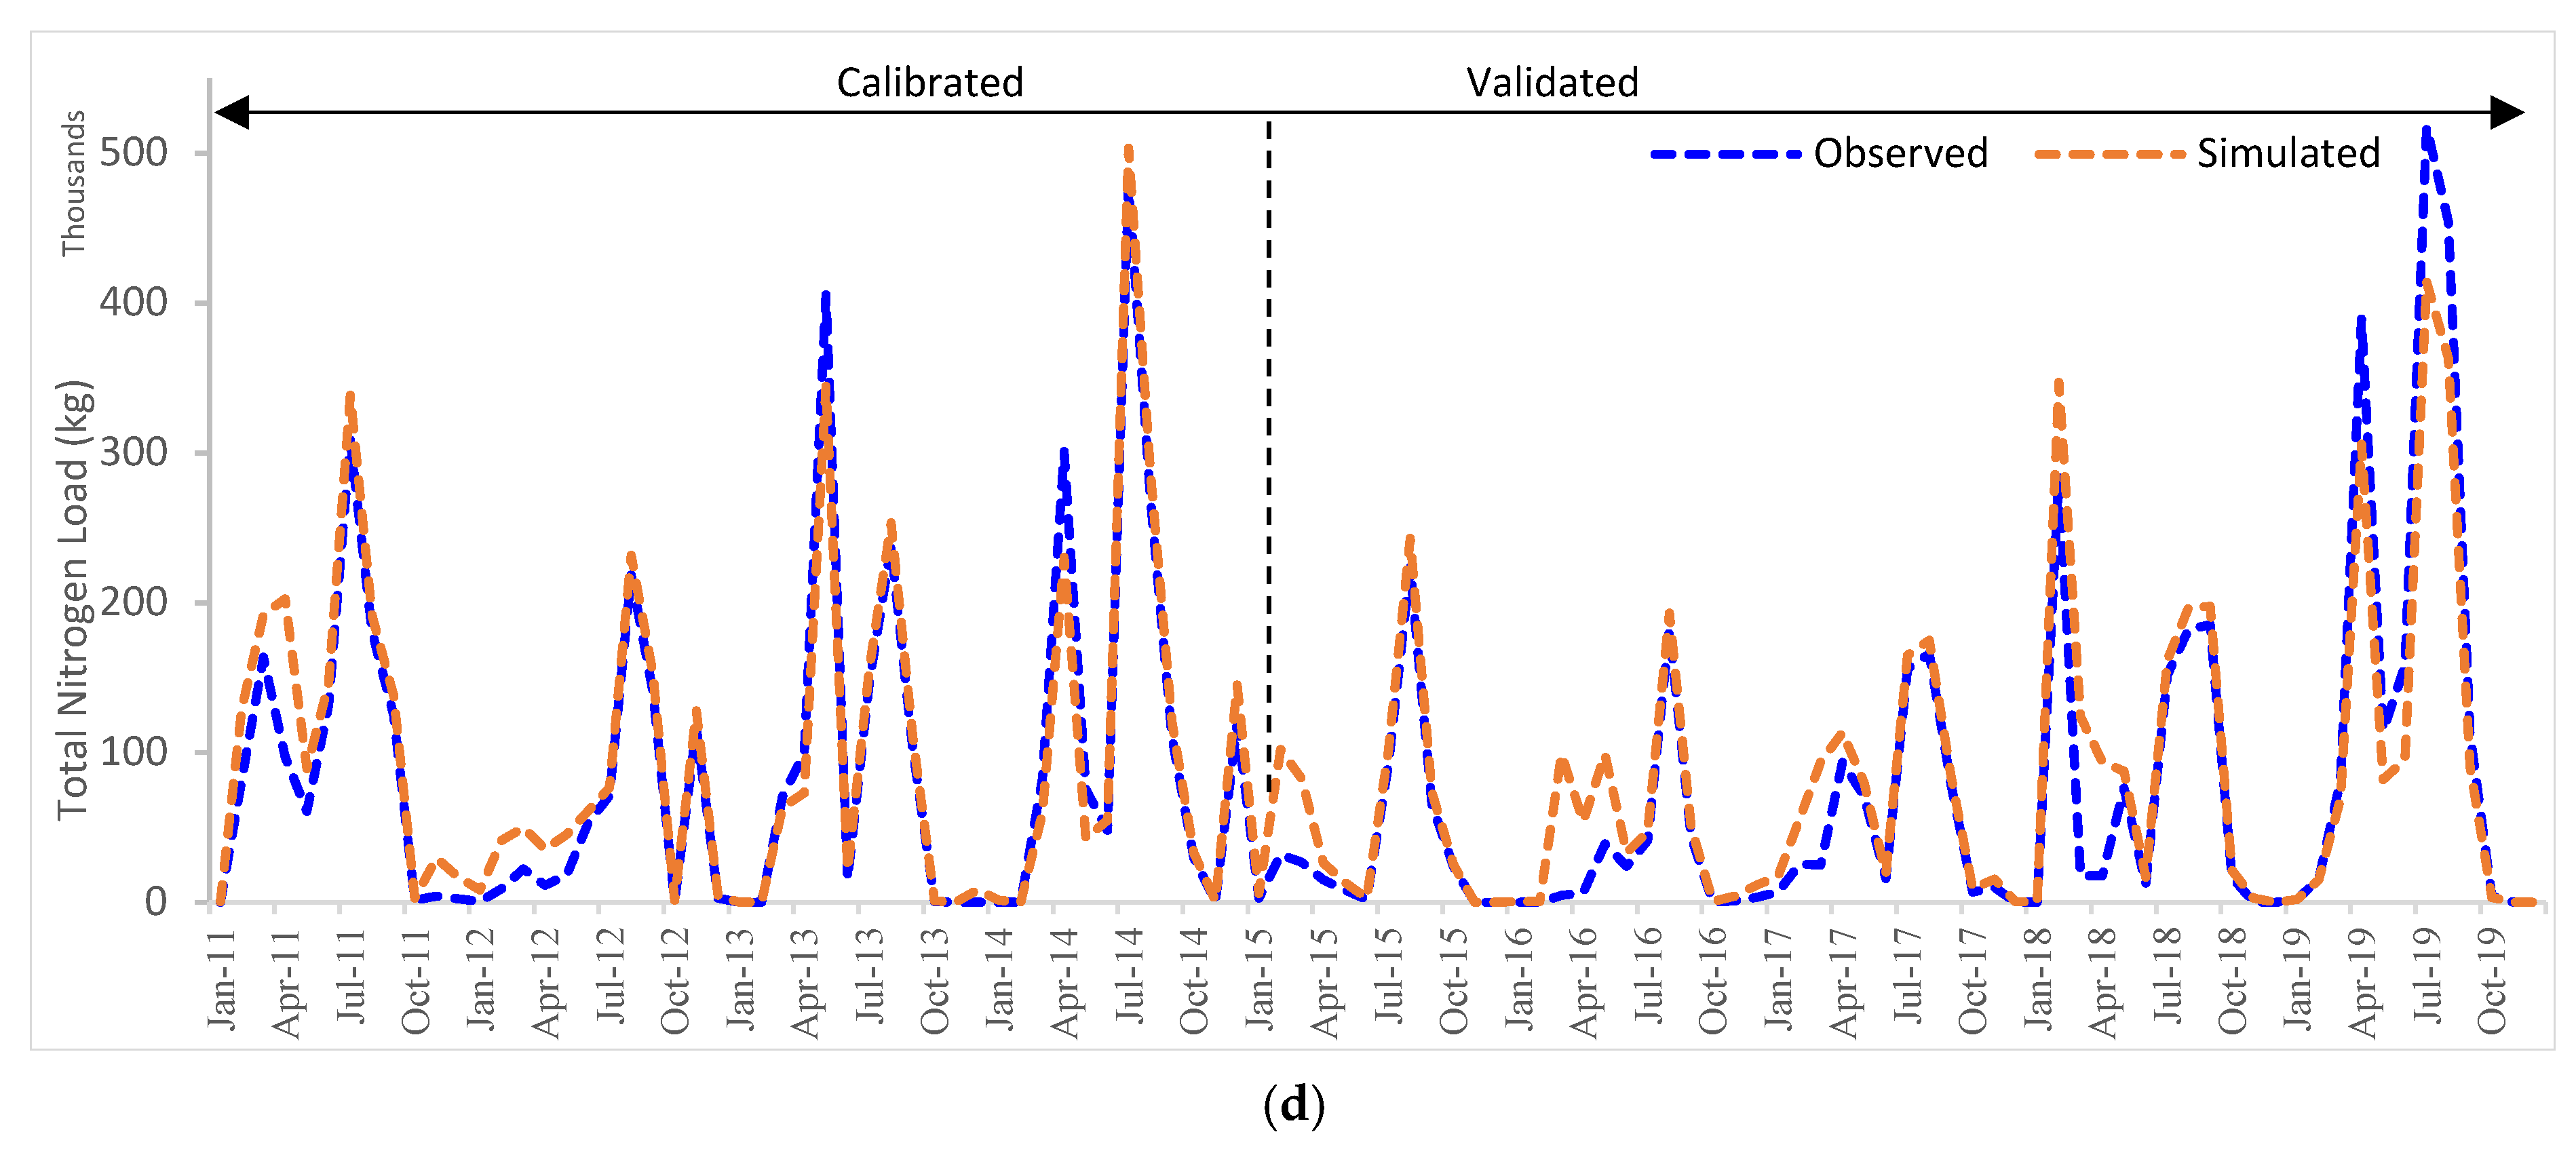
As the time series is provided in Figure 11, the surface runoff nitrate load simulation showed higher peak values in 2011 and 2014 than the observed nitrate during the calibration period. From May 2012 to July 2014, there was good concordance between the simulated surface runoff nitrate and observed nitrate. Through the validation phase, the surface runoff nitrate load simulation showed a higher peak load than the observed nitrate except from May 2018 through the end of 2019, as shown in Figure 11a. In the case of surface runoff phosphate and TP simulation load, the high peak simulation result was observed throughout the time for calibration and validation except in 2012 through the calibration phase and 2017 through the validation phase regarding phosphate simulation load (Figure 11b,c). This discrepancy between predicted and measured runoff phosphate and TP load is likely due to input uncertainty and technical and instrumental errors propagated during the laboratory and field data collection and analysis process.
The results for TN in the surface run of load during calibration time are very good in contrast to the other nutrient parameter calibration results. There is less observed result in the lower range of TN than simulated values from January to April 2011 and October 2011 to May 2012, and there is a high peak observed value in March to May 2013 and 2014 simulated surface runoff TN load during the calibration period. These periods are the second rainfall season in Ethiopia, known as the “Belg” season. Similarly, there are fewer observed results compared with the simulated TN load in 2015, 2016, 2017, and 2018 in the “Belg” season through the validation time. During the validation time, there is a higher observed total nitrogen load than the simulated surface runoff TN both in the “Belg” and the main rainy season (Figure 11d).

4.2.6. Variations in Surface Runoff, Sediment, and Nutrient Load in Space and Time

A.
Soil and nutrient load spatial variations
At the sub-watershed scale, Figure 12 shows the spatial distributions of sediment load, phosphate, total phosphorus, nitrate, runoff, and total nitrogen. The average yearly surface runoff varies from 150.1 mm to 466.6 mm. About 26% of the average surface runoff per year is below 200 mm, with the low runoff shown in the central and northwest regions of the study area. A total of 28% of the area classified as high runoff (>350 mm) is located in the northern, western, southwestern (coinciding with high elevations shown in Figure 1), and southern tip of the sub-basin (Figure 12).
At the sub-watershed scale, the average annual loads for nitrate, total nitrogen, phosphate, total phosphorus, and sediment load varied from 0.6 to 36.3 t/year, 9 to 901.3 t/year, 25 to 7048 kg/year, and 4.4 to 287.9 t/year, respectively, as shown in Figure 12. Comparatively low nitrate loads occur in the central part of the sub-watersheds, which covers about 18.4% of the area, and high nitrate loads occur in the southwestern and a more central north–south belt, which takes up about 27.6% of the study area, as shown in Figure 12b.
The average annual TN loads, 46.7% of the area, are in the lower range of 9–50 t/year, with higher values in the south of the study area. High TN loads (>450 t/year) were found in the central and southern regions of the study area, covering an area of about 11%, as shown in Figure 12c.
The northern sub-watersheds contributed 11.8% of the total area, with phosphate exceeding 350 kg/year through surface runoff. The phosphate load with the maximum areal coverage was 27.2%, followed by 26.5%, 18.8%, and 15.8% with phosphate amounts of 100–200 kg/year, 50–100 kg/year, 200–350 kg/year, and 25–50 kg/year, respectively, as shown in Figure 12d.
The largest coverage of any load level ranging from 10 to 25 t/year was found in the average annual TP runoff loads, accounting for 39.2% of the area. Next in order of coverage are 25–50 t/year, 4–10 t/year, and total phosphorous load over 100 t/year, which account for 18.9%, 17.4%, and 15.9% of the area, respectively. On the other hand, the TP load covering between 50 and 100 t/year is relatively lower, taking up approximately 9.5% of the area, as shown in Figure 12e.
B.
Temporal variations of nutrient and soil load
The wet season is when the study area’s runoff is at its maximum (June, July, and August), followed by the “Belg” season from March to May. From 2003 to 2023, the NPS pollutants changed both the wet and dry periods. The average monthly runoff values ranged from 5.56 to 384.86 mm in December and July. July and August contributed 32.3% and 31.5% of the runoff total, respectively. The lowest contributing months were December (5.56 mm) and November (6.79 mm). The study area’s annual average runoff in 2020 and 2018 is depicted in Figure 13, with a range of 183.09 to 487.89 mm, respectively.
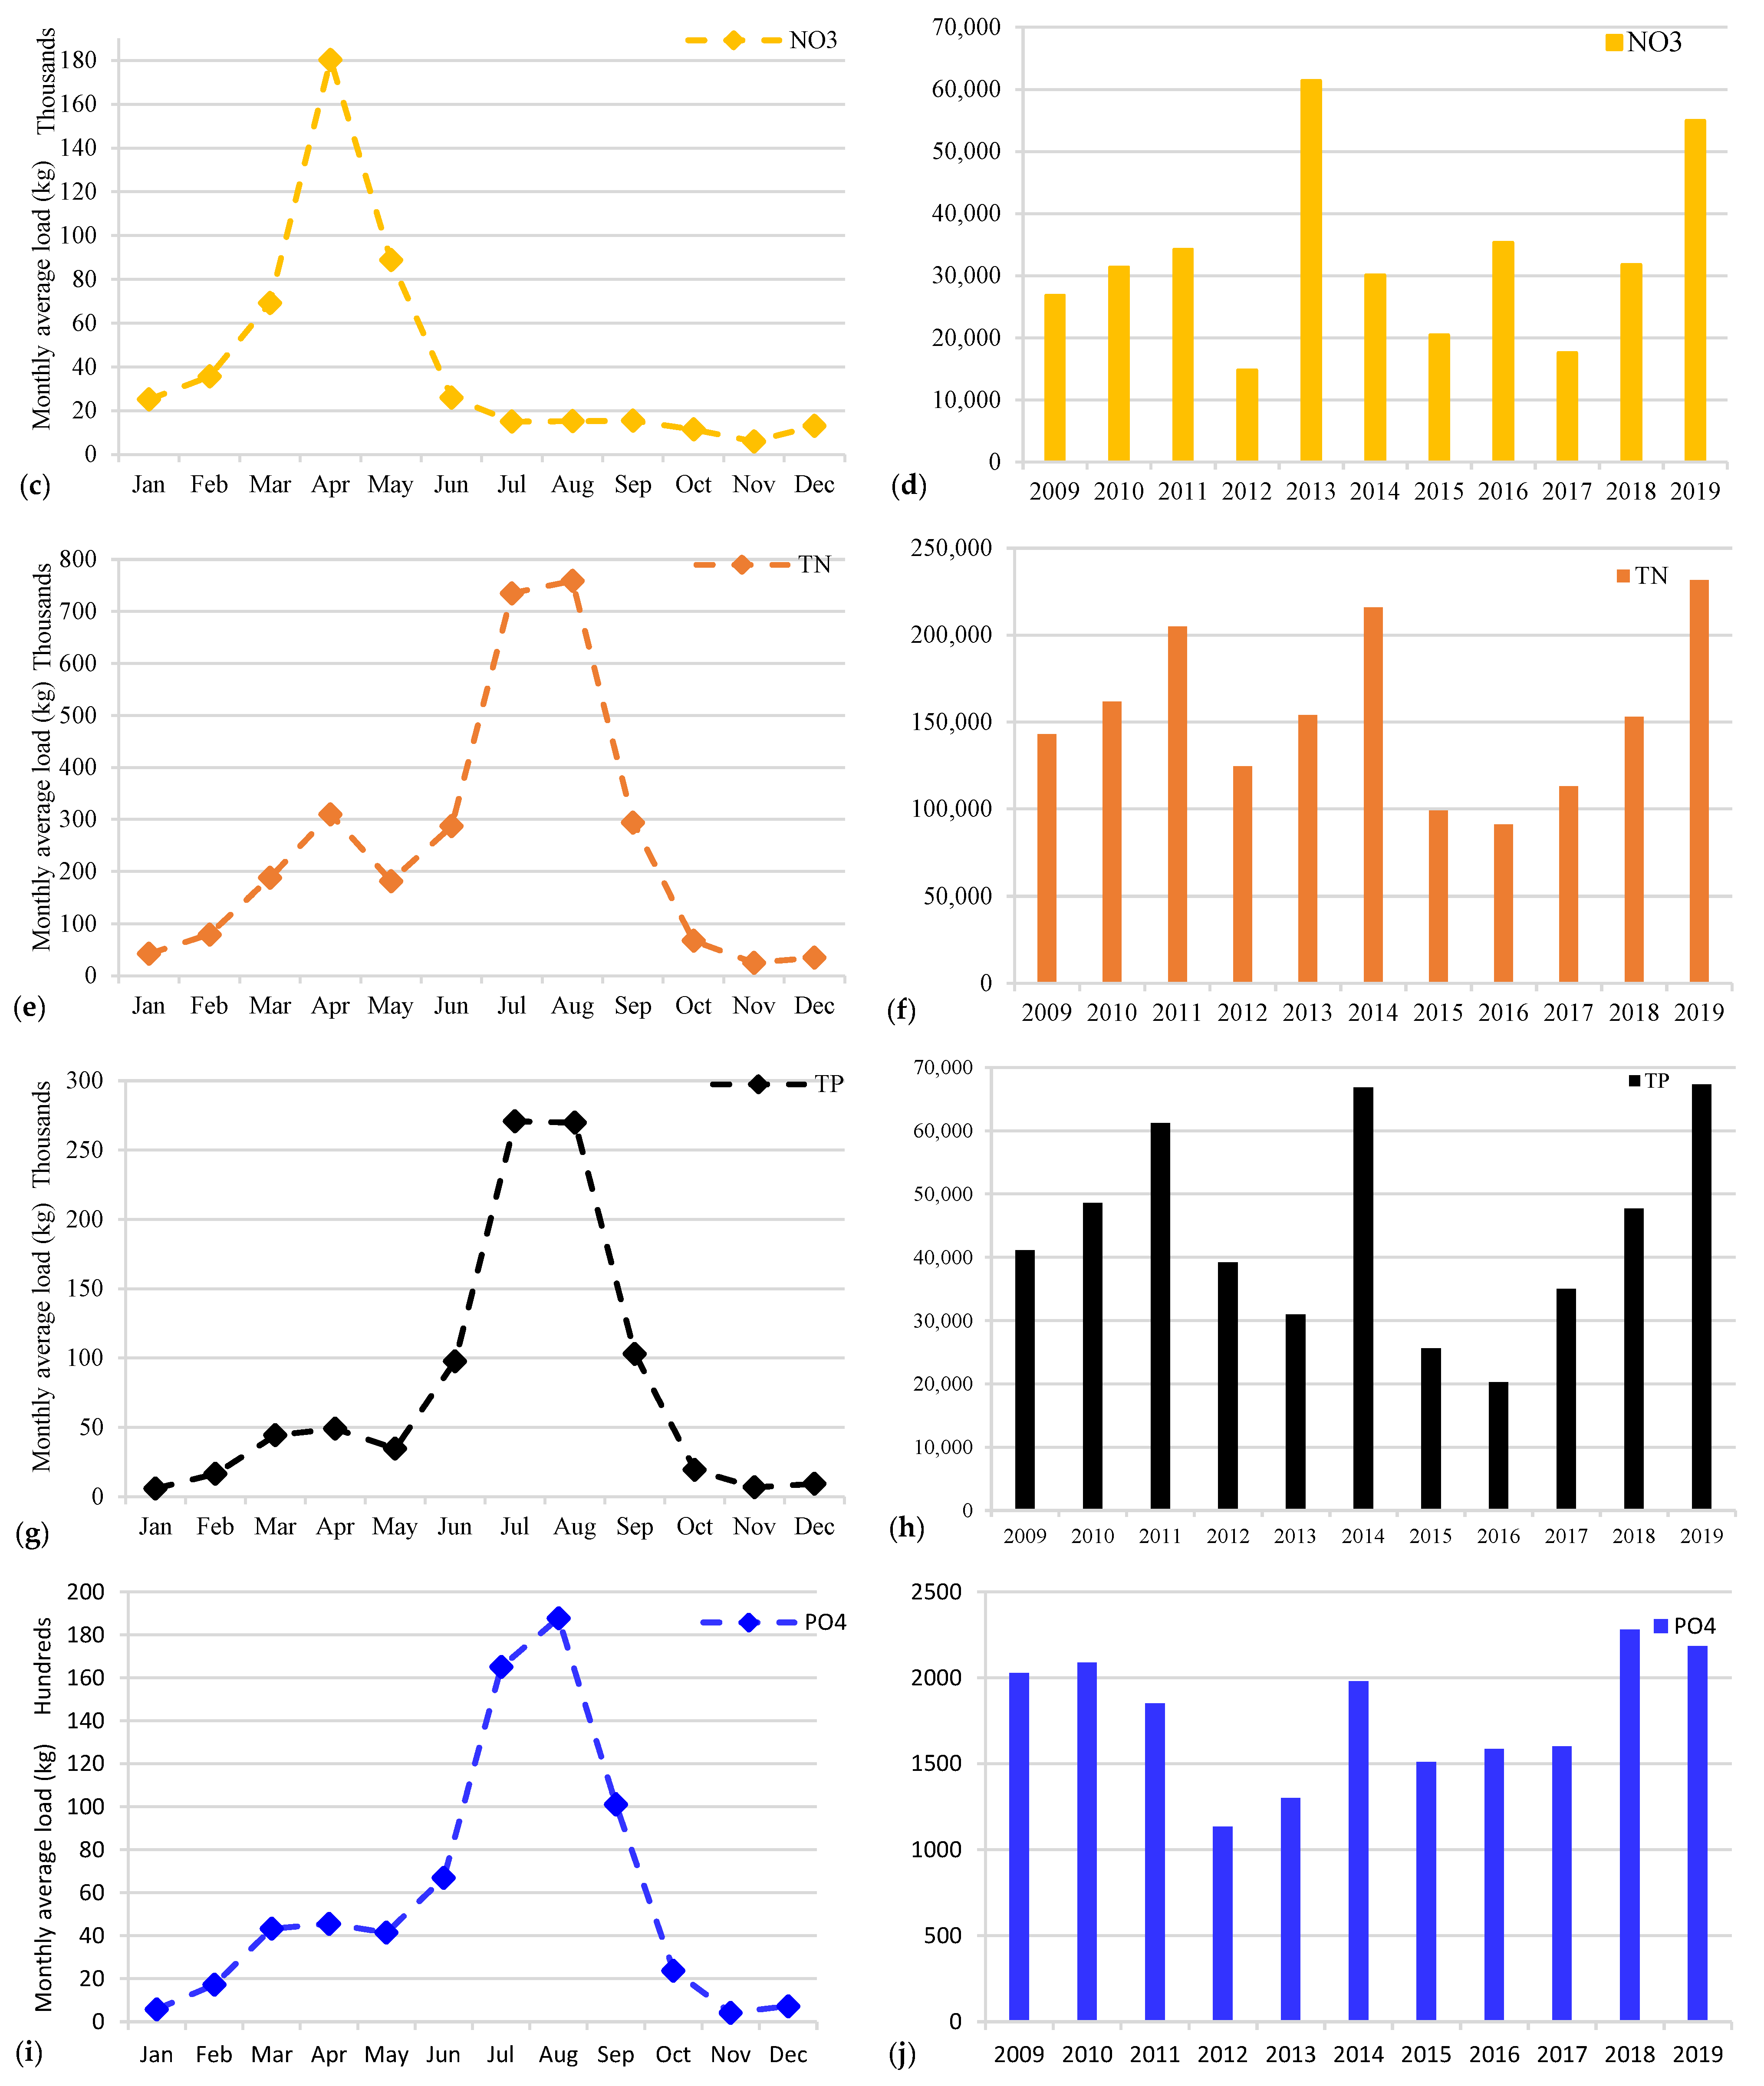
The temporal variation of monthly simulated sediment and nutrient loads of NO3, PO43−, TN, and TP are shown in Figure 13. The critical period of PO43−, TN, TP, and sediment load occurs in July and August. The highest NO3 load occurs between March and May, which collectively contributes 67.5% of the annual load. From July to September, the NO3 load contributed 14.32% of the annual load. Unlike the other nutrients, the maximum NO3 load occurs before the wet season, the “Belg” season. The season is not a growing season in the study area.
It was noted by Sebilo [16] that 32–37% of the nitrate that was applied but not absorbed by the crops was quickly assimilated into the “soil organic matter pool”. This pool of nitrogen created by fertilisers may accumulate nitrate, which can then build up and drain out of the soil, specifically during the off-growing period. During this season, when the production cycle concludes, the nitrate content of the soil increases [19]. Crop harvesting or nitrate leaching are two ways that nitrogen can escape agricultural systems [19]. To increase agricultural yield, farmers may also apply fertiliser in higher amounts than is advised. As a result, leaching releases some of the remaining nitrogen from the fertiliser into the surface water environment after harvest in the form of NO3 [19,77]. This could be the most likely reason for the elevated NO3 levels observed in the study area during this specific season. Similarly, crops only absorb 10–20% of the phosphorous fertiliser applied in the first year, and the majority of the phosphorous accumulates as leftover in the soil [78].
The months of July and August account for a TN loss of 24.46% and 25.25%, respectively, with about 69.06% of the overall TN loss occurring from June to September. The TN load for the “Belg” season (March–May) was 22.6%. In the upper Awash basin, this season marks the second important TN load period. Nonetheless, with 0.84 percent, November has the lowest TN load. This suggests that there were differences in yields between growing and non-growing seasons as well (Figure 13).
The highest simulated TP loss occurred in July and August, 29.17 and 29.07%, respectively. Of the total TP loss, the TP losses from June to September comprised about 79.89%. In the “Belg” season (March–May), the TP load showed 13.83%. This season is the second significant time for TP load in the upper Awash. However, November is the lowest TP load, which was below 1%. This also indicates that TP load differed between the crop-growing and non-growing seasons (Figure 13).
June to September’s sediment yield constituted 83.2% of the average annual sediment yield. The average annual sediment load was in 2019, followed by 2011 and 2014, which had 623, 610, and 574.9 t/year, respectively. The lowest sediment load was observed in 2016, 2015, and 2013; their sediment load was 214.1, 279.1, and 292.3 t/year, respectively. The variation in annual sediment load could be the different climate variations that occurred in the local area as well as the influence of the global condition (Figure 13).
The year 2015 had the second-highest surface runoff (462.37 mm) in the sub-basin, with the greatest annual sediment, TN, and TP loads; in contrast, the year 2013 had the highest NO3 load and the third-lowest surface runoff. In addition to the LULC, the sediment, TN, and TP were related to the surface runoff in these circumstances. Despite what the monthly NO3 load indicates, the NO3 load was unrelated to surface runoff; the low nitrate load in the highest runoff throughout July and August justifies this. The surface runoff PO43− load was higher in 2018, followed by 2019. Comparatively, the lowest sediment, TN, and TP load were observed in the year 2016, while in 2012, NO3 load showed the lowest load, and in 2012, PO43− showed the lowest surface runoff load. With an average of 8407.5 tonnes, the yearly sediment load varied greatly, ranging from 396 to 53,452 tonnes. Unlike 2016, which showed the lowest sediment yield, 2019 saw the biggest annual soil loss. A significant flooding event with the second-highest yearly average surface runoff of 25.04 mm could be the cause. Similarly, the yearly result of TP and TN fluctuated; that is, TP varied from 4.4 to 287.9 t/year with a yearly mean of 49.55 t/year, and TN ranged from 9.3 to 901.3 t/year with an average value of 154.7 t/year (Figure 13).
Typically, crops only absorb 10–20% of the phosphorous fertiliser applied in the first year, and the majority of the phosphorous accumulates as leftover in the soil [78].

4.2.7. The Effects of LULC Changes on Sediment, Runoff, and Nutrient Load

There are two phases during the study period: 1986–2002 and 2003–2023 for the evaluation of the effect of LULC transformation on flow, sediment, NO3, PO43−, TN, and TP in the upper Awash basin. The calibrated model was run to simulate eight LULC each year by the “fixing-changing” technique (LULC adjustment while maintaining other inputs) using the 2003 and 2023 LULC data.
A.
Surface Runoff
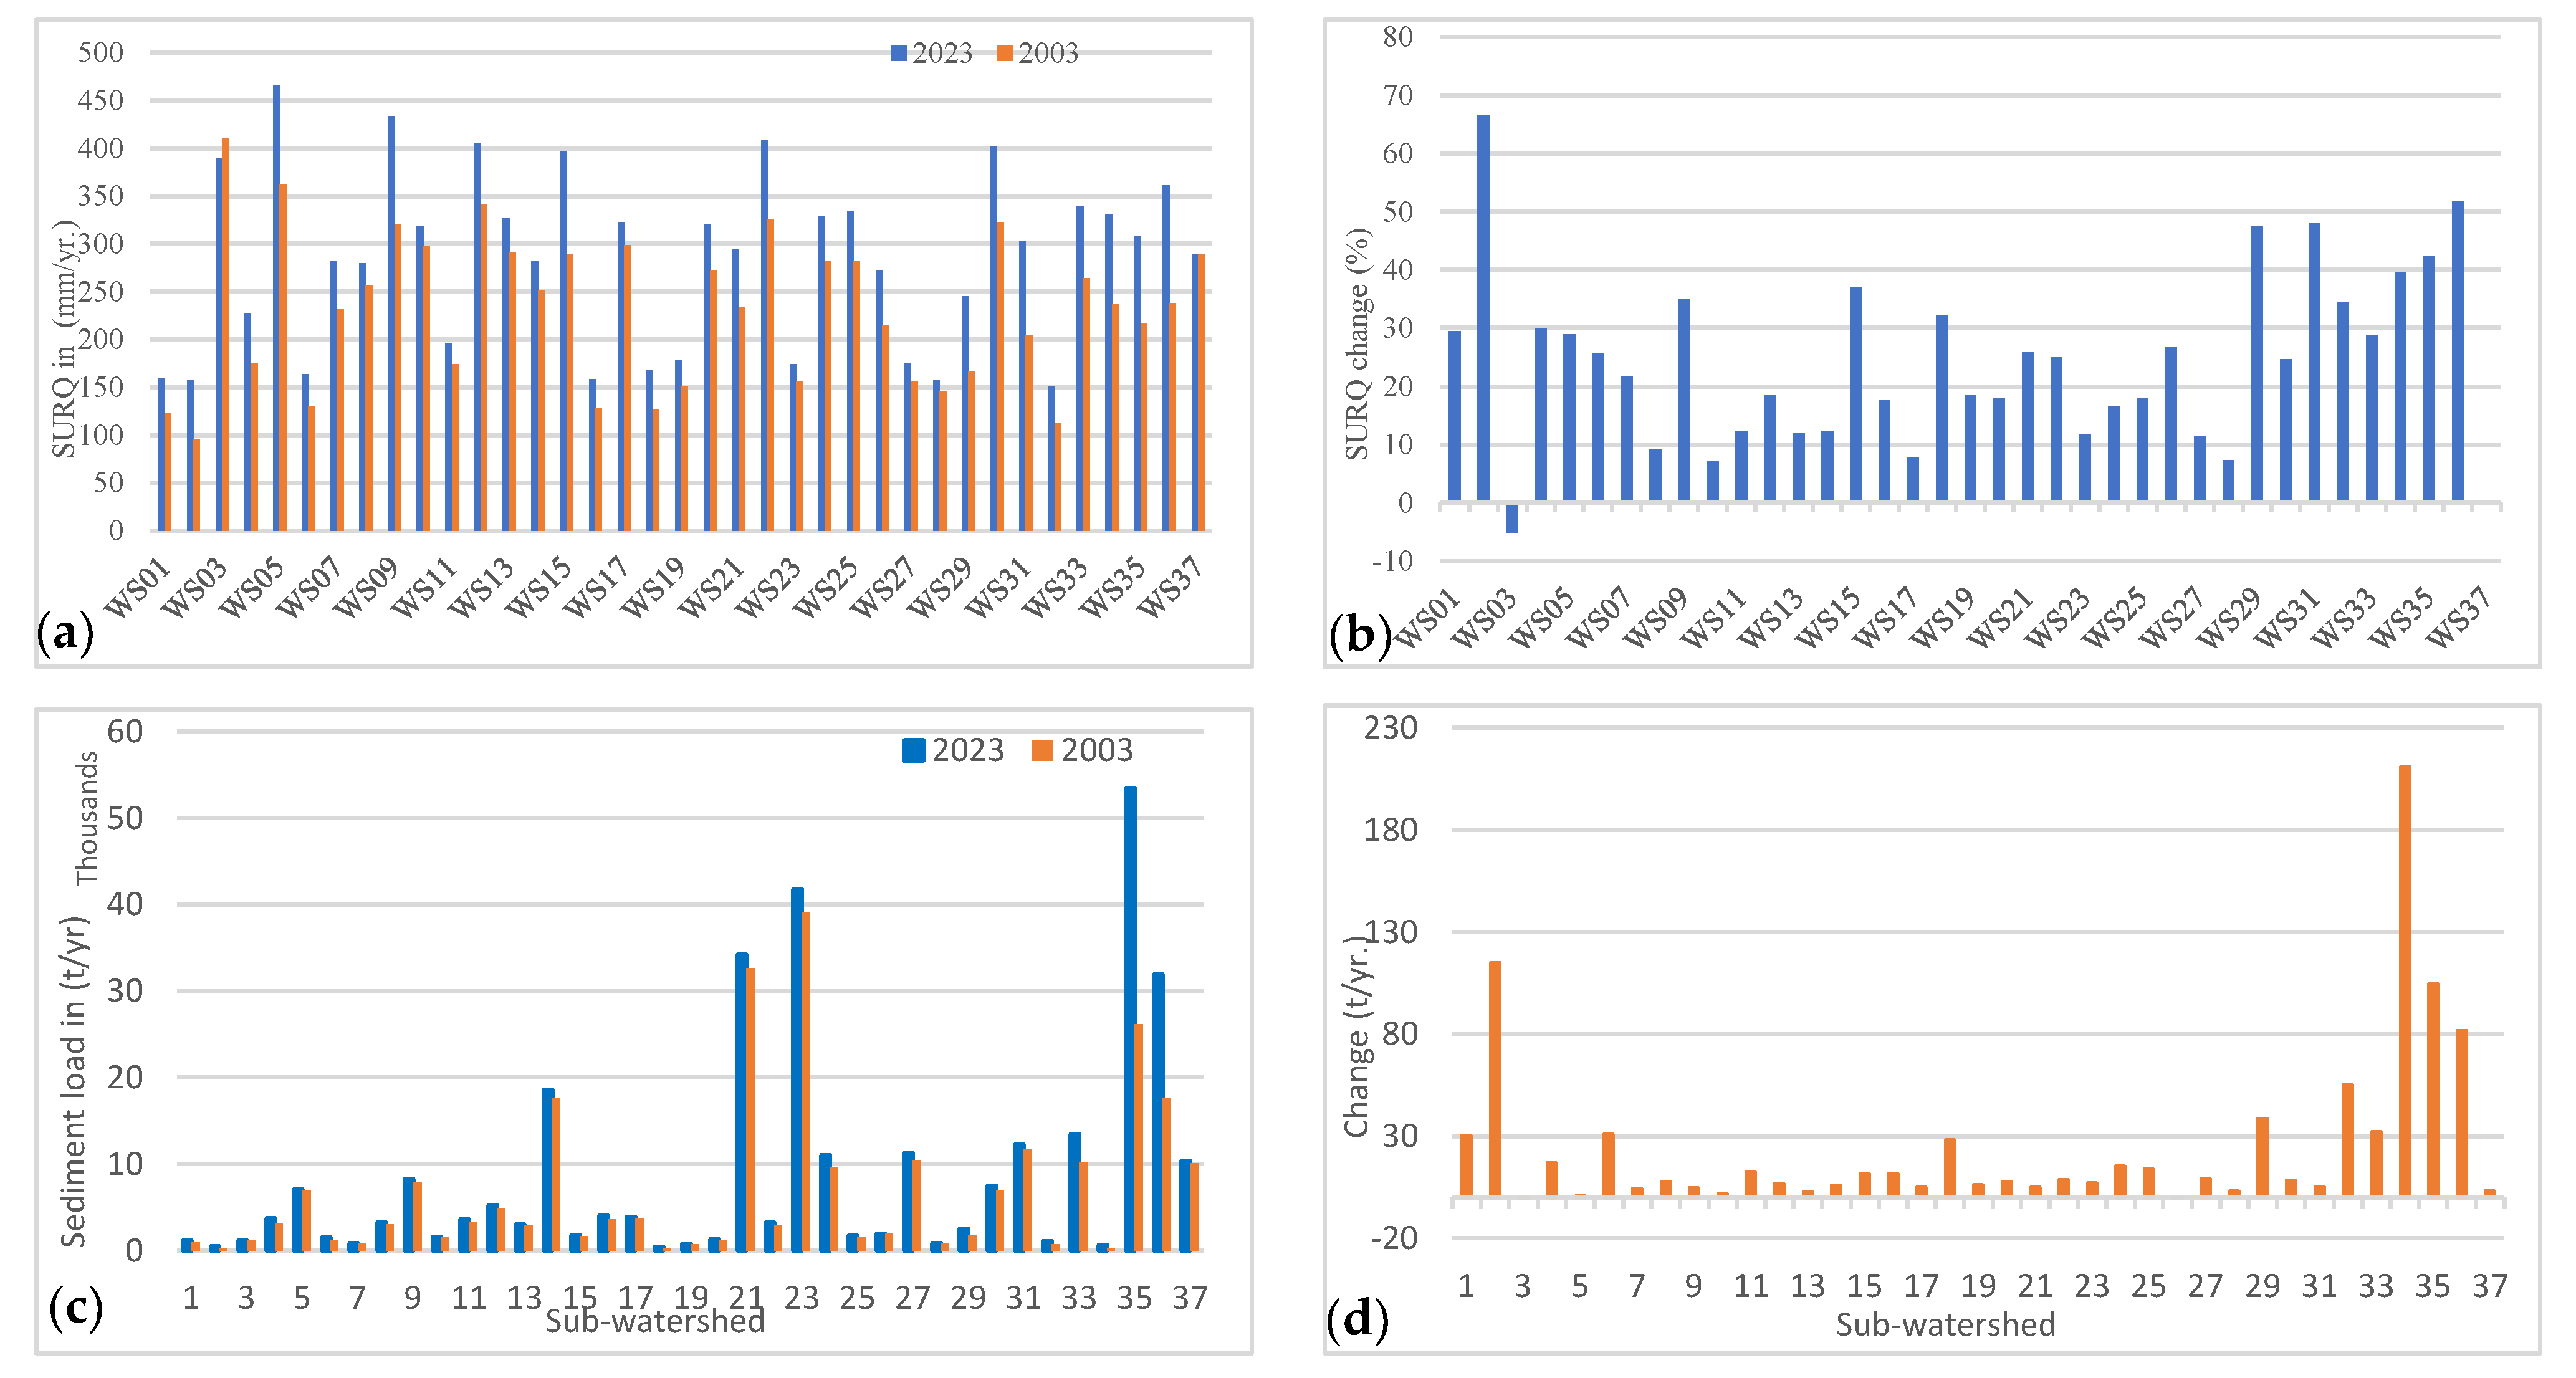
WS05 has a surface runoff value of 466.7 mm/year, followed by WS09, WS22, WS12, WS30, and WS15 with values of 433.7, 408.1, 405.6, 401.8, and 397 mm, respectively, in 2023. Differences in runoff water can be related to the different physical conditions between the thirty-seven catchments. According to the simulations, at stations WS02, WS36, WS31, WS29, and WS35, the annual runoff had increased by 66.5, 51.8, 48, 47.5, and 42.5%, respectively. Different characteristics in LULC provide different runoff values. The impact of the LULC change on the amount of runoff is shown in Figure 14a,b and Supplementary Material Table S1. WS37 showed almost no change in flow in the 20 years; this sub-watershed serves as a wetland catchment region and is a flood plain that is flooded for an extended period following the rainy season. Consequently, runoff increased by 0–66.5% as a result of the change in LULC between 2003 and 2023. As a result, variations in LULC and surface runoff volume are strongly correlated. The effect of LULC alterations on hydrological responses has been modelled in several other studies. For instance, Chotpantarat [78] revealed that runoff increased by 13–49% as a result of changes in land use. in part of the Yom River Basin, Thailand. Mishra [79] used the SWAT model to characterise the impact of LULC change on runoff in the Banha watershed in India. According to his study, runoff showed an increment ranging from 1.7% to 5.6% in the different sub-watersheds. The study by Sajikumar [80] performed similar work in the Manali and the Kurumali watersheds in India; the result showed that the runoff increased by 15%. A similar work by Getu [81] in Upper Baro Basin, Ethiopia, showed that there is an increase in surface runoff on average by 46.64 mm over 20 years.
B.
Sediment load
Figure 14c,d show the annual average sediment load simulated for each sub-watershed using the pre- and post-change LULC (2003–2023) and the percentage change in sediment load, respectively. The conversion of shrubs, forests, and grassland to agriculture and built-up areas indicates an increase of 147.3% for agriculture and 80.2% for built-up areas; this causes the yearly average sediment load values to rise by 23.89% within 20 years. The primary components of surface runoff and sediment yields are cropland and areas with no vegetation cover. Built-up areas constitute a large source of surface runoff but a relatively small contributor to sediment yields relative to runoff [82]. The available sediment sources are severely eroded by the increased runoff in urban areas [83].
Thus, the change in LULC from the 2003 coverage to the 2023 coverage resulted in a 25–27,298.7-tonnes increase in the average annual sediment yield at stations WS28 and WS35 (Figure 14). Similar to this study’s findings, previous studies by Kalsido [84] in Ethiopia, the effect of LULC dynamics on sedimentation in the Lake Ziway area showed that there is an increment of 1.5–2.03 mcm/yr. of sediment load within 30 years; a study by Tumsa [85] in Blue Nile Basin, Guder, Ethiopia, indicated that there is an increment of sediment yield by 138.92 t/ha within 18 years (2003–2021); according to an investigation by Mamo [85] in Blue Nile Basin, Fincha, Ethiopia, the average yearly soil loss rose from 34.5 to 58.7 t/ha/yr. in 1991–2021 (Figure 14).
C.
Nitrate and Phosphate Load
According to the simulation, the NO3 load increased from 127.6 kg/yr. (29%) to 20,739.7 kg/year (133.5%), in sub-watersheds WS08 and WS04, in all sub-watersheds. The highest nitrate load is observed for sub-watersheds WS04, WS12, WS30, WS32, WS22, and WS28, in average 20,739, 16,445.7, 11,144, 12,616, 10,852.6, and 14,327 in kg/yr., respectively, as discussed below. However, the highest increment rate was observed in sub-watersheds WS04 (15,527%), WS12 (12,254%), and WS28 (11,400%) (Figure 15).
The NO3 load increased in the sub-watershed WS04, which is at high elevation and contains the major urban expansion area in Addis Ababa. The main LULC change is cropland, which covers about 16,430.8 ha, followed by built-up area and bare land, which cover 5488.6 ha and 42.1 ha, respectively. Meanwhile, shrubland, forest land, and grassland decreased by 17,814 ha, 2561 ha, and 1593 ha, respectively. The LULC change in sub-watershed WS30 increased cropland and built-up area by 33,958.7 ha and 201.9 ha, respectively. But shrubland, grassland, and forest areas decreased by 30,791.4 ha, 3054.5 ha, and 292.7 ha, respectively. Sub-watersheds WS32, WS28, WS22, and WS12 showed that built-up area and cropland increased while forest, shrubland, and grasslands decreased. Sub-watershed WS32 has most of its LULC transformed into agricultural land (about 8811 ha), built-up area (155.3 ha), and bare land (198.6 ha). In addition, in these sub-watersheds, in the last 6 to 7 years, there has been an expansion of irrigated farming, especially along the Awash River, Mojo River, and Koka Reservoir.
The effect of LULC change from the 2003 to the 2023 map led to a simulated 4.27–349% increase in PO43− levels of the net contribution, increasing by 31 t/yr. in WS27, and 2459.7 t/yr. in WS04 (Figure 15). WS27 built-up area and agricultural land increased by 100% and 45.5%, respectively, with forest area, grassland, and shrubland decreasing by 87.5%, 100%, and 65%. In the WS04 sub-watershed built-up area, agricultural land and bare land increased by 149.5% and 75.6%, respectively, with forest land, grassland, and shrubland decreasing by 46.8%, 92.1%, and 50.8% (see Supplementary Material, Table S1). The model result shows that sub-watersheds W04 and WS12 showed high annual PO43− load by 2459.7 t/yr. and 1553 t/yr.; in terms of high increment in PO43− load, WS04 took the lead by 349% followed by WS32, WS18, and WS11 that showed an increment of 225.5%, 219%, and 185.6%, respectively. The quantity of phosphate in the study area generally increased; it was 5513 t/year for 2003 LULC conditions and 8215.4 t/yr. for 2023 conditions (Figure 15).
When NO3 is released into rivers from non-point sources, the resulting high load can be dangerous to human health when consumed through water. In addition to that, the study area’s southeastern parts, predominantly cropland, are growing vegetables and other crops using small-scale irrigation, potentially leading to an increase in elevated NO3 load in the river that could eventually result in eutrophication in the downstream areas, more specifically in Koka Reservoir [10,11,78].
In general, from the two nutrients (PO43− and NO3), it can be explained that most of the sub-watersheds showed the conversion of LULC from other uses to agriculture, and the built-up area contributed to the change and increase in the nutrients. This could be a release of wastewater and household sewerage effluents containing detergents and other cleaning products, in addition to being a major contributor of fertiliser application for crop production in rain-fed or irrigation practices.
D.
Load of total nitrogen and total phosphorous
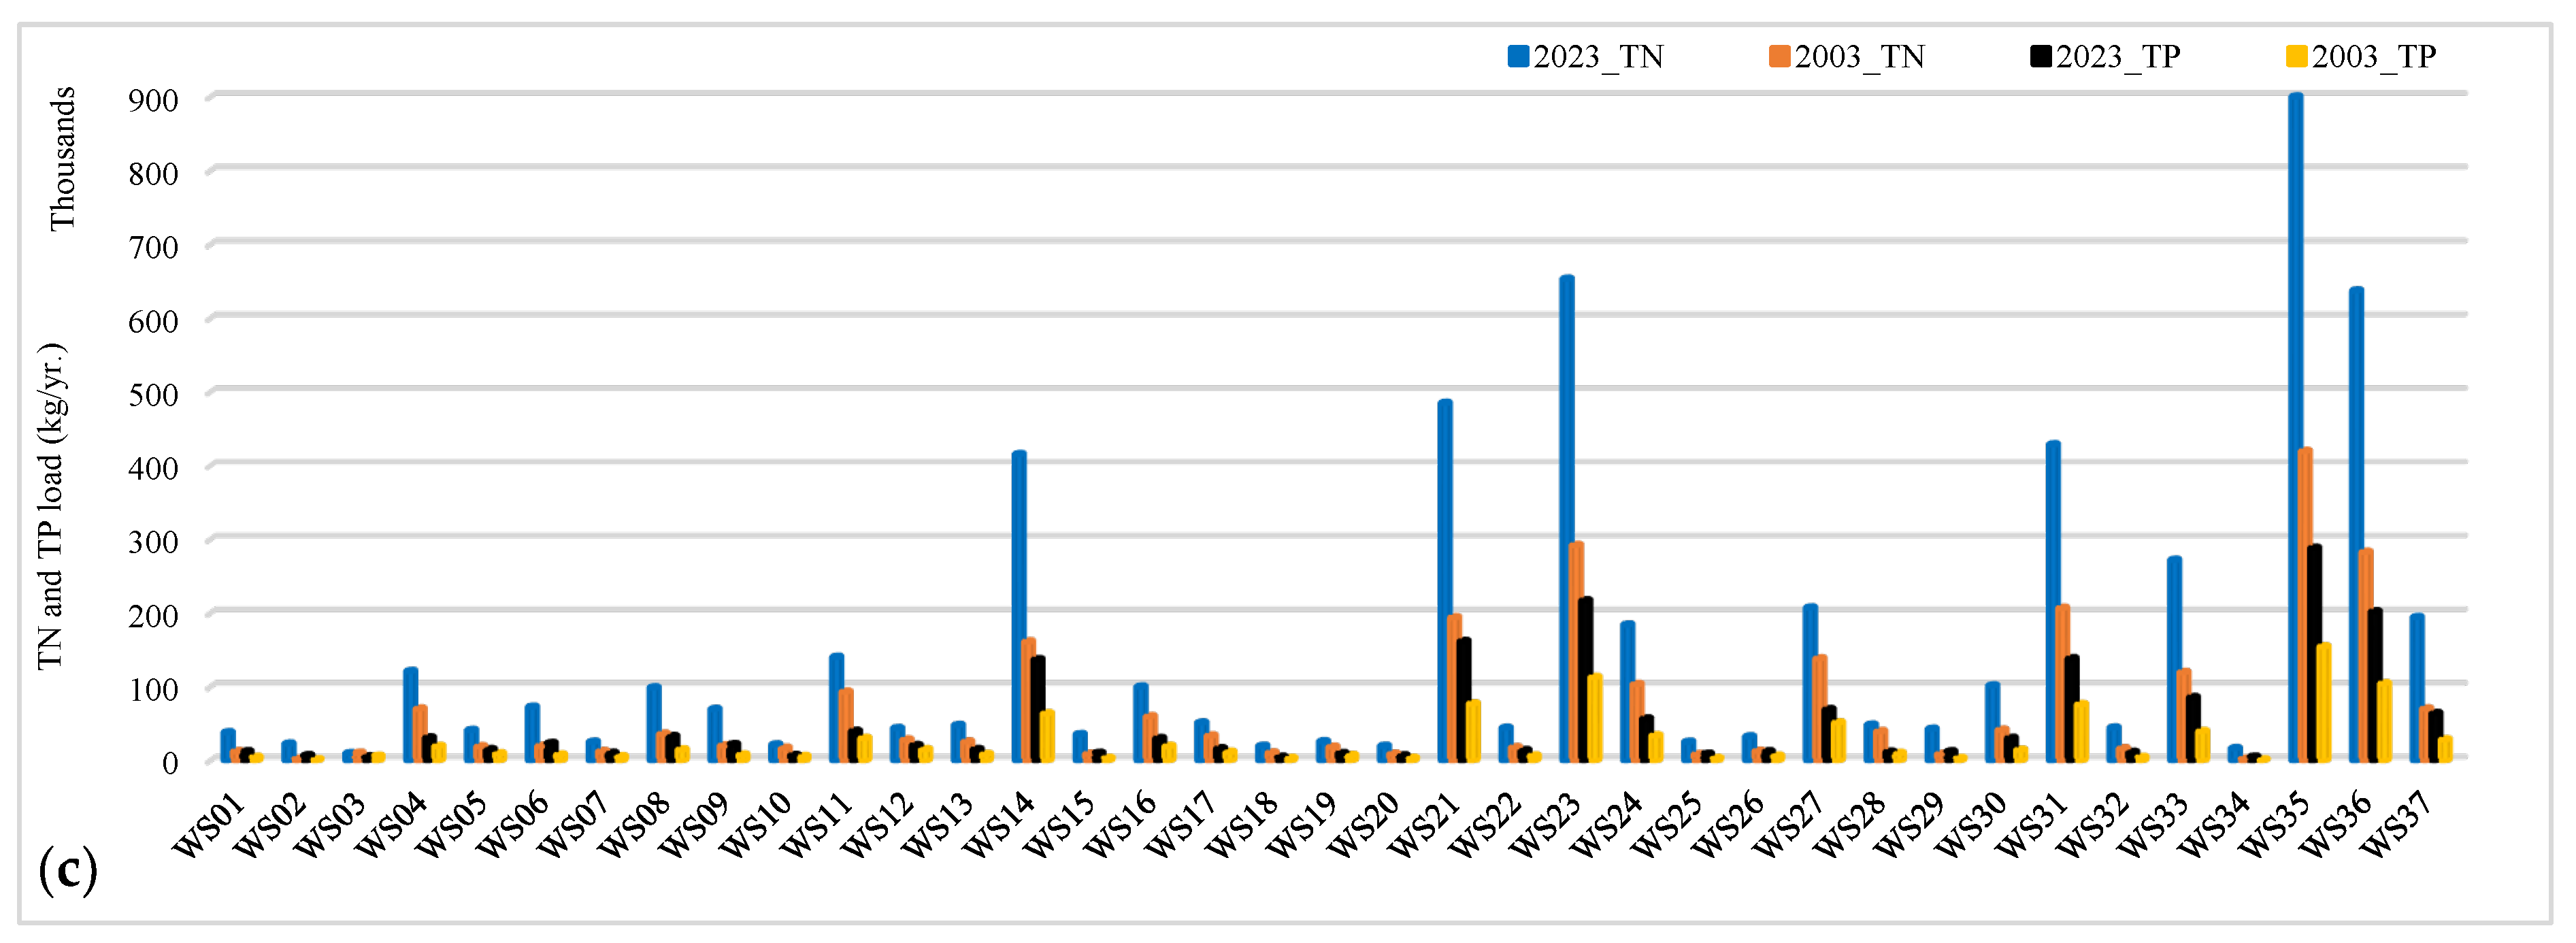
The simulated output of total nitrogen ranged from an increase of 22.2% (8736 kg/yr.) to 1201.5% (20,615 kg/yr.) for 2003 and 2023 LULC conditions in WS02 and WS28 sub-watersheds, respectively. The sub-watersheds mentioned earlier demonstrated an increase of 106,667.8 ha and 972.78 ha, respectively, in cropland and built-up areas. The lowest TN load increment was observed in sub-watersheds WS10, WS19, WS27, and WS11, which contributed 26.7% (4466 kg/yr.), 41.3% (7452 kg/yr.), 49.9% (68,929 kg/yr.), and 50.6% (47,020 kg/yr.), respectively, as shown in Figure 16.
The model output of TP indicated increasing, ranging from 1383.5 kg/yr. (25.66%) to 133,641.2 kg/yr. (86.6%). For 2003 and 2023, LULC conditions in sub-watersheds WS10 and WS35, respectively. WS04, WS06, WS08, WS09, WS14, WS16, and WS21, WS23, WS24, WS27, WS30, WS31, WS33, and WS35 to WS37 TP load was greater than 10,000 kg/yr., which had comparatively the highest TP change. The output of the TP increase is related to the change in LULC change, as shown in Figure 16.
The lowest surface runoff TP load increment lower than 40% was observed in sub-watersheds WS10, WS11, WS12, WS19, WS27, and WS28, which contributed 25.6 (1383.4 kg/yr.), 32.4 (9711.3 kg/yr.), 35.1 (17,967.8 kg/yr.), 18.9 (1818.9 kg/yr.), 37.1 (2539.1 kg/yr.), and 37.6% (5556.1 kg/yr.), respectively. The LULC change in the six sub-watersheds showed an increment of 9443.8 ha built-up area and 28,289 ha agricultural land.

5. Conclusions

A 991,804.6 ha in the study area was used to parameterise, calibrate, and validate the SWAT model to predict the effect of LULC transformation on runoff, sediment load, and surface runoff non-point source chemical pollutants load such as PO4, NO3, TP, and TN. Following the recommendations made by Moriasi (2007) [57], statistical evaluation of the model output was approved following the calibration and validation procedures. To ascertain if the model satisfied the suggested thresholds, the following statistical measures were employed in this study: P-factor, r-factor, R2, RSR, PBIAS, and NSE. For instance, the NSE value of the sediment load throughout the calibration and validation periods is represented by the SWAT model performance indicator, which is 0.7 and 0.64, respectively. Similarly, throughout the calibration and validation period, the NSE values of NO3, PO4, TN, and TP load were (0.66, 0.52), (0.64, 0.6), (0.61, 0.65), and (0.54, 0.63), respectively. The findings showed that SWAT can estimate the rate of changes in sediment and nutrient loads between 2003 and 2023 with adequate accuracy.
LULC changes at a sub-watershed level by varying ranges of load had an impact on runoff and non-point source pollutant loading, including sediment, PO4, NO3, TP, and TN, as results revealed. The growth of built-up areas in response to the need for settlement and the rising change in agricultural land were the main causes of the increases in runoff volume, sediment, PO4, NO3, TP, and TN over two decades. Higher nutrient loads resulted from increased cropland areas in 2023 compared to 2003 (77.9% and 31.46%, respectively) and increased built-up areas in 2023 compared to 2003 (4.54% and 2.52%, respectively). The non-point source result showed that agricultural areas contribute significantly to the creation of NPSP since crop fertilisation is primarily dependent on inorganic fertilisers and that priority source areas in the study area are mainly connected to densely populated human settlements.
The findings indicate there was a direct correlation between runoff and the occurrence of diffuse source pollution. However, this fact cannot be applied to all non-point source pollutants, as the nitrate load example illustrates. The monthly examination of nitrate load revealed that the “Belg” season had a high nitrate load. This is because the nitrogen pool process and the timing of nitrification cause a rise in nitrate levels during the off-growing season. This study indicated that diffuse source contaminant loads in the upper Awash generally happened during the rainy season, except for nitrate loads. Consequently, it is possible to view the wet season as a critical time for preventing nutrient loss.
The evidence generated can be used by planners and policymakers when developing management plans for reducing runoff and sediment yields in the watershed, as well as for managing fertiliser application in cropland areas to reduce diffused source chemical pollutants and increase the efficiency with which rain-fed crops use nutrients. Nutrient management and planning must be used to apply the right amounts of nutrients to the soil following crop nutrient requirements to avoid contaminating water bodies. To implement these practices, we must follow the principles of nutrient management, which include choosing and utilising the right rate, right place, right time, and a variety of organic sources of nutrients, such as organic manure amendments, understanding the soil and landscape features, identifying the soil fertility reserves, and recognising the crop’s nutrient requirements. We also need to adjust application tools to determine the appropriate amount to apply, use the best management techniques (preventive measures) while providing nutrients, and adopt the best soil and water conservation practices to prevent nutrient leaching. Furthermore, drip irrigation systems can distribute liquid fertilisers via the irrigation water on farms that use irrigation. By delivering nutrients straight to the root zone, this method lowers nutrient loss.

Supplementary Materials

The following supporting information can be downloaded at https://www.mdpi.com/article/10.3390/w16233447/s1, Table S1: LULC change from 2003 to 2023.

Author Contributions

Investigation, conceptualisation, data curation, methodology software, formal analysis, visualisation, writing—original draft, E.A.; funding acquisition, G.Z.; project administration, B.K.D.; supervision, T.A. and G.Z.; writing—review and editing, T.A., G.O., C.L.W. and B.K.D. All authors have read and agreed to the published version of the manuscript.

Funding

This work was supported by the Water Security and Sustainable Development Hub funded by the UK Research and Innovation’s Global Challenges Research Fund (GCRF) (Grant Number: ES/S008179/1).

Data Availability Statement

The original contributions presented in the study are included in the article; further inquiries can be directed to the corresponding author.

Acknowledgments

The writers kindly acknowledge the Water and Land Resource Center’s services and facilities.

Conflicts of Interest

The authors declare no conflicts of interest.

References

  1. Pulighe, G.; Bonati, G.; Colangeli, M.; Traverso, L.; Lupia, F.; Altobelli, F.; Marta, A.D.; Napoli, M. Predicting streamflow and nutrient loadings in a semi-arid Mediterranean watershed with ephemeral streams using the SWAT model. Agronomy 2020, 10, 2. [Google Scholar] [CrossRef]
  2. Sharifinia, M.; Adeli, B.; Nafarzadegan, A.R. Evaluation of water quality trends in the Maroon River Basin, Iran, from 1990 to 2010 by WQI and multivariate analyses. Environ. Earth Sci. 2017, 76, 781. [Google Scholar] [CrossRef]
  3. Sharifinia, M.; Zohreh, R.; Javid, I.; Abbas, M.; Tahsin, R. Water quality assessment of the Zarivar Lake using physico-chemical parameters and NSF- WQI indicator, Kurdistan Province-Iran. Int. J. Adv. Biol. Biomed. Res. 2013, 1, 302–312. [Google Scholar]
  4. Vagstad, N.; Stålnacke, P.; Andersen, H.E.; Deelstra, J.; Jansons, V.; Kyllmar, K.; Loigu, E.; Rekolainen, S.; Tumas, R. Regional variations in diffuse nitrogen losses from agriculture in the Nordic and Baltic regions. Hydrol. Earth Syst. Sci. 2004, 8, 651–662. [Google Scholar] [CrossRef]
  5. Liu, Y.; Li, H.; Cui, G.; Cao, Y. Water quality attribution and simulation of non-point source pollution load flux in the Hulan River basin. Sci. Rep. 2020, 10, 3012. [Google Scholar] [CrossRef]
  6. Sorando, R.; Comín, F.A.; Jiménez, J.J.; Sánchez-Pérez, J.M.; Sauvage, S. Water resources and nitrate discharges in relation to agricultural land uses in an intensively irrigated watershed. Sci. Total Environ. 2019, 659, 1293–1306. [Google Scholar] [CrossRef]
  7. Li, J.; Li, H.; Shen, B.; Li, Y. Effect of non-point source pollution on water quality of the Weihe River. Int. J. Sediment Res. 2011, 26, 50–61. [Google Scholar] [CrossRef]
  8. Hou, L.; Zhou, Z.; Wang, R.; Li, J.; Dong, F.; Liu, J. Research on the Non-Point Source Pollution Characteristics of Important Drinking Water Sources. Water 2022, 14, 211. [Google Scholar] [CrossRef]
  9. Han, L.X.; Huo, F.; Sun, J. Method for calculating non-point source pollution distribution in plain rivers. Water Sci. Eng. 2011, 4, 83–91. [Google Scholar] [CrossRef]
  10. Assegide; Alamirew, T.; Dile, Y.T.; Bayabil, H.; Tessema, B.; Zeleke, G. A Synthesis of Surface Water Quality in Awash Basin, Ethiopia. Front. Water 2022, 4, 782124. [Google Scholar] [CrossRef]
  11. Assegide; Alamirew; Bayabil, H.; Dile, Y.T.; Tessema, B.; Zeleke, G. Impacts of Surface Water Quality in the Awash River Basin, Ethiopia: A Systematic Review. Front. Water 2022, 3, 790900. [Google Scholar] [CrossRef]
  12. Ligdi, E.E.; El Kahloun, M.; Meire, P. Ecohydrological status of Lake Tana—A shallow highland lake in the Blue Nile (Abbay) basin in Ethiopia: Review. Ecohydrol. Hydrobiol. 2010, 10, 109–122. [Google Scholar] [CrossRef]
  13. Legesse, E.E.; Srivastava, A.K.; Kuhn, A.; Gaiser, T. Household welfare implications of better fertilizer access and lower use inefficiency: Long-term scenarios for Ethiopia. Sustainability 2019, 11, 3952. [Google Scholar] [CrossRef]
  14. Ongley, E.D.; Xiaolan, Z.; Tao, Y. Current status of agricultural and rural non-point source Pollution assessment in China. Environ. Pollut. 2010, 158, 1159–1168. [Google Scholar] [CrossRef]
  15. Wang, A.; Tang, L.; Yang, D. Spatial and temporal variability of nitrogen load from catchment and retention along a river network: A case study in the upper Xin’anjiang catchment of China. Hydrol. Res. 2016, 47, 869–887. [Google Scholar] [CrossRef]
  16. Sebilo, M.; Mayer, B.; Nicolardot, B.; Pinay, G.; Mariotti, A. Long-term fate of nitrate fertilizer in agricultural soils. Proc. Natl. Acad. Sci. USA 2013, 110, 18185–18189. [Google Scholar] [CrossRef]
  17. Jenkinson, D.S.; Parry, L.C. The nitrogen cycle in the broadbalk wheat experiment: A model for the turnover of nitrogen through the soil microbial biomass. Soil Biol. Biochem. 1989, 21, 535–541. [Google Scholar] [CrossRef]
  18. Belete, F.; Dechassa, N.; Molla, A.; Tana, T. Effect of nitrogen fertilizer rates on grain yield and nitrogen uptake and use efficiency of bread wheat (Triticum aestivum L.) varieties on the Vertisols of central highlands of Ethiopia. Agric. Food Secur. 2018, 7, 78. [Google Scholar] [CrossRef]
  19. Giordano, M.; Petropoulos, S.A.; Rouphael, Y. The fate of nitrogen from soil to plants: Influence of agricultural practices in modern agriculture. Agriculture 2021, 11, 944. [Google Scholar] [CrossRef]
  20. Neitsch, S.; Arnold, J.; Kiniry, J.; Williams, J. Soil & Water Assessment Tool Theoretical Documentation Version 2009; Texas Water Resources Institute: College Station, TX, USA, 2011; pp. 1–647. [Google Scholar] [CrossRef]
  21. Adimassu, Z.; Langan, S.; Johnston, R.; Mekuria, W.; Amede, T. Impacts of Soil and Water Conservation Practices on Crop Yield, Run-off, Soil Loss and Nutrient Loss in Ethiopia: Review and Synthesis. Environ. Manag. 2017, 59, 87–101. [Google Scholar] [CrossRef]
  22. Hurni, K.; Zeleke, G.; Kassie, M.; Tegegne, B.; Kassawmar, T.; Teferi, E.; Moges, A.; Tadesse, D.; Ahmed, M.; Degu, Y.; et al. The Economics of Land Degradation. Ethiopia Case Study. Soil Degradation and Sustainable Land Management in the Rainfed Agricultural Areas of Ethiopia: An Assessment of the Economic Implications; Water and Land Resource Centre (WLRC): Bonn, Deutschland; Centre for Development and Environment (CDE): Bonn, Deutschland; Deutsche Gesellschaft für Internationale Zusammenarbeit (GIZ): Bonn, Deutschland, 2015. [Google Scholar]
  23. Tamene, L.; Abera, W.; Demissie, B.; Desta, G.; Woldearegay, K.; Mekonnen, K. Soil erosion assessment in Ethiopia: A review. J. Soil Water Conserv. 2022, 77, 144–157. [Google Scholar] [CrossRef]
  24. Bihonegn, B.G.; Awoke, A.G. Evaluating the impact of land use and land cover changes on sediment yield dynamics in the upper Awash basin, Ethiopia the case of Koka reservoir. Heliyon 2023, 9, e23049. [Google Scholar] [CrossRef] [PubMed]
  25. Jilo, N.B.; Gurara, M.A.; Tolche, A.D.; Harka, A.E. Impacts of Management Scenarios on Sediment Yield Simulation in Upper and Middle Awash River Basin, Ethiopia. Ecohydrol. Hydrobiol. 2022, 22, 269–282. [Google Scholar] [CrossRef]
  26. Rothman, N.; Rothstein, D.; Foor, F.; Magasanik, B. Water Quality Assessments—A Guide to Use of Biota, Sediments and Water in Environmental Monitoring—Second Edition. J. Bacteriol. 1982, 150, 221–230. [Google Scholar] [CrossRef]
  27. Tolera, M.B.; Chung, I.M.; Chang, S.W. Evaluation of the climate forecast system reanalysis weather data for watershed modeling in Upper Awash Basin, ethiopia. Water 2018, 10, 725. [Google Scholar] [CrossRef]
  28. Chan, W.C.H.; Thompson, J.R.; Taylor, R.G.; Nay, A.E.; Ayenew, T.; MacDonald, A.M.; Todd, M.C. Uncertainty assessment in river flow projections for Ethiopia’s Upper Awash Basin using multiple GCMs and hydrological models. Hydrol. Sci. J. 2020, 65, 1720–1737. [Google Scholar] [CrossRef]
  29. Arnold, J.G.; Srinivasan, R.; Muttiah, R.S.; Williams, J.R. Large area Hydrologic Modeling and Assessment Part I: Model development. Am. Water Resour. Assoc. 1998, 34, 73–89. [Google Scholar] [CrossRef]
  30. Mohammad, M.E.; Al-Ansari, N.; Knutsson, S. Application of SWAT model to estimate the annual runoff and sediment of Duhok reservoir watershed. In Proceedings of the 8th International Conference on Scour and Erosion, Oxford, UK, 12–15 September 2016; pp. 1129–1136. [Google Scholar] [CrossRef]
  31. Uribe, N.; Corzo, G.; Quintero, M.; van Griensven, A.; Solomatine, D. Impact of conservation tillage on nitrogen and phosphorus runoff losses in a potato crop system in Fuquene watershed, Colombia. Agric. Water Manag. 2018, 209, 62–72. [Google Scholar] [CrossRef]
  32. Tessema, S.M.; Setegn, S.G.; Mörtberg, U. Watershed modeling as a tool for sustainable water resources management: SWAT model application in the awash river basin, Ethiopia. In Sustainability of Integrated Water Resources Management: Water Governance, Climate and Ecohydrology; Springer International Publishing: Berlin/Heidelberg, Germany, 2015; pp. 579–606. [Google Scholar] [CrossRef]
  33. Alves, G.J.; Rogério de Mello, C.; Beskow, S.; Junqueira, J.A.; Nearing, M.A. Assessment of the soil conservation service–curve number method performance in a tropical oxisol watershed. J. Soil Water Conserv. 2019, 74, 500–512. [Google Scholar] [CrossRef]
  34. Green, W.H.; Ampt, G. Studies on soil physics (Part I): The flow of Air and Water Through Soil. J. Agric. Sci. 2011, 4, 1–24. [Google Scholar]
  35. Hargreaves, G.H.; Samani, Z.A. Reference Crop Evapotranspiration From Ambient Air Temperature. Pap.-Am. Soc. Agric. Eng. 1985, 1, 96–99. [Google Scholar] [CrossRef]
  36. Attanasi, E.D.; Johnson, S.R.; Leduc, S.; Mcquigg, J.D. Forecasting Work Conditions for Road Construction Activities: An Application of Alternative Probability Models. Mon. Weather Rev. 1973, 101, 223–230. [Google Scholar] [CrossRef]
  37. Williams, J.R. Flood Routing with Variable Travel Time or Variable Storage Coefficients. Trans. ASAE 1969, 12, 0100–0103. [Google Scholar] [CrossRef]
  38. Winchell, M.F.; Peranginangin, N.; Srinivasan, R.; Chen, W. Soil and Water Assessment Tool model predictions of annual maximum pesticide concentrations in high vulnerability watersheds. Integr. Environ. Assess. Manag. 2018, 14, 358–368. [Google Scholar] [CrossRef]
  39. Ouyang, Y. A Gap-Filling Tool: Predicting Daily Sediment Loads Based on Sparse Measurements. Hydrology 2022, 9, 181. [Google Scholar] [CrossRef]
  40. Kaleab, H.; Mamo, M.; Jain, M. Runoff and Sediment Modeling Using SWAT in Gumera Catchment, Ethiopia. Open J. Mod. Hydrol. 2013, 3, 196–205. [Google Scholar] [CrossRef]
  41. Wang, G.; Jager, H.I.; Baskaran, L.M.; Baker, T.F.; Brandt, C.C. SWAT Modeling of Water Quantity and Quality in the Tennessee River Basin: Spatiotemporal Calibration and Validation. Hydrol. Earth Syst. Sci. Discuss. 2016, 2016, 1–33. [Google Scholar] [CrossRef]
  42. Noori, N.; Kalin, L.; Isik, S. Water quality prediction using SWAT-ANN coupled approach. J. Hydrol. 2020, 590, 125220. [Google Scholar] [CrossRef]
  43. Kim, J.; Lim, K.J.; Park, Y.S. Evaluation of Regression Models of LOADEST and Eight-Parameter Model for Nitrogen Load Estimations. Water Air Soil Pollut. 2018, 229, 179. [Google Scholar] [CrossRef]
  44. Han, Y.; Liu, Z.; Chen, Y.; Li, Y.; Liu, H.; Song, L.; Chen, Y. Assessing non-point source pollution in an apple-dominant basin and associated best fertilizer management based on SWAT modeling. Int. Soil Water Conserv. Res. 2023, 11, 353–364. [Google Scholar] [CrossRef]
  45. Lee, S.; Yeo, I.Y.; Sadeghi, A.M.; McCarty, G.W.; Hively, W.D.; Lang, M.W.; Sharifi, A. Comparative analyses of hydrological responses of two adjacent watersheds to climate variability and change using the SWAT model. Hydrol. Earth Syst. Sci. 2018, 22, 689–708. [Google Scholar] [CrossRef]
  46. Abbaspour, K.C.; Yang, J.; Maximov, I.; Siber, R.; Bogner, K.; Mieleitner, J.; Zobrist, J.; Srinivasan, R. Modelling hydrology and water quality in the pre-alpine/alpine Thur watershed using SWAT. J. Hydrol. 2007, 333, 413–430. [Google Scholar] [CrossRef]
  47. Thavhana, M.P.; Savage, M.J.; Moeletsi, M.E. SWAT model uncertainty analysis, calibration and validation for runoff simulation in the Luvuvhu River catchment, South Africa. Phys. Chem. Earth 2018, 105, 115–124. [Google Scholar] [CrossRef]
  48. Narsimlu, B.; Gosain, A.K.; Chahar, B.R.; Singh, S.K.; Srivastava, P.K. SWAT Model Calibration and Uncertainty Analysis for Streamflow Prediction in the Kunwari River Basin, India, Using Sequential Uncertainty Fitting. Environ. Process. 2015, 2, 79–95. [Google Scholar] [CrossRef]
  49. Gholami, A.; Habibnejad Roshan, M.; Shahedi, K.; Vafakhah, M.; Solaymani, K. Hydrological stream flow modeling in the Talar catchment (central section of the Alborz Mountains, north of Iran): Parameterization and uncertainty analysis using SWAT-CUP. J. Water Land Dev. 2016, 30, 57–69. [Google Scholar] [CrossRef]
  50. Emiru, N.C.; Recha, J.W.; Thompson, J.R.; Belay, A.; Aynekulu, E.; Manyevere, A.; Demissie, T.D.; Osano, P.M.; Hussein, J.; Molla, M.B.; et al. Impact of Climate Change on the Hydrology of the Upper Awash River Basin, Ethiopia. Hydrology 2022, 9, 3. [Google Scholar] [CrossRef]
  51. Arnold, J.G.; Moriasi, D.N.; Gassman, P.W.; Abbaspour, K.C.; White, M.J.; Srinivasan, R.; Santhi, C.; Harmel, R.D.; van Griensven, A.; Van Liew, M.W.; et al. SWAT: Model use, calibration, and validation. Trans. ASABE 2012, 55, 1491–1508. [Google Scholar] [CrossRef]
  52. Maroneze, M.M.; Zepka, L.Q.; Vieira, J.G.; Queiroz, M.I.; Jacob-Lopes, E. Sensitivity analysis of the Soil and Water Assessment Tools (SWAT) model in streamflow modeling in a rural river basin. Rev. Ambiente Agua 2014, 9, 445–458. [Google Scholar] [CrossRef]
  53. Cui, X.; Sun, W.; Teng, J.; Song, H.; Yao, X. Effect of length of the observed dataset on the calibration of a distributed hydrological model. IAHS-AISH Proc. Rep. 2015, 368, 305–311. [Google Scholar] [CrossRef]
  54. Misaghi, F.; Nasrabadi, M.; Nouri, M. Application of swat model to simulate nitrate and phosphate leaching from agricultural lands to the rivers. Adv. Environ. Technol. 2020, 6, 1–17. [Google Scholar] [CrossRef]
  55. Abbaspour, K.C. SWAT-CUP: SWAT Calibration and Uncertainty Programs—A User Manual; Swiss Federal Institute of Aquatic Science and Technology: Eawag, Switzerland, 2015. [Google Scholar]
  56. Abbaspour, K.C. A Package of Calibration Procedures Linked to SWAT Through a Generic Platform to Perform Calibration, Validation, and Uncertainty Analysis SWAT-CUP. 2012. Available online: https://envirogrids.net/envirogrids_d4.5_calibration_swat_cupdfb0.pdf?option=com_jdownloads&Itemid=13&view=finish&cid=145&catid=13 (accessed on 27 March 2023).
  57. Takele, L.; Kebede, M. Streamflow Modeling of Upper Awash River Basin Using Soil and Water Assessment Tool. Appl. J. Environ. Eng. Sci. 2018, 4, 456–466. [Google Scholar]
  58. Moriasi, D.N.; Arnold, J.G.; Van Liew, M.W.; Bingner, R.L.; Harmel, R.D.; Veith, T.L. Model Evaluation Guidelines for Systematic Quantification of Accuracy in Watershed Simulations. Trans. ASABE 2007, 50, 885–900. [Google Scholar] [CrossRef]
  59. Veltman, K.; Rotz, C.A.; Chase, L.; Cooper, J.; Ingraham, P.; Izaurralde, R.C.; Jones, C.D.; Gaillard, R.; Larson, R.A.; Ruark, M.; et al. A quantitative assessment of Beneficial Management Practices to reduce carbon and reactive nitrogen footprints and phosphorus losses on dairy farms in the US Great Lakes region. Agric. Syst. 2018, 166, 10–25. [Google Scholar] [CrossRef]
  60. Cooper, M. Multi-variable and multi-site calibration and validation of SWAT in a large mountainous catchment with high spatial variability. Hydrol. Process. 2007, 2274, 2267–2274. [Google Scholar]
  61. Im, S.; Brannan, K.M.; Mostaghimi, S.; Kim, S.M. Comparison of HSPF and SWAT models performance for runoff and sediment yield prediction. J. Environ. Sci. Health—Part A Toxic/Hazardous Subst. Environ. Eng. 2007, 42, 1561–1570. [Google Scholar] [CrossRef]
  62. Coffey, M.E.; Workman, S.R.; Taraba, J.L.; Fogle, A.W. Statistical Procedures for Evaluating Daily and Monthly Hydrologic Model Predictions. Trans. ASABE 2004, 47, 59–68. [Google Scholar] [CrossRef]
  63. Legates, G. Evaluating the use of “goodness-of-fit” measures in hydrologic and hydroclimatic model validation. Water Resour. Res. 2007, 35, 233–241. [Google Scholar] [CrossRef]
  64. Mendez, M.; Calvo-Valverde, L.A.; Imbach, P.; Maathuis, B.; Hein-Grigg, D.; Hidalgo-Madriz, J.A.; Alvarado-Gamboa, L.F. Hydrological Response of Tropical Catchments to Climate Change as Modeled by the GR2M Model: A Case Study in Costa Rica. Sustainability 2022, 14, 16938. [Google Scholar] [CrossRef]
  65. Golmohammadi, G.; Prasher, S.; Madani, A.; Rudra, R. Evaluating Three Hydrological Distributed Watershed Models: MIKE-SHE, APEX, SWAT. Hydrology 2014, 1, 20–39. [Google Scholar] [CrossRef]
  66. Almeida, R.A.; Pereira, S.B.; Pinto, D.B.F. Calibration and validation of the SWAT hydrological model for the Mucuri river basin. Eng. Agric. 2018, 38, 55–63. [Google Scholar] [CrossRef]
  67. Tang, F.F.; Xu, H.S.; Xu, Z.X. Model calibration and uncertainty analysis for runoff in the Chao River Basin using sequential uncertainty fitting. Procedia Environ. Sci. 2012, 13, 1760–1770. [Google Scholar] [CrossRef]
  68. El-Sadek, A.; Irvem, A. Evaluating the impact of land use uncertainty on the simulated streamflow and sediment yield of the Seyhan River basin using the SWAT model. Turk. J. Agric. For. 2014, 38, 515–530. [Google Scholar] [CrossRef]
  69. Mapes, K.L.; Pricope, N.G. Evaluating SWAT model performance for runoff, percolation, and sediment loss estimation in low-gradientwatersheds of the Atlantic Coastal Plain. Hydrology 2020, 7, 21. [Google Scholar] [CrossRef]
  70. Kefay, T.; Abdisa, T.; Tumsa, B.C. Prioritization of Susceptible Watershed to Sediment Yield and Evaluation of Best Management Practice: A Case Study of Awata River, Southern Ethiopia. Appl. Environ. Soil Sci. 2022, 2022, 945. [Google Scholar] [CrossRef]
  71. Gonfa, Z.B.; Kumar, D. Application of Soil and Water Assessment Tool Model to Estimate Runoff and Sediment Yield from Mojo Watershed. Int. J. Innov. Res. Sci. Eng. Technol. 2016, 5, 2081–2091. [Google Scholar] [CrossRef]
  72. Leta, M.K.; Ebsa, D.G.; Regasa, M.S. Parameter Uncertainty Analysis for Streamflow Simulation Using SWAT Model in Nashe Watershed, Blue Nile River Basin, Ethiopia. Appl. Environ. Soil Sci. 2022, 2022, 6942. [Google Scholar] [CrossRef]
  73. Abbaspour, K.C.; Rouholahnejad, E.; Vaghefi, S.; Srinivasan, R.; Yang, H.; Kløve, B. A continental-scale hydrology and water quality model for Europe: Calibration and uncertainty of a high-resolution large-scale SWAT model. J. Hydrol. 2015, 524, 733–752. [Google Scholar] [CrossRef]
  74. Moriasi, D.N.; Gitau, M.W.; Pai, N.; Daggupati, P. Hydrologic and water quality models: Performance measures and evaluation criteria. Trans. ASABE 2015, 58, 1763–1785. [Google Scholar] [CrossRef]
  75. Chekol, D.A.; Tischbein, B.; Eggers, H.; Vlek, P. Application of SWAT for assessment of spatial distribution of water resources and analyzing impact of different land management practices on soil erosion in Upper Awash River Basin watershed. FWU Water Resour. Publ. 2007, 6, 110–117. [Google Scholar]
  76. Jilo, N.B.; Gebremariam, B.; Harka, A.E.; Woldemariam, G.W.; Behulu, F. Evaluation of the impacts of climate change on sediment yield from the Logiya Watershed, Lower Awash Basin, Ethiopia. Hydrology 2019, 6, 81. [Google Scholar] [CrossRef]
  77. Chotpantarat, S.; Boonkaewwan, S. Impacts of land-use changes on watershed discharge and water quality in a large intensive agricultural area in Thailand. Hydrol. Sci. J. 2018, 63, 1386–1407. [Google Scholar] [CrossRef]
  78. Sattari, S.Z.; Bouwman, A.F.; Giller, K.E.; Van Ittersum, M.K. Residual soil phosphorus as the missing piece in the global phosphorus crisis puzzle. Proc. Natl. Acad. Sci. USA 2012, 109, 6348–6353. [Google Scholar] [CrossRef] [PubMed]
  79. Mishra, A.; Kar, S.; Singh, V.P. Prioritizing structural management by quantifying the effect of land use and land cover on watershed runoff and sediment yield. Water Resour. Manag. 2007, 21, 1899–1913. [Google Scholar] [CrossRef]
  80. Sajikumar, N.; Remya, R.S. Impact of land cover and land use change on runoff characteristics. J. Environ. Manag. 2015, 161, 460–468. [Google Scholar] [CrossRef] [PubMed]
  81. Getu Engida, T.; Nigussie, T.A.; Aneseyee, A.B.; Barnabas, J. Land Use/Land Cover Change Impact on Hydrological Process in the Upper Baro Basin, Ethiopia. Appl. Environ. Soil Sci. 2021, 2021, 6617541. [Google Scholar] [CrossRef]
  82. Chelkeba Tumsa, B. The Response of Sensitive LULC Changes to Runoff and Sediment Yield in a Semihumid Urban Watershed of the Upper Awash Subbasin Using the SWAT+ Model, Oromia, Ethiopia. Appl. Environ. Soil Sci. 2023, 2023, 6856144. [Google Scholar] [CrossRef]
  83. Santos, F.M.; de Oliveira, R.P.; Di Lollo, J.A. Effects of land use changes on streamflow and sediment yield in Atibaia River Basin-SP, Brazil. Water 2020, 12, 1711. [Google Scholar] [CrossRef]
  84. Kalsido, T.; Berhanu, B. Impact of Land-Use Changes on Sediment Load and Capacity Reduction of Lake Ziway, Ethiopia. Nat. Resour. 2020, 11, 530–542. [Google Scholar] [CrossRef]
  85. Tumsa, B.C.; Feyessa, F.F.; Tullu, K.T.; Guder, A.C. Spatiotemporal changes of land use in response to runoff and sediment yield for environmental sustainability in the upper Blue Nile Basin, Oromiyaa, Ethiopia. H2Open J. 2023, 6, 551–575. [Google Scholar] [CrossRef]
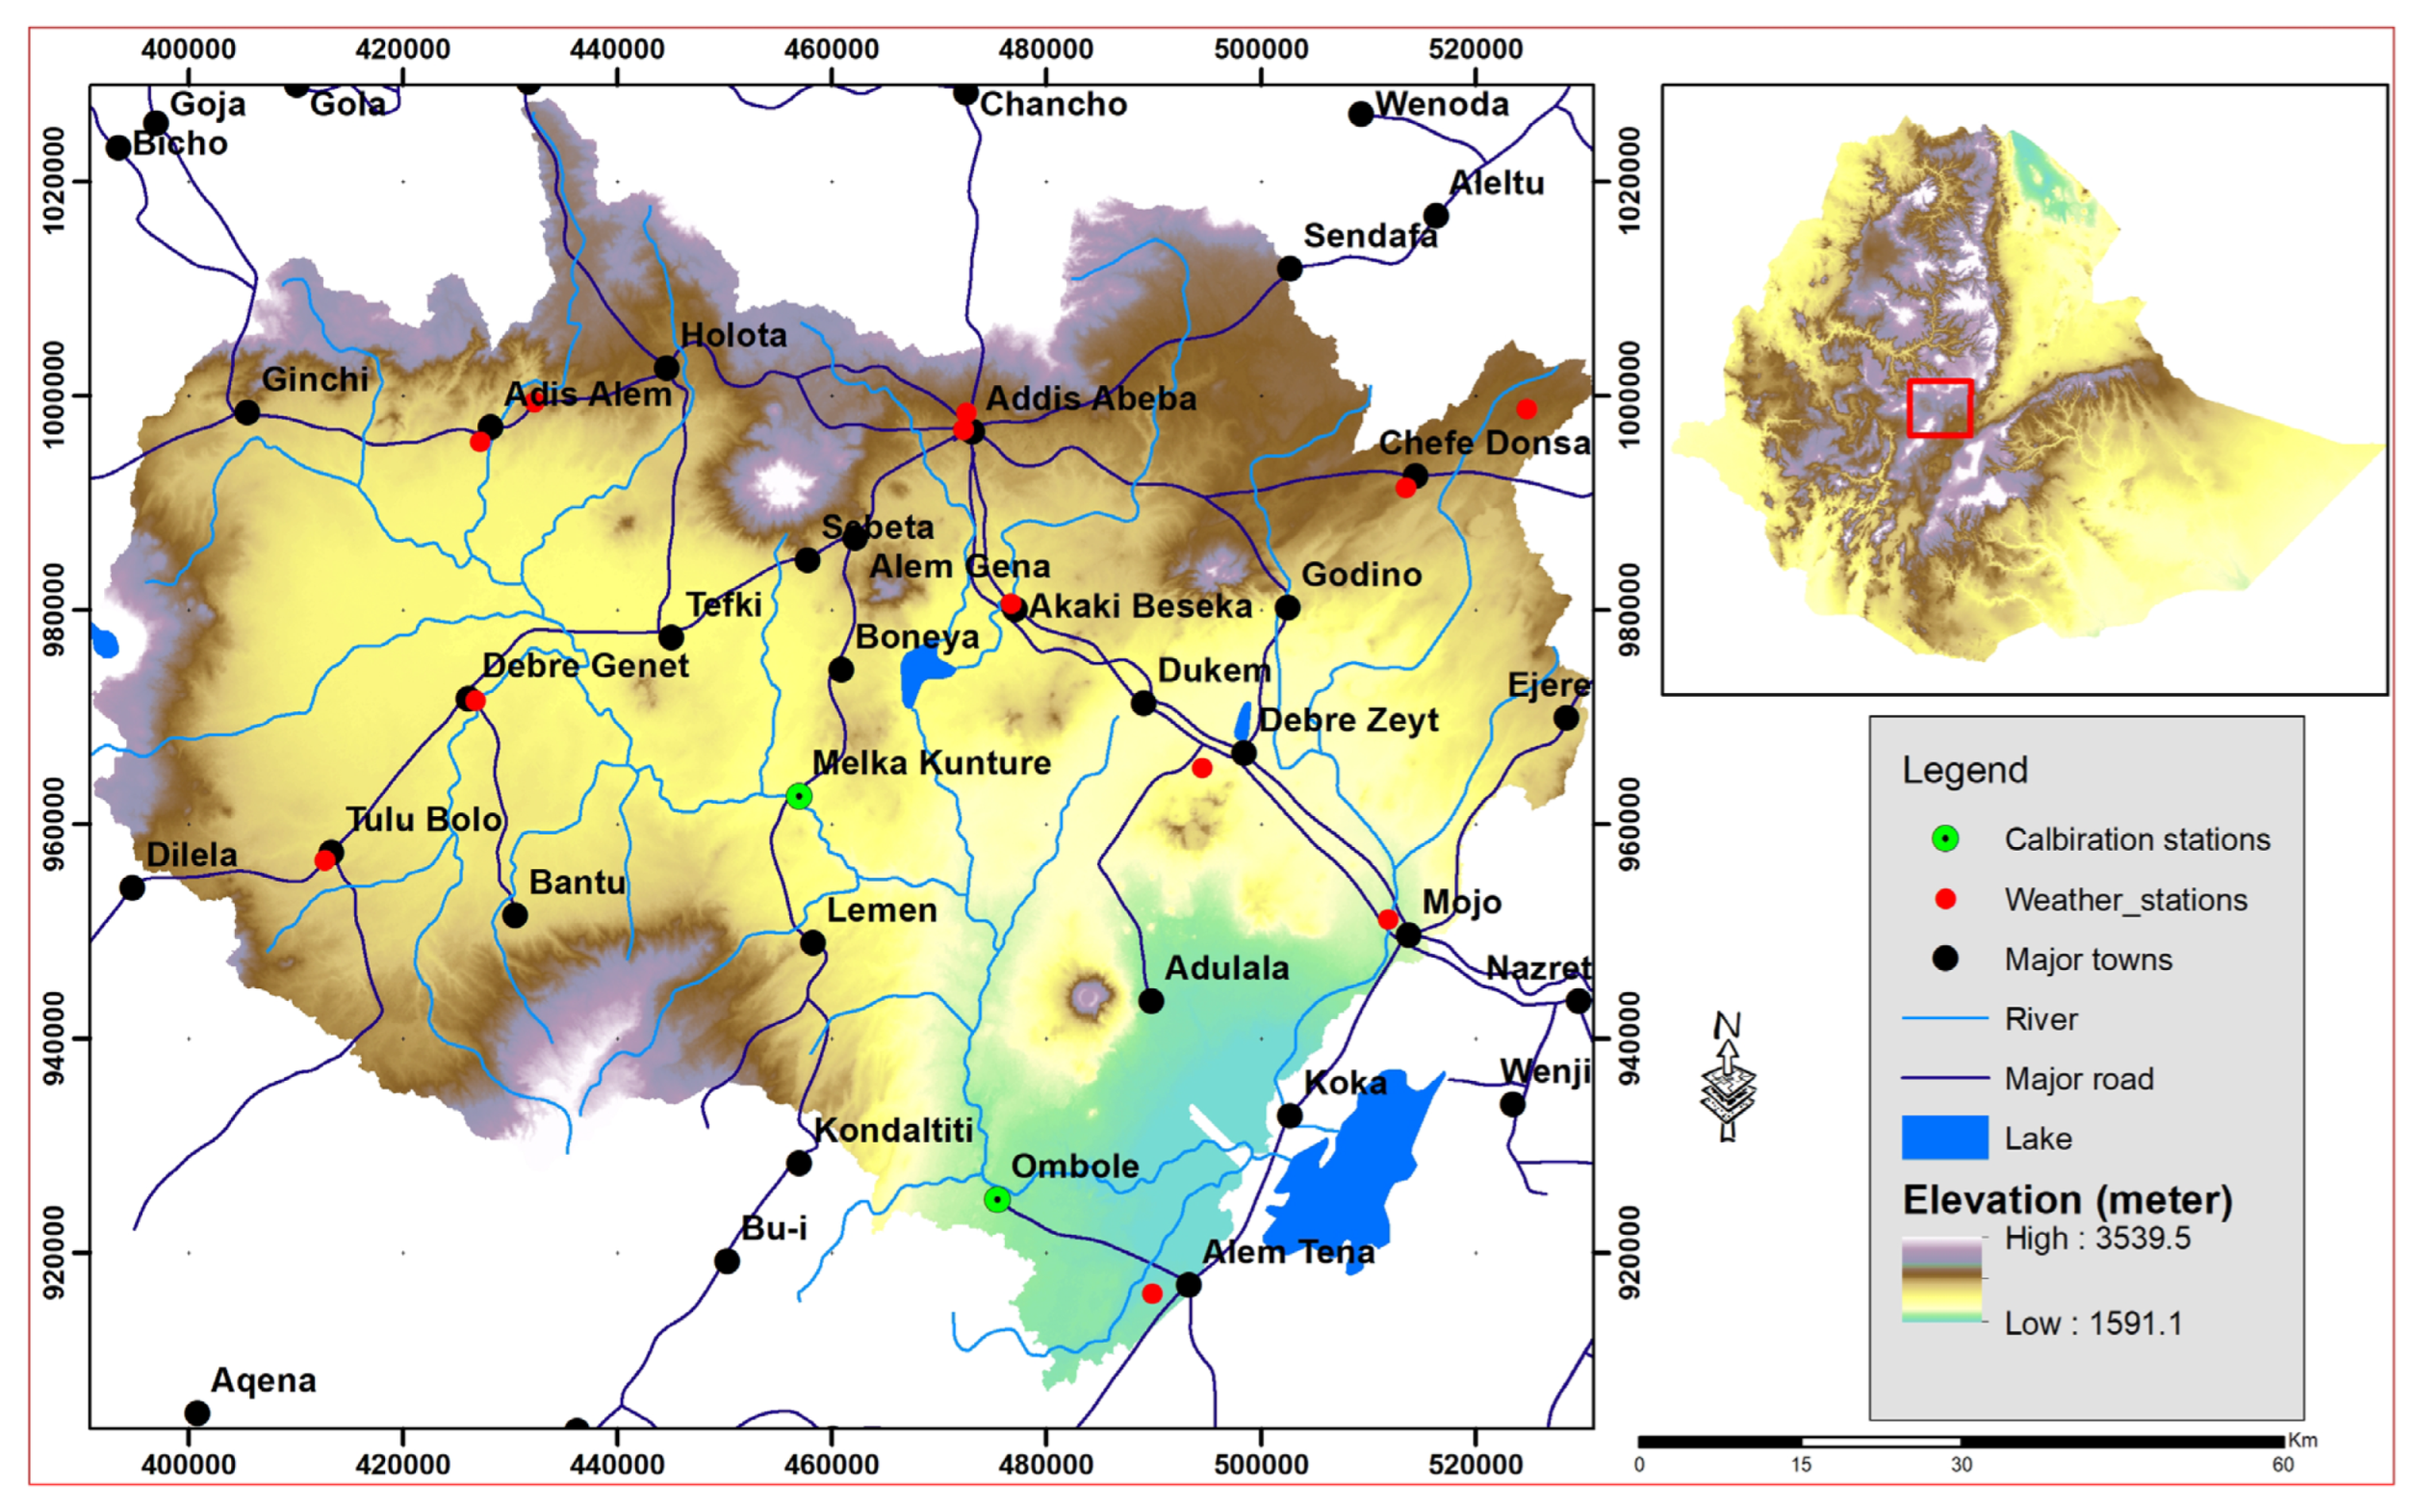
Figure 1. Map of the upper Awash study area.
Water 16 03447 g001
Figure 2. The calibration and validation periods for stream flow, sediment (a), and nutrient (b).
Water 16 03447 g002
Figure 3. Maps showing land cover and use from 2003 (a) and 2023 (b).
Water 16 03447 g003
Figure 4. LULC change (2003–2023) direction of transformation (a), sum of change (b), and change matrix (c) analysis.
Water 16 03447 g004
Figure 5. LULC percentage change from 2003 to 2023.
Water 16 03447 g005
Figure 6. Flow calibrated and validated at Hombole (1984–2018) (a) and flow validated at Melka Kunture (2007–2018) (b) gauging stations.
Water 16 03447 g006
Figure 7. The flow simulated and observed at Hombole during calibration (a) and validation (b) and Melka Kunture during validation (c).
Water 16 03447 g007
Figure 8. The calibration and validation of sediment at Hombole (a) and Melka Kunture (b) gauging stations.
Water 16 03447 g008
Figure 9. Average annual soil loss rate (t/ha/year) for each upper Awash basin sub-watershed between 2003 and 2023.
Water 16 03447 g009
Figure 10. Map of average soil loss (t/h/y) severity class for the upper Awash sub-basin.
Water 16 03447 g010
Figure 11. Melka Kuture gauging station monthly nitrate (a), phosphate (b), total phosphorous (c), and total nitrogen (d) load calibration (2011–2014) and validation (2015–2019).
Water 16 03447 g011aWater 16 03447 g011b
Figure 12. The runoff distribution and NPSP loads: runoff (a), nitrate (b), total nitrogen (c), phosphate (d), total phosphorous (e), and sediment (f).
Water 16 03447 g012
Figure 13. The temporal runoff and NPSP loads of upper Awash basin: average monthly runoff (a), average annual runoff (b), average monthly nitrate load (c), average annual nitrate (d), average monthly total nitrogen (e), average annual total nitrogen (f), average monthly phosphate (g), average annual phosphate (h), average monthly total phosphorous (i), average annual total phosphorous (j), average monthly sediment (k), and average annual sediment (l).
Water 16 03447 g013aWater 16 03447 g013bWater 16 03447 g013c
Figure 14. The yearly average surface runoff (a), % change in surface runoff (b), sediment load (c), and percentage change in sediment load (d) from 2003 to 2023.
Water 16 03447 g014
Figure 15. Impact of LULC change in NO3 load (a), change in NO3 load (b), change in PO4 load (c), and change in PO4 (d).
Water 16 03447 g015
Figure 16. Sub-watershed level; TN and TP change in (t/yr.) (a), TN and TP change in (%) (b), TN and TP load (t/yr.) (c).
Water 16 03447 g016aWater 16 03447 g016b
Table 1. Sources, spatial resolution, and type of input data for the SWAT model.
Data TypeSpatial Resolution/PeriodSource
DEM30 mhttps://earthexplorer.usgs.gov/, accessed on 31 October 2021
LULC10 m (2023), 30 m (2003)https://earthexplorer.usgs.gov/, accessed on 17 February 2023
https://scihub.copernicus.eu/, accessed on 16 February 2023
Soil map1:250,000Water and Land Resource Center (WLRC)
Rainfall and temperature1979–2019National Meteorological Agency (NMA)
Solar radiation, relative humidity, and wind speed1979–2019https://climatedataguide.ucar.edu/climate-data accessed on 18 July 2023
Observed stream flow DailyMinistry of Water and Energy
Observed sediment Monthly Ministry of Water and Energy
Observed nutrient quality Monthly (2009–2019) Ethiopian Construction Design and Supervision; field observation by the researcher
Table 2. Classification of statistical indices for model evaluation.
Performance RatingPBIASRSRNSE
Stream FlowSedimentN and P
Very goodPBIAS ≤ ±10PBIAS ≤ ±15PBIAS ≤ ±250.00 ≤ RSR ≤ 0.50 0.75 < NSE ≤ 1.00
Good±10 < PBIAS ≤ ±15±15 < PBIAS ≤ ±30±25 < PBIAS ≤ ±400.50 < RSR ≤ 0.600.60 < NSE ≤ 0.75
Satisfactory ±15 < PBIAS ≤ ±25±30 < PBIAS ≤ ±55±40 < PBIAS ≤ ±700.60 < RSR ≤ 0.700.36 < NSE ≤ 0.60
Bad≥±25 PBIAS ≥ ±55PBIAS ≥ ±70RSR > 0.70≥±0.36
Table 3. Descriptions of calibrated parameters; the statistical index values of “p-value” and “t-stat” are available in [68,69,70,71].
Flow Parameter Parameter Description t-Statp-Value
V_RCHRG_DP.gwDeep aquifer percolation fraction−7.3630.000
V_CH_K2.rteEffective channel hydraulic conductivity (mm/h)6.3860.000
R_CN2.mgtSCS curve number for moisture condition II−2.0620.040
V_ALPHA_BF.gwBase flow alpha factor (days)1.2030.230
V_SURLAG.bsnSurface runoff lag time−1.1200.263
V_CANMX.hruMaximum canopy storage−1.1030.271
R_USLE_K(..).solSoil erodibility factor in USLE−0.9550.340
V_GW_DELAY.gwGroundwater delay (days)−0.8630.389
V_REVAPMN.gwThreshold depth of water in the shallow aquifer (mm)−0.7330.464
V_GW_REVAP.gwGroundwater revap coefficient0.5890.556
R_OV_N.hruOverland Manning roughness−0.5290.597
R_SOL_BD(..).solMoist bulk density (Mg/m3 or g/cm3)−0.4690.639
V_GWQMN.gwThreshold depth of water in the shallow aquifer (mm)0.3210.749
R_SOL_AWC(..).solAvailable water capacity of the soil layer (mm/m)−0.0720.943
Sediment
V_CH_D.rteThe average depth of the main channel12.4110.000
R_SLSUBBSN.hruAverage slope length (m)2.8680.004
A_CH_COV2.rteChannel cover factor−2.5540.011
R_HRU_SLP.hruAverage slope steepness (m/m)−2.0720.039
A_CH_ERODMO(..).rteChannel erodibility factor1.0230.307
V_CH_W2.rteAverage width of channel at the top of the bank (m)−0.9970.320
V_SPEXP.bsnExponent parameter for calculating the channel
sediment routing
0.9510.343
A_USLE_P.mgtThe USLE equation supports the parameter−0.4890.625
A_USLE_C{..}.plant.datMin value of USLE C factor applicable to the land cover/plant−0.0030.998
R_CH_BED_TC.rteCritical shear stress of channel bed (N/m2)−0.0010.999
Nutrient parameter
R_RS5.swqThe organic P settling rate1.8220.069
R_PPERCO.bsnPhosphorus percolation coefficient (10 m3/Mg)−1.5320.127
R_P_UPDIS.bsnPhosphorus uptake distribution parameter−1.3690.172
R_ERORGP.hruP enrichment ratio with sediment loading−1.0980.273
R_GWSOLP.gwConcentration of soluble phosphorus in groundwater (mg P/L)0.8880.375
R_USLE_P.mgtUSLE support practice factor0.8250.410
V_PSP.bsnPhosphorus availability index−0.4100.682
R_BC4.swqRate constant for mineralisation of organic P to dissolved P in the reach at 20 °C (1/day)0.1150.908
R_PHOSKD.bsnPhosphorus soil partitioning coefficient0.0110.991
Table 4. The calibration and validation of streamflow statistics at the Hombole and Melka Kunture gauging stations.
PeriodObservatoryp-Factorr-FactorPBIASRSRR2NS
Calibration1979–2001Hombole0.940.944.60.580.680.67
Validation2002–20180.920.85.40.570.680.67
Validation2002–2018Melka Kunture0.630.94−4.30.580.690.66
Table 5. The performance of the SWAT model for sediment during the calibration and validation periods.
PeriodObservatoryp-Factorr-FactorPBIASRSRR2NSE
Calibration1979–2001Hombole0.820.71−14.90.690.650.70
Validation2002–20180.760.6320.80.550.610.64
Validation2002–2018Melka Kunture0.740.9434.30.580.640.58
Table 6. Description of coverage area, yearly rates of soil load, magnitude, and severity classes.
Soil Load Rate (t/ha/y)Class Severity Area (ha)Area (%)Average Annual Load (t/Year)Average Annual Load (%)
<12Low33,804.114.499,083.210.0
12–20Moderate35,095.614.9124,434.112.5
20–30High68,171.728.9258,910.926.1
30–45Very high32,811.213.9250,431.725.3
>45Severe65,666.127.9258,944.526.1
Table 7. Details on the model’s monthly performance for nutrients during its validation (2015–2019) and calibration (2011–2014) phases.
NutrientCalibrationValidation
PBIASRSR NSEPBIASRSR NSE
NO314.20.530.6615.60.490.52
PO43−17.80.420.6412.10.520.60
TN7.80.540.6113.90.570.65
TP12.60.480.549.70.590.63
Disclaimer/Publisher’s Note: The statements, opinions and data contained in all publications are solely those of the individual author(s) and contributor(s) and not of MDPI and/or the editor(s). MDPI and/or the editor(s) disclaim responsibility for any injury to people or property resulting from any ideas, methods, instructions or products referred to in the content.