Abstract
Studying the resilience of metro stations in mountainous cities to heavy rain and flooding is of significant importance for enhancing the stability and safety of metro station operations. Considering the topographical and climatic characteristics of mountainous urban areas, this study analyzes the mechanisms through which heavy rain and flooding affect metro station resilience. Based on this analysis, 27 factors, influencing metro station resilience, are identified across 4 dimensions: absorptive capacity, resistance capacity, recovery capacity, and adaptive capacity. A water disaster resilience evaluation index system and corresponding rating standards are established for metro stations in mountainous cities. By combining the advantages of objective and subjective weighting, the combination weights of evaluation indicators are calculated using game theory. The extension theory is combined with the cloud model to establish a model for assessing the water disaster resilience of metro stations in mountainous urban areas. The applicability and feasibility of the model are validated through its implementation at Shapingba Station within Chongqing Rail Transit. The evaluation results obtained from the established model indicate a resilience level of IV for Shapingba metro station, reflecting a high level of resilience that aligns with real-world conditions. These findings further validate the proposed evaluation standards and the method for assessing the water disaster resilience of metro stations based on the combination weighting method and extension cloud model. This evaluation method considers the uncertainty in the evaluation process, demonstrating good feasibility and reliability. It offers a new perspective and methodology for assessing and analyzing the resilience of similar metro stations in mountainous cities.
1. Introduction
As China’s urbanization continues to progress, metros, because of their large capacity, high speed, and reliable safety, have become the core transportation infrastructure supporting the development of modern cities [1,2,3]. However, due to the enclosed environment and high concentration of passengers and equipment within metros, even minor risk events can significantly impact the operational safety of the metro [4]. In recent years, frequent heavy rains and extreme weather have led to many inundation disasters in urban underground areas, particularly in metro stations [5,6]. For example, the “5.22” extreme rainfall event in Guangzhou in 2020 resulted in flooding at multiple metro stations along Line 13, leading to the suspension of Line 13 and disrupting citizen commutes. Additionally, the “7.20” rainfall disaster in Zhengzhou, Henan, in 2021 inundated Line 5 of Zhengzhou Metro, trapping a subway train and leading to the deaths of 14 passengers and significant property losses [7]. Therefore, studying the flood resilience of metro stations is of vital importance for enhancing their safety and stability, reducing human casualties, and minimizing property losses.
In recent years, scholars have conducted extensive research on methods for assessing the safety risks of flood incidents in metro stations. Lyu et al. conducted a comparative study on flood risks in metro systems using the Analytic Hierarchy Process (AHP) and Interval AHP (I-AHP) methods based on GIS modeling [8]. Lyu et al. proposed a comprehensive flood risk assessment method integrating a stormwater management model into a geographic information system to predict potential flood risks in metro systems [9]. Wang et al. introduced an assessment method for flood risks in metro systems based on an improved Trapezoidal Fuzzy Analytic Hierarchy Process and applied it to the evaluation of flood risks in 268 metro stations across 14 lines in Guangzhou [10]. Shin et al. proposed a flood risk assessment method for underground spaces that simultaneously considers flood intensity and evacuation routes and determined the shortest escape routes using the Dijkstra algorithm [11]. He et al. presented an optimal evidence-reasoning approach considering subjective parameter uncertainty for assessing flood risks in metro stations and validated the model’s adaptability and effectiveness in 378 metro stations in Shanghai, China [12]. Liu et al. conducted an evaluation and analysis of urban metro station rainstorm inundation disaster risks using a combined Pressure-State-Response and Cloud Model approach [13]. Tu et al. introduced an innovative research framework for flood risk assessment and classification at metro stations based on the SMAA-2-FFS-H method and applied it to the evaluation of flood risks at 32 stations on Zhengzhou’s Metro Line 5 [14]. The aforementioned scholars have conducted in-depth research on the safety risk assessment of flooding incidents at metro stations, which is crucial for the study of metro station floods. Nevertheless, most of the research mentioned above focuses on the inherent fragility of metro station flood systems from a traditional risk management perspective, overlooking their relevance and dynamics.
The resilience theory can complement the limitations of traditional risk theories and has been widely applied in various fields of safety science, such as system safety resilience, tunnel construction safety resilience, and overall safety resilience [15]. Holling first introduced the concept of resilience in 1973, describing the ability of natural systems to maintain normal functioning after external disturbances [16]. Scholars have since then defined resilience as the system’s capacity to resist external unsafe factors, recover after a disturbance, and adapt to similar future challenges [17]. Scholars have conducted in-depth research on resilience from various perspectives. For example, Guo et al. established a safety resilience evaluation index system for metro construction sites based on resilience theory and developed the extended cloud comprehensive evaluation model by combining the cloud model theory and the matter-element extension theory [18]. Wang et al. established a comprehensive assessment index system for the safety resilience of prefabricated construction based on resilience theory and dynamically assessed the safety resilience of prefabricated construction using a dynamic Bayesian network [19]. Shen et al. evaluated the resilience of a deep excavation safety system using the Decision-Making Trial and Evaluation Laboratory (DEMATEL)–Analytic Network Process (ANP) method and the extended cloud model, and proposed recommendations to enhance the safety resilience of deep excavations [20]. Li et al. developed a comprehensive evaluation model for the resilience of urban water supply systems under multi-level flood and drought disasters based on the cloud model, providing decision support for the short-term and long-term planning and construction of urban water systems [21]. Liu et al. constructed a multi-factor evaluation model of urban safety resilience based on TOPSIS, and analyzed critical factors constraining the improvement of safety resilience using an obstacle degree model [22]. Tang et al. proposed the concept of fire resilience for the metro based on resilience theory and determined fire resilience capability indicators using disaster site analysis, the TOSE method, and an improved TOPSIS method [23]. They also evaluated fire resilience using Bayesian networks, and explained the key causal chains of fire incidents. In conclusion, scholars have conducted extensive research on resilience, primarily focusing on urban resilience, community resilience, and infrastructure resilience. Some researchers have also studied resilience indicators and evaluation models for metro station systems, but mostly from the perspectives of construction, road networks, and fire incidents. Currently, there is limited research on the resilience of metro stations under flood disasters, especially on the assessment of flood disaster safety resilience of metro stations in mountainous cities.
Therefore, this study introduces resilience theory into the assessment of metro water disaster safety and constructs a metro station water disaster safety resilience indicator system centered on absorptive capacity, resistance capacity, adaptive capacity, and recovery capacity. The combination weighting method is a weighting method that combines subjective weighting and objective weighting to improve the science and rationality of weight distribution. Therefore, this study then uses a game theory-based combination weighting method to calculate the combination weights of the evaluation indicators for metro station water disaster safety resilience, addressing the limitations of using subjective and objective weights separately. The extension cloud model is an analytical method combining extension theory and cloud model, which is used to deal with fuzzy and uncertain multidimensional evaluation problems in complex systems. Extension theory establishes the relationship between the object characteristics and the membership degree of the target class through the correlation function. The cloud model uses the random distribution of cloud droplets to describe the fuzziness and randomness of the membership degree. Therefore, based on the extended cloud model, a model for assessing the water disaster safety resilience of metro stations in mountainous cities is developed. This model is applied to evaluate the water disaster safety resilience of the Shapingba metro station to validate the accuracy and applicability of the model. By assessing the water disaster safety resilience of mountainous urban metro stations, this study aims to understand their water disaster risk status and enhance the reliability of the metro station operational system.
The rest of this paper is arranged as follows: Section 2 focuses on determining the assessment index system and rating standards for the water disaster safety resilience of metro stations. Section 3 details the method for determining the weights of evaluation indicators. Section 4 introduces the developed model for assessing metro station water disaster safety resilience. Section 5 discusses the practical application of the new model in engineering. Section 6 analyses the accuracy, advantages, and disadvantages of the model, and the measures taken. Finally, Section 7 outlines the conclusions drawn from this study.
2. Construction of the Evaluation Indicator System for Water Disaster Safety Resilience
2.1. Concept of Water Disaster Safety Resilience
Water disasters such as heavy rain and flooding directly affect urban rail transit systems through their impact on metro stations. It is therefore necessary to investigate the factors influencing the ability of metro stations to cope with water disasters [24,25]. The safety resilience system of a metro station is a complex system influenced by multiple risk factors. Analyzing the mechanisms of factors affecting the water disaster safety resilience of metro stations helps enhance their resistance ability to water disasters, as well as recovery capability after incidents such as heavy rain and flooding. According to resilience theory, metro station water disaster resilience can be defined as the ability of a metro station to absorb, resist, recover from, and gradually adapt to the disturbances caused by water disasters such as flooding and heavy rain. It includes the ability to prevent emergencies, respond to emergencies, recover, and adapt to changes in the future. Metro station water disaster safety resilience can be quantified as a comprehensive ability of absorption capacity, resistance capacity, recovery capacity, and adaptive capacity [26]. Among them, absorption capacity refers to the ability of the metro station system to eliminate potential safety hazards and prevent water disasters, which is the ability to maintain system stability before events such as rainstorms and flooding. Resistance capacity refers to the system’s ability to minimize the impact of water disasters and reduce losses, which means during water disasters such as rainstorms and floods, the metro station ensures its normal operation through its redundancy. This is more about the emergency performance of the metro station. Recovery capacity refers to the ability of the subway station system to adjust its status promptly to ensure normal operation during water disasters, which means that after water disasters such as rainstorms and floods, the subway station can restore its normal operation status as soon as possible through the reasonable allocation of resources. Adaptability refers to the system’s ability to optimize its internal structure to improve its ability to cope with future water disasters. This means that the metro station constantly improves its resilience by learning and summarizing its experience in handling events like rainstorms and floods. The concept curve of metro station water disaster safety resilience is depicted in Figure 1.
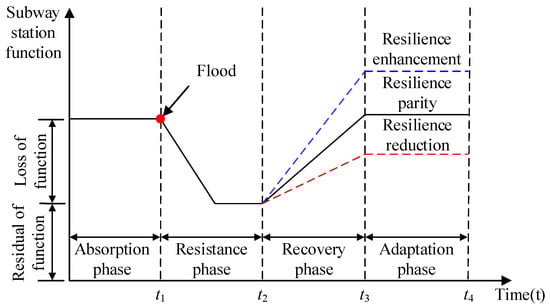
Figure 1.
Conceptual graph for subway station flood safety resilience.
2.2. Establishment of the Resilience Evaluation Indicator System
Considering the principles of feasibility, hierarchy, and systematicity, as well as the operational characteristics of metro stations and the hazardous characteristics of water disasters, this study, based on the concept of metro station water disaster safety resilience and related research [24,27], establishes a metro station water disaster safety resilience evaluation indicator system. This system includes 4 primary indicators (absorption capacity, resistance capacity, recovery capacity, and adaptive capacity), consisting of 27 secondary indicators. Among them, absorption capacity contains 7 evaluation indicators, resistance capacity includes 10 evaluation indicators, recovery capacity involves 6 evaluation indicators, and adaptation capacity consists of 4 evaluation indicators. The framework of the established evaluation indicator system is illustrated in Figure 2.
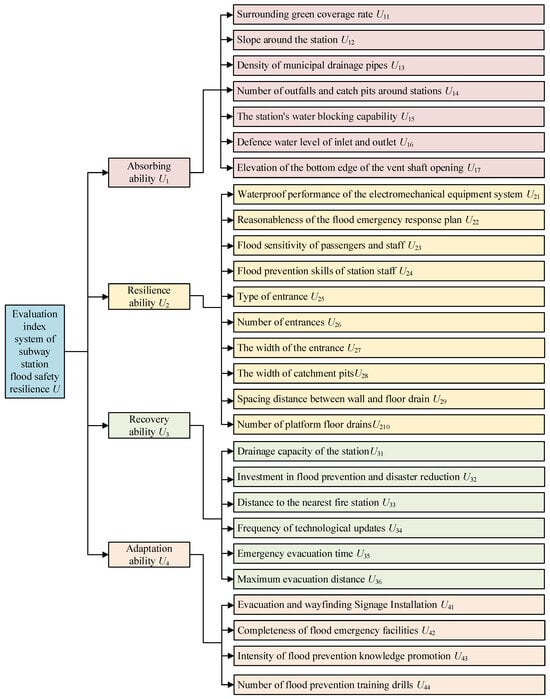
Figure 2.
Evaluation index system of subway station flood safety resilience.
2.3. Division of Water Disaster Safety Resilience Levels
Based on the practical situation of metro station water disaster safety management, and referencing existing methods for resilience-level divisions [27,28,29], metro station water disaster safety resilience is categorized into five levels: Level I (superior resilience), Level II (high resilience), Level III (average resilience), Level IV (low resilience), and Level V (very low resilience). Specific definitions of each level are provided in Table 1.

Table 1.
Description of flood safety and resilience grades of subway stations.
To accurately grade the levels of water disaster safety resilience in metro stations, it is essential to determine threshold values for the resilience levels of each evaluation indicator. This study, with reference to key standards in metro operational safety and relevant research [27,28,29,30], and the “Metro Design Code” (GB50157-2013) [31], examined the rainfall characteristics of different return periods (10, 50, 100 years) in cities. This study also incorporated suggestions from multiple experts in the field of metro station water disaster safety and station administrative staff to determine the graded intervals for each safety resilience indicator, as outlined in Table 2.
Table 2.
Subway station flood safety resilience index classification range.
3. Determination of Combination Weights of Safety Resilience Evaluation Indicators
3.1. AHP for Subjective Weight Determination
Currently, the Analytic Hierarchy Process (AHP) is widely employed as a systematic, straightforward, and practical method for subjective weighting in various decision-making contexts [32]. Thus, this study utilizes AHP to determine the subjective weights of evaluation indicators for metro station water disaster safety resilience. The calculation process is as follows:
- (1)
- Judgment Matrix Constriction
First, the research question is decomposed into several hierarchies and factors. Taking the risk evaluation indicators of the upper level as the criterion, a pairwise comparison is conducted between the evaluation indicators within the same indicator level for metro station flood resilience. The importance of one evaluation indicator relative to others is represented using the 1–9 scale method. The criteria for the 1–9 scale method are shown in Table 3.
Table 3.
1~9 scale evaluation criteria.
According to Table 3, the initial judgment matrix for the pairwise comparisons of safety resilience evaluation indicators is obtained:
- (2)
- Weight Vector Calculation
MATLAB is employed to calculate the maximum eigenvalue and its corresponding eigenvector of the judgment matrix:
where is the judgment matrix; W is the eigenvector; and is the maximum eigenvalue.
- (3)
- Consistency Test
To ensure the rationality and accuracy of the subjective weight vector obtained through the AHP, a consistency test is conducted on the judgment matrix derived from the pairwise comparisons of safety resilience evaluation indicators. The specific calculation process is as follows:
- (1)
- The Consistency Index (CI) is calculated as follows [33]:
- (2)
- The Average Random Consistency Index (RI) is calculated according to Table 4:
Table 4. RI comparison table.
- (3)
- The Consistency Ratio (CR) is calculated as follows:
When CR < 0.10, it indicates that the judgment matrix obtained from the pairwise comparisons of evaluation indicators exhibit good consistency.
After passing the consistency test, the calculated eigenvector W is normalized to obtain the weight vectors for safety resilience evaluation indicators.
3.2. Entropy Method for Determining Objective Weights
Entropy serves as a measure of system disorder and effectively captures the information provided by metro station water disaster safety resilience [34]. The entropy method, based on the variability of each indicator, calculates entropy weights for each indicator using information entropy. These entropy weights are then used to modify the weights of each indicator, resulting in more objective weights [35]. In this study, the entropy method is adopted to determine the objective weights of safety resilience evaluation indicators, reducing the impact of subjective factors and ensuring objectivity and rigor in the calculation results. The specific calculation process is as follows:
- (1)
- Determination of the Original Matrix
Assuming m is the number of samples for evaluating metro station water disaster safety resilience and n is the number of indicators, then the original matrix R generated is as follows:
where i = 1, 2, 3,⋯, m; j = 1, 2, 3, ⋯, n; rij is the attribute value of indicator j for sample i.
- (2)
- Standardization of the Judgment Matrix
The judgment matrix P is standardized to obtain the indicator matrix . The method for standardization is as follows:
- (3)
- Determination of the Entropy Value of Evaluation Indicators
The entropy value of safety resilience evaluation indicators is calculated by the following formula:
where Pij is the proportion of sample i based on indicator j.
- (4)
- Calculation of the Weights of Evaluation Indicators
The entropy value is used to calculate the objective weight of each evaluation indicator:
where is the objective weight of safety resilience evaluation indicators.
3.3. Game Theory for Determining Combination Weights
In this study, the combination weights of safety resilience evaluation indicators are determined by integrating the subjective weights and objective weights calculated using game theory [36]. The game theory-based method comprehensively considers the inherent information among resilience evaluation indicators, standardizing the composite weights with subjective and objective weights. This ensures that the deviation between combination weights and subjective/objective weights is minimized, reducing the impact of subjectivity on risk assessment results and enhancing the rationality of assigning weights to safety resilience evaluation indicators. The calculation process is as follows:
(1) Based on the AHP and entropy weight method, subjective weight W1 and objective weight W2 are calculated, respectively. Let the combination weight vector expressed by the linear combination of W1 and W2 be as follows:
where W1 is the subjective weight; W2 is the objective weight; and and are the linear combination weight coefficients.
(2) Following the game theory, an objective function is established. To minimize the sum of differences between the combination weight W and W1 and W2, the optimal linear combination coefficients and are solved. In this case, the indicator combination weight is to the optimal composite weight W*. The objective function and constraints are as follows:
(3) According to the principle of differentiation, the first-order derivative condition to obtain the minimum value for model (10) is
where is the weight coefficient, is the transposed matrix of the base weight vector set Wk, and Wk is the base weight vector set.
(4) The linear combination coefficients and obtained from Equation (11) are normalized as follows:
Then, the optimal combination weight of evaluation indicators is derived as
4. Construction of Water Disaster Safety Resilience Evaluation Model of Metro Stations in Mountainous Cities
The scientific evaluation of water disaster safety resilience is crucial for translating resilience theory into practical fire safety resilience construction in metro stations. While rating the level of water disaster safety resilience at metro stations in mountainous cities, the thresholds of the evaluation indicators should belong to the boundary information between adjacent levels, leading to certain randomness and fuzziness in the values of level boundary information. Therefore, the extension cloud model is utilized to cloudify the boundary information of levels and then evaluate the water disaster safety resilience of metro stations in mountainous cities.
4.1. Construction of the Extension Cloud Model
The extension cloud model combines the qualitative and quantitative analysis features of extension theory in extensions [37] with the dual uncertainty inference characteristics of the cloud model [38]. The presence of uncertainty in practical engineering or objective entities can influence the results of risk assessment. The Gaussian cloud model can qualitatively describe the fuzziness and randomness of engineering projects and quantitatively analyze them. The Gaussian cloud model (Ex, En, and He) is employed to replace the characteristic value V corresponding to physical characteristics in the extension analysis model. Then, the model can reflect existing fuzziness and randomness issues through En and He. Therefore, the extension cloud model is used for the evaluation of the water disaster safety resilience of metro stations in mountainous cities. This model combines the uncertain reasoning characteristics of cloud models with the advantages of qualitative and quantitative analysis in extension models.
First, based on the extension cloud model for evaluating water disaster safety resilience, the pre-processed dataset from the database is expressed according to the rule of extension cloud theory as follows:
where R is the fundamental element of an entity; N is the entity name; C is the entity feature; and V is the quantity value of the entity feature.
Subsequently, considering the level boundaries of evaluation indicators as [Cmin, Cmax], the level boundary cloud model (Ex, En, He) is obtained based on Equation (16):
where Cmax and Cmin are the upper and lower values of the water disaster safety resilience level evaluation, and k is the constant reflecting the evaluation fuzzy threshold, which can be adjusted according to the specific circumstances of the evaluation object, with a designated value of k = 0.1.
Lastly, the cloud model (Ex, En, He) is used to represent the three variables in the evaluation of water disaster safety resilience, and the extension cloud model is obtained by combining the extension matter-element model with the cloud model’s element feature vector:
where Rj is the divided evaluation grade, (Ex, En, He) is the cloud description of the evaluation indicator Ci, and i = 1, 2, …, n regarding grade Rj.
4.2. Calculation of Cloud Correlation
Based on Equation (13), the cloud correlation coefficient k is between the values of each to-be-evaluated indicator and extension cloud model of flood safety resilience metro stations evaluation grade boundary in mountainous cities, as expressed in Equation (18) [39]:
where x is the value of each to-be-evaluated indicator, and En′ is a random number following a normal distribution with an expected value of En and a standard deviation of He.
By employing Equation (18), we can compute the cloud correlation coefficient between the value of each object element to be evaluated and the extension cloud model of each evaluation index level.
The correlation matrix K for the water disaster safety resilience assessment level of mountainous urban metro stations can be obtained:
where kij is the correlation coefficient between the boundary extension cloud model of Ci to be evaluated and the evaluation grade j. n is the number of evaluation indicators; m is the evaluation level.
The cloud correlation coefficients obtained through the extension cloud model exhibit randomness. Compared with traditional matter-element models, where correlations are derived using fixed linear correlation functions, the use of uncertain random numbers instead of determined values is more suitable for various real-world engineering scenarios.
4.3. Calculation of Extension Cloud Comprehensive Evaluation Level
First, the matrix of correlations for primary indicators K(bi) is calculated by weighting the matrix of correlations for secondary indicators:
where wj is the weight vector of the secondary index, and K is the correlation degree matrix of the secondary index.
Subsequently, the matrix of correlations for the target layer K(ai) is calculated by weighting the matrix of correlations for primary indicators:
where wj is the weight vector of the primary indicator, and K(bi) is the membership matrix of the primary indicator.
According to the principle of maximum membership, if it satisfies Kj (N) = max Kj (N), then the resilience level of evaluation object N is considered level j. Then, the resilience level of the metro station water disaster is determined as level j.
Finally, the variable characteristic value of the water disaster safety resilience level is determined.
where j* is the variable characteristic value of the evaluation object; through j*, the degree to which the evaluation object’s result leans toward adjacent risk levels can be determined.
4.4. Model for Water Disaster Safety Resilience Evaluation
Based on the established safety resilience evaluation indicator system, the combination weighting method is used to calculate the weight of evaluation indicators and the extension cloud model is employed to determine the evaluation level of water disaster safety resilience. Through the aforementioned research steps, a new model for the evaluation of metro station water disaster safety resilience is established, as depicted in Figure 3. To verify the rationality and practicability of the model, an application analysis will be conducted in the following section.
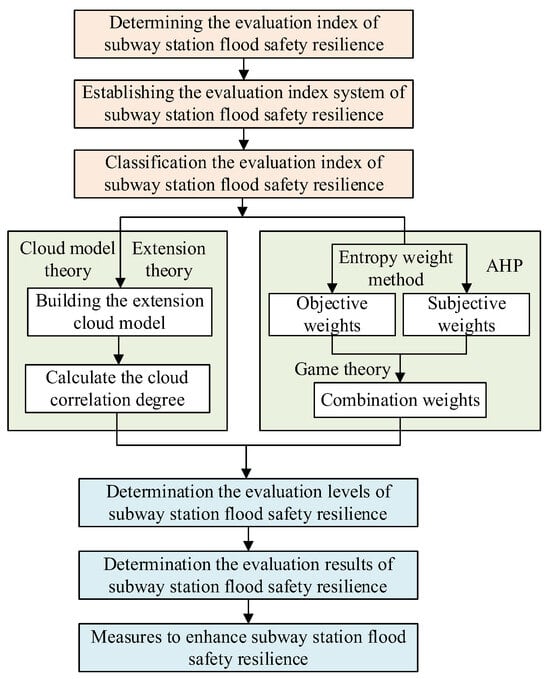
Figure 3.
Evaluation process of the new model for evaluation flood safety resilience of subway stations.
5. Engineering Application
The new model can effectively solve the fuzziness and uncertainty in the evaluation process of subway station flood safety resilience, and ensure the rationality of weight allocation. To verify the rationality and practicability of the new model, it was applied to the evaluation flood safety resilience of Shapingba metro station.
5.1. Project Profile
5.1.1. Project Introduction
Shapingba metro station is located in the Shapingba District of Chongqing City, China, under the Three Gorges Square on the Yubei Road, serving as an interchange station for Chongqing Rail Transit Loop Line, Line 1, Line 9, and Line 27 (under construction). It also allows transfers with Shapingba Station on the Chengdu–Chongqing Intercity Railway. Shapingba metro station is identified by the codes/06, 1/14, and 9/04. Since 30 September 2022, the transfer hall and passageways have been put into operation, enabling passengers to transfer within the station. Situated in the old city area of Chongqing’s Shapingba District, Shapingba metro station serves as a major transportation hub and a key interchange point for residents’ daily commuting. Therefore, it experiences a significant volume of passenger traffic, necessitating robust infrastructure and human resources. Figure 4 illustrates the location of the Shapingba metro station. The non-English term in the figure is the name of a Metro station.
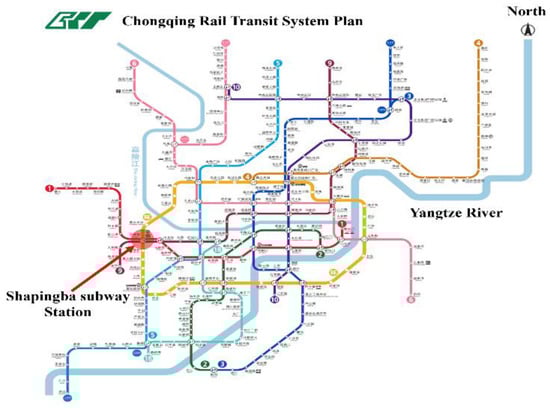
Figure 4.
Geographical location of Shapingba subway station. (Modified according to https://www.cqmetro.cn/yyxlt.html).
5.1.2. Data Sources
Data on resilience-related indicators for Shapingba metro station under flood disasters were collected for empirical research. Evaluation indicators were classified into qualitative and quantitative indicators. Data on municipal drainage pipe density were sourced from the 14th Five-Year Plan (2021–2025) for Chongqing Urban Drainage (Sewage, Rainwater) Facilities and Pipeline Construction. The green coverage for surrounding areas was the green coverage around the station measured using Google Maps’ satellite view. Information on investment in flood control and disaster reduction, frequency of technological updates, emergency evacuation time, and flood control training and drill frequency was obtained from staff at the station. Data on the 12 indicators, including the surrounding slope gradient, the number of drainage outlets and catchment pits around the station, flood defense elevation of entrances and exits, the elevation of the bottom edge of the air shaft entrance, the number of entrances and exits, the width of entrances and exits, catchment pit width, the intervals between side wall drains, the number of platform drains, the distance to the nearest fire station, and the maximum evacuation distance, were collected through field surveys. However, data on the following nine qualitative indicators, including the station’s water-blocking capacity, waterproof performance of electromechanical equipment systems, the rationality of flood control emergency plans, the sensitivity of passengers and staff to water disasters, the flood control skills of station operators, the station drainage capacity, the placement of evacuation and guidance signs, the completeness of water disaster emergency facilities, and flood control knowledge publicity, were difficult to obtain. As a result, this study adopts an expert scoring method to obtain data on these indicators. The authors score qualitative indicators based on their own experience and expertise to reflect their impact on flood resilience.
5.2. Calculation of Indicator Weights
5.2.1. Calculation of Subjective Weights
The AHP introduced in Section 3.1 is used to calculate the weights of water disaster resilience evaluation indicators for the Shapingba metro station. A total of 10 experts and on-site staff members with more than 5 years of experience in subway safety operation management were selected for weight calculation, including 5 with doctoral degrees, 3 with master’s degrees, and 2 with undergraduate degrees. Each expert used a unified evaluation scale and scoring criteria, and gave sores under the same criteria. The individual judgment matrices of the 10 experts were aggregated using geometric mean normalization to derive the experts’ judgment matrix. The subjective weights of water disaster resilience evaluation indicators for Shapingba metro station are calculated based on the AHP, as presented in Table 5.
Table 5.
Calculation value of subjective weights of flood safety resilience evaluation indexes of Shapingba subway station.
5.2.2. Calculation of Subjective Weights
The actual data of the Shapingba subway station is selected as the research object, and the objective weight is calculated according to the entropy weight method. Quantitative indicators are obtained by consulting relevant data, and qualitative indicators are obtained by inviting relevant experts to judge. The data values of water disaster resilience evaluation indicators of Shapingba metro station are reported in Table 6.
Table 6.
Data values of flood safety resilience evaluation indexes of Shapingba subway station.
Subsequently, calculations are performed using the entropy weight method explained in Section 3.2 to determine the objective weights. Table 7 presents the calculated results of the objective weights of water disaster resilience evaluation indicators.
Table 7.
Calculation value of objective weights of flood safety resilience evaluation indexes of Shapingba subway station.
5.2.3. Calculation of Combination Weights
Based on the subjective and objective weights, the game theory is employed to calculate the combination weights of the evaluation indicators for the water disaster safety resilience of Shapingba metro station. The results are shown in Table 8.
Table 8.
Calculation value of combination weights of flood safety resilience evaluation indexes of Shapingba subway station.
5.3. Determination of Cloud Model for Safety Resilience Evaluation Criteria
According to Equation (16) and the data in Table 2, the three numerical features of each evaluation indicator regarding the cloud model for each resilience level are computed. On this basis, the standard cloud model for the resilience level of water disasters was established. The calculation results are presented in Table 9.
Table 9.
Standard cloud model for flood safety resilience evaluation of Shapingba subway station.
5.4. Calculation of Correlation Matrix
The cloud correlation degree between the value of each index to be evaluated and the evaluation grade cloud model of each evaluation index is calculated using Equation (18). Furthermore, based on Equation (19), the correlation matrix for the water disaster resilience evaluation indicators can be obtained.
(1) Correlation matrix K1 of absorption capacity for water disaster resilience evaluation of Shapingba metro station:
(2) Correlation matrix K2 of resistance capacity for water disaster resilience evaluation:
(3) Correlation matrix K3 of recovery capacity for water disaster resilience evaluation:
(4) Correlation matrix K4 of adaptation capacity for water disaster resilience evaluation:
5.5. Determination of Evaluation Levels
Based on Equation (20), the comprehensive evaluation vector B1 for the resistance capacity of water disaster resilience evaluation of Shapingba metro station can be calculated as B1 = [3.900 × 10−02, 7.104 × 10⁻¹⁰, 3.242 × 10−02, 3.811 × 10−02, 1.169 × 10−02]. Similarly, the comprehensive evaluation vectors for resistance, recovery, and adaptation capacities can be obtained as B2 = [1.180 × 10−03, 9.761 × 10−03, 3.417 × 10−02, 7.174 × 10−02, 2.545 × 10−02]; B3 = [8.110 × 10−04, 8.734 × 10−04, 8.734 × 10−04, 2.240 × 10−02, 8.976 × 10−02]; B4 = [6.008 × 10−42, 1.396 × 10⁻¹⁴, 7.466 × 10−03, 2.812 × 10−02, 6.125 × 10−05]. The comprehensive evaluation vectors for resistance capacity, recovery capacity, and adaptation capacity are used to construct the relevance matrix K for the primary evaluation indicators:
By integrating the combination weights of the primary indicators and the relevance matrix K using Equation (21), the overall evaluation vector for the water disaster resilience of Shapingba metro station is derived as B = [8.361 × 10−03, 4.354 × 10−03, 2.132 × 10−02, 4.625 × 10−02, 3.981 × 10−02]. According to the principle of maximum membership degree, the water disaster resilience level of Shapingba metro station is determined to be Level IV, indicating a relatively high resilience level. The metro station’s system can operate normally under flood impact with minimal disruption, exhibiting a high ability to cope with water disasters. It can recover quickly to normal operation post-flood disturbance and adapt effectively to withstand flood impacts. The characteristic value for the water disaster resilience level is calculated as j* = 4.066, indicating a tendency towards Level IV. This further confirms a moderate water disaster resilience level of IV of Shapingba metro station.
6. Discussion
6.1. Validation of Model Accuracy
To validate the reasonableness and accuracy of the established resilience evaluation model for metro station water disasters based on the combination weighting method and the cloud model, a survey was conducted on the actual situation of Shapingba metro station. According to the survey results [40], on 16 September 2021, at 12:30 p.m., there was heavy rainfall outside Shapingba Station on Line 1. This resulted in waterlogging at the No. 2 entrance and exit of the station, leading to the shutdown of several elevators and the accumulation of water in station passageways. The on-site police officers immediately engaged in emergency rescue work, while the railway police detachment organized additional forces to evacuate passengers, inspect for water leaks, place flood control sandbags, and coordinate with relevant rescue forces for reinforcements. As of 1:30 p.m., the rainfall continued, and water continued to flow into the station. To prevent more significant accidents, Shapingba metro station implemented temporary closure measures. By 3:00 p.m., the rainfall weakened, and to expedite the resumption of rail operations and ensure passenger safety, the police officers returned to the station to assist in water draining and equipment maintenance. At 7:54 p.m., the station had resumed operations. The station’s performance illustrates its relatively high level of resilience, demonstrating its ability to swiftly respond to unexpected disasters, effectively coordinate various forces, take decisive measures, and promptly restore operations. This further verifies the accuracy and reasonableness of the proposed model.
6.2. Advantages and Limitations
This study evaluated the water disaster resilience of mountainous urban metro stations using the combination weighting method and the cloud model, which exhibits the following advantages:
(1) This study proposed an evaluation indicator system and criteria for mountainous urban metro station water disaster resilience. This study considered the characteristics of flood prevention in mountainous urban metro stations and quantified water disaster resilience as the combined capacity of absorption, resistance, recovery, and adaptation. It established an evaluation indicator system for the water disaster resilience of mountainous urban metro stations, encompassing 4 primary indicators, absorption capacity, resistance capacity, recovery capacity, and adaptation capacity, as well as 27 secondary indicators. Taking into account the characteristics of mountainous urban metro stations and relevant research, this study divided the water disaster resilience evaluation level into five grades and assigned a grade to each evaluation indicator. The established evaluation indicator system and grade criteria provide a theoretical foundation for similar evaluations of water disaster resilience in mountainous urban metro stations.
(2) Figure 5 presents the comparison of the weighting indicators for metro station water disaster resilience. The computed combination weights lie between objective and subjective weights, making the obtained evaluation indicator weights more scientifically rational. The use of game theory in the combination weighting method balances subjective and objective weighting, enabling a combined qualitative and quantitative analysis, avoiding deviations from the true results caused by a single weighting method. This approach allows for the greatest possible reliance on scientific methods for verification, yielding precise and rational evaluation indicator weights for metro station water disaster resilience.
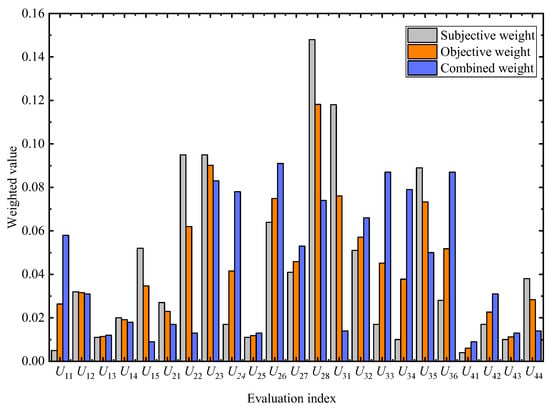
Figure 5.
Weight comparison of subway station flood safety resilience evaluation indexes.
(3) The evaluation process of metro station water disaster resilience is characterized by ambiguity, randomness, and a multi-index, multi-level evaluation problem. To address these challenges, this study applied the cloud model to the evaluation of metro station water disaster resilience. This approach effectively addresses the complexity of metro station water disaster resilience evaluation and the hierarchical nature of evaluation objects. The extension cloud model also addresses the boundary ambiguity and randomness of water disaster resilience evaluation indicators. The obtained evaluation results align well with real-world scenarios, ensuring the accuracy and reasonableness of the evaluation results.
Nevertheless, this study still exhibits some shortcomings and limitations that require further improvement. First, the resilience evaluation indicators in this study mainly rely on qualitative descriptions and evaluations, with data sourced from expert ratings, leading to a high degree of subjectivity in the evaluation results. In future research, selected indicators can be assessed using quantitative standards to objectively reflect the actual status of each indicator, thereby enhancing the reliability of the resilience evaluation indicator system. Additionally, this study focused only on the Shapingba metro station for analysis. In the future, the model can be applied to assess the resilience of other urban infrastructure, such as bridges, tunnels, and water supply and drainage systems. This will further verify the generality of the model and ensure its validity and applicability in different environments.
6.3. Resilience Enhancement Measures
Optimizing the water disaster resilience of metro stations is of vital importance for the safety management of metro operations. The resilience evaluation results of Shapingba metro station, which are rated at Level IV, indicate a relatively high resilience level. There is still room for improvement in the station’s absorption capacity, resistance capacity, recovery capacity, and adaptation capacity when facing flood disasters. Corresponding safety management measures should be implemented to ensure the safe operation of the metro station. The following resilience optimization suggestions are proposed in this study:
(1) The safety education, training, and assessment of metro station staff should be enhanced. Moreover, highly skilled emergency personnel should be increased to improve the efficiency of handling emergencies. Additionally, the metro station can carry out some safety education activities for passengers to enhance their compliance with laws and regulations, as well as their emergency rescue knowledge and abilities, thereby improving personnel stability and rescue efficiency.
(2) It is suggested to enhance the development of emergency management mechanisms for metro station water disasters based on evaluated resilience levels. Tailored and effective emergency management mechanisms specific to water disasters at metro stations can effectively mitigate flooding events. Furthermore, the emergency management mechanisms should be constructed from a resilience perspective, focusing on the dynamic changes to the system, including pre-disaster prevention, responses during the disaster, and post-disaster recovery.
(3) It is suggested to strengthen equipment management to enhance equipment stability and redundancy. To ensure equipment stability and functionality, the metro station should reduce failure rates, maintenance pending rates, and misoperation rates. Furthermore, the pre-placement of redundant equipment in operational areas during normal equipment operation can facilitate immediate deployment in case of risks, ensuring the availability of power supply, air conditioning, and ventilation equipment, thereby enhancing the water disaster resilience of metro stations.
(4) Emphasis should be placed on enhancing operational environment management to optimize environmental stability and efficiency. Specifically, it is suggested to increase the security personnel and dredging personnel of the station floor and platform floor to ensure the smooth operation of the channel of the station floor and platform floor to improve the stability of the environment. The signage system of the subway station should be clear and concise, and the layout should be reasonable. Moreover, complete emergency guidelines and escape routes should be set up on platforms and concourse floors. Subway station staff should conduct regular safety drills so that they can deal with emergencies quickly and ensure the safety of passengers.
7. Conclusions
This study introduces a new metro station water disaster resilience evaluation model based on the combination weighting method and the extension cloud model. The model is applied to evaluate the water disaster resilience of Shapingba metro station, demonstrating its effectiveness and feasibility. Additionally, specific measures to enhance water disaster resilience in metro stations are proposed based on the resilience evaluation results. The main conclusions are as follows:
(1) Considering the absorption capacity, resistance capacity, recovery capacity, and adaptive capacity of metro stations, a metro station water disaster resilience evaluation indicator system consisting of 4 primary indicators and 27 secondary indicators is established. This system provides a reference for future metro station water disaster resilience evaluations and determines the level standards for the evaluation indicators according to relevant criteria and research.
(2) Subjective weights and objective weights of evaluation indicators are calculated based on the Analytic Hierarchy Process and entropy weight method. The combination weights of the resilience evaluation indicators are computed by integrating subjective and objective weights using the game theory. The combination weights consider the advantages of both subjective and objective weighting, avoiding deviation from the true results caused by a single weighting method, and ensuring the rationality and scientific validity of the evaluation results.
(3) The extension cloud model is applied to the evaluation of metro station water disaster resilience, combining the uncertainty reasoning characteristics of the cloud model with the qualitative and quantitative analysis advantages of the matter-element extension model. This effectively addresses the fuzziness and rationality in the evaluation process, transforming qualitative concepts and quantitative representations in the evaluation, reflecting the actual situation, and improving the accuracy and objectivity of the assessment.
(4) The established resilience evaluation model is applied to the resilience assessment of Shapingba metro station, resulting in a resilience level of IV, indicating a high level of resilience. The evaluation results align well with the actual situation, validating the rationality and feasibility of the established model. Additionally, corresponding measures to enhance water disaster resilience in metro stations are proposed based on the resilience evaluation results, providing valuable references for similar assessments of metro station water disaster resilience.
Author Contributions
Conceptualization, Y.W. and Y.L.; methodology, Y.W.; software, Y.W.; validation, Y.W., Y.L. and R.W.; formal analysis, Y.W.; investigation, Y.W.; resources, Y.L.; data curation, Y.L.; writing—original draft preparation, Y.W.; writing—review and editing, Y.W.; visualization, R.W.; supervision, R.W.; project administration, Y.L.; funding acquisition, Y.L. All authors have read and agreed to the published version of the manuscript.
Funding
This research is supported by the National Natural Science Foundation of China, grant number 52478042, the Social Science Planning Project of Chongqing Municipality, grant number 2023NDYB83, the Scientific Research Project of Chongqing Municipality on Planning and Natural Resources, grant number KJ-2023039, and the Open Project of State Key Laboratory of Subtropical Building Science, grant number 2022ZB05.
Data Availability Statement
The data will be made available on request.
Conflicts of Interest
The authors declare no conflicts of interest.
References
- Lin, D.; Broere, W.; Cui, J. Metro systems and urban development: Impacts and implications. Tunn. Undergr. Space Technol. 2022, 125, 104509. [Google Scholar] [CrossRef]
- Guo, D.S.; Meng, F.Y.; Wu, H.N.; Yang, X.X.; Liu, Z. Risk assessment of shield tunneling crossing building based on variable weight theory and cloud model. Tunn. Undergr. Space Technol. 2024, 145, 105593. [Google Scholar] [CrossRef]
- Lin, D.; Zhou, Z.; Weng, M.; Broere, W.; Cui, J. Metro systems: Construction, operation and impacts. Tunn. Undergr. Space Technol. 2024, 143, 105373. [Google Scholar] [CrossRef]
- Zhang, H.; Zhang, J.; Fang, H.; Yang, F. Urban flooding response to rainstorm scenarios under different return period types. Sustain. Cities Soc. 2022, 87, 104184. [Google Scholar] [CrossRef]
- Lyu, H.M.; Shen, S.L.; Zhou, A.; Yang, J. Perspectives for flood risk assessment and management for mega-city metro system. Tunn. Undergr. Space Technol. 2019, 84, 31–44. [Google Scholar] [CrossRef]
- Xie, X.; Huang, L.; Marson, S.M.; Wei, G. Emergency response process for sudden rainstorm and flooding: Scenario deduction and Bayesian network analysis using evidence theory and knowledge meta-theory. Nat. Hazards 2023, 117, 3307–3329. [Google Scholar] [CrossRef]
- Yang, H.; Zhao, L.; Chen, J. Metro System Inundation in Zhengzhou, Henan Province, China. Sustainability 2022, 14, 9292. [Google Scholar] [CrossRef]
- Lyu, H.M.; Sun, W.J.; Shen, S.L.; Arulrajah, A. Flood risk assessment in metro systems of mega-cities using a GIS-based modeling approach. Sci. Total Environ. 2018, 626, 1012–1025. [Google Scholar] [CrossRef]
- Lyu, H.M.; Shen, S.L.; Yang, J.; Yin, Z.Y. Inundation analysis of metro systems with the storm water management model incorporated into a geographical information system: A case study in Shanghai. Hydrol. Earth Syst. Sci. 2019, 23, 4293–4307. [Google Scholar] [CrossRef]
- Wang, G.; Liu, L.; Shi, P.; Zhang, G.; Liu, J. Flood Risk Assessment of Metro System Using Improved Trapezoidal Fuzzy AHP: A Case Study of Guangzhou. Remote Sens. 2021, 3, 5154. [Google Scholar] [CrossRef]
- Shin, E.; Kim, H.J.; Rhee, D.S.; Eom, T.; Song, C.G. Spatiotemporal flood risk assessment of underground space considering flood intensity and escape route. Nat. Hazards 2021, 10, 1539–1555. [Google Scholar] [CrossRef]
- He, R.; Zhang, L.; Tiong, R.L.K. Flood risk assessment and mitigation for metro stations: An evidential-reasoning-based optimality approach considering uncertainty of subjective parameters. Reliab. Eng. Syst. Saf. 2023, 238, 109453. [Google Scholar] [CrossRef]
- Liu, J.; Zheng, W.; Li, H.; Chen, J. Evaluation of Flooding Disaster Risks for Subway Stations Based on the PSR Cloud Model. Sustainability 2023, 15, 15552. [Google Scholar] [CrossRef]
- Tu, Y.; Shi, H.; Zhou, X.; Liu, L.; Lev, B. Flood risk assessment of metro stations based on the SMAA-2-FFS-H method: A case study of the “7∙20” rainstorm in Zhengzhou, China. Stoch. Environ. Res. Risk Assess. 2023, 37, 2849–2868. [Google Scholar] [CrossRef]
- Ed-daoui, I.; El Hami, A.; Itmi, M.; Hmina, N.; Mazri, T. Resilience assessment as a foundation for systems-of-systems safety evaluation: Application to an economic infrastructure. Saf. Sci. 2019, 115, 446–456. [Google Scholar] [CrossRef]
- Holling, C.S. Resilience and Stability of Ecological Systems. Annu. Rev. Ecol. Syst. 1973, 4, 1–23. [Google Scholar] [CrossRef]
- Nan, C.; Sansavini, G. A quantitative method for assessing resilience of interdependent infrastructures. Reliab. Eng. Syst. Saf. 2017, 157, 35–53. [Google Scholar] [CrossRef]
- Guo, Q.; Amin, S.; Hao, Q.; Haas, O. Resilience assessment of safety system at subway construction sites applying analytic network process and extension cloud models. Reliab. Eng. Syst. Saf. 2020, 201, 106956. [Google Scholar] [CrossRef]
- Wang, J.; Chen, Z.; Song, Y.; Liu, Y.; He, J.; Ma, S. Data-Driven Dynamic Bayesian Network Model for Safety Resilience Evaluation of Prefabricated Building Construction. Buildings 2024, 14, 570. [Google Scholar] [CrossRef]
- Shen, L.; Xue, Z.; Tang, L.; Ge, H. Research on Resilience Evaluation and Enhancement of Deep Foundation Pit Construction Safety System. Buildings 2022, 12, 1922. [Google Scholar] [CrossRef]
- Li, D. Research on Resilience Evaluation of Urban Rail Transit Line Under Rainstorm Disaster. Master’s Thesis, Chongqing Jiaotong University, Chongqing, China, 2022. [Google Scholar]
- Liu, L.; Pei, J.; Wang, H.; Luo, Y. The Evaluation and Obstacle Analysis of Urban Safety Resilience Based on Multi-Factor Perspective in Beijing. Land 2023, 12, 1918. [Google Scholar] [CrossRef]
- Tang, Y.; Bi, W.; Varga, L.; Dolan, T.; Li, Q. An integrated framework for managing fire resilience of metro station system: Identification, assessment, and optimization. Int. J. Disaster Risk Reduct. 2022, 77, 103037. [Google Scholar] [CrossRef]
- Jiao, L.; Li, D.; Zhang, Y.; Zhu, Y.; Huo, X.; Wu, Y. Identification of the Key Influencing Factors of Urban Rail Transit Station Resilience against Disasters Caused by Rainstorms. Land 2021, 10, 1298. [Google Scholar] [CrossRef]
- Wu, M.; Wu, Z.; Ge, W.; Wang, H.; Shen, Y.; Jiang, M. Identification of sensitivity indicators of urban rainstorm flood disasters: A case study in China. J. Hydrol. 2021, 599, 126393. [Google Scholar] [CrossRef]
- Xia, H.X.; Chen, J.; Zhao, B.; Yan, Z.; Cui, P.; Li, Q.; Yu, Z. Research on Safety Resilience Evaluation Model of Data Center Physical Infrastructure: An ANP-Based Approach. Buildings 2022, 12, 1911. [Google Scholar] [CrossRef]
- Jiao, L.; Zhu, Y.; Huo, X.; Wu, Y.; Zhang, Y. Resilience assessment of metro stations against rainstorm disaster based on cloud model: A case study in Chongqing, China. Nat. Hazards 2023, 116, 2311–2337. [Google Scholar] [CrossRef]
- Zhu, Y. Research on Resilience Evaluation of Underground Stations of Urban Rail Transit under Waterlogging. Master’s Thesis, Chongqing Jiaotong University, Chongqing, China, 2021. [Google Scholar]
- Li, Z.; Zhao, H.; Liu, J.; Zhang, J.; Shao, Z. Evaluation and promotion strategy of resilience of urban water supply system under flood and drought disasters. Sci. Rep. 2022, 12, 7404. [Google Scholar] [CrossRef]
- Chen, N.; Guo, H.; Zhang, Z.; Zhao, J. Evaluation of subway station flood safety resilience based on H-OWA operator and projection pursuit. China Saf. Sci. J. 2023, 33, 148–154. [Google Scholar]
- GB 50157-2013; Code for Design of Metro. Ministry of Housing and Urban-Rural Development of the People’s Republic of China: Beijing, China, 2014.
- Vaidya, O.S.; Kumar, S. Analytic hierarchy process: An overview of applications. Eur. J. Oper. Res. 2006, 169, 1–29. [Google Scholar] [CrossRef]
- Franek, J.; Kresta, A. Judgment scales and consistency measure in AHP. Procedia Econ. Financ. 2014, 12, 164–173. [Google Scholar] [CrossRef]
- Wehrl, A. General properties of entropy. Rev. Mod. Phys. 1978, 50, 221–260. [Google Scholar] [CrossRef]
- Zhu, Y.; Tian, D.; Yan, F. Effectiveness of Entropy Weight Method in Decision-Making. Math. Probl. Eng. 2020, 2020, 3564835. [Google Scholar] [CrossRef]
- Wang, Y. A novel evaluation model based on connection cloud model and game theory under multiple uncertainties. Soft Comput. 2023, 27, 645–656. [Google Scholar] [CrossRef]
- Cai, W. Extension theory and its application. Chin. Sci. Bull. 1999, 44, 1538–1548. [Google Scholar] [CrossRef]
- Li, D.; Liu, C.; Gan, W. A new cognitive model: Cloud model. Int. J. Intell. Syst. 2009, 24, 357–375. [Google Scholar] [CrossRef]
- Guo, D.; Meng, F.; Wu, H.; Yang, X.; Chen, R. Risk assessment of shield construction adjacent to the existing shield tunnel based on improved nonlinear FAHP. Tunn. Undergr. Space Technol. 2025, 155, 106154. [Google Scholar] [CrossRef]
- The Paper. The Shapingba Station of Chongqing Metro Was Temporarily Closed Due to Rainwater Flooding, but It Has Now Resumed Operations. 2021. Available online: https://www.thepaper.cn/newsDetail_forward_14531062 (accessed on 16 September 2021).
Disclaimer/Publisher’s Note: The statements, opinions and data contained in all publications are solely those of the individual author(s) and contributor(s) and not of MDPI and/or the editor(s). MDPI and/or the editor(s) disclaim responsibility for any injury to people or property resulting from any ideas, methods, instructions or products referred to in the content. |
© 2024 by the authors. Licensee MDPI, Basel, Switzerland. This article is an open access article distributed under the terms and conditions of the Creative Commons Attribution (CC BY) license (https://creativecommons.org/licenses/by/4.0/).