
Assessing Alterations of Rainfall Variability Under Climate Change in Zengwen Reservoir Watershed, Southern Taiwan


Abstract
1. Introduction
2. Data and Methods
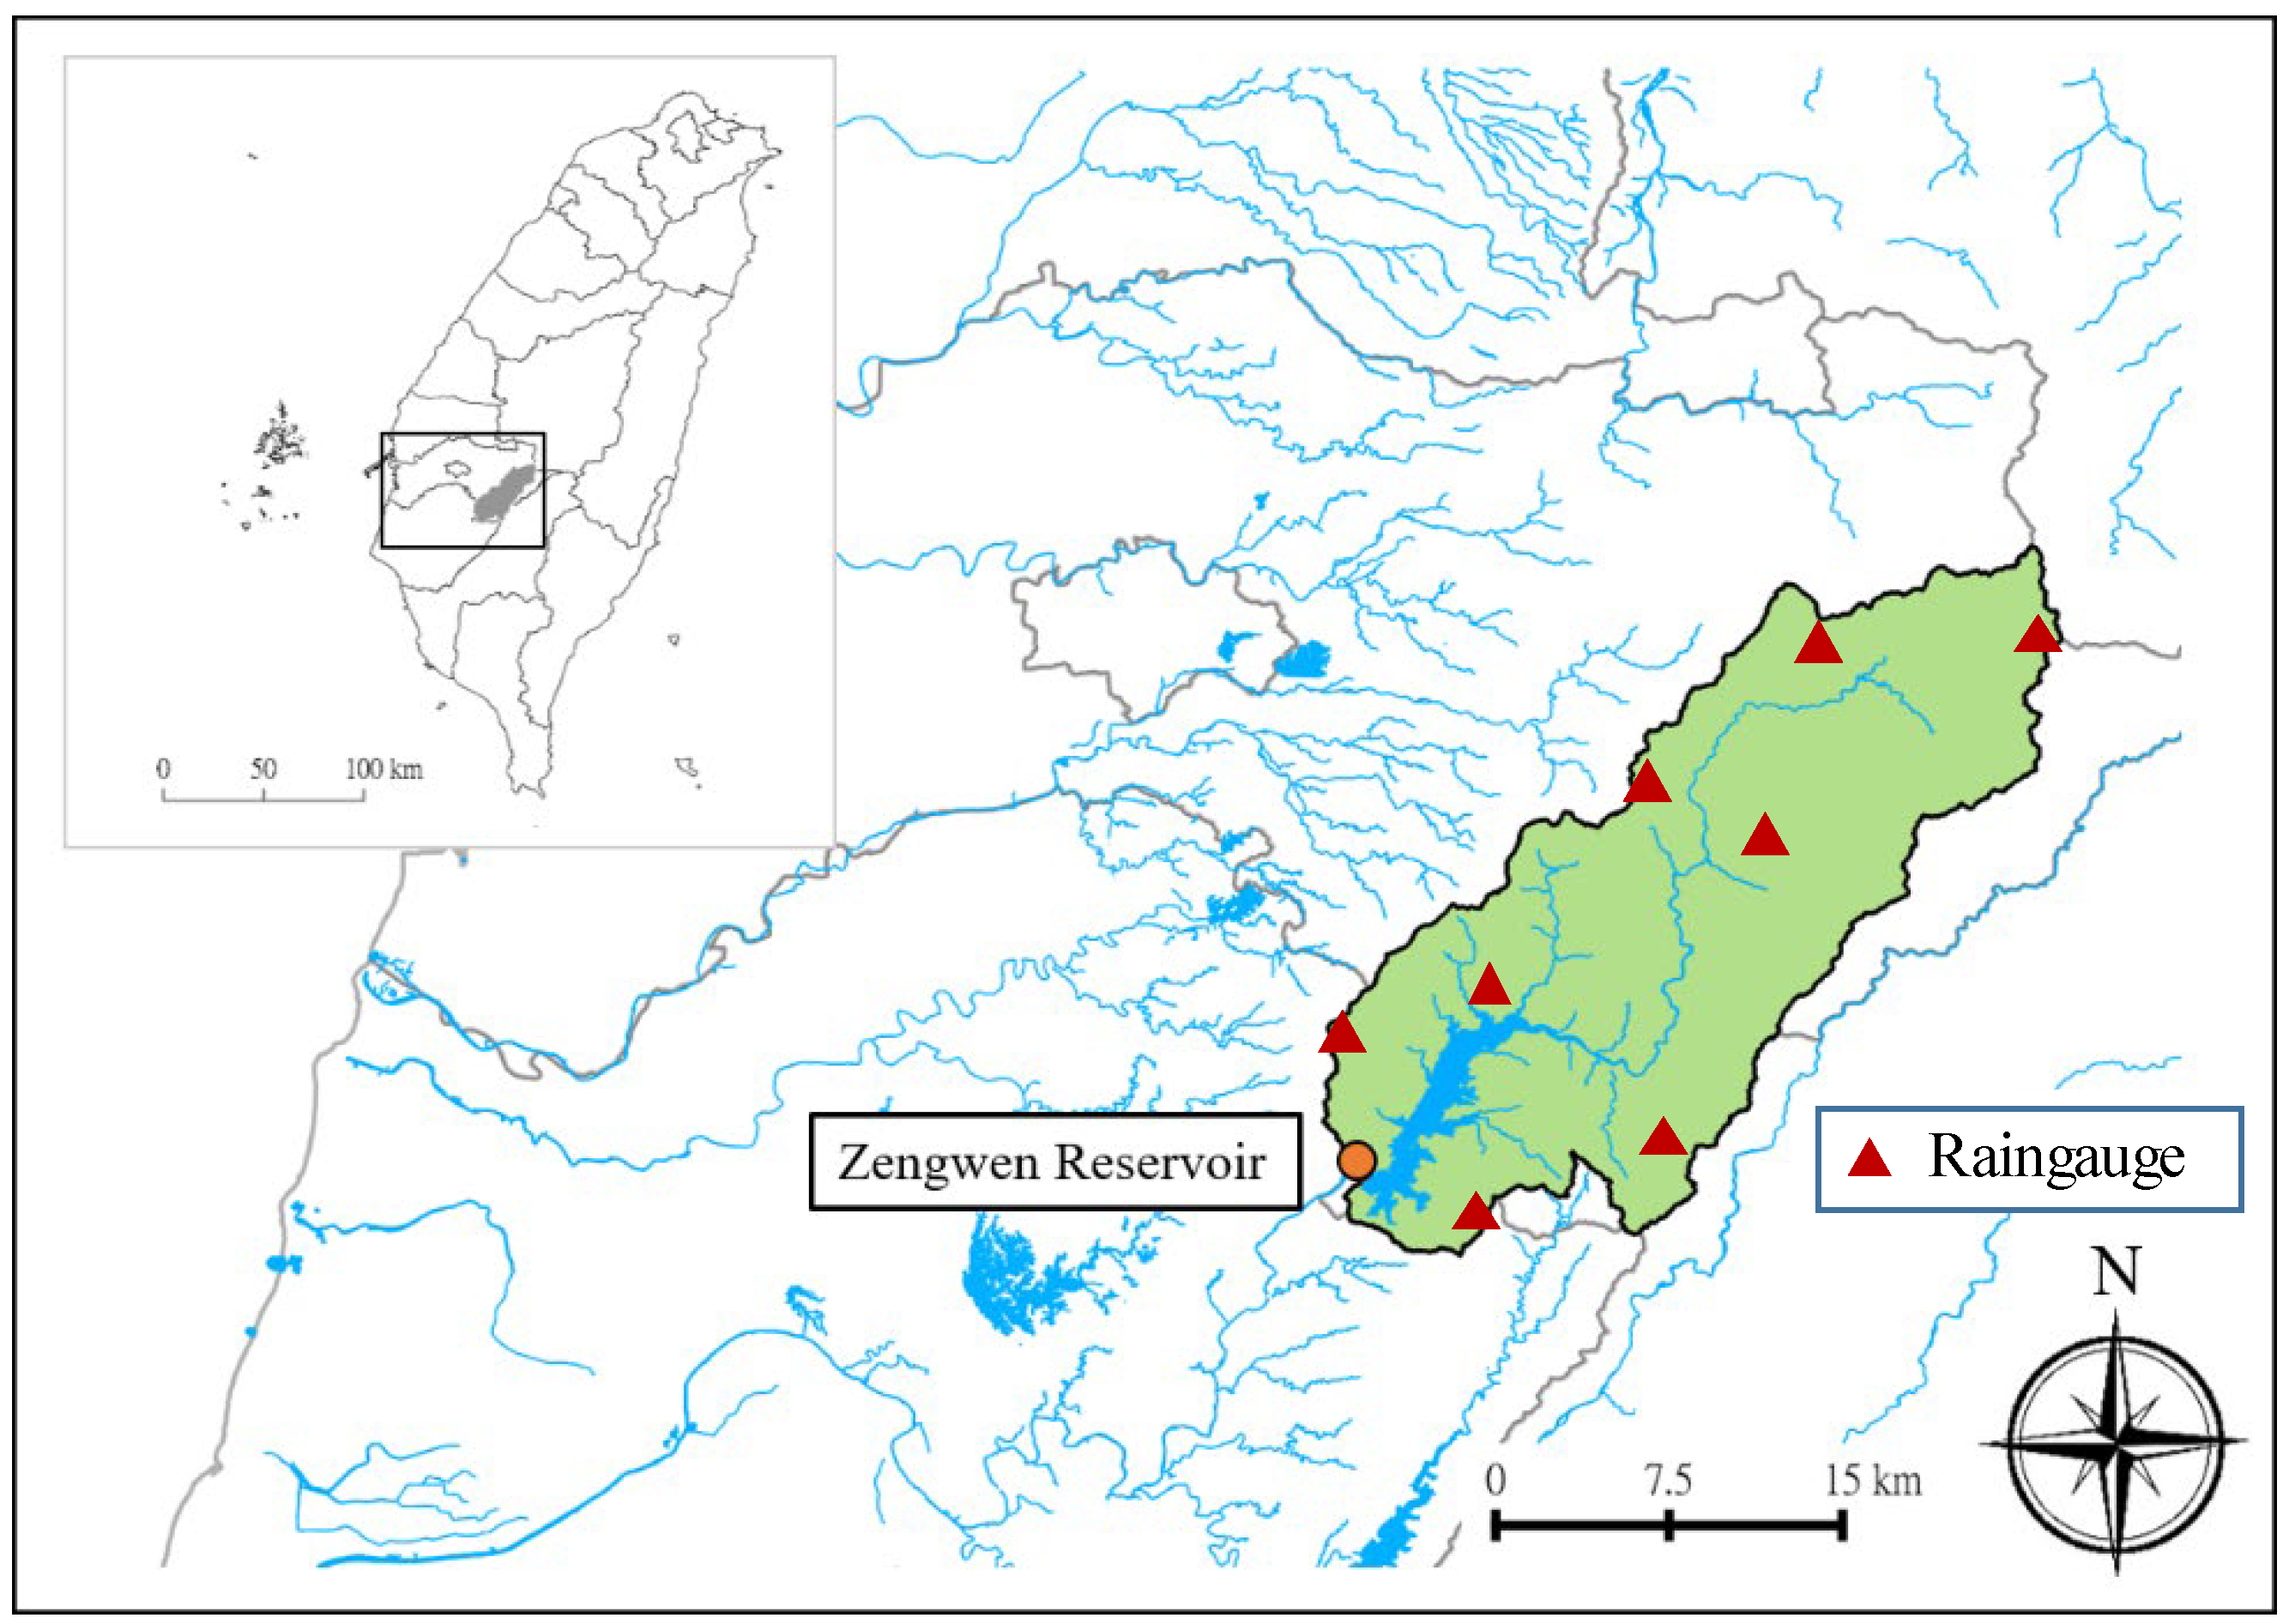
2.1. Study Area
2.2. Climate Models and Scenarios
2.3. Rainfall Unevenness Indices
2.4. Measures of Rainfall Variability Changes
3. Results and Discussion
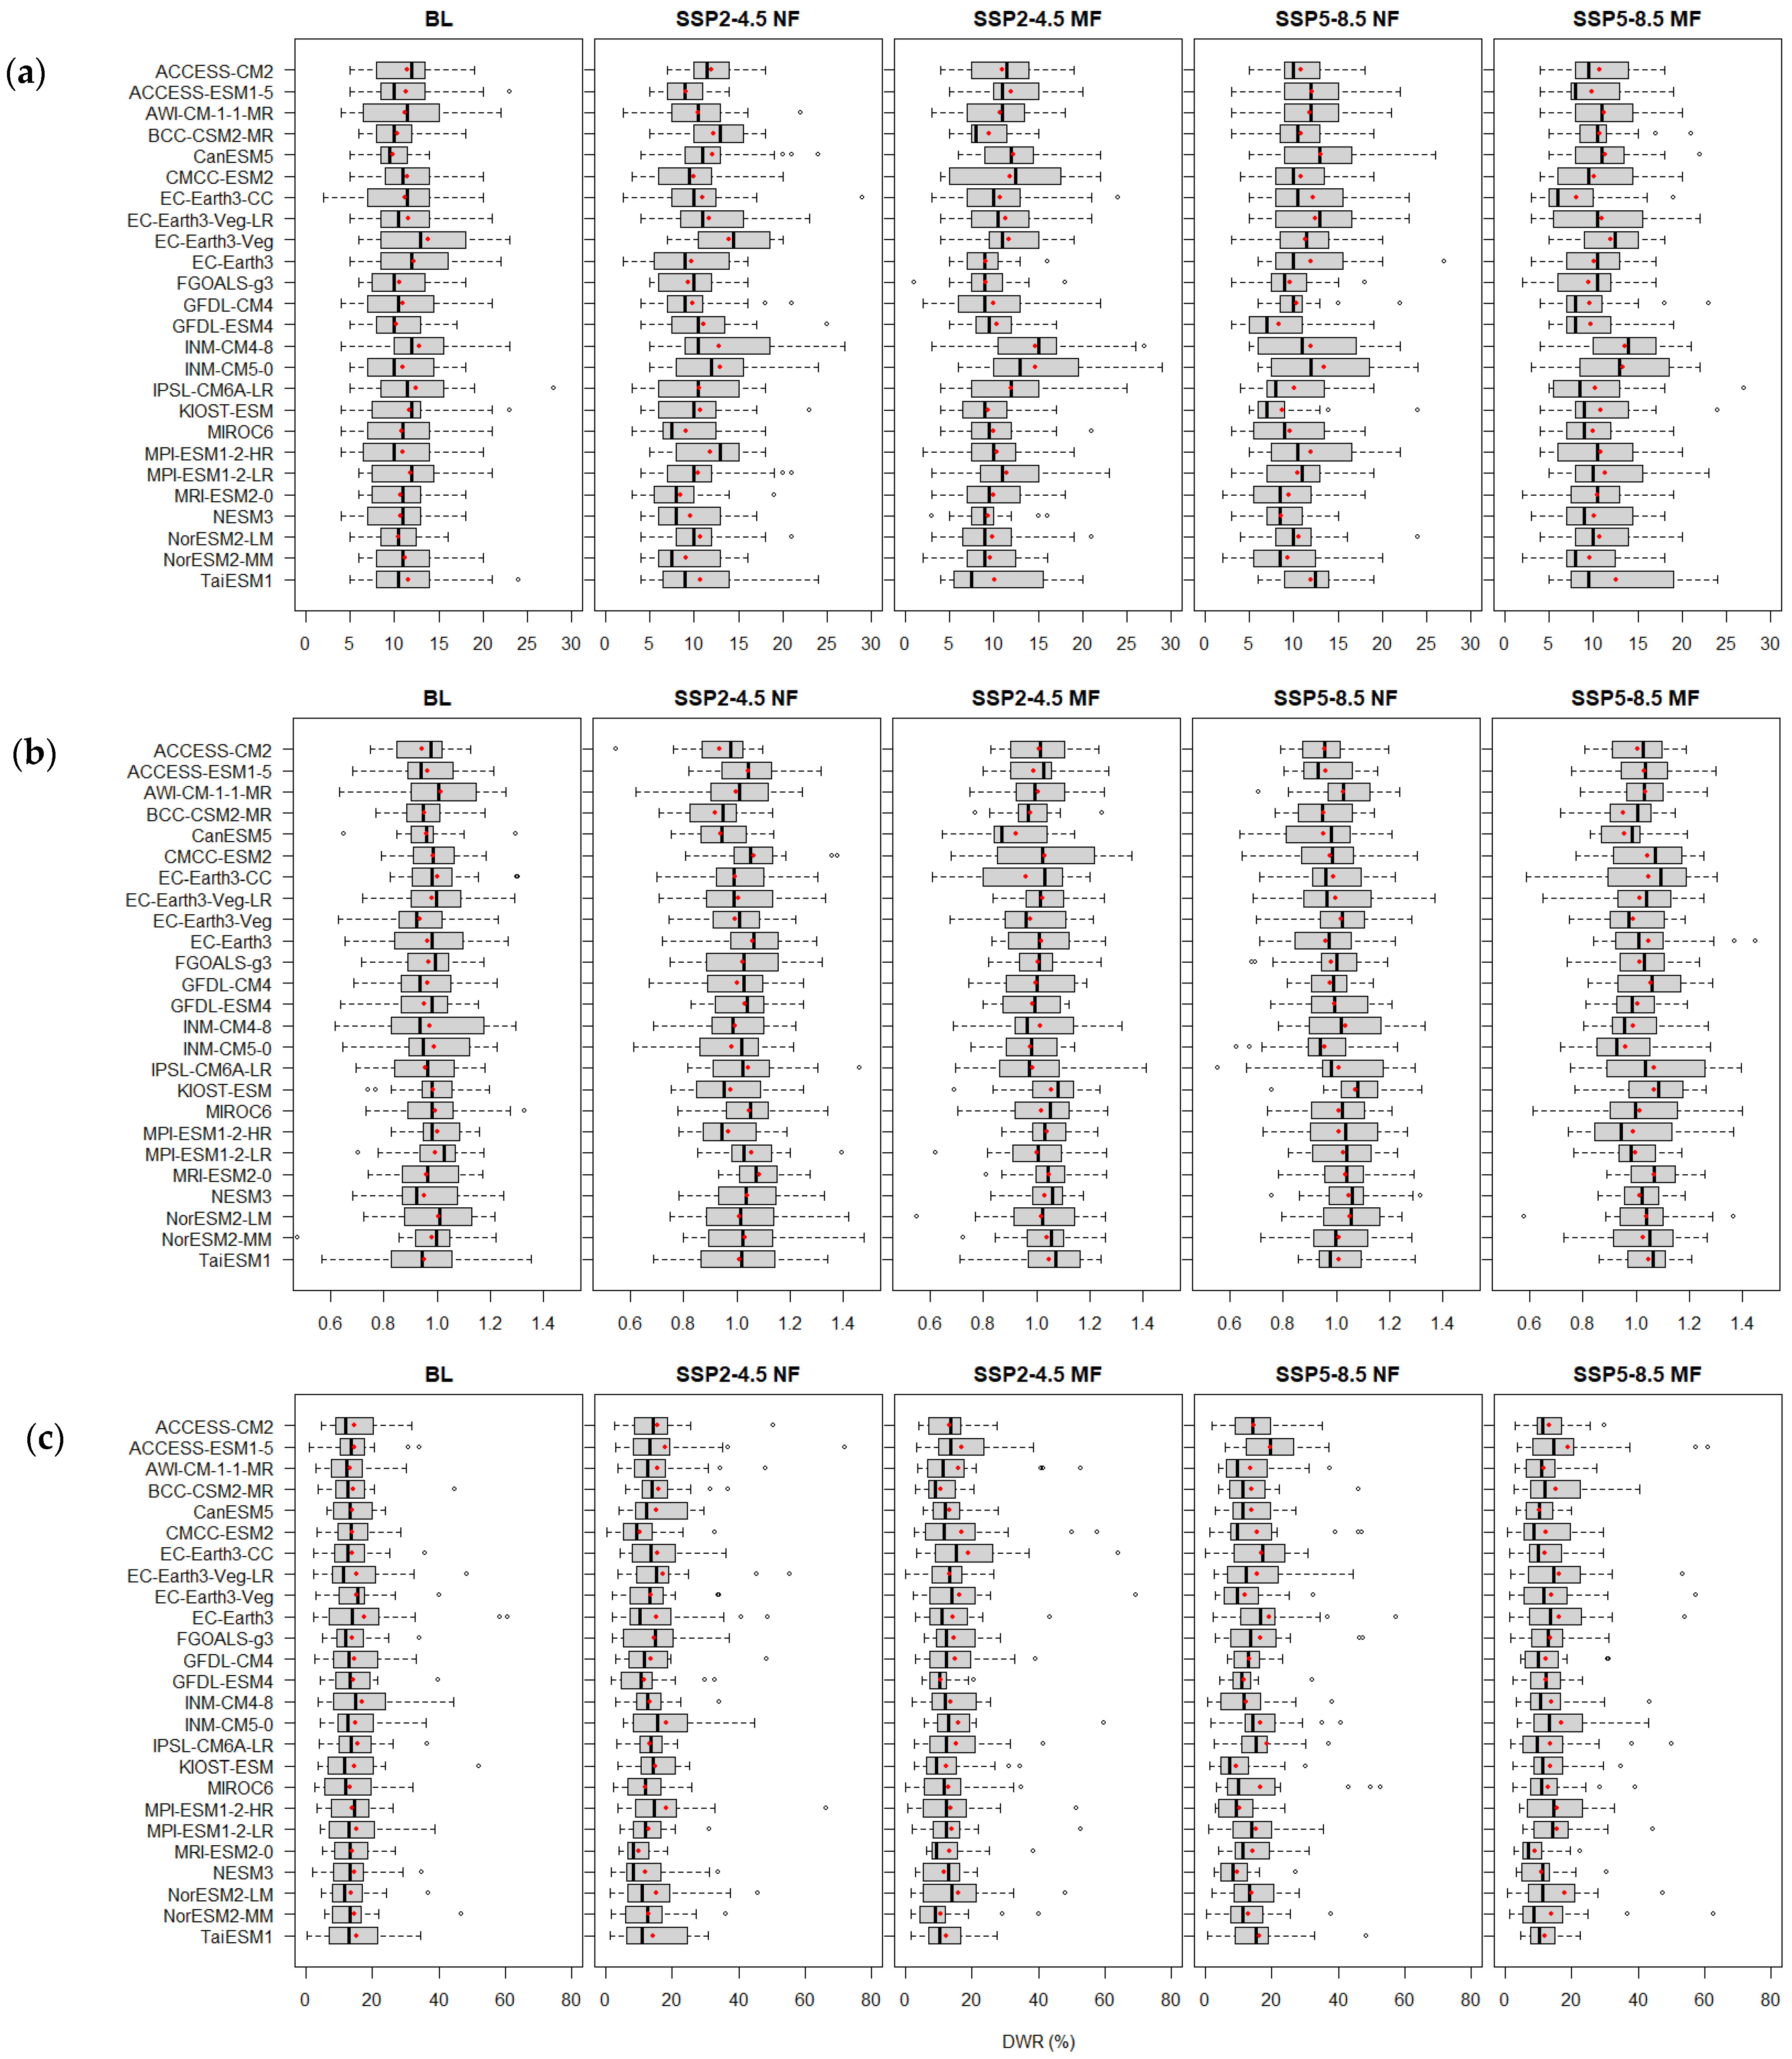
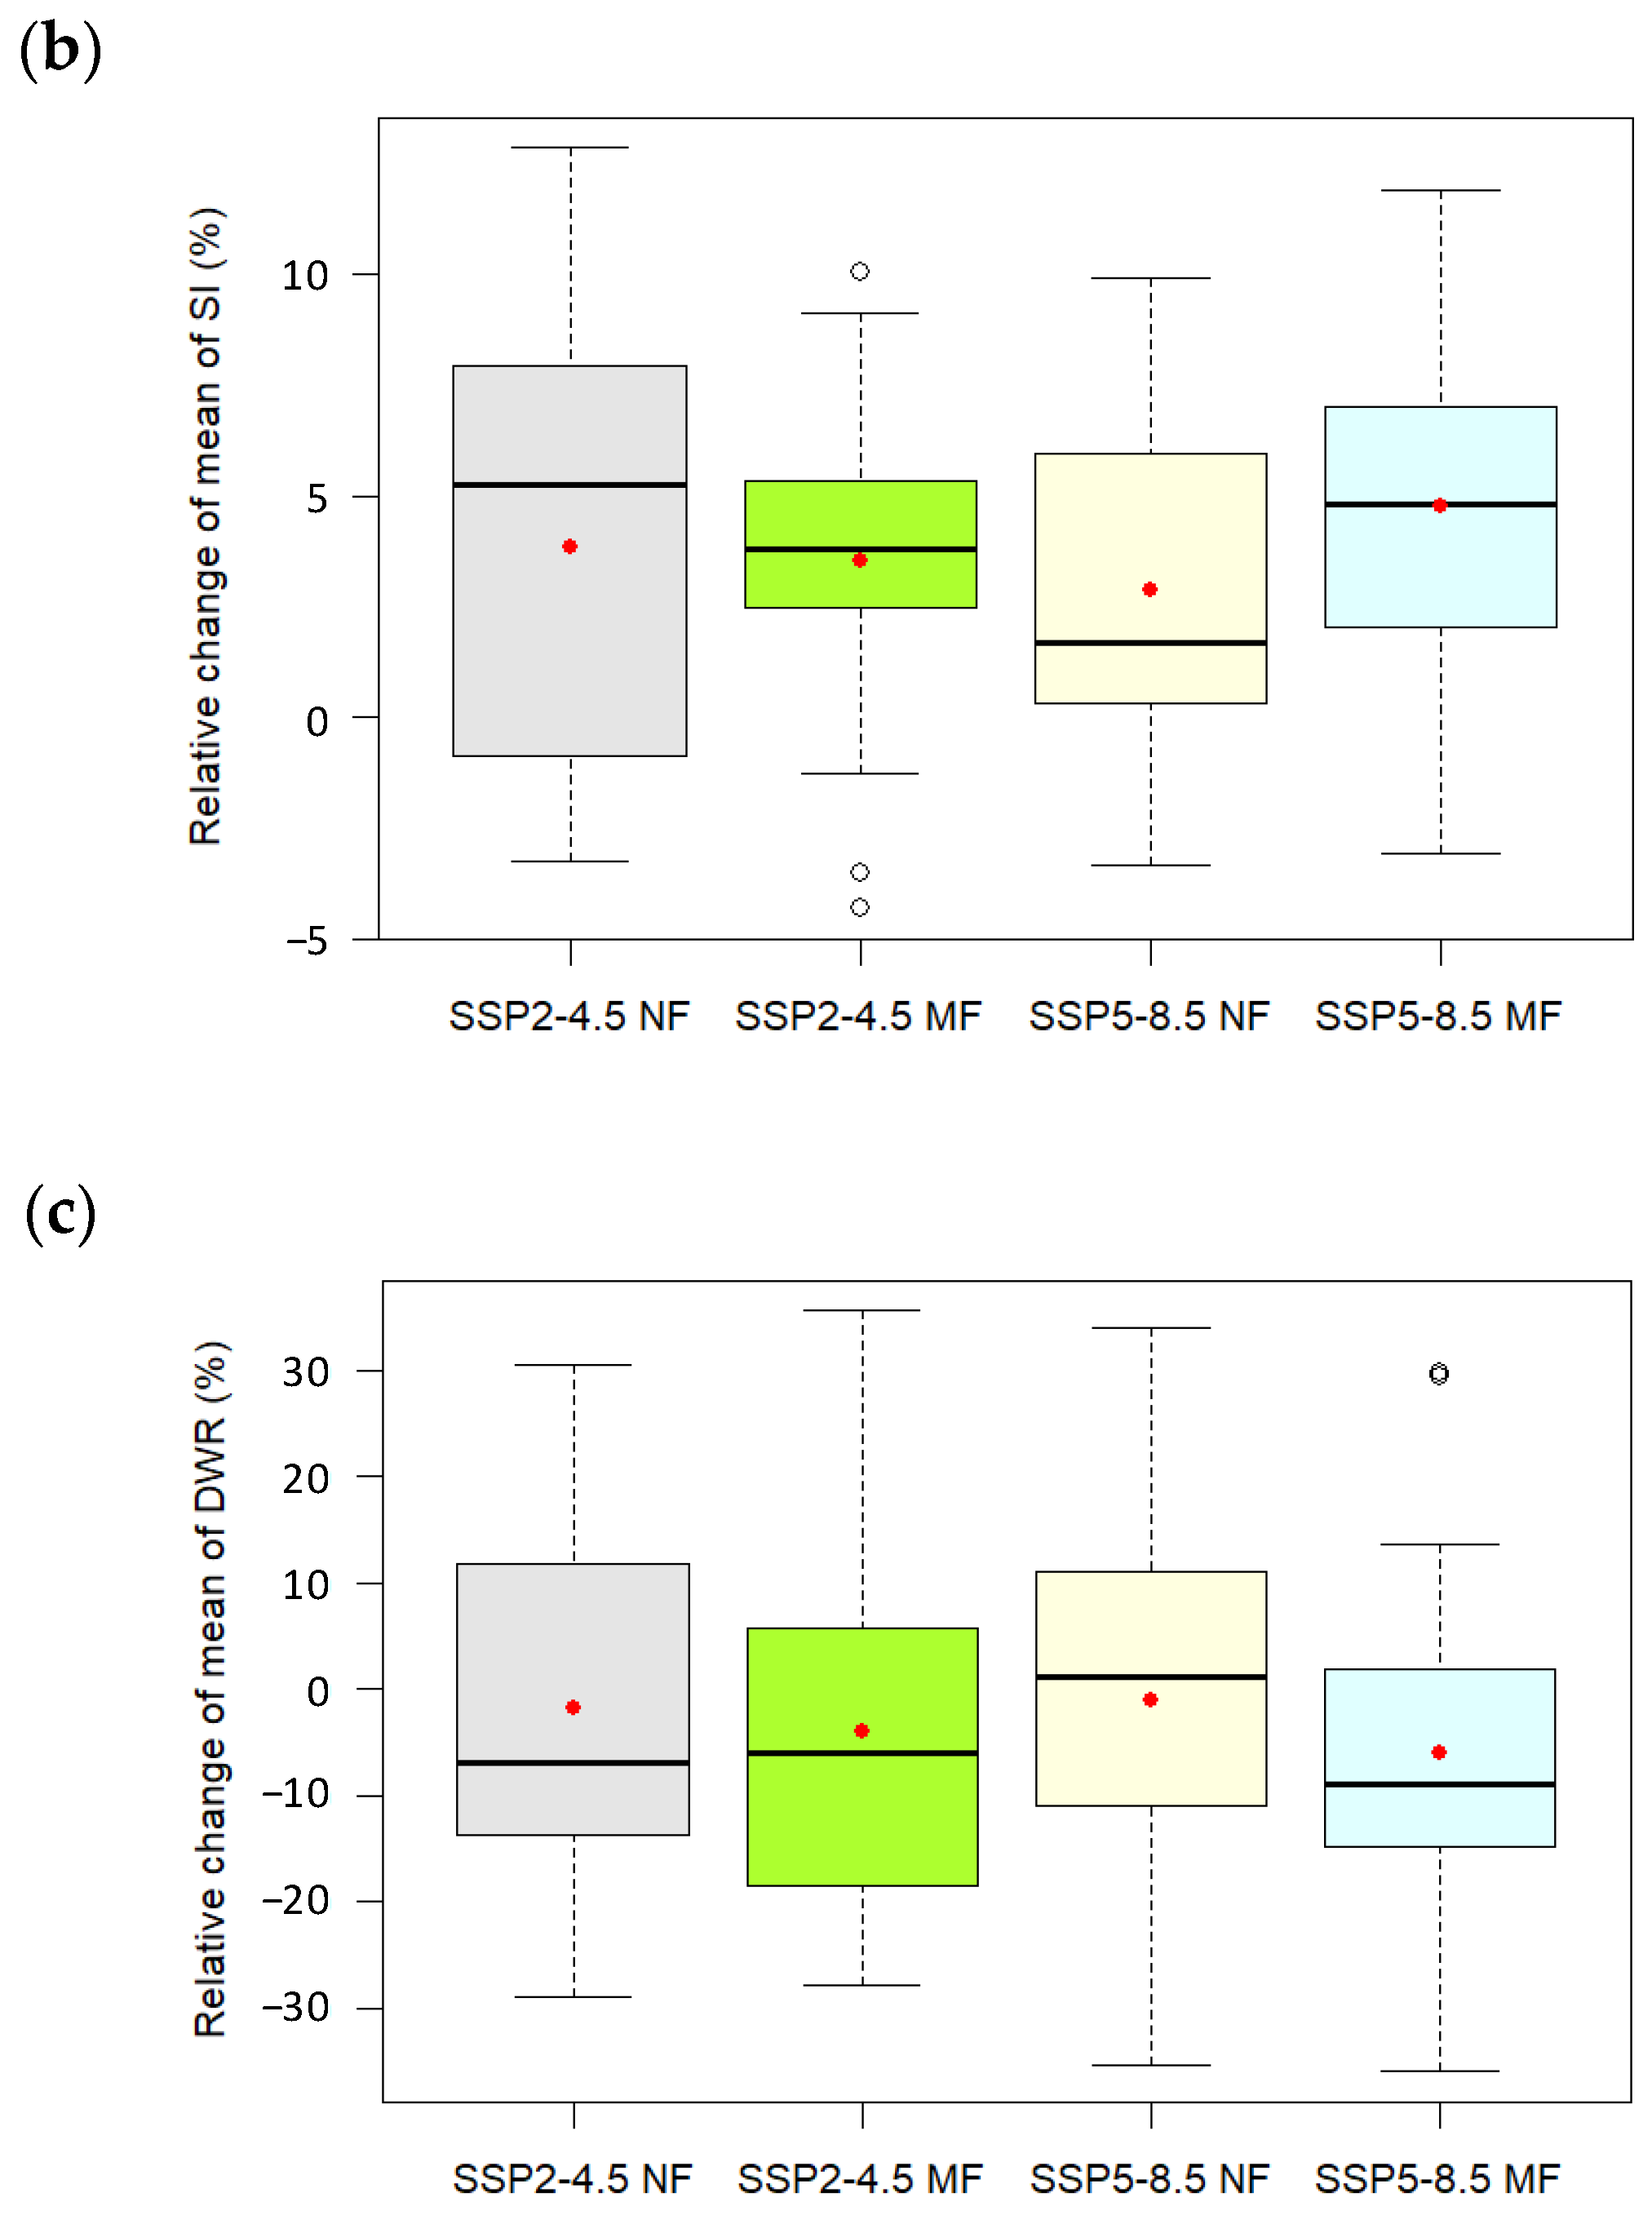
3.1. Relative Changes of Means for Rainfall Unevenness
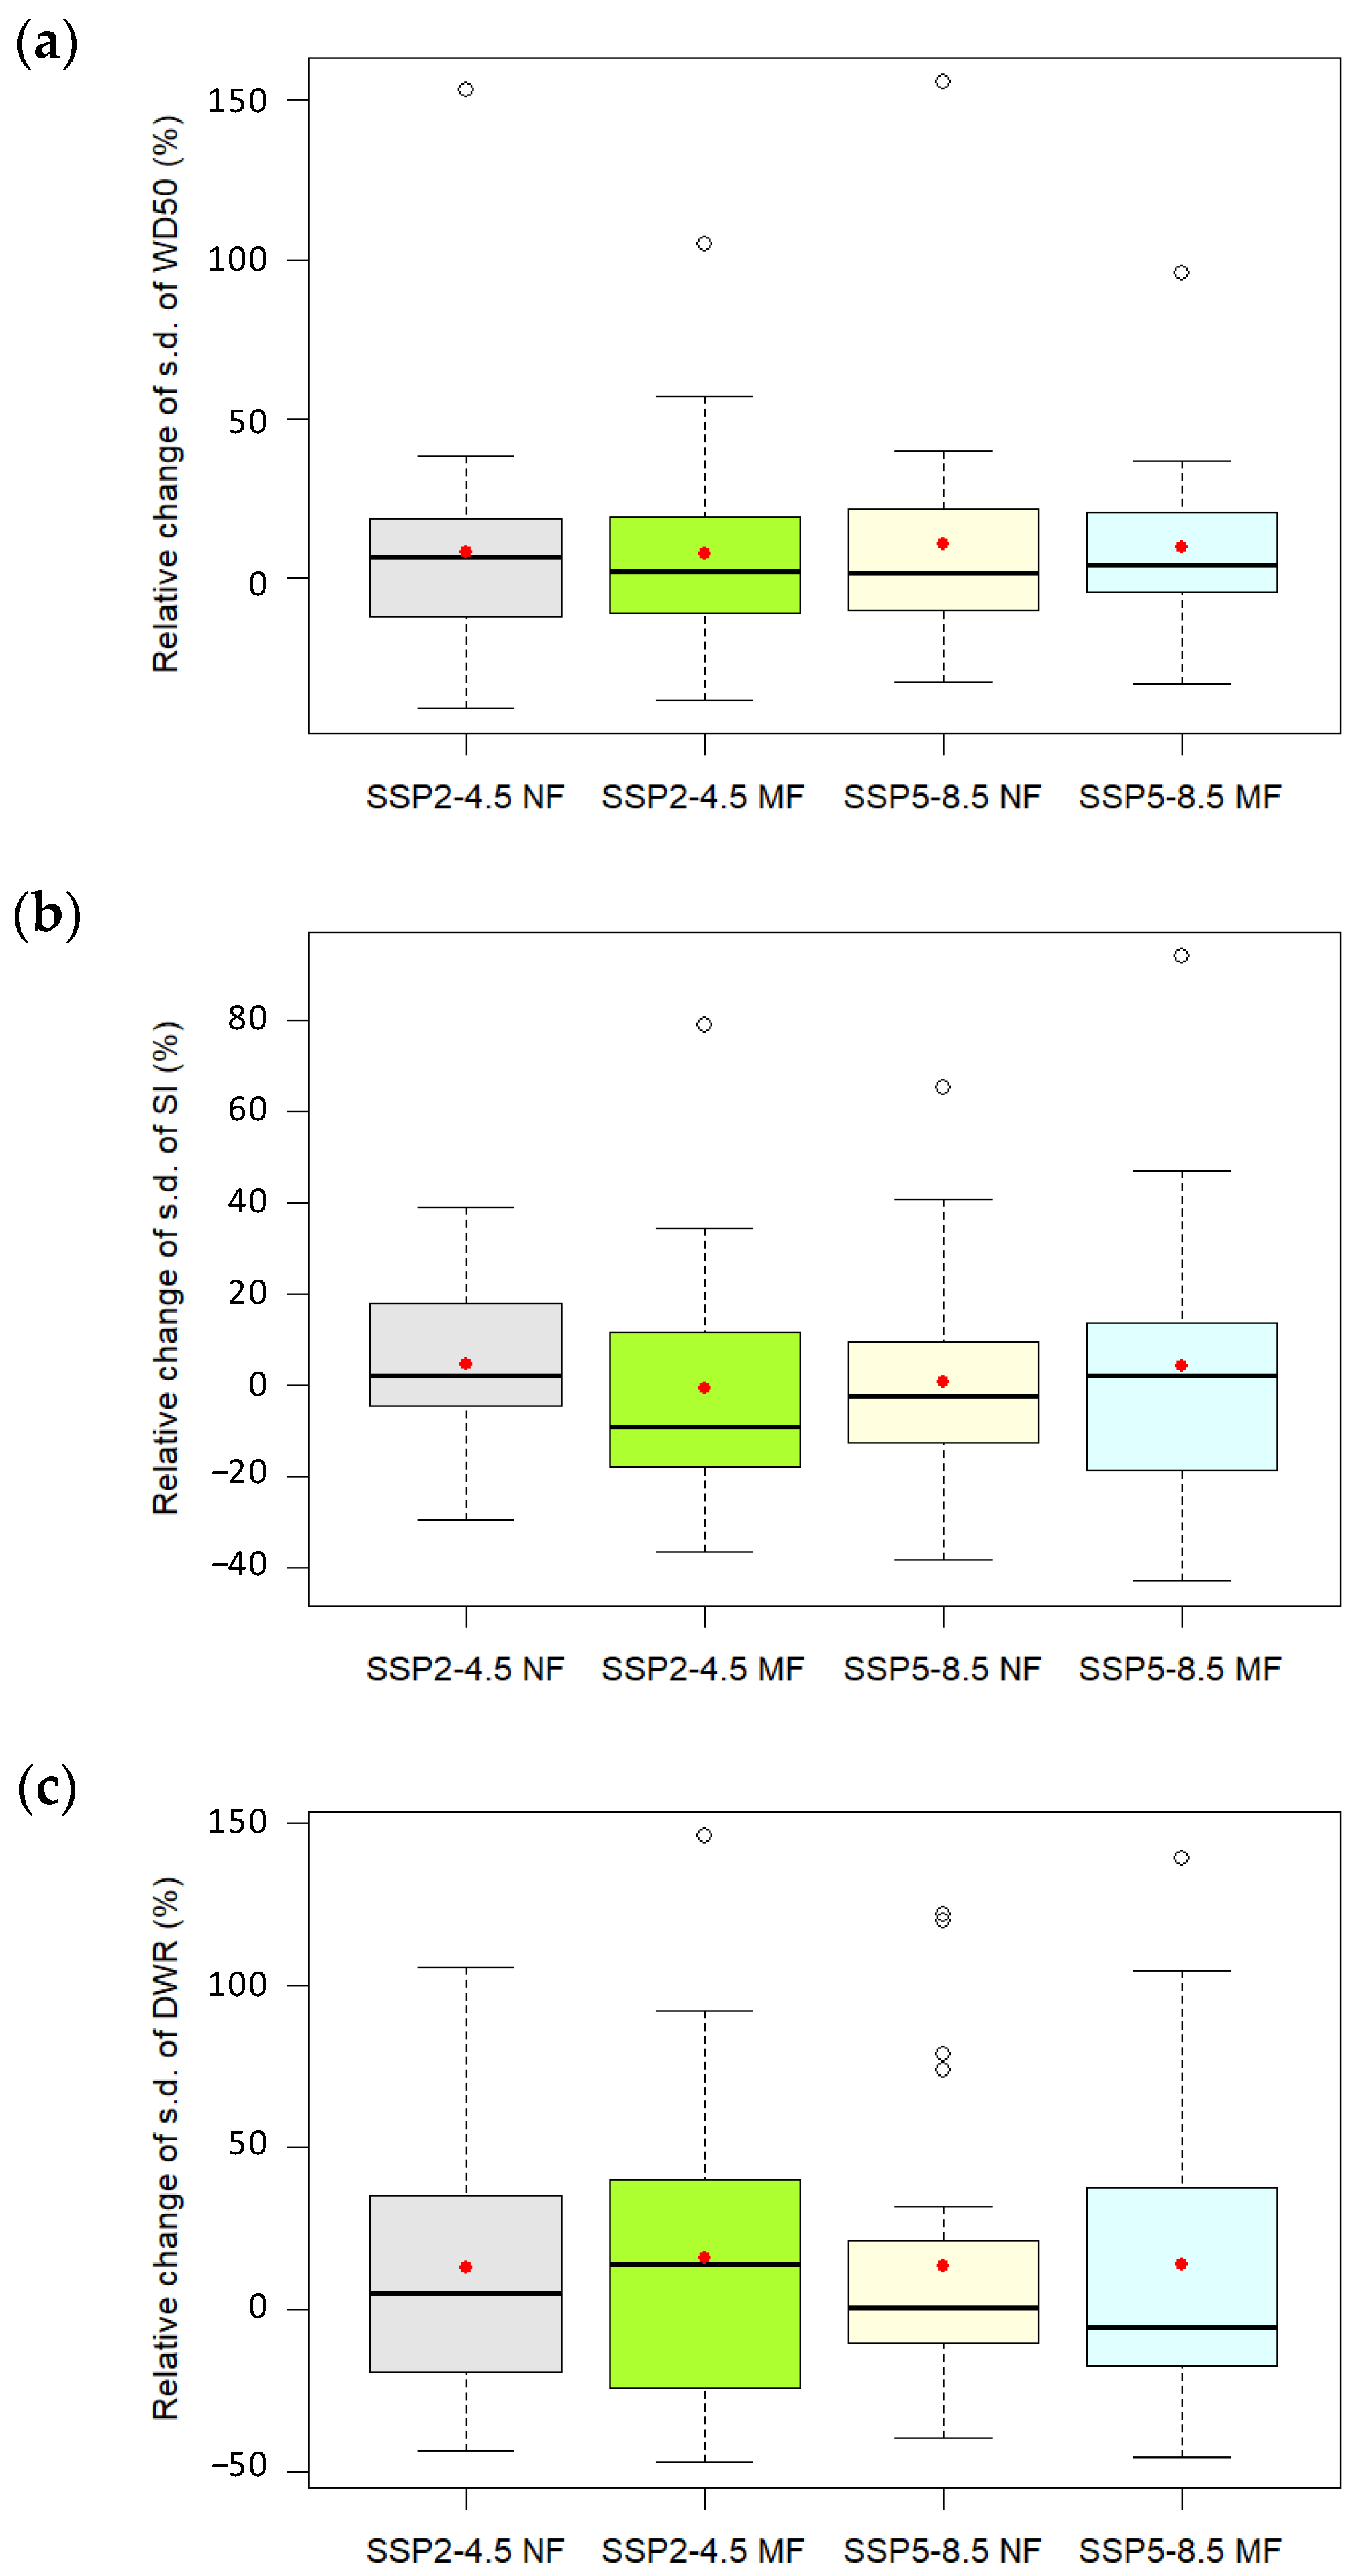
3.2. Relative Changes of Standard Deviations and Distributional Changes for Rainfall Unevenness
3.3. Discussion
4. Conclusions
Author Contributions
Funding
Data Availability Statement
Conflicts of Interest
References
- Trenberth, K.E. Conceptual framework for changes of extreme of the hydrological cycle with climate change. Clim. Chang. 1999, 42, 327–399. [Google Scholar] [CrossRef]
- Huntington, T.G. Evidence for intensification of the global water cycle: Review and synthesis. J. Hydrol. 2006, 319, 83–95. [Google Scholar] [CrossRef]
- Donat, M.G.; Lowry, A.L.; Alexander, L.A.; O’Gorman, P.A.; Maher, N. More extreme precipitation in the world’s dry and wet regions. Nat. Clim. Chang. 2016, 6, 508–513. [Google Scholar] [CrossRef]
- Madakumbura, G.D.; Kim, H.; Utsumi, N.; Shiogama, H.; Fischer, E.M.; Seland, Ø.; Scinocca, J.F.; Mitchell, D.M.; Hirabayashi, Y.; Oki, T. Event-to-event intensification of the hydrologic cycle from 1.5 °C to 2 °C warmer world. Sci. Rep. 2019, 9, 3483. [Google Scholar] [CrossRef]
- Allan, R.P.; Barlow, M.; Byrne, M.P.; Cherchi, A.; Douville, H.; Fowler, H.J.; Gan, T.Y.; Pendergrass, A.G.; Rosenfeld, D.; Swann, A.L.S.; et al. Advances in understanding large-scale responses of the water cycle to climate change. Ann. N. Y. Acad. Sci. 2020, 1472, 49–75. [Google Scholar] [CrossRef]
- Pratap, S.; Markonis, Y. The response of the hydrological cycle to temperature changes in recent and distant climatic history. Prog. Earth Planet. Sci. 2022, 9, 30. [Google Scholar] [CrossRef]
- Zhang, X.; Alexander, L.; Hegerl, G.C.; Jones, P.; Tank, A.K.; Peterson, T.C.; Trewin, B.; Zwiers, F.W. Indices for monitoring changes in extremes based on daily temperature and precipitation data. Wiley Interdiscip. Rev.–Clim. Chang. 2011, 2, 851–870. [Google Scholar] [CrossRef]
- Alexander, L.V.; Zhang, X.; Peterson, T.C.; Caesar, J.; Gleason, B.; Klein Tank, A.M.G.; Haylock, M.; Collins, D.; Trewin, B.; Rahimzadeh, F.; et al. Global observed changes in daily climate extremes of temperature and precipitation. J. Geophys. Res. Atmos. 2006, 11, D05109. [Google Scholar] [CrossRef]
- Hong, Y.; Ying, S. Characteristics of extreme temperature and precipitation in China in 2017 based on ETCCDI indices. Adv. Clim. Chang. Res. 2018, 9, 218–226. [Google Scholar]
- Gebrechorkos, S.H.; Hülsmann, S.; Bernhofer, C. Changes in temperature and precipitation extremes in Ethiopia, Kenya, and Tanzania. Int. J. Climatol. 2019, 39, 18–30. [Google Scholar] [CrossRef]
- Gbode, I.E.; Adeyeri, O.E.; Menang, K.P.; Intsiful, J.D.K.; Ajayi, V.O.; Omotosho, J.A.; Akinsanola, A.A. Observed changes in climate extremes in Nigeria. Meteorol. Appl. 2019, 26, 642–654. [Google Scholar] [CrossRef]
- Cooley, A.K.; Chang, H. Detecting change in precipitation indices using observed (1977–2016) and modeled future climate data in Portland, Oregon, USA. J. Water Clim. Chang. 2021, 12, 1135–1153. [Google Scholar] [CrossRef]
- Shiau, J.T.; Wu, P.S. Nonstationary distributional changes of annual rainfall indices in Taiwan. Asia-Pac. J. Atmos. Sci. 2021, 57, 435–450. [Google Scholar] [CrossRef]
- Moraglia, G.; Brattich, E.; Carbone, G. Precipitation trends in North and South Carolina, USA. J. Hydrol. Reg. Stud. 2022, 44, 101201. [Google Scholar] [CrossRef]
- López, J.J.; Ayuso-Muñoz, J.L.; Goñi, M.; Gimena, F.N. Analysis of the effect of climate change on the characteristics of rainfall in Igeldo-Gipuzkoa (Spain). Water 2023, 15, 1529. [Google Scholar] [CrossRef]
- Silmann, J.; Kharin, V.V.; Zhang, X.; Zwiers, F.W.; Bronaugh, D. Climate extremes indices in the CMIP5 multimodel ensemble: Part1. Model evaluation in present climate. J. Geophys. Res. Atmos. 2013, 118, 1716–1733. [Google Scholar] [CrossRef]
- Jiang, Z.; Li, W.; Xu, J.; Li, L. Extreme precipitation indices over China in CMIP5 Models. Part I: Model evaluation. J. Clim. 2015, 28, 8603–8619. [Google Scholar] [CrossRef]
- Akinsanola, A.A.; Kooperman, G.J.; Reed, K.A.; Pendergrass, A.G.; Hannah, W.M. Projected changes in seasonal precipitation extremes over the United States in CMIP6 simulations. Environ. Res. Lett. 2020, 15, 104068. [Google Scholar] [CrossRef]
- Srivastava, A.; Grotjahn, R.; Ullrich, P.A. Evaluation of historical CMIP6 model simulations of extreme precipitation over contiguous US regions. Weather Clim. Extrem. 2020, 29, 100268. [Google Scholar] [CrossRef]
- Rojpratak, S.; Supharatid, S. Regional extreme precipitation index: Evaluations and projections from the multi-model ensemble CMIP5 over Thailand. Weather Clim. Extrem. 2022, 37, 100475. [Google Scholar] [CrossRef]
- de Medeiros, F.J.; de Oliveira, C.P.; Avila-Diaz, A. Evaluation of extreme precipitation climate indices and their projected changes for Brazil: From CMIP3 to CMIP6. Weather Clim. Extrem. 2022, 38, 100511. [Google Scholar] [CrossRef]
- Lei, X.; Xu, C.; Liu, F.; Song, L.; Cao, L.; Suo, N. Evaluation of CMIP6 models and multi-model ensemble for extreme precipitation over arid Central Asia. Remote Sens. 2023, 15, 2376. [Google Scholar] [CrossRef]
- Zhao, J.; Gan, T.Y.; Zhang, G.; Zhang, S. Projected changes of precipitation extremes in North America using CMIP6 multi-climate model ensembles. J. Hydrol. 2023, 621, 129598. [Google Scholar] [CrossRef]
- Pendergrass, A.G.; Knutti, R. The uneven nature of daily precipitation and its change. Geophys. Res. Lett. 2018, 45, 11980–11988. [Google Scholar] [CrossRef]
- Chen, Y. Increasing uneven intra-seasonal distribution of daily and hourly precipitation over Eastern China. Environ. Res. Lett. 2020, 15, 104068. [Google Scholar] [CrossRef]
- Rajah, K.; O’Leary, T.; Turner, A.; Petrakis, G.; Leonard, M.; Westra, S. Changes to the temporal distribution of daily precipitation. Geophys. Res. Lett. 2014, 41, 8887–8894. [Google Scholar] [CrossRef]
- Zhang, Y.; Fueglistaler, S. Mechanism for increasing tropical rainfall unevenness with global warming. Geophys. Res. Lett. 2019, 46, 14836–14843. [Google Scholar] [CrossRef]
- Zou, S.; Abuduwaili, J.; Duan, W.; Ding, J.; De Maeyer, P.; De Voorde, T.V.; Ma, L. Attribution of changes in the trend and temporal non-uniformity of extreme precipitation events in Central Asia. Sci. Rep. 2021, 11, 15032. [Google Scholar] [CrossRef]
- Nguyen, D.Y.; Chen, S.T. Generating continuous rainfall series of high temporal resolution using stochastic rainfall generator with copula and modified Huff rainfall curves. Water 2022, 14, 2123. [Google Scholar] [CrossRef]
- Wu, G.; Li, Y.; Li, T.; Ma, Z.; Shi, C.G. The unevenness in observed daily precipitation in mainland China. Theor. Appl. Climatol. 2021, 146, 1031–1041. [Google Scholar] [CrossRef]
- Han, J.; Miao, C.; Duan, Q.; Wu, J.; Gou, J.; Zheng, H. Changes in unevenness of wet-day precipitation over China during 1961–2020. J. Geophys. Res. Atmos. 2021, 126, e2020JD034483. [Google Scholar] [CrossRef]
- Ahn, M.S.; Ullrich, P.A.; Gleckler, P.J.; Lee, J.; Ordonez, A.C.; Pendergrass, A.G. Evaluating precipitation distributions at regional scales: A benchmarking framework and application to CMIP5 and 6 models. Geosci. Model Dev. 2023, 16, 3927–3951. [Google Scholar] [CrossRef]
- Goffin, B.D.; Kansara, P.; Lakshmi, V. Intensification in the wettest days to 50 percent of annual precipitation (WD50) across Europe. Geophys. Res. Lett. 2024, 51, e2023GL107403. [Google Scholar] [CrossRef]
- Huang, W.C.; Chiang, Y.; Wu, R.Y.; Lee, J.L.; Lin, S.H. The impact of climate change on rainfall frequency in Taiwan. Terr. Atmos. Ocean. Sci. 2012, 23, 553–564. [Google Scholar] [CrossRef]
- Tung, Y.S.; Chen, C.T.; Min, S.K.; Lin, L.Y. Evaluating extremes rainfall changes over Taiwan using a standardized index. Terr. Atmos. Ocean. Sci. 2016, 27, 705–715. [Google Scholar] [CrossRef]
- Chen, P.Y.; Tung, C.P.; Tsao, J.H.; Chen, C.J. Assessing future rainfall intensity-duration-frequency characteristics across Taiwan using the k-nearest neighbor method. Water 2021, 13, 1521. [Google Scholar] [CrossRef]
- Tung, Y.S.; Wang, C.Y.; Weng, S.P.; Yang, C.D. Extremes index trend of daily gridded rainfall dataset (1960–2017) in Taiwan. Terr. Atmos. Ocean. Sci. 2022, 33, 8. [Google Scholar] [CrossRef]
- Tung, C.P. Climate change impacts on water resources of the Tsengwen Creek watershed in Taiwan. J. Am. Water Resour. Assoc. 2001, 37, 167–176. [Google Scholar] [CrossRef]
- Kimura, N.; Chiang, S.; Wei, H.P.; Su, Y.F.; Chu, J.L.; Cheng, C.T.; Liou, J.J.; Chen, Y.M.; Lin, L.Y. Tsengwen Reservoir watershed hydrological flood simulation under global climate change using the 20 km mesh Meteorological Research Institute Atmospheric General Circulation Model (MRI-AGCM). Terr. Atmos. Ocean. Sci. 2014, 25, 449–461. [Google Scholar] [CrossRef]
- Wei, H.P.; Yeh, K.C.; Liou, J.J.; Chen, Y.M.; Cheng, C.T. Estimating the risk of river flow under climate change in the Tsengwen River basin. Water 2016, 8, 81. [Google Scholar] [CrossRef]
- Teng, T.Y.; Liu, T.M.; Tung, Y.S.; Cheng, K.S. Converting climate change gridded daily rainfall to station daily rainfall—A case study at Zengwen Reservoir. Water 2021, 13, 1516. [Google Scholar] [CrossRef]
- Wang, Y.C.; Hsu, H.H.; Chen, C.A.; Tseng, W.L.; Hsu, P.C.; Lin, C.W.; Chen, Y.L.; Jiang, L.C.; Lee, Y.C.; Liang, H.C.; et al. Performance of the Taiwan Earth System Model in simulating climate variability compared with observations and CMIP6 model simulations. J. Adv. Model. Earth Syst. 2021, 13, e2020MS002353. [Google Scholar] [CrossRef]
- Gleckler, P.J.; Taylor, K.E.; Doutriaux, C. Performance metrics for climate models. J. Geophys. Res. 2008, 113, D06194. [Google Scholar] [CrossRef]
- Baker, N.C.; Taylor, P.C. A framework for evaluating climate model performance metrics. J. Clim. 2016, 29, 1773–1782. [Google Scholar] [CrossRef]
- Peng, S.; Wang, C.; Li, Z.; Mihara, K.; Kuramochi, K.; Toma, Y.; Hatano, R. Climate change multi-model projections in CMIP6 scenarios in Central Hokkaido, Japan. Sci. Rep. 2023, 13, 230. [Google Scholar] [CrossRef]
- Bosshard, T.; Carambia, M.; Goergen, K.; Kotlarski, S.; Krahe, P.; Zappa, M.; Schär, C. Quantifying uncertainty sources in an ensemble of hydrological climate-impact projections. Water Resour. Res. 2013, 49, 1523–1536. [Google Scholar] [CrossRef]
- Addor, N.; Rössler, O.; Köplin, N.; Huss, M.; Weingartner, R.; Seibert, J. Robust changes and sources of uncertainty in the projected hydrological regimes of Swiss catchments. Water Resour. Res. 2014, 50, 7541–7562. [Google Scholar] [CrossRef]
- Hattermann, F.F.; Vetter, T.; Breuer, L.; Su, B.; Daggupati, P.; Donnelly, C.; Fekete, B.; Flörke, F.; Gosling, S.N.; Hoffmann, P.; et al. Sources of uncertainty in hydrological climate impact assessment: A cross-scale study. Environ. Res. Lett. 2018, 13, 015006. [Google Scholar] [CrossRef]
- Chegwidden, O.S.; Nijssen, B.; Rupp, D.E.; Arnold, J.R.; Clark, M.P.; Hamman, J.J.; Kao, S.C.; Mao, Y.; Mizukami, N.; Mote, P.W.; et al. How do modeling decisions affect the spread among hydrologic climate change projections? Exploring a large ensemble of simulations across a diversity of hydroclimates. Earth’s Future 2019, 7, 623–637. [Google Scholar] [CrossRef]
- Lin, L.Y.; Lin, C.T.; Chen, Y.M.; Cheng, C.T.; Li, H.C.; Chen, W.B. The Taiwan Climate Change Projection Information and Adaptation Knowledge Platform: A decade of climate research. Water 2022, 14, 358. [Google Scholar] [CrossRef]
- O’Neill, B.C.; Kriegler, E.; Ebi, K.L.; Kemp-Benedict, E.; Riahi, K.; Rothman, D.S.; van Ruijven, B.J.; van Vuuren, D.P.; Birkmann, J.; Kok, K.; et al. The roads ahead: Narratives for shared socioeconomic pathways describing world futures in the 21st century. Glob. Environ. Chang. 2017, 42, 169–180. [Google Scholar] [CrossRef]
- Riahi, K.; van Vuuren, D.P.; Kriegler, E.; Edmonds, J.; O’Neill, B.C.; Fujimori, S.; Bauer, N.; Calvin, K.; Dellink, R.; Fricko, O.; et al. The shared socioeconomic pathways and their energy, land use, and greenhouse gas emissions implications: An Overview. Glob. Environ. Chang. 2017, 42, 153–168. [Google Scholar] [CrossRef]
- van Vuuren, D.P.; Edmonds, J.; Kainuma, M.; Riahi, K.; Thomson, A.; Hibbard, K.; Hurtt, G.C.; Kram, T.; Krey, V.; Lamarque, J.-F.; et al. The representative concentration pathways: An overview. Clim. Chang. 2011, 109, 5–31. [Google Scholar] [CrossRef]
- Simpkins, G. Progress in climate modelling. Nat. Clim. Chang. 2017, 7, 684–686. [Google Scholar] [CrossRef]
- O’Neill, B.C.; Tebaldi, C.; van Vuuren, D.P.; Eyring, V.; Friedlingstein, P.; Hurtt, G.; Knutti, R.; Kriegler, E.; Lamarque, J.F.; Lowe, J.; et al. The Scenario Model Intercomparison Project (ScenarioMIP) for CMIP6. Geosci. Model Dev. 2016, 9, 3461–3482. [Google Scholar] [CrossRef]
- Pryor, S.C.; Schoof, J.T. Changes in the seasonality of precipitation over the contiguous USA. J. Geophys. Res. 2008, 113, D21108. [Google Scholar] [CrossRef]
- Imteaz, M.; Hossain, I. Climate change impacts on ‘seasonality index’ and its potential implications on rainwater savings. Water Resour. Manag. 2023, 37, 2593–2606. [Google Scholar] [CrossRef]
- Shiau, J.T.; Huang, W.H. Detecting distributional changes of annual rainfall indices in Taiwan using quantile regression. J. Hydro-Environ. Res. 2015, 9, 368–380. [Google Scholar] [CrossRef]
- Li, C.Y.; Lin, S.S.; Chuang, C.M.; Hu, Y.L. Assessing future rainfall uncertainties of climate change in Taiwan with a bootstrapped neural network-based downscaling model. Water Environ. J. 2020, 34, 77–92. [Google Scholar] [CrossRef]
- Huang, W.R.; Huang, P.H.; Chang, Y.H.; Cheng, C.T.; Hsu, H.H.; Tu, C.Y.; Kitoh, A. Dynamical Downscaling Simulation and Future Projection of Extreme Precipitation Activities in Taiwan during the Mei-Yu Seasons. J. Meteorol. Soc. Jpn. 2019, 97, 481–499. [Google Scholar] [CrossRef]
- Chang, J.; Tanaka, T.; Tachikawa, Y. Frequency Analysis of Past and Future Extreme Rainfall Events in Taiwan Using d4PDF. J. Jpn. Soc. Civ. Eng. Ser. B1 (Hydraul. Eng.) 2022, 78, I_457–I_462. [Google Scholar] [CrossRef] [PubMed]


| GCMs | Institution/Country | Resolution (Long.° × Lat.°) |
|---|---|---|
| ACCESS-CM2 | CSIRO/Australia | 1.875 × 1.25 |
| ACCESS-ESM1-5 | CSIRO/Australia | 1.875 × 1.241 |
| AWI-CM-1-1-MR | AWI/Germany | 0.938 × 0.938 |
| BCC-CSM2-MR | BCC/China | 1.125 × 1.125 |
| CanESM5 | CCCMA/Canada | 2.812 × 2.812 |
| CMCC-ESM2 | CMCC/Italy | 1.25 × 0.938 |
| EC-Earth3-CC | EC/Europe | 0.703 × 0.703 |
| EC-Earth3-Veg-LR | EC/Europe | 1.125 × 1.125 |
| EC-Earth3-Veg | EC/Europe | 0.703 × 0.703 |
| EC-Earth3 | EC/Europe | 0.703 × 0.703 |
| FGOALS-g3 | CAS/China | 2.0 × 2.5 |
| GFDL-CM4 | NOAA-GFDL/USA | 1.0 × 1.0 |
| GFDL-ESM4 | NOAA-GFDL/USA | 1.0 × 1.0 |
| INM-CM4-8 | INM/Russian Federation | 2.0 × 1.5 |
| INM-CM5-0 | INM/Russian Federation | 2.0 × 1.5 |
| IPSL-CM6A-LR | IPSL/France | 2.0 × 1.259 |
| KIOST-ESM | KIOST/Korea | 2.0 × 2.5 |
| MIROC6 | MIROC/Japan | 1.406 × 1.406 |
| MPI-ESM1-2-HR | MPI/Germany | 0.938 × 0.938 |
| MPI-ESM1-2-LR | MPI/Germany | 1.875 × 1.875 |
| MRI-ESM2-0 | MRI/Japan | 1.125 × 1.125 |
| NESM3 | NUIST/China | 1.875 × 1.875 |
| NorESM2-LM | NCC/Norway | 2.5 × 1.875 |
| NorESM2-MM | NCC/Norway | 1.25 × 0.938 |
| TaiESM1 | AS-RCEC/Taiwan | 1.25 × 0.938 |
| Category | I | II | III |
|---|---|---|---|
| Changes in RCM and RCSD | decreased RCM and decreased RCSD | no change RCM and decreased RCSD | increased RCM and decreased RCSD |
| Changes of shape | left-shifted and sharpened | sharpened | right-shifted and sharpened |
| Category | IV | V | VI |
| Changes in RCM and RCSD | decreased RCM and no change in RCSD | no change in RCM and no change in RCSD | increased RCM and no change in RCSD |
| Changes of shape | left-shifted | identical | right-shifted |
| Category | VII | VIII | IX |
| Changes in RCM and RCSD | decreased RCM and increased RCSD | no change RCM and increased RCSD | increased RCM and increased RCSD |
| Changes in shape | left-shifted and flattened | flattened | right-shifted and flattened |
| Rainfall Index | Scenarios | Distributional Change Categories | Increased RCM (III, VI, IX) | Increased RCSD (VII, VIII, IX) | ||||||||
|---|---|---|---|---|---|---|---|---|---|---|---|---|
| I | II | III | IV | V | VI | VII | VIII | IX | ||||
| WD50 | SSP2-4.5 NF | 0.32 | 0.00 | 0.08 | 0.04 | 0.00 | 0.04 | 0.24 | 0.08 | 0.20 | 0.32 | 0.52 |
| SSP2-4.5 MF | 0.40 | 0.00 | 0.08 | 0.00 | 0.00 | 0.00 | 0.36 | 0.00 | 0.16 | 0.24 | 0.52 | |
| SSP5-8.5 NF | 0.36 | 0.00 | 0.04 | 0.04 | 0.00 | 0.04 | 0.20 | 0.04 | 0.28 | 0.36 | 0.52 | |
| SSP5-8.5 MF | 0.28 | 0.04 | 0.08 | 0.04 | 0.00 | 0.00 | 0.32 | 0.04 | 0.20 | 0.28 | 0.56 | |
| Average | 0.34 | 0.01 | 0.07 | 0.03 | 0.00 | 0.02 | 0.28 | 0.04 | 0.21 | 0.30 | 0.53 | |
| SI | SSP2-4.5 NF | 0.04 | 0.04 | 0.32 | 0.00 | 0.00 | 0.12 | 0.16 | 0.12 | 0.20 | 0.64 | 0.48 |
| SSP2-4.5 MF | 0.08 | 0.00 | 0.40 | 0.00 | 0.00 | 0.04 | 0.04 | 0.08 | 0.36 | 0.80 | 0.48 | |
| SSP5-8.5 NF | 0.04 | 0.08 | 0.48 | 0.00 | 0.00 | 0.00 | 0.08 | 0.12 | 0.20 | 0.68 | 0.40 | |
| SSP5-8.5 MF | 0.04 | 0.08 | 0.28 | 0.00 | 0.00 | 0.00 | 0.08 | 0.04 | 0.48 | 0.76 | 0.60 | |
| Average | 0.05 | 0.05 | 0.37 | 0.00 | 0.00 | 0.04 | 0.09 | 0.09 | 0.31 | 0.68 | 0.49 | |
| DWR | SSP2-4.5 NF | 0.28 | 0.00 | 0.04 | 0.08 | 0.00 | 0.04 | 0.20 | 0.00 | 0.36 | 0.44 | 0.56 |
| SSP2-4.5 MF | 0.36 | 0.00 | 0.00 | 0.00 | 0.00 | 0.04 | 0.28 | 0.00 | 0.32 | 0.36 | 0.60 | |
| SSP5-8.5 NF | 0.32 | 0.04 | 0.08 | 0.04 | 0.00 | 0.04 | 0.08 | 0.00 | 0.40 | 0.52 | 0.48 | |
| SSP5-8.5 MF | 0.48 | 0.00 | 0.04 | 0.00 | 0.00 | 0.00 | 0.24 | 0.00 | 0.24 | 0.28 | 0.48 | |
| Average | 0.36 | 0.01 | 0.04 | 0.03 | 0.00 | 0.03 | 0.20 | 0.00 | 0.33 | 0.40 | 0.53 | |
| Scenarios | PRCPWS ↑ PRCPDS ↑ | PRCPWS ↑ PRCPDS ↓ | PRCPWS ↓ PRCPDS ↑ | PRCPWS ↓ PRCPDS ↓ |
|---|---|---|---|---|
| SSP2-4.5 NF | 0.24 | 0.28 | 0.20 | 0.28 |
| SSP2-4.5 MF | 0.44 | 0.20 | 0.16 | 0.20 |
| SSP5-8.5 NF | 0.20 | 0.20 | 0.12 | 0.48 |
| SSP5-8.5 MF | 0.36 | 0.32 | 0.04 | 0.28 |
| Average | 0.31 | 0.25 | 0.13 | 0.31 |
Disclaimer/Publisher’s Note: The statements, opinions and data contained in all publications are solely those of the individual author(s) and contributor(s) and not of MDPI and/or the editor(s). MDPI and/or the editor(s) disclaim responsibility for any injury to people or property resulting from any ideas, methods, instructions or products referred to in the content. |
© 2024 by the authors. Licensee MDPI, Basel, Switzerland. This article is an open access article distributed under the terms and conditions of the Creative Commons Attribution (CC BY) license (https://creativecommons.org/licenses/by/4.0/).
Share and Cite
Shiau, J.-T.; Li, C.-C.; Tseng, H.-W.; Chen, S.-T. Assessing Alterations of Rainfall Variability Under Climate Change in Zengwen Reservoir Watershed, Southern Taiwan. Water 2024, 16, 3165. https://doi.org/10.3390/w16223165
Shiau J-T, Li C-C, Tseng H-W, Chen S-T. Assessing Alterations of Rainfall Variability Under Climate Change in Zengwen Reservoir Watershed, Southern Taiwan. Water. 2024; 16(22):3165. https://doi.org/10.3390/w16223165
Chicago/Turabian StyleShiau, Jenq-Tzong, Cheng-Che Li, Hung-Wei Tseng, and Shien-Tsung Chen. 2024. "Assessing Alterations of Rainfall Variability Under Climate Change in Zengwen Reservoir Watershed, Southern Taiwan" Water 16, no. 22: 3165. https://doi.org/10.3390/w16223165
APA StyleShiau, J.-T., Li, C.-C., Tseng, H.-W., & Chen, S.-T. (2024). Assessing Alterations of Rainfall Variability Under Climate Change in Zengwen Reservoir Watershed, Southern Taiwan. Water, 16(22), 3165. https://doi.org/10.3390/w16223165