Abstract
Reliable paleoflood proxies can help reconstruct past flood variation patterns. Here, we investigated the grain-size data of a 63 cm core retrieved from Lake Chaonaqiu, western Chinese Loess Plateau, in order to build a long time-series of flood occurrence from sedimentology that extends the period of instrumental data. Our results indicate that three parameters (mean, standard deviation and grain-size ratio of 16–63/2–16 μm) are sensitive to hydrodynamic changes in Lake Chaonaqiu, which are further linked to high-energy inflow associated with high-intensity rainfall or flood events. These three parameters’ variations were well correlated with the precipitation records reconstructed from tree-rings and historical documents in neighboring regions and overlapped with 109 historical flood events from historical documents in counties around the lake for the past 300 years. Therefore, we propose that the grain size in the sediments of Lake Chaonaqiu is a reliable paleoflood proxy. The sensitivity of flood signals to grain size may be related to the precipitation and vegetation cover in the catchment of the lake, which are further linked to the strength of the East Asian summer monsoon.
1. Introduction
Global warming has had and will continue to have a significant impact on the structure and function of terrestrial ecosystems [1,2]. Against the background of global warming, the impact of the frequent occurrence of extreme heavy-rainfall events caused by changes in the global precipitation pattern on the frequency and intensity of flood events in future has become a scientific problem that the international community is closely concerned about and urgently needs to solve [2]. Geochemical proxies, such as XRF core scanning [3,4,5,6,7], have been used for paleoflood reconstructions. For instance, Wirth et al. [4] combined XRF core scanning and μ-XRF mapping, as well as continuous high-resolution core pictures (60 pixels per millimeter), to identify annual laminations and flood layers and found that the flood layers are brown-colored intervals, coarse-grained at the bottom and rich in calcium, and fine-grained at the top and rich in Fe, Si, Al, K and Ti. However, the deposition pattern and weathering rates in the catchment might be a potential source of uncertainty in the flood event layer time-series [8]. Therefore, in order to accurately identify flood event layers in sediments, it is usually necessary to conduct tests or verification in combination with physical proxies, such as magnetic susceptibility (MS), dry density and grain size [9,10,11].
Grain size is an important physical index in sedimentology research. It has become one of the most important proxy indicators for reconstructing the paleoenvironment because the testing results are not influenced by biochemical effects, and thus it has been widely applied in geological carriers such as loess [12,13,14,15,16], oceans [17,18,19] and lakes [20,21,22,23,24,25,26,27,28,29,30,31,32,33,34]. For lake sediments, grain size generally indicates environmental information such as regional precipitation [20,21,22,23,24,25,26,27,28] and lake level [29,30,31,32,33,34]. It is generally believed that in short-scale and high-resolution (inter-annual and decadal scales) sequences, coarser grain size indicates more precipitation and a humid climate, while finer grain size indicates less precipitation and an arid climate [20,21,22]. In addition, Li et al. [35] found that grain size in the sediments of Lake Taihu was able to record flood events, and 15 extreme flood events were identified by the coarse silt–sand size in the past 400 years (1600–2004 AD; [35]). Therefore, the grain size of lake sediments has the ability and potential to record regional rainstorms or extreme heavy rainfall events on decadal/multi-decadal scales.
The Chinese Loess Plateau (CLP) is located in the northwest marginal area of the East Asian monsoon [36]. The annual rainfall in this region is relatively low and uneven, often occurring in the form of rainstorms or heavy rainfall [37]. These rainstorm or heavy-rainfall events are often recorded in the sediments of check dams [38,39,40,41,42]. Lake Chaonaqiu is a small alpine lake in the Liupan Mountains on the western Chinese Loess Plateau (WCLP) (Figure 1a), with a continuous and high sedimentary rate [43,44,45]. Our previous work showed that the strong erosion intervals recorded by the grain size of the sediments (core CNQ12-1) in Lake Chaonaqiu were caused by regional flood events. Therefore, it is preliminarily considered that grain size may be a potential index of regional paleofloods [43]. In this paper, we conduct a more comprehensive analysis of grain-size data of a parallel core and try to provide a novel understanding of grain-size parameters as an indicator of paleofloods by combining the basic grain-size parameters (e.g., mean and standard deviation) with grain-size ratio (16–63/2–16 μm). We then compared the grain-size results with regional well-established precipitation to infer the changes in paleofloods linked to East Asian summer monsoon variability over the past 300 years.
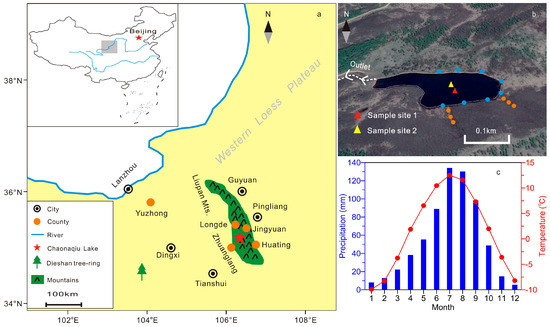
Figure 1.
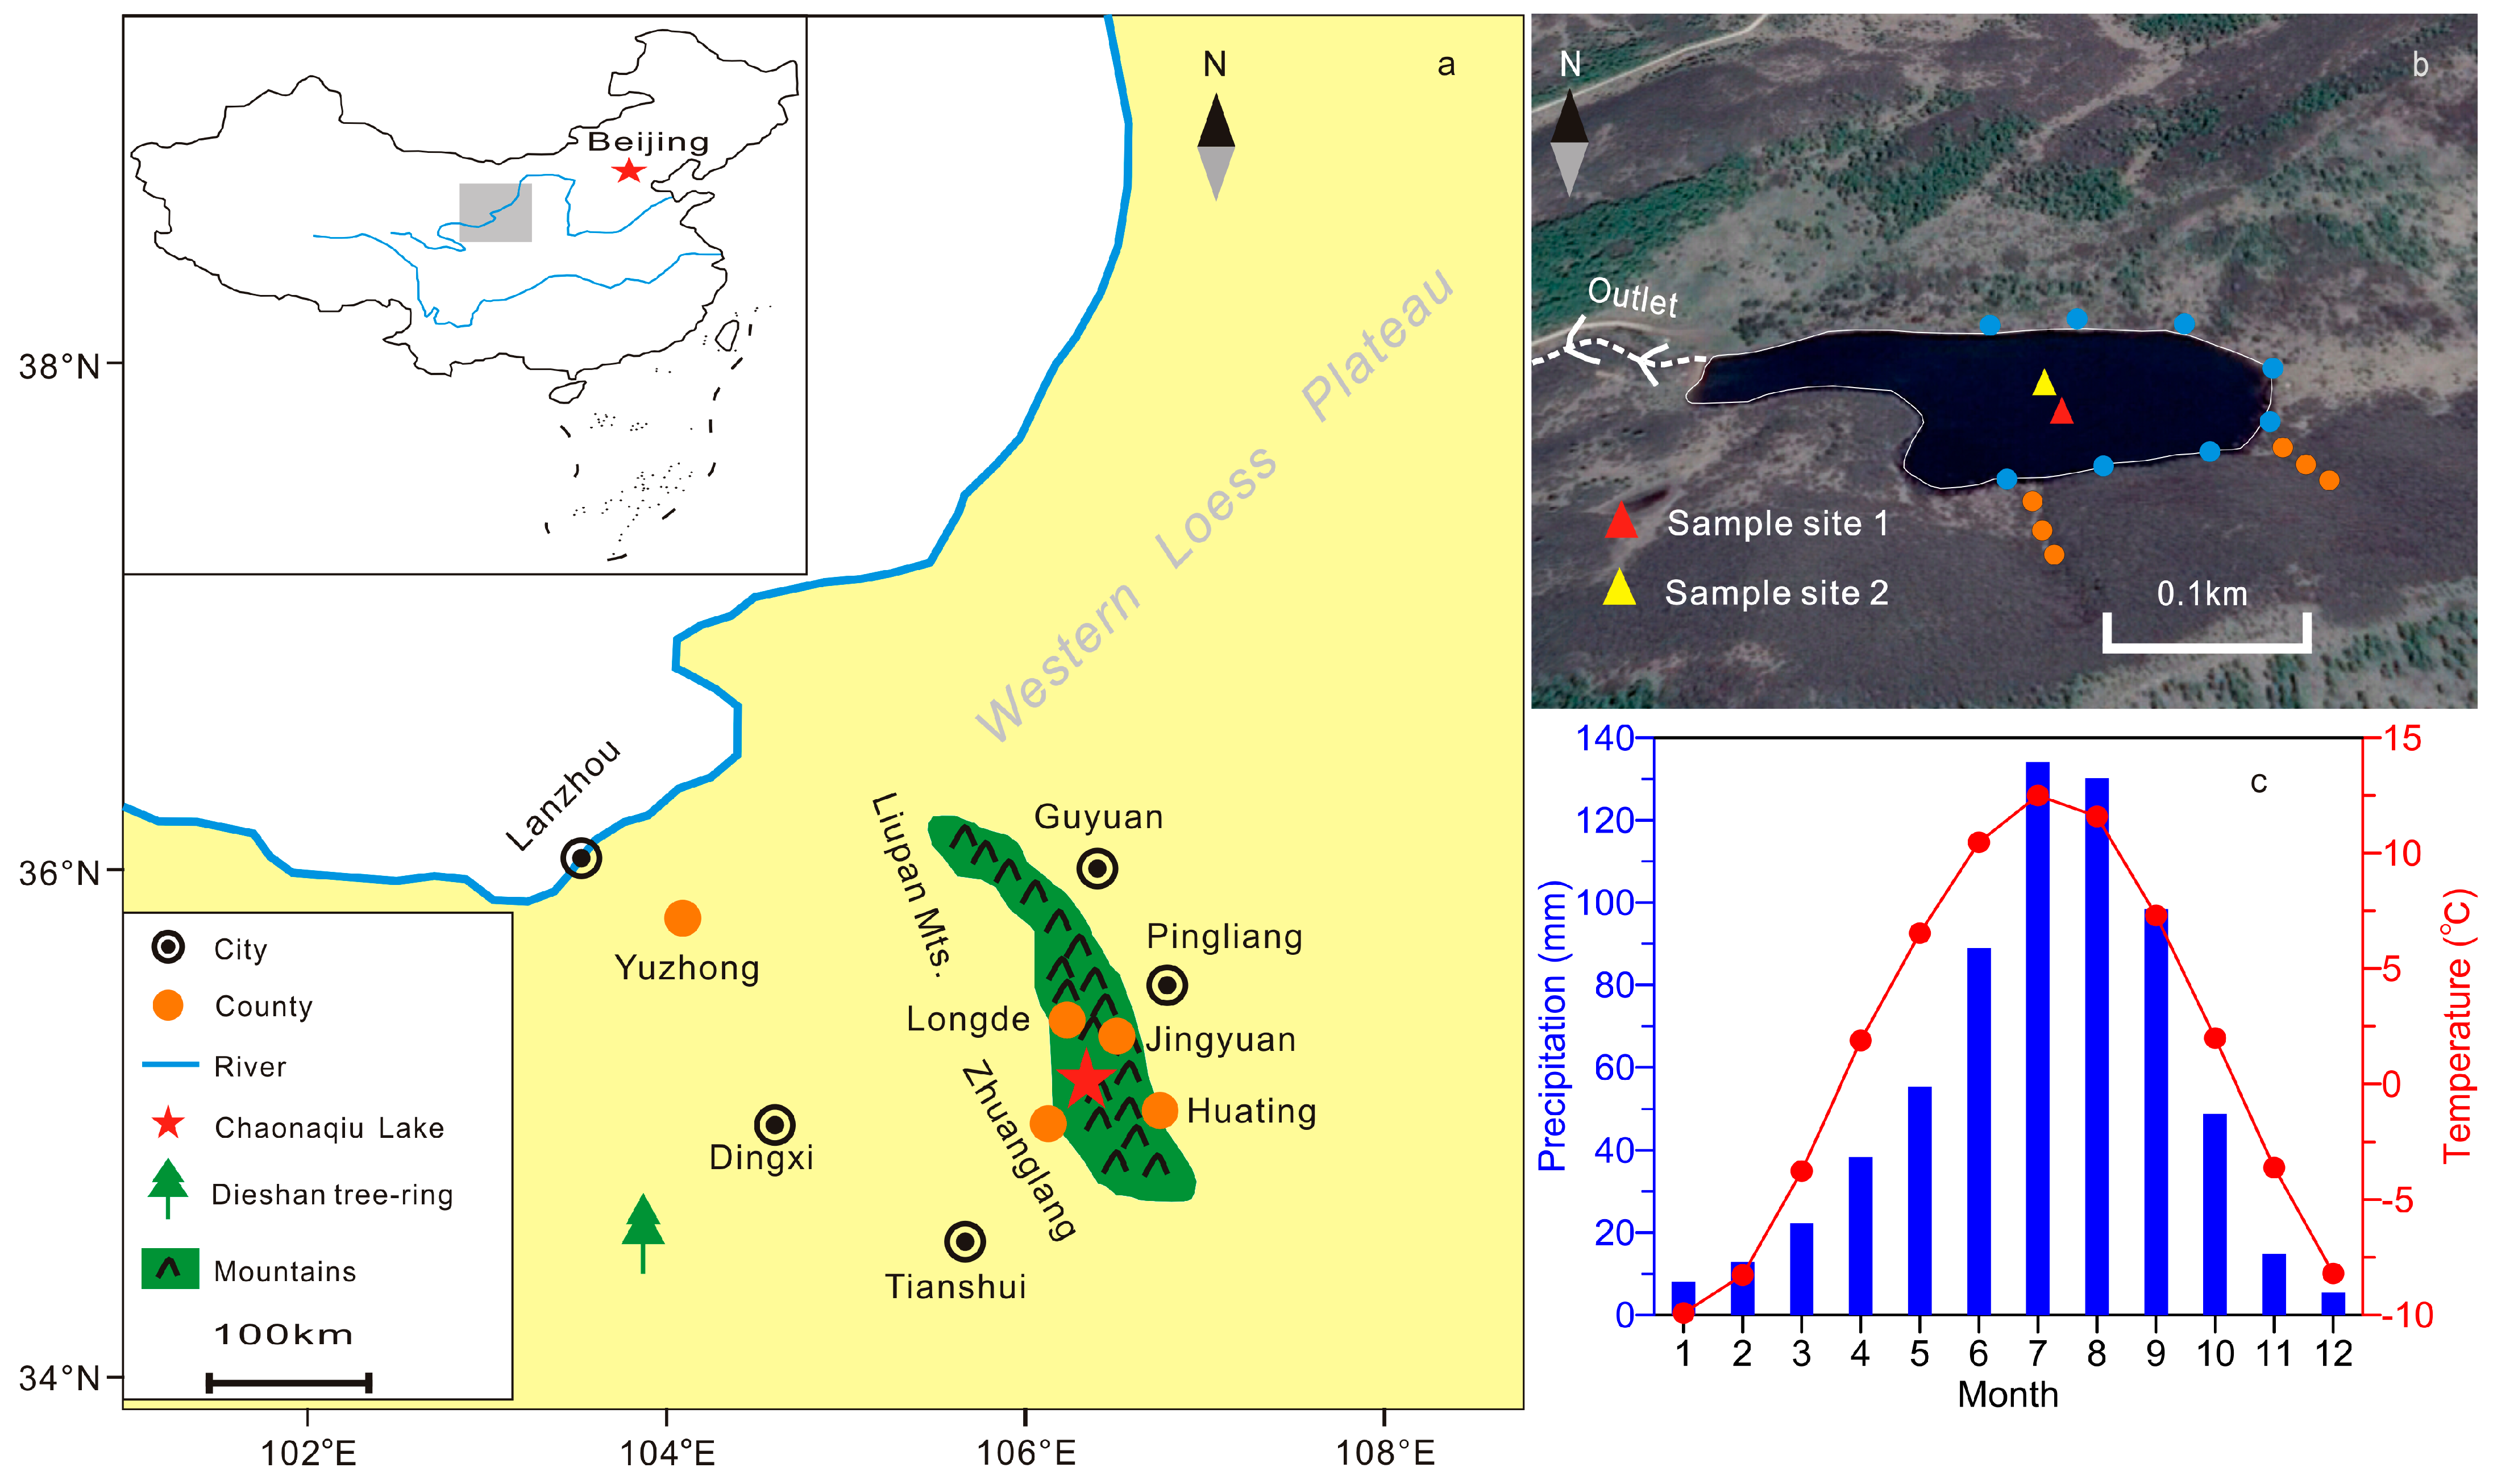
Location and setting. (a) Location of our study site, Chaonaqiu Lake, in the western Chinese Loess Plateau, and other previous studies mentioned in the text include the Dieshan tree-rings and the Yuzhong drought/flood (D/F) index. (b) Satellite image of Chaonaqiu Lake (maps modified from Google Earth) and the location of sampling site; blue and orange dots are surface soils around the lakeshore and hillside, respectively. (c) Mean monthly temperature (red solid line) and precipitation (blue bars) from Liupan Mountains meteorological station based on 1971–2023 data from China Meteorological Administration.
2. Setting of Lake Chaonaqiu
Lake Chaonaqiu (latitude 35°16′ N, longitude 106°19′ E, altitude 2430 m a.s.l.) is located in the Liupan Mountains, ~30 km to the northeast of Zhuanglang County (Figure 1a). It has a surface area of 0.02 km2 with a maximum water depth of 10 m. Chaonaqiu Lake is an alpine barrier freshwater lake with a seasonal outflow on its western margin (Figure 1b), and the lake water is supplied mainly by precipitation. The bedrock of the catchment basin of the lake is red sandstone. Meteorological records for 1971~2023 from the nearby Liupan Mountains meteorological station indicate a mean annual temperature (MAT) of 1.5 °C, with mean temperatures for January and July of −9.9 °C and 12.5 °C, respectively (Figure 1c). The mean annual precipitation is 658 mm, with ~70% falling in summer (June–September; Figure 1c). At present, the vegetation surrounding Chaona Lake is dominated by mixed coniferous and broadleaved forests, mainly consisting of Pinus armandii, Pinus tabuliformis, Betula platyphylla and Fargesia spathacea. The characteristic species in the shrub layer are Hippophae rhamnoides, Ostryopsis davidiana, Rosa omeiensis and S. cathayana. The characteristic species in the herb layer mainly consist of Artemisia, Poaceae and Chenopodiaceae [46].
3. Materials and Methods
In September 2012, four parallel sediment cores (CNQ12-1, CNQ12-2, CNQ12-3 and CNQ12-4; the former two are from Site 1, while the latter two are from Site 2; Figure 1b) were collected from the deposition center of the lake (35°15′53.08″ N, 106°18′35.99″ E) using a gravity corer (UWITEC, Mondsee, Austria). Sediment profiles were undisturbed, with a clear interface between sediment and water. Core CNQ12-1 (~73 cm) was sub-sampled in situ at 1 cm intervals, and another three cores were transported to the laboratory and stored in a freezer at below −4 °C, and then core CNQ12-4 (~138 cm) was cut into slices at 1 cm intervals. Meanwhile, 14 surface soils within the catchment of the lake (with 8 and 6 on the lakeshore and the hillside, respectively; Figure 1b) were collected in April 2023.
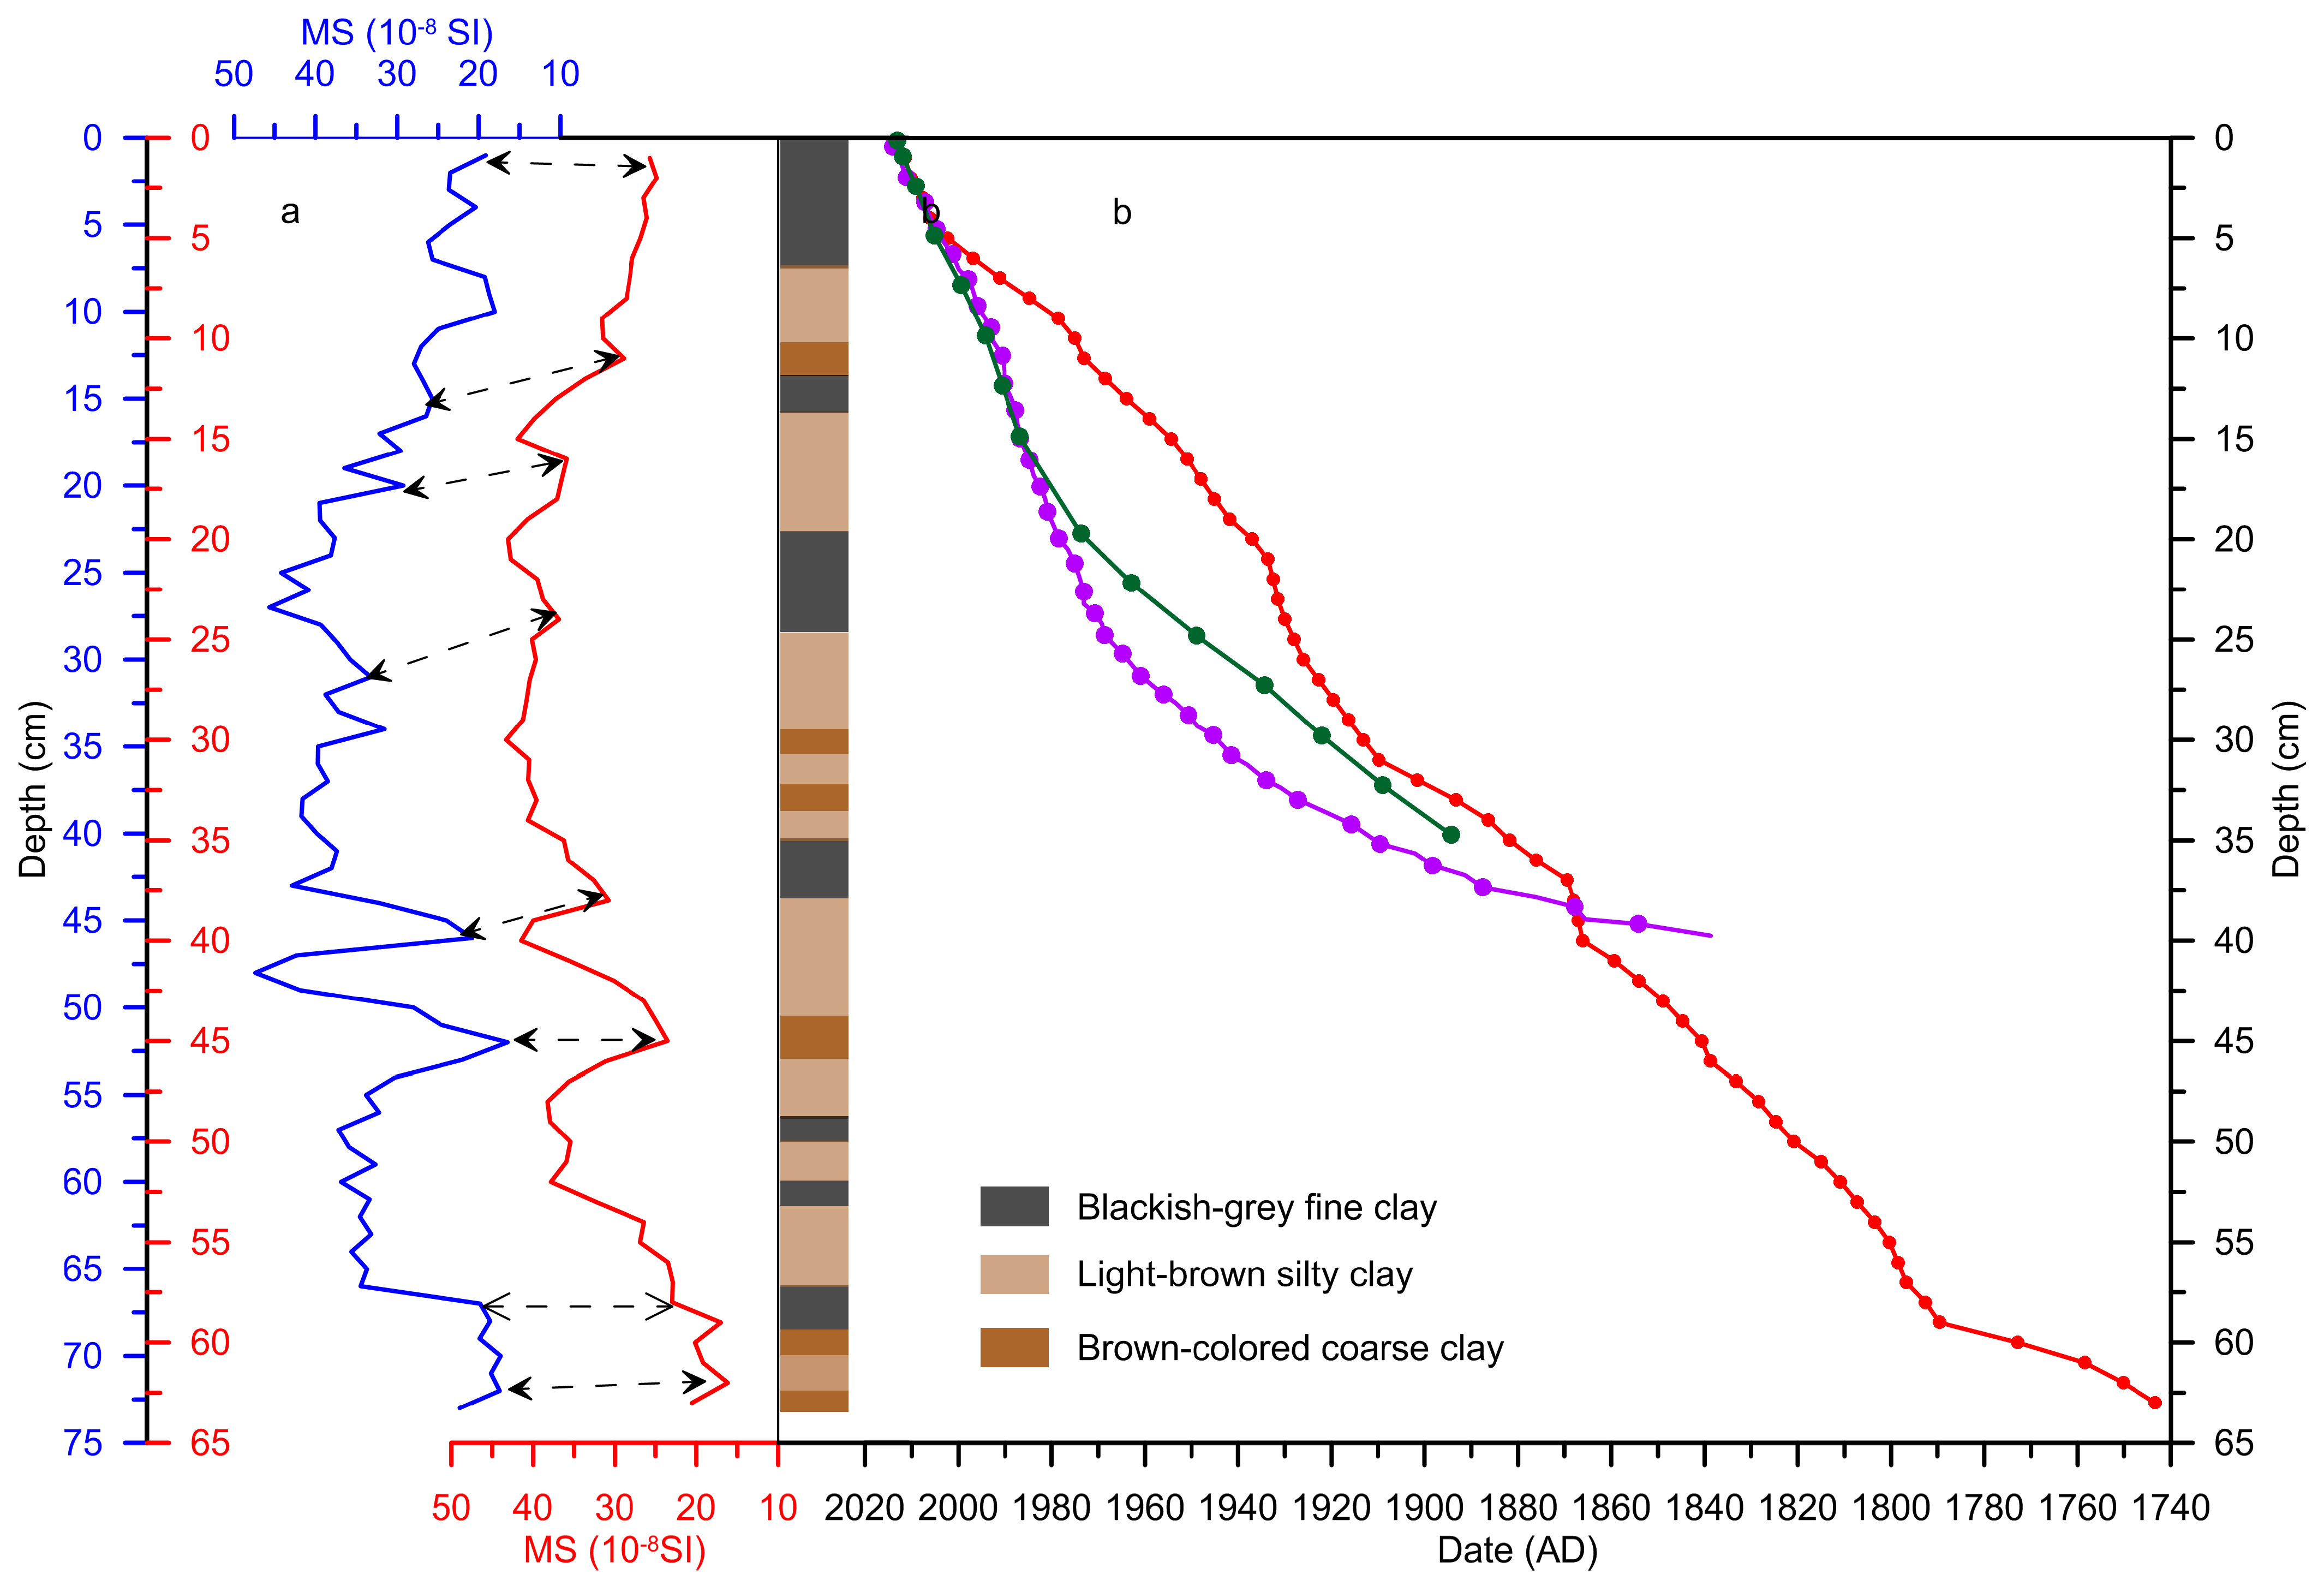
According to previous description of lithology and comparisons of grain-size data (median and distribution patterns [43]) and MS (Figure 2a; [47]) between the two cores (CNQ12-1 and CNQ12-4), the upper 63 cm of core CNQ12-4 is consistent with the records of core CNQ12-1, and its lithology is composed of brown coarse clay, light-brown silty clay and blackish-gray fine clay, and it can be further divided into two sub-units: unit 1 (0–24 cm), which consists mainly of alternating layers of brown-colored coarse clay and light-brown silty clay, and unit 2 (25–63 cm), which consists of light-brown silty clay interlayered with brown-colored coarse clay and blackish-gray fine clay (Figure 2b).
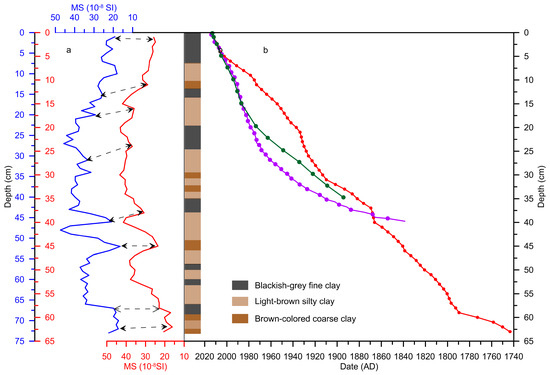
Figure 2.
Age–depth model for core CNQ12-4. (a) Comparisons of the MS [47] of the two cores; the blue curve and red curve indicate core CNQ12-1 and CNQ12-4, respectively. (b) Comparison of age–depth model for core CNQ12-4 (red curve, this study), GS14A (green curve, [44]), and that reported by Guo et al. [45] (purple curve) from Lake Chaonaqiu.
The chronology of core CNQ12-1 was determined using 137Cs dating [43]. An accurate mass depth could not be established for core CNQ12-4 due to the loss of samples during the process of sub-sampling in the laboratory exceeding the error range. Therefore, the chronology of core CNQ12-4 (upper 63 cm) was calibrated based on the comparison of MS at the corresponding depths in core CNQ12-1 (Figure 2b). For grain-size analysis, 62 samples of core CNQ12-4 and 14 surface soils were pretreated by adding H2O2 and HCl to remove organic matter and carbonate, respectively. The samples were then dispersed with 10% (NaPO3)6 on an ultrasonic treatment [25,48]. The grain-size distribution was measured by a Mastersizer 2000 laser diffraction instrument (Malvern, UK) with 100 bins ranging from 0.02 to 2000 μm, with an analytical error of less than 2%. A total of 30 samples (0.8 g dry sub-samples for each one) were obtained from the core CNQ12-4 for pollen analysis at mostly 2 cm intervals using the heavy liquid method [49,50,51]. All the above analyses were carried out in the Institute of Earth Environment, Chinese Academy of Sciences, except for the pollen data, which were performed at the Institute of Vertebrate Paleontology and Paleoanthropology, Chinese Academy of Sciences.
4. Results
4.1. Age Model
The chronological data indicate that the age of core CNQ12-4 (upper 63 cm) spans the past 268 yr (i.e., 1743–2012 AD; Figure 2b), and the average accumulation rate based on the age–depth model is ~2.35 mm a–1. The 137Cs–210Pb ages of core GS14A [44] and those reported by Guo et al. [45] for Lake Chaonaqiu are also plotted in Figure 2b and correlate well with those from our dating model (Figure 2b). In addition, 14C ages of 500 cal. yr. before present (BP) and 620 cal. yr. BP occur at 100 cm [45] and 162 cm [52,53] depths in Lake Chaonaqiu, respectively, which is consistent with our age model. The close correspondence of these various age constraints demonstrates that our chronology is robust.
4.2. Grain Size
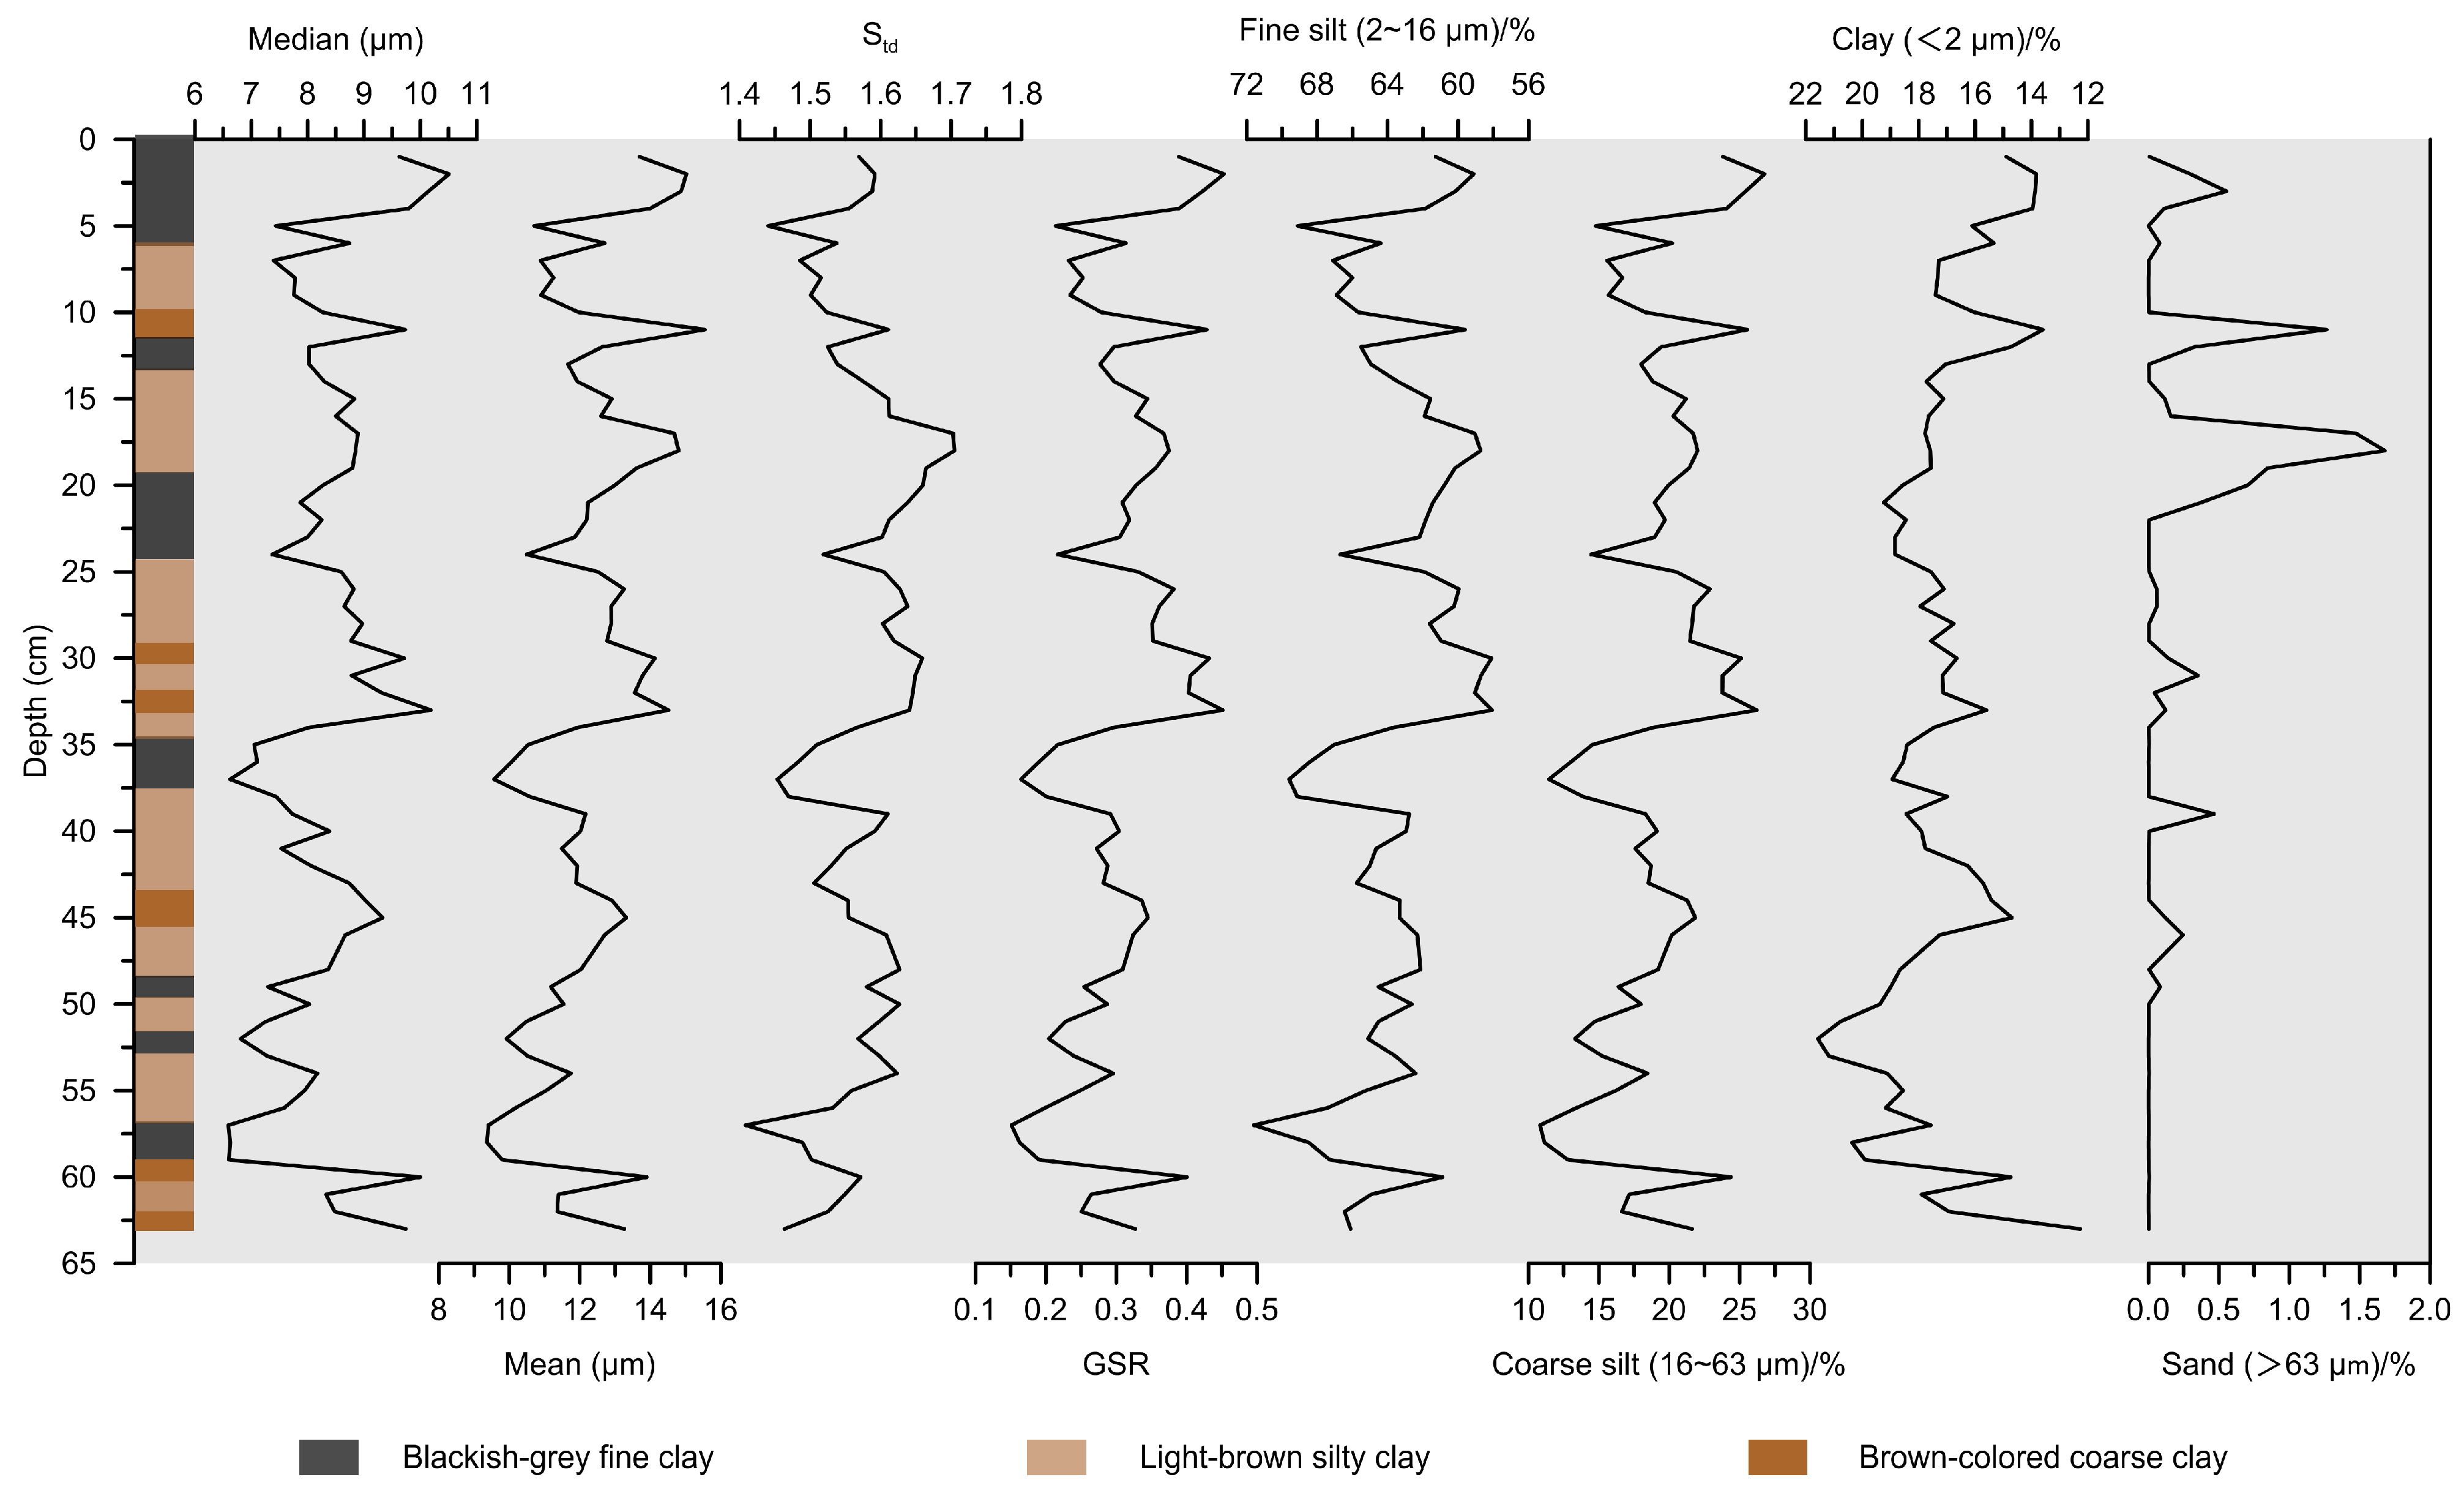
Different grain-size parameters including median, mean, Std, GSR (16~63/2~16 μm) and contents of four size fractions (<2 μm, 2~16 μm, 16~63 μm and >63 μm) are displayed in Figure 3. Grain-size distributions in core CNQ12-4 are dominated by the fine-silt fraction (2~16 μm), with contributions of 58.07~71.60% and an average of 63.54%; the second most dominant fraction is coarse silt (16~63 μm), with contributions of 10.82~26.77% and an average of 18.96%, followed by the clay fraction (<2 μm), with contributions of 12.26~21.58% and an average of 17.34%. Down-core variations in four grain-size proxies (mean, median, Std, GSR and coarse-silt fraction) exhibit synchronous trends, in contrast to the trends of the clay fraction and fine-silt fraction (Figure 3). The sand fraction (>63 μm) is characterized by very low percentages (less than 1.67% and an average of 0.16%) in all samples and stressed by several intervals (e.g., 16~18 cm) of relatively high percentages. Grain-size parameters such as mean, median, standard deviation (Std) and grain-size ratios (GSRs) have been investigated to indicate different transport dynamics [31,32,54,55]. The mean and median are related in general to the average intensity of transport dynamics, and Std is often used to reflect the degree of dispersion of grain-size distribution of sediments [54]. GSR is usually applied to indicate the proportion of medium- and coarse-grained versus fine-sized silt [25,55]. The changes in the mean, Std and GSR are different from those in the percentages of clay and fine-silt fractions from 16 to 18 cm, because the two former bulk parameters are controlled by variations in the percentage of sand fraction (>63 μm). Std is employed here to extract sensitive grain-size components from the sediments [25] due to the minor difference in grain-size distribution of core CNQ12-4. A low Std means that the data points tend to be closer to the mean of the set, implying a better sorting of sediments. Conversely, a high Std means that the data points are dispersed over a wider range of values, suggesting a worse sorting of sediments [54]. The Std of core CNQ12-4 ranges from 2.65 to 3.26, indicating that the sorting of sediments is very poor and thus indicating a high-energy hydrodynamic sedimentary condition [54].
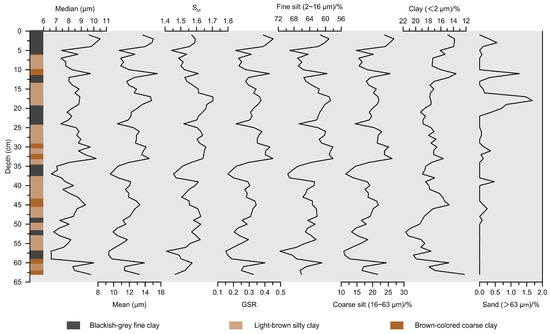
Figure 3.
Grain-size data for the upper 63 cm of core CNQ12-4. Median grain-size variation was modified from Yu et al. [43].
5. Discussion
5.1. Sensitivity of Grain-Size Distribution to Flood Input
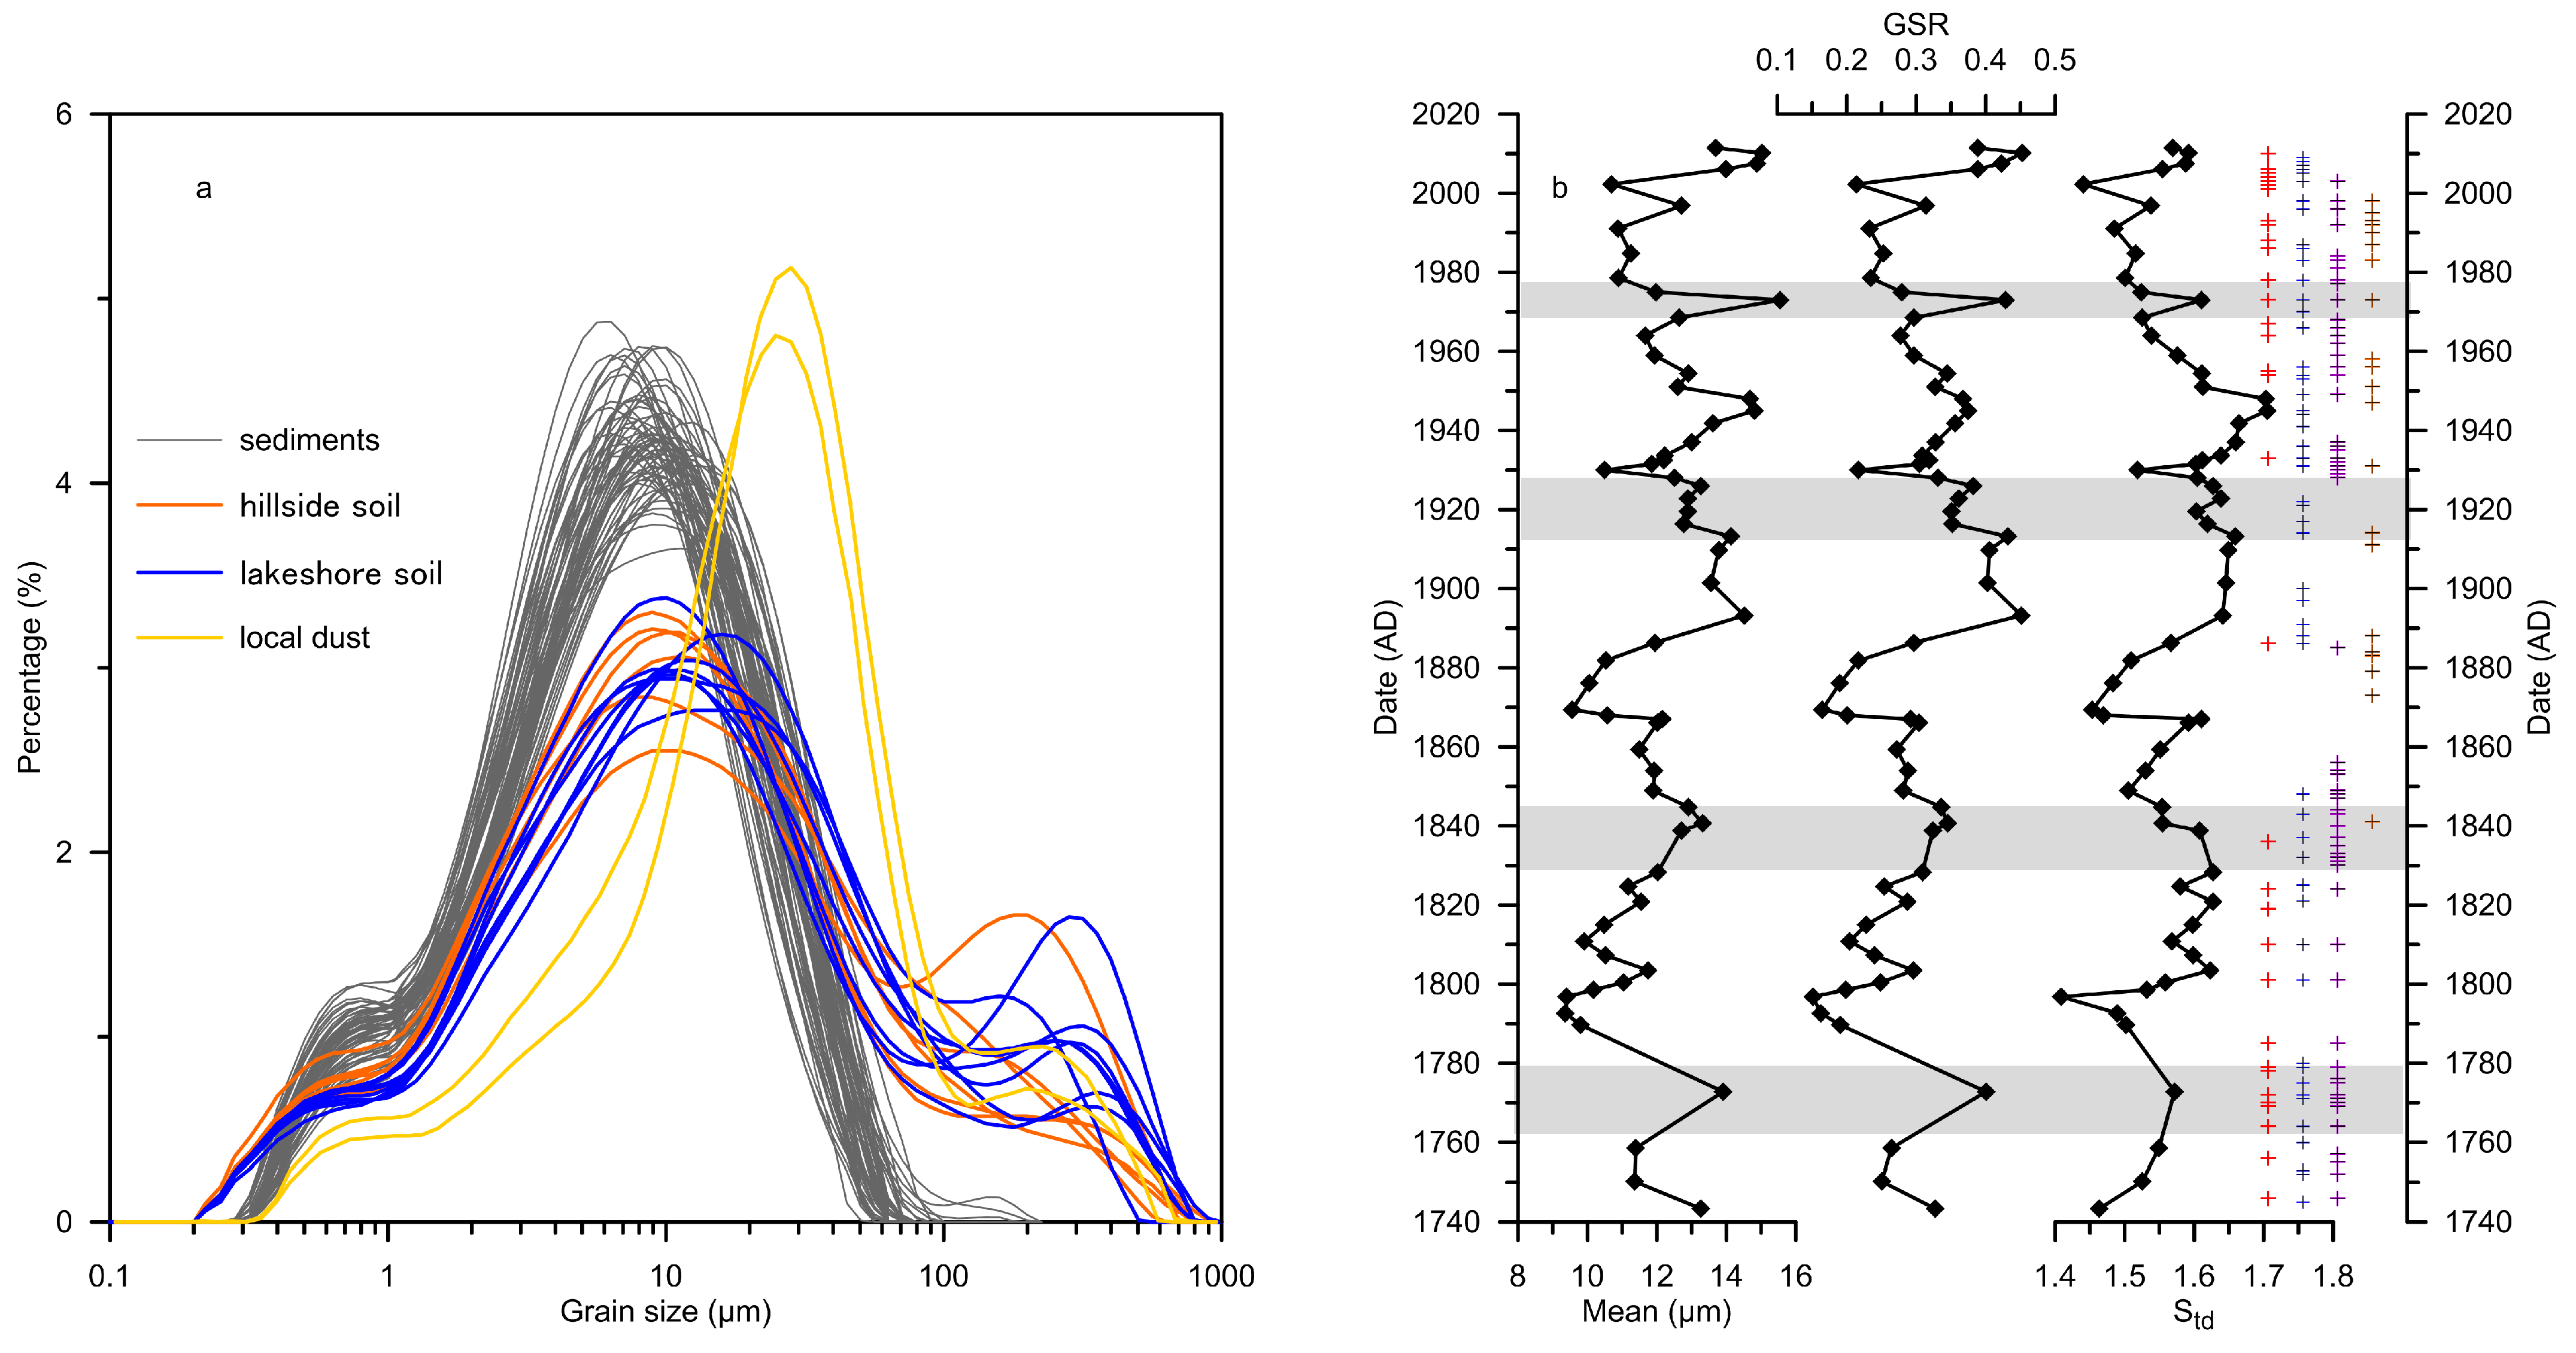
The grain size of lake sediments usually demonstrates the sources of clastic materials and the hydrodynamic conditions during the deposition, which are not only affected by factors such as the area and shape of the lake but are also controlled by climate (precipitation) and vegetation cover of the catchment [54]. As shown in Figure 4a, the grain-size distribution patterns of core CNQ12-4 are similar to those from the surface soil of the catchment but different from modern dust samples [53] collected around the Liupan Mountains. Our XRD analyses reveal that the mineralogic compositions of sediment in Lake Chaonaqiu are very consistent with surface soils in the catchment [56]. This suggests that the sediments in Lake Chaonaqiu are sourced mainly from terrestrial clastic material transported by surface runoff. The <2 μm fraction exists in all samples, and surface soil may belong to a long-term suspension component in a fluid medium, and thus is considered as a background component and excluded from further interpretation.
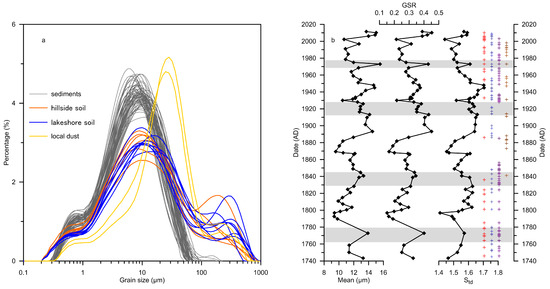
Figure 4.
(a) Individual grain-size distribution of each sample from core CNQ12-4, surface soils in the lakeshore and hillside and local dust collected around the Liupan Mountains [53]. (b) Overlapping of the grain-size data with historical floods in counties around Lake Chaonaqiu; the cross symbols indicate the timing of 109 flood events recorded in the historical literature [57,58,59,60,61,62,63,64,65,66,67,68] from counties around the lake (red, blue, purple and orange indicate Zhuanglang, Huating, Longde and Jingyuan counties, respectively). The gray shading indicates higher-value intervals.
Generally, the increase in coarse particle fractions of lake sediments might be associated with an enhanced inflow into the lake [20,21,22] or a drop in the lake level [29,31,32,33,34]. Chaonaqiu is a small alpine lake, and the lake water is primarily fed by precipitation; the lake water overflows in the rainy season due to a seasonal outlet on the west of lake shore (Figure 1b). Therefore, there is almost no chance of significant fluctuations in the lake level, and thus the impact of the lake level on the variations in grain-size distribution is quite limited. There are several small gullies on the hillside around Lake Chaonaqiu (Figure 1b), which can lead to inflow into the lake, this implies that the hydraulic dynamics of the inflow from gullies on the hillside may be a dominant factor controlling grain-size variations. The Liupan Mountain area belongs to a warm temperate semi-humid climate and can thus be characterized as a wet island in the WCLP as the mean annual precipitation exceeds 600 mm [46]. However, the precipitation distribution in this area is uneven (approximately 73.3% occurs during summer, often in the form of heavy rainstorms; [46]) since the climate zonation of the CLP remains unchanged [37]. When a high-energy inflow associated with high-intensity rainfall or flood events occurs, it significantly erodes the surface soil in the catchment, which not only brings more coarse-grained materials but also other terrestrial clastic materials of different particle sizes into the lake together, which are finally deposited into flood layers in the lake sediments, resulting in a higher value of mean grain size, Std and GSR. Thus, we prefer to consider the grain size of Lake Chaonaqiu as an indicator of the transport dynamics associated with the high-intensity rainfall or flood events, with high mean grain size, Std and GSR corresponding to strong water dynamics.
5.2. Overlapping with Historic Floods
There exist numerous historical documents in China. These documents have compiled major meteorological disaster events throughout the history of China and provide some independent evidence of flood event records. We consulted historical documents such as Disasters History of the Northwest [58], Encyclopedia of Meteorological Disasters in China [58,59], Veritable Records of the Qing Dynasty [60], the county chronicles of Zhuanglang, Huating, Longde and Jingyuan [61,62,63,64,65,66,67,68], and collected 109 historical flood events (Table 1) that overlap with our grain-size record (Figure 4b). As shown in Figure 4b, the high- and low-value segments of grain-size parameters basically overlap with historical flood events in corresponding years on decadal/multi-decadal scales, and only two flood year intervals (1786~1800 AD and 1857~1872 AD) were missed. For the flood events of these two intervals that were identified by sedimentary signals rather than the historical records, it is important to have other evidence to evaluate whether the flood proxies in the Lake Chaonaqiu history are more reliable. Firstly, historical documents generally record the abnormal natural phenomena that can cause losses to people’s lives and property. Secondly, the precipitation or the intensity of rainfall in mountains is generally greater than that in residential areas such as towns with open and flat terrain due to high vegetation coverage and thus high humidity. For example, the mean annual precipitation at Liupan Mountain meteorological station is as high as 658 mm (Figure 1c), while that at Zhuanglang meteorological station is only 513 mm [56]. That is to say, general rainfall processes with less or low intensity of precipitation that occur in four counties such as Zhuanglang, Huating, Longde and Jingyuan are likely to be a heavy rainfall or rainstorm event in the catchment of Lake Chaonaqiu. These events would be recorded in sediments rather than in historical documents. Meanwhile, this also means that any flood event recorded in historical documents would surely be captured by the sediments of Lake Chaonaqiu.

Table 1.
Flood events recorded in the historical documents [57,58,59,60,61,62,63,64,65,66,67,68] of counties around Lake Chaonaqiu from 1743 AD to 2012 AD, including Zhuanglang (ZL), Huating (HT), Longde (LD) and Jingyuan (JY).
5.3. Flood Signal Variability Linked to the East Asian Summer Monsoon
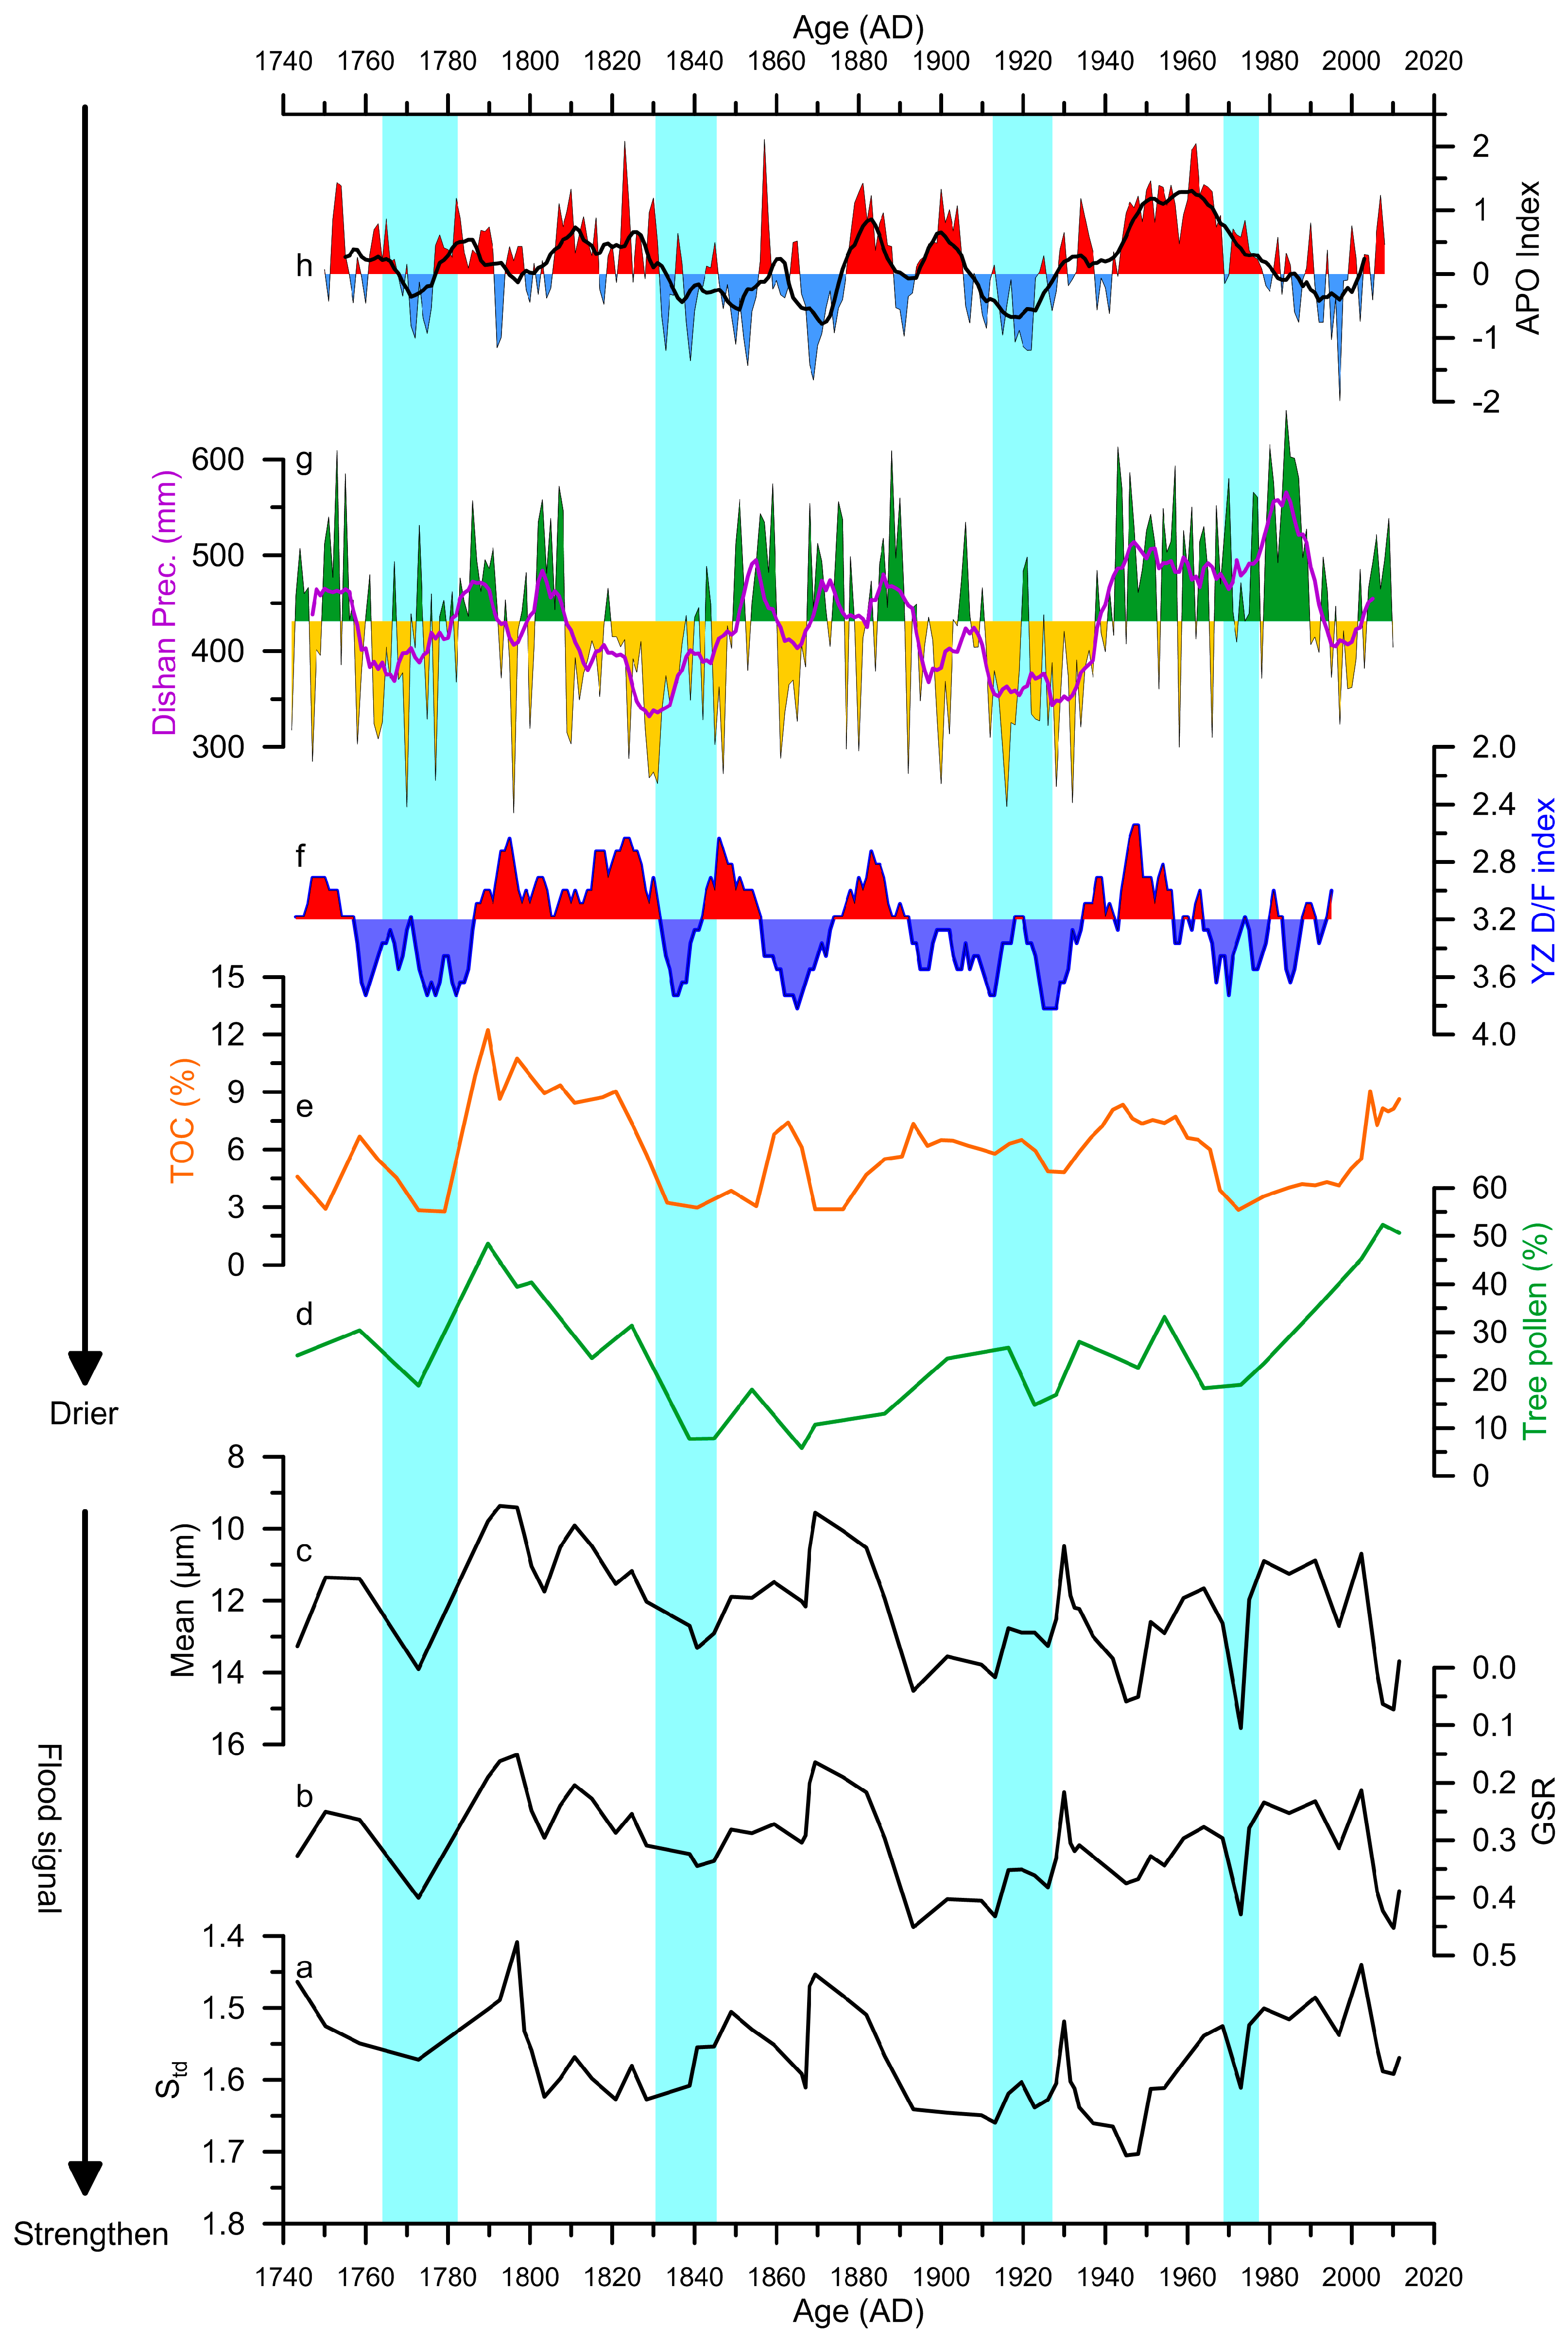
We compared our sedimentary flood index, precipitation proxy with tree pollen percentages, precipitation records reconstructed from Dieshan tree-rings [69] and Yuzhong D/F indexes [70,71,72] in neighboring regions (Figure 5), which showed that a higher sedimentary flood index (e.g., mean, Std and GSR) corresponds to lower TOC values, a decreased tree pollen percentage and a drier climate condition, and vice versa (Figure 5). For example, higher mean, Std and GSR, lower TOC and decreased tree pollen percentage indicate that stronger flood signals correspond to arid climate intervals, such as 1770–1780, 1830–1844, 1920–1930 and ~1970 AD, whereas lower mean, Std and GSR, higher TOC and increased tree pollen percentage indicate that weaker flood signals correspond to humid climate intervals, such as 1780–1830 and 1845–1880 AD. During wetter climate periods, higher vegetation coverage reduces the flood inflow dynamics, resulting in fewer coarser particles entering the lake and thus weakening the flood signals, and vice versa. Meanwhile, we note that higher mean, Std and GSR correspond to higher TOC, tree pollen and a humid condition at the interval of 1940–1950 AD; this may be because extreme flood events can also occur in the humid climate condition, resulting in more coarse particles in the lake sediments. These synchronous variations indicate that the strength of flood signals may have strong associations with large-scale atmospheric circulation patterns.
Previous studies have proved that precipitation variations in the Liupan Mountains are controlled by the East Asian summer monsoon (EASM) [45,52,73]. Zhou et al. [74] proposed the Asian–Pacific Oscillation (APO) index (IAPO) to indicate the variability of EASM rainfall based on the reconstruction of air temperature in Beijing [75] and the PDO index [76]. The weaker flood signal intervals in Lake Chaonaqiu correspond to higher APO index phases on (multi-)decadal timescales, and vice versa (Figure 5). This suggests that the APO may have affected precipitation and flood signals by driving EASM variations. According to Zhao et al. [77], when the APO index is in the positive (negative) phase, the lower-troposphere low-pressure system over eastern Asia strengthens (weakens), and the western Pacific subtropical high (WPSH) strengthens (weakens) with its location shifting northwards (southwards). Accordingly, the strengthening (weakening) of the EASM, with its rain belt shifting northwards (southwards) [74], results in more (less) rainfall in the Liupan Mountains. During wetter intervals, more precipitation increases the vegetation cover in the watershed, which stabilizes soil and reduces the sediment-carrying capacity of high-energy inflow, leading to less coarse terrigenous detritus entering the lake and thus weaker flood signals. During drier periods, less precipitation results in reduced vegetation cover in the watershed, and the sparse vegetation cover results in more surface soil in the watershed being exposed, and high-energy inflow would carry a large amount of coarse particles from surface soils into the lake, resulting in a stronger flood signal.
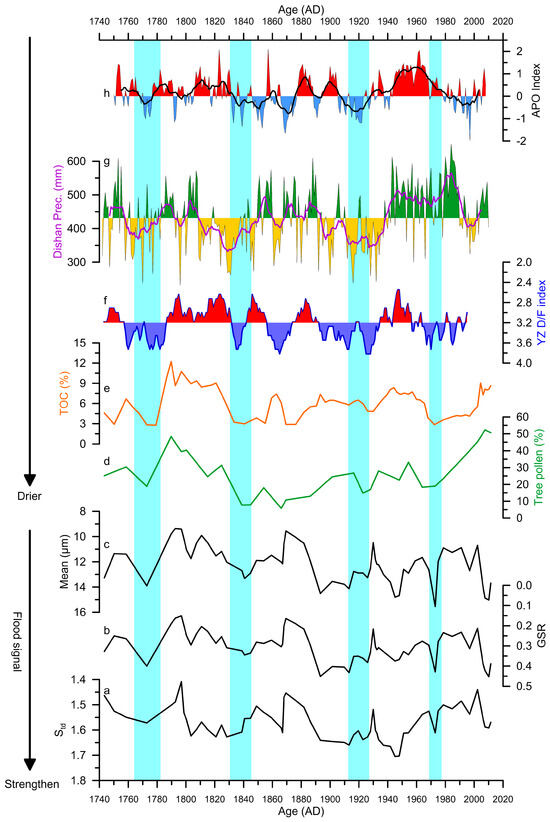
Figure 5.
Links between regional flood signals, precipitation records and atmospheric circulation during the past 300 yr. (a–d) Std, GSR, mean and tree pollen percentages from this study, respectively. (e) TOC contents (a precipitation indicator) in Lake Chaonaqiu [43]. (f,g) Precipitation variation reconstructed from the Dieshan Mountains tree-ring record [69] and Yuzhong Drought/flood (D/F) index [70,71,72], respectively. (g) Asian–Pacific Oscillation index [74]. The smoothed curves in (f–h) are 11 yr running means. The ice-blue shadings indicate dry intervals.
6. Conclusions
It is well known that precipitation affects the grain-size characteristics of lake sediments, manifested by a coarser particle size, with an increase in the hydrodynamics of surface runoff due to an increase in precipitation. Our investigation of the grain size of alpine lake sediments on the Chinese Loess Plateau shows that regional precipitation characteristics have a significant impact on the grain-size distribution of sediments, which suggests that precipitation characteristics are an important factor controlling the grain-size distribution characteristics.
Three grain-size parameters (mean, standard deviation and grain-size ratio of 16–63/2–16 μm) are sensitive to hydrodynamic changes in Lake Chaonaqiu, which are further linked to high-energy inflow associated with high-intensity rainfall or flood events. Overlapping of our grain-size data with all historical flood events in four counties around the lake that are recorded in historical documents indicated that the grain size corresponds to paleofloods. Therefore, we propose that grain size in small alpine lakes on the Chinese Loess Plateau, where rainfall is often in the form of heavy rainstorms in the rainy season, can be used as an independent indicator for reconstructing paleofloods. Comparison of these three grain-size proxies (sedimentary flood signals) with regional precipitation records reconstructed by tree-rings and historic documents, as well as possible driving factors, suggests that the strength of flood signals on decadal/multi-decadal scales was likely related to Asian–Pacific Oscillation (APO), which affects regional precipitation and vegetation cover by modulating the EASM, highlighting the potential role of internal variability of the Earth’s climate system in modulating the flood signal variability on decadal/multi-decadal scales.
Author Contributions
Conceptualization, K.Y.; methodology, C.Z., K.Y., A.L., T.L. and S.X.; writing—original draft preparation, C.Z.; writing—review and editing, K.Y. All authors have read and agreed to the published version of the manuscript.
Funding
This work was funded by the Natural Science Foundation of China (Grant 42277455) and Shaanxi Provincial Department of Education Youth Innovation Research Plan (Grant 23JP005).
Data Availability Statement
All data have been included in the manuscript.
Conflicts of Interest
The authors declare no conflicts of interest.
References
- IPCC. Special Report on Global Warming of 1.5; Cambridge University Press: Cambridge, UK, 2018. [Google Scholar]
- IPCC. Climate Change 2021: The Physical Science Basis. In Contribution of Working Group I to the Sixth Assessment Report of the Intergovernmental Panel on Climate Change; Cambridge University Press: Cambridge, UK, 2023. [Google Scholar]
- Støren, N.; Dahl, S.; Nesje, A.; Paasche, Ø. Identifying the sedimentary imprint of high-frequency Holocene river floods in lake sediments: Development and application of a new method. Quat. Sci. Rev. 2010, 29, 3021–3033. [Google Scholar] [CrossRef]
- Wirth, S.; Gilli, A.; Simonneau, A.; Ariztegui, D.; Vannière, B.; Glur, L.; Chapron, E.; Magny, M.; Anselmetti, F. A 2000 year long seasonal record of floods in the southern European Alps. Geophys. Res. Lett. 2013, 40, 4025–4029. [Google Scholar] [CrossRef]
- Wirth, S.; Glur, L.; Gilli, A.; Anselmetti, F. Holocene flood frequency across the Central Alps: Solar forcing and evidence for variations in North Atlantic atmospheric circulation. Quat. Sci. Rev. 2013, 80, 112–128. [Google Scholar] [CrossRef]
- Schlolaut, G.; Brauer, A.; Marshall, M.; Nakagawa, T.; Staff, R.; Ramsey, C.; Lamb, H.; Bryant, C.; Naumann, R.; Dulski, P.; et al. Event layers in the Japanese Lake Suigetsu ‘SG06’ sediment core: Description, interpretation and climatic implications. Quat. Sci. Rev. 2014, 83, 157–170. [Google Scholar] [CrossRef]
- Wang, X.; Jin, Z.; He, Z.; Zhou, L.; Xu, J. New insights into dating the sediment sequence within a landslide-dammed reservoir on the Chinese Loess Plateau. Holocene 2019, 29, 1020–1029. [Google Scholar] [CrossRef]
- Czymzik, M.; Brauer, A.; Dulski, P.; Plessen, B.; Naumann, R.; Grafenstein, U.; Scheffler, R. Orbital and solar forcing of shifts in mid- to late Holocene flood intensity from varved sediments of pre-alpine Lake Ammersee (southern Germany). Quat. Sci. Rev. 2013, 61, 96–110. [Google Scholar] [CrossRef]
- Glur, L.; Wirth, S.; Büntgen, U.; Gilli, A.; Haug, G.; Schär, C.; Beer, J.; Anselmetti, F. Frequent floods in the European Alps coincide with cooler periods of the past 2500 years. Sci. Rep. 2013, 3, 2770. [Google Scholar] [CrossRef]
- Suzuki, Y.; Tada, R.; Nagashima, K.; Nakagawa, T.; Gotanda, K.; Haraguchi, T.; Schlolaut, G. Extreme flood events and their frequency variations during the middle to late Holocene recorded in the sediment of Lake Suigetsu, central Japan. Holocene 2021, 31, 121–133. [Google Scholar] [CrossRef]
- Shao, S.; Wu, D.; Wang, T.; Guo, S.; Xiao, Q.; Li, Y.; Feng, X.; Deng, H.; Tang, Q.; Chen, F. Holocene extreme flood events in the middle reaches of the Lancang–Mekong River basin recorded by a high-altitude lake in southwestern China. Quat. Sci. Rev. 2024, 343, 108918. [Google Scholar] [CrossRef]
- Ding, Z.; Yu, Z.; Yang, S.; Sun, J.; Xiong, S.; Liu, T. Coeval changes in grain size and sedimentation rate of eolian loess, the Chinese Loess Plateau. Geophys. Res. Lett. 2001, 28, 2097–2100. [Google Scholar] [CrossRef]
- Sun, J. Provenance, forming mechanism and transport of loess in China. Quat. Sci. 2004, 24, 175–183, (In Chinese with English Abstract). [Google Scholar]
- An, Z.; Zhang, P.; Wang, E.; Wang, S.; Qiang, X.; Li, L.; Song, Y.; Chang, H.; Liu, X.; Zhou, W.; et al. Changes of the monsoon-arid environment in China and growth of the Tibetan Plateau since the Miocene. Quat. Sci. 2006, 26, 678–693, (In Chinese with English Abstract). [Google Scholar]
- Sun, D.; Lu, H. Grain-size and dust accumulation rate of Late Cenozoic aeolian deposits and the inferred atmospheric circulation evolutions. Quat. Sci. 2007, 27, 251–262, (In Chinese with English Abstract). [Google Scholar]
- Sun, Y.; Kutzbach, J.; An, Z.; Clemens, S.; Liu, Z.; Liu, W.; Liu, X.; Shi, Z.; Zheng, W.; Liang, L.; et al. Astronomical and glacial forcing of East Asian summer monsoon variability. Quat. Sci. Rev. 2015, 115, 132–142. [Google Scholar] [CrossRef]
- Sun, Y.; Gao, S.; Li, J. Preliminary analysis of grain-size populations with environmentally sensitive terrigenous components in marginal sea setting. Chin. Sci. Bull. 2003, 48, 184–187. [Google Scholar] [CrossRef]
- Zheng, H.; Chen, G.; Xie, X.; Mei, X.; Li, J.; Ge, H.; Huang, E. Grain size distribution and dynamic control of Late Quaternary terrigenous sediments in the South China sea and their implication for East Asian monsoon evolution. Quat. Sci. 2008, 28, 414–424, (In Chinese with English Abstract). [Google Scholar]
- Zhou, X.; Yang, W.; Xiang, R.; Wang, Y.; Sun, L. Re-examining the potential of using sensitive grain size of coastal muddy sediments as proxy of winter monsoon strength. Quat. Int. 2014, 333, 173–178. [Google Scholar] [CrossRef]
- Liu, X.; Wang, S.; Shen, J. The grain size of the core QH-2000 in Qinghai Lake and its implication for paleoclimate and paleoenvironment. J. Lake Sci. 2003, 15, 112–117, (In Chinese with English Abstract). [Google Scholar]
- Zhang, J.; Jin, M.; Chen, F.; Battarbee, R.; Henderson, A. Precipitation variations in the Northeast Tibetan Plateau over the last 800 years documented by sediment cores of Qinghai Lake. Chin. Sci. Bull. 2004, 49, 10–14, (In Chinese with English Abstract). [Google Scholar] [CrossRef]
- Chen, J.; Wan, G.; Zhang, D.; Zhang, F.; Huang, R. Environmental records of lacustrine sediments in different time scales: Sediment grain size as an example. Sci. China Ser. D Earth Sci. 2004, 47, 954–960. [Google Scholar] [CrossRef]
- Han, Y.; Xiao, X.; Yang, X.; Zhang, E.; Xiao, J. The grain-size characteristics of Tiancai Lake in northwestern of Yunnan Province and paleo-precipitation history during the Holocene. Quat. Sci. 2011, 31, 999–1010, (In Chinese with English Abstract). [Google Scholar]
- Sheng, E.; Yu, K.; Xu, H.; Lan, J.; Liu, B.; Che, S. Late Holocene Indian summer monsoon precipitation history at Lake Lugu, northwestern Yunnan Province, Southwestern China. Palaeogeogr. Palaeoclimatol. Palaeoecol. 2015, 438, 24–33. [Google Scholar] [CrossRef]
- Liu, X.; Vandenberghe, J.; An, Z.; Li, Y.; Jin, Z.; Dong, J.; Sun, Y. Grain size of Lake Qinghai sediments: Implications for riverine input and Holocene monsoon variability. Palaeogeogr. Palaeoclimatol. Palaeoecol. 2016, 449, 41–51. [Google Scholar] [CrossRef]
- Tan, J.; Xiao, X.; Li, Y. Late Holocene climatic change revealed by sediment records in Gegongcuonaka Lake, northwestern Yunnan Province. Quat. Sci. 2018, 38, 900–911, (In Chinese with English Abstract). [Google Scholar]
- He, W.; Wang, G.; Wang, Y.; Wei, Z.; Gong, J.; Zhang, T.; Ma, X.; Yu, X. Characteristics of climate and environment over the past 30 cal.ka B.P. recorded in lacustrine deposits of the Qionghai Lake, Sichuan Province. Quat. Sci. 2018, 38, 1179–1192, (In Chinese with English Abstract). [Google Scholar]
- Lan, J.; Xu, H.; Yu, K.; Sheng, E.; Zhou, K.; Wang, T.; Ye, Y.; Yan, D.; Wu, H.; Cheng, P.; et al. Late Holocene hydroclimatic variations and possible forcing mechanisms over the eastern Central Asia. Sci. China Earth Sci. 2019, 62, 1288–1301. [Google Scholar] [CrossRef]
- Sun, Q.; Zhou, J.; Xiao, J. Grain-size characteristics of Lake Daihai sediments and its paleoenvironment significance. Mari. Geol. Quat. Geol. 2001, 21, 93–95, (In Chinese with English Abstract). [Google Scholar]
- Liu, X.; Herzschuh, U.; Shen, J.; Jiang, Q.; Xiao, X. Holocene environmental and climatic changes inferred from Wulungu Lake in northern Xinjiang, China. Quat. Res. 2008, 70, 412–425. [Google Scholar] [CrossRef]
- Xiao, J.; Chang, Z.; Si, B.; Qin, X.; Itoh, S.; Lomtatidze, Z. Partitioning of the grain-size components of Dali Lake core sediments: Evidence for lake-level changes during the Holocene. J. Paleolimnol. 2009, 42, 249–260. [Google Scholar] [CrossRef]
- Xiao, J.; Fan, J.; Zhou, L.; Zhai, D.; Wen, R.; Qin, X. A model for linking grain-size component to lake level status of a modern clastic lake. J. Asian Earth Sci. 2013, 355, 34–43. [Google Scholar] [CrossRef]
- Guo, C.; Ma, Y.; Liu, J.; Li, D.; Hu, C.; Pei, Q.; Wu, Y. Climatic change recorded by grain size in the past about 2000 years from Yanzhog Yumco Lake, Tibet. Quat. Sci. 2016, 36, 405–419, (In Chinese with English Abstract). [Google Scholar]
- Ye, Y.; Xu, H.; Lan, J.; Yan, D.; Zhou, K.; Wu, H.; Zhang, J.; Sheng, E.; Yu, K.; Liu, B. Sedimentary grain size at Lake Chenghai, Yunnan Province: Indicator for water depth. Quat. Sci. 2018, 38, 1007–1016, (In Chinese with English Abstract). [Google Scholar]
- Li, Y.; Guo, Y.; Yu, G. An analysis of extreme flood events during the past 400 years at Taihu Lake, China. J. Hydrol. 2013, 500, 217–225. [Google Scholar] [CrossRef]
- Chen, F.; Xu, Q.; Chen, J.; Birks, H.; Liu, J.; Zhang, S.; Jin, L.; An, C.; Telford, R.; Cao, X.; et al. East Asian summer monsoon precipitation variability since the last deglaciation. Sci. Rep. 2015, 5, 11186. [Google Scholar] [CrossRef] [PubMed]
- Kimura, R.; Takayama, N. Restoration and Development of the Degraded Loess Plateau, China. In Climate of the Loess Plateau; Tsunekawa, A., Liu, G., Yamanaka, N., Du, S., Eds.; Ecological Research Monographs; Springer: Tokyo, Japan, 2014; pp. 23–33. [Google Scholar] [CrossRef]
- Zhang, X.; Wen, Z.; Feng, M.; Yang, Q.; Zheng, J. Application of 137Cs fingerprinting technique to interpreting sediment production records from reservoir deposits in a small catchment of the Hilly Loess Plateau, China. Sci. China Ser. D Earth Sci. 2007, 37, 405–410. [Google Scholar] [CrossRef]
- Long, Y.; Zhang, X.; Li, M.; Li, M.; Zhang, Y. Identification of the deposited layers in landslides reservoir and investigation of the sediment yields during the later sixteenth century on the Hill Loess Plateau, China. Chin. Sci. Bull. 2008, 53, 3908–3913. [Google Scholar] [CrossRef]
- Zhang, X.; Walling, D.; He, X.; Long, Y. Use of landslide-dammed lake deposits and pollen tracing techniques to investigate the erosional response of a small drainage basin in the Loess Plateau, China, to land use change during the late 16th century. Catena 2009, 79, 205–213. [Google Scholar] [CrossRef]
- Wang, X.; Liu, F.; Zhang, X.; Tang, X.; Xu, J.; Huang, P.; Wang, Y.; Jin, Z. Asynchronized erosion effects due to climate and human activities on the central Chinese Loess Plateau during the Anthropocene and its implications for future soil and water management. Earth Surf. Proc. Landf. 2022, 47, 1238–1251. [Google Scholar] [CrossRef]
- Wang, X.; Wang, Z.; Xiao, J.; He, M.; Zhang, F.; Pan, Y.; Zhang, Y.; Jin, Z. Soil erosion fluxes on the central Chinese Loess Plateau during CE 1811 to 1996 and the roles of monsoon storms and human activities. Catena 2021, 200, 105148. [Google Scholar] [CrossRef]
- Yu, K.; Xu, H.; Lan, J.; Sheng, E.; Liu, B.; Wu, H.; Tan, L.; Yeager, K. Climate change and soil erosion in a small alpine lake basin on the Loess Plateau, China. Earth Surf. Proc. Landf. 2017, 42, 1238–1247. [Google Scholar] [CrossRef]
- Chen, J.; Liu, J.; Xie, C.; Chen, G.; Chen, J.; Zhang, Z.; Zhou, A.; Rühland, K.; Smol, J.; Chen, F. Biogeochemical responses to climate change and anthropogenic nitrogen deposition from a ∼200-year record from Tianchi Lake, Chinese Loess Plateau. Quat. Int. 2018, 493, 22–30. [Google Scholar] [CrossRef]
- Guo, C.; Ma, Y.; Meng, H. Late Holocene vegetation, climate, and lake changes in northern China: Varved evidence from western Loess Plateau. Sci. Total Environ. 2022, 827, 154282. [Google Scholar] [CrossRef] [PubMed]
- Cheng, J.; Yu, Z.; Zhu, R.; Jin, J.; Jing, Z. Comprehensive Scientific Investigation Report of Liupan Mountains National Nature Reserve; Science Press: Beijing, China, 2013; pp. 6–84. (In Chinese) [Google Scholar]
- Yu, K.; Wang, L.; Sheng, E.; Liu, B.; Liu, X.; Lan, J. Environmental implication of magnetic susceptibility of lacustrine sediments in Lake Chaonaqiu, Liupan Mountain. Chin. J. Ecol. 2020, 39, 2501–2508, (In Chinese with English Abstract). [Google Scholar]
- Lu, H.; An, Z. Paleoclimatic significance of grain size of loess-palaeosol deposit in Chinese Loess Plateau. Sci. China Ser. D 1998, 41, 626–631. (In Chinese) [Google Scholar] [CrossRef]
- Li, X.; Shang, X.; Zhou, X.; Zhang, H. Integrative method of sieving and heavy liquid in pollen analysis of loess-data analysis and processing. Arid Land Geogr. 2006, 29, 663–667, (In Chinese with English Abstract). [Google Scholar]
- Zhou, X.; Li, X.; Dodson, J.; Yang, S.; Long, H.; Zhao, K.; Sun, N.; Yang, Q.; Liu, H.; Zhao, C. Zonal vegetation change in the Chinese Loess Plateau since MIS 3. Palaeogeogr. Palaeoclimatol. Palaeoecol. 2014, 404, 89–96. [Google Scholar] [CrossRef]
- Ma, J.; Zhou, X.; Yang, S.; Rao, H.; Li, J.; Hu, S.; Yang, Y.; Li, X. Middle Holocene hunting-gathering culture and environmental background of the steppe area of northern China. Sci. China Earth Sci. 2022, 65, 1317–1327. [Google Scholar] [CrossRef]
- Sun, H.; James, B.; Osamu, S.; Zhou, A. Mid- to- late Holocene hydroclimatic changes on the Chinese Loess Plateau: Evidence from n-alkanes from the sediments of Tianchi Lake. J. Paleolimnol. 2018, 60, 511–523. [Google Scholar] [CrossRef]
- Zhang, C.; Zhou, A.; Zhang, H.; Zhang, Q.; Zhang, X.; Sun, H.; Zhao, C. Soil erosion in relation to climate change and vegetation cover over the past 2000 years as inferred from the Tianchi lake in the Chinese Loess Plateau. J. Asian Earth Sci. 2019, 180, 103850. [Google Scholar] [CrossRef]
- Shen, J.; Xue, B.; Wu, J.; Wu, Y.; Liu, X.; Yang, X.; Liu, J.; Wang, S. Lake Sedimentation and Environmental Evolution; Science Press: Beijing, China, 2010; pp. 65–155. (In Chinese) [Google Scholar]
- Vandenberghe, J.; An, Z.; Nugteren, G.; Lu, H.; Van Huissteden, K. New absolute time scale for the quaternary climate in the Chinese loess region by grain-size analysis. Geology 1997, 25, 35–38. [Google Scholar] [CrossRef]
- Liu, L.; Yu, K.; Li, A.; Zhang, C.; Wang, L.; Liu, X.; Lan, J. Weathering Intensity Response to Climate Change on Decadal Scales: A Record of Rb/Sr Ratios from Chaonaqiu Lake Sediments, Western Chinese Loess Plateau. Water 2023, 15, 1890. [Google Scholar] [CrossRef]
- Yuan, L. Disasters History of Northwest; Gansu People Press: Lanzhou, China, 1994; pp. 701–950. (In Chinese) [Google Scholar]
- Wen, K.G. Chinese Meteorological Disasters Ceremony: Gansu Volume; Dong, A.X., Ed.; Meteorology Press: Beijing, China, 2005; pp. 189–234. (In Chinese) [Google Scholar]
- Wen, K.G. Chinese Meteorological Disasters Ceremony: Ningxia Volume; Xia, P.M., Ed.; Meteorology Press: Beijing, China, 2007; pp. 76–128. (In Chinese) [Google Scholar]
- OR (Official Revision). Veritable Records of Qing Dynasty; Zhong Hua Book Company: Beijing, China, 1986; Volume 9–59. (In Chinese) [Google Scholar]
- ZCCCC (Zhuanglang County Chronicles Compilation Committee). Zhuanglang County Chronicles; Zhong Hua Book Company: Beijing, China, 1997; pp. 79–80. (In Chinese) [Google Scholar]
- ZCCCC (Zhuanglang County Chronicles Compilation Committee). Zhuanglang County Chronicles (1991–2010); Local Chronicles Press: Beijing, China, 2019; p. 43. (In Chinese) [Google Scholar]
- HCCCC (Huating County Chronicles Compilation Committee). Huating County Chronicles; Gansu People’s Publishing House: Lanzhou, China, 1993; pp. 101–103. (In Chinese) [Google Scholar]
- HLCCC (Huating Local Chronicles Compilation Committee). Huating County Chronicles (1988–2009); Local Chronicles Press: Beijing, China, 2018; pp. 40–41. (In Chinese) [Google Scholar]
- LCCCC (Longde County Chronicles Compilation Committee). Longde County Chronicles; Ningxia People’s Publishing House: Yinchuan, China, 1998; pp. 50–56. (In Chinese) [Google Scholar]
- LLCCC (Longde Local Chronicles Compilation Committee). Longde County Chronicles (1991–2000); Local Chronicles: Beijing, China, 2005; pp. 9–21. (In Chinese) [Google Scholar]
- JCCCC (Jingyuan County Chronicles Compilation Committee). Jingyuan County Chronicles; Ningxia People’s Publishing House: Yinchuan, China, 1995; pp. 13–34. (In Chinese) [Google Scholar]
- JLCCC (Longde Local Chronicles Compilation Committee). Jingyuan County Chronicles (1991–2000); Local Chronicles: Beijing, China, 2003; pp. 1–24. (In Chinese) [Google Scholar]
- Fang, K.; Frank, D.; Gou, X.; Liu, C.; Zhou, F.; Li, J.; Li, Y. Precipitation over the past four centuries in the Dieshan Mountains as inferred from tree rings: An introduction to an HHT-based method. Glob. Planet. Chang. 2013, 107, 109–118. [Google Scholar] [CrossRef]
- CAMS (Chinese Academy of Meteorological Science). Yearly Charts of Dryness/Wetness in China for the Last 500-Year Period; Cartographic Publishing House: Beijing, China, 1981. (In Chinese) [Google Scholar]
- Zhang, D.; Li, X.; Liang, Y. Continued complement (1993–2000) of yearly charts of dryness/wetness in China for the last 500-year period. J. Appl. Meteorol. Sci. 2003, 14, 379–384. (In Chinese) [Google Scholar] [CrossRef]
- Zhang, D.; Liu, C. Continued complement (1980–1992) of yearly charts of dryness/wetness in China for the last 500-year period. Meteorol. Mon. 1993, 19, 41–45. (In Chinese) [Google Scholar]
- Yan, X.; Liu, J.; Rühland, K.; Smol, J.; Chen, F. Climate change as the dominant driver of recent ecological changes in a semi-arid alpine lake from the Chinese Loess Plateau. J. Paleolimnol. 2022, 68, 39–57. [Google Scholar] [CrossRef]
- Zhou, X.; Zhao, P.; Liu, G. Asian-Pacific Oscillation index and variation of East Asian summer monsoon over the past millennium. Chin. Sci. Bull. 2009, 54, 3768–3771. [Google Scholar] [CrossRef]
- Tan, M.; Liu, T.; Hou, J.; Qin, X.; Zhang, H.; Li, T. Cyclic rapid warming on centennial-scale revealed by a 2650-year stalagmite record of warm season temperature. Geophys. Res. Lett. 2003, 30, 1617–1620. [Google Scholar] [CrossRef]
- MacDonald, G.; Case, R.A. Variations in the Pacific decadal oscillation over the past millennium. Geophys. Res. Lett. 2005, 32, L08703. [Google Scholar] [CrossRef]
- Zhao, P.; Zhu, Y.; Zhang, R. An Asian-Pacific teleconnection in summer tropospheric temperature and associated Asian climate variability. Clim. Dyn. 2007, 29, 293–303. [Google Scholar] [CrossRef]
Disclaimer/Publisher’s Note: The statements, opinions and data contained in all publications are solely those of the individual author(s) and contributor(s) and not of MDPI and/or the editor(s). MDPI and/or the editor(s) disclaim responsibility for any injury to people or property resulting from any ideas, methods, instructions or products referred to in the content. |
© 2024 by the authors. Licensee MDPI, Basel, Switzerland. This article is an open access article distributed under the terms and conditions of the Creative Commons Attribution (CC BY) license (https://creativecommons.org/licenses/by/4.0/).