Article

Water Quality Changes in the Xingkai (Khanka) Lake, Northeast China, Driven by Climate Change and Human Activities: Insights from Published Data (1990–2020)

1
Yunnan Key Laboratory of Plateau Geographical Process and Environmental Change, Faculty of Geography, Yunnan Normal University, Kunming 650500, China
2
Key Laboratory of Land Water Cycle and Surface Processes, Institute of Geographic Sciences and Natural Resources Research, Chinese Academy of Sciences, Beijing 100101, China
3
School of Environmental Science and Engineering, Guangzhou University, Guangzhou 510006, China
4
University of Chinese Academy of Sciences, Beijing 100049, China
5
Pacific Geographical Institute, Far-Eastern Branch, Russian Academy of Sciences, Vladivostok 690041, Russia
6
Department of Geography, University of Wisconsin-Madison, Madison, WI 53706, USA
*
Author to whom correspondence should be addressed.
Water 2024, 16(21), 3080; https://doi.org/10.3390/w16213080
Submission received: 23 September 2024 / Revised: 18 October 2024 / Accepted: 26 October 2024 / Published: 28 October 2024
(This article belongs to the Special Issue Contaminants of Emerging Concern in Soil and Water Environment)

Abstract

:
Water quality degradation and eutrophication of lakes are global ecological and environmental concerns, especially shallow lakes. This study collected hydrochemical data from 2935 samples of the Chinese part of Xingkai (Khanka) Lake, based on 40 published papers spanning the period from 2001 to 2023. Using the water quality index (WQI), improved geo-accumulation index (Igeo), and redundancy analysis (RDA), we analyzed the overall contamination characteristics of the water environment in Xingkai Lake. Additionally, we explored the impact of climate change and human activities on the lake’s water quality. The results showed that the annual WQI for Xingkai Lake ranged from 47.3 to 72, with a general downward trend, indicating improving water quality. Notably, the average WQI in May and total nitrogen (TN) content decreased significantly, signaling further improvement in water quality. The average concentration of TN in sediments was 1401.3 mg/kg, reflecting mild contamination. The Igeo values for the heavy metals Hg and Cr were greater than 1, indicating moderate contamination, while the Igeo values for Cd and Pb were between 0 and 1, which is in the range of uncontaminated to moderately contaminated. Land use and climate change (average annual temperature and annual precipitation) were key factors influencing water quality, with cumulative explanatory ratios of 67.3% and 50.1%. This study utilized land-use change as a metric for human activities, highlighting the potential impacts of climate change and human activities on the water quality of Xingkai Lake. It offers vital insights for the sustainable management of Xingkai Lake and provides valuable references into the management of similar transboundary lakes.

1. Introduction

Lakes are a critical component of the global water environment, providing a range of ecological and economic values, including water supply, regulation of surface runoff, and the preservation of aquatic biodiversity [1]. However, due to their inherent sensitivity, lakes are highly responsive to external factors such as climate change and human activities [2]. Under the combined influence of climate change and human activities, lake ecosystems are experiencing unprecedented challenges. For example, rising temperatures, shifting precipitation patterns, and increasing frequency of extreme events are all having profound effects on lake health and ecosystem stability [3,4]. At the same time, human activities (e.g., the release of contaminants, land-use changes, and urbanization) are exacerbating environmental problems, leading to water quality degradation and the eutrophication of lakes [5].
The decline in water quality, rising eutrophication, and the loss of biodiversity are becoming significant challenges for lake management and the socio-economic development of the basin [6]. Water quality, in particular, is a key indicator for assessing environmental changes in lakes and evaluating their overall health [7,8,9]. Numerous studies have reported a global decline in lake water quality over the past few decades, with serious consequences [10,11]. For example, pesticides, herbicides, and insecticides used in the course of agricultural production may enter water bodies through surface runoff and then accumulate in the ecosystem [12], triggering toxic effects and causing harmful impacts on the environment and aquatic organisms [13]. Excessive nutrient inputs can promote phytoplankton growth, leading to harmful algae blooms in the water, which can destabilize lake ecosystems [14]. Furthermore, deterioration of water quality often results in elevated concentrations of hazardous substances, which can enter drinking water sources or the food chain, posing significant risks to human health [15]. Especially in shallow lakes, due to the more frequent interaction between water bodies and sediments, endogenous nutrients are more likely to be suspended and released into the water column under hydrodynamic action, further aggravating the deterioration of water quality [16,17].
Xingkai Lake, located at the border between Russia’s Primorsky Krai and China’s Heilongjiang Province, is the largest freshwater lake in East Asia. With its vast area and rich biodiversity, the lake plays a significant role in regulating regional climate and ecological environments. However, with the rapid development of agriculture and tourism and the accelerating urbanization within the basin, water quality issues in Xingkai Lake are becoming increasingly severe. Industrial wastewater discharge, agricultural non-point source pollution, and domestic sewage have led to water quality deterioration, eutrophication of the lake [18], and frequent outbreaks of algal blooms [19], etc. These issues have negatively impacted local fishery resources, tourism resources, and water security [20,21].
Previous research on water quality assessment in Xingkai Lake has revealed the condition of the lake’s water quality, analyzed its spatial distribution, and conducted preliminary analyses of the causes. However, these analyses lack a comprehensive and systematic exploration of the key drivers behind water quality changes. Therefore, this study aimed to address this gap by examining temporal trends in Xingkai Lake’s water quality, using data from the published literature and databases. Specifically, the objectives of this study were to (1) detect the changes in water quality over time; (2) identify the predominant factors controlling these changes, including both climate change and human activities; and (3) provide recommendations for the management of Xingkai Lake and provide a reference for similar transboundary lakes. By investigating the mechanisms through which climate change and human activities affect lake water quality, this study offers a scientific foundation for the sustainable development of Xingkai Lake and provides valuable insights into the ecological protection and water management of similar lakes.

2. Materials and Methods
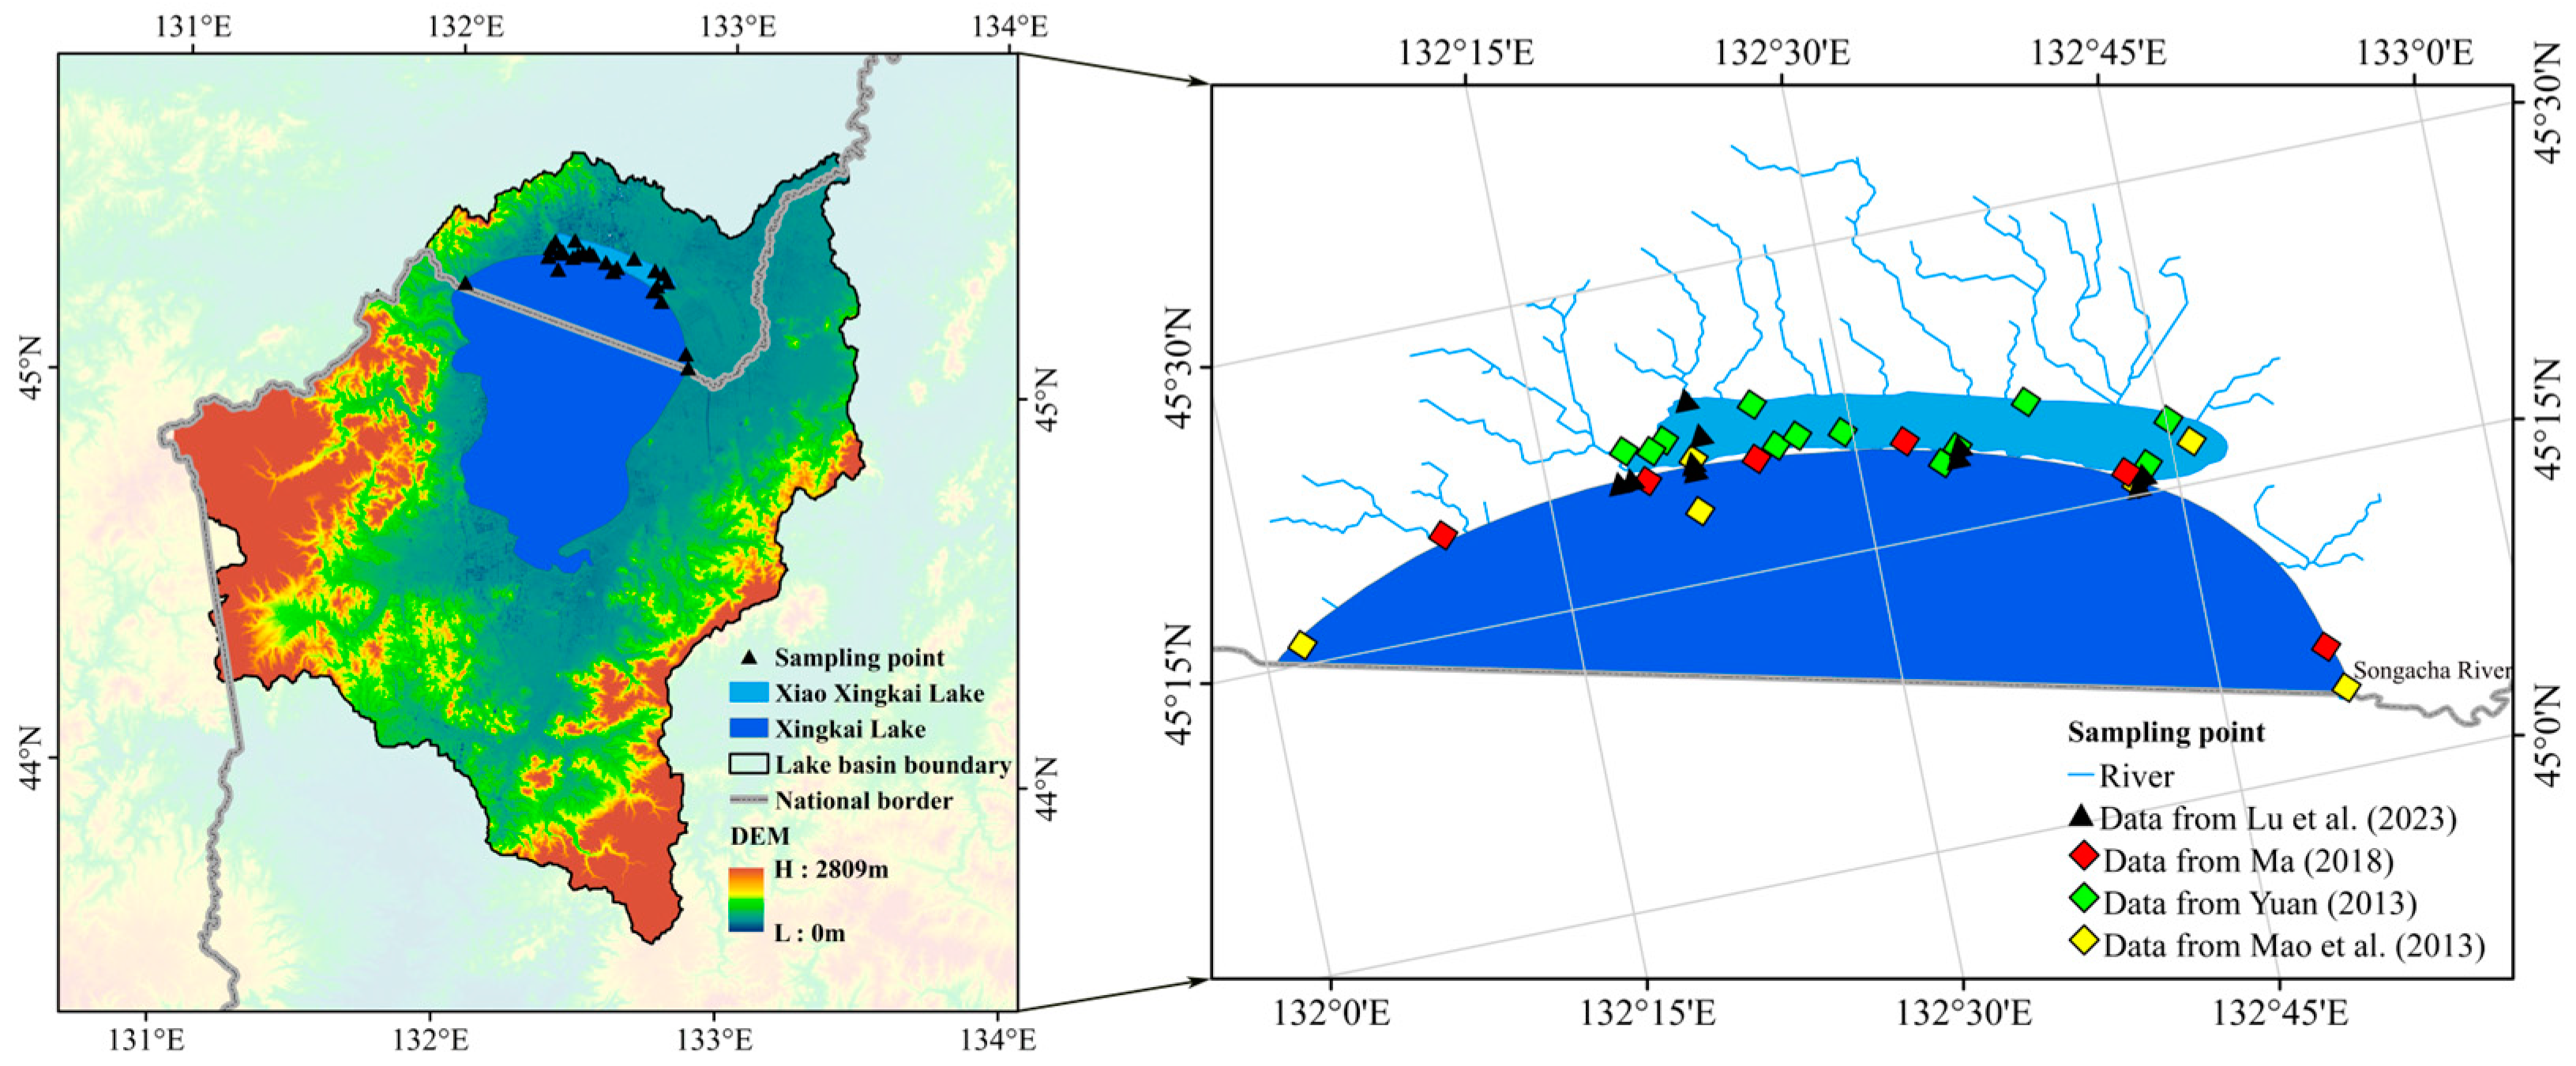
2.1. Study Area

Xingkai Lake (Khanka Lake), a boundary lake between China and Russia, is also the largest freshwater lake in East Asia. It consists of Xingkai Lake and Xiao Xingkai Lake. Xiao Xingkai Lake is located in China, while the northern part of Xingkai Lake belongs to China, and the southern part belongs to Russia. Xingkai Lake extends about 90 km from north to south and about 50 km from east to west. With an area of 4380 km2, an elevation of 69 m above sea level, and a maximum depth of 10 m, it has a total water storage capacity of approximately 24 to 26 billion m. The lake is oval-shaped, as it is more expansive in the north and narrower in the south [22].
The primary water source for the lake is the rivers flowing into it. For Xiao Xingkai Lake, the rivers are mainly distributed along the northern shore, with the Muleng River being the primary water source. The water from Xiao Xingkai Lake flows through the first and second gates into Xingkai Lake, creating a hydrologically connected system. The rivers flowing into Xingkai Lake are mainly located in the western part of the lake, and the water exits through the Songacha River [23], which flows along the Sino-Russian border. This river is the only flood discharge channel of Xingkai Lake.
Xingkai Lake typically begins to freeze in December and thaws in mid to late April. The primary land-use types in the basin are cropland and forest, with the main crops being corn and rice. The study area for this paper focuses on the Chinese portion of Xingkai Lake, including Xiao Xingkai Lake and the northern part of Xingkai Lake within China (Figure 1).

2.2. Data Sources

Google Scholar “https://scholar.google.com/schhp?hl=en&as_sdt=0,5 (accessed on 30 May 2024)”, Web of Science “https://webofscience.clarivate.cn/wos/alldb/basic-search (accessed on 30 May 2024)”, and CNKI databases “https://www.cnki.net/ (accessed on 30 May 2024)” were searched with the keywords “Xingkai Lake/Khanka Lake”, “water quality”, and “hydrochemistry”. During the literature screening process, articles involving the specific values of the hydrochemistry of Xingkai Lake were prioritized, followed by articles that could provide a sampling date spanning from 2001 to 2023, and a total of 40 pieces of literature meeting the requirements were collected. We conducted a systematic analysis of these studies and organized the necessary data by year using Microsoft Excel. If there were multiple data points for a given year, we calculated and used the average for that year. The summarized data are presented in Table 1 and Table 2, while more detailed data can be found in Tables S1 and S2.
Data about the land-use and land-cover changes within the Chinese geographical segment of the Xingkai Lake Basin from 1990 to 2020 were acquired. These data were sourced from “https://zenodo.org/ (accessed on 10 June 2024)”. The primary application of this 30 m resolution dataset was to survey the alterations in land use and land cover over the past three decades [60]. In addition, it was used to determine whether land degradation exists in the Chinese part of the Xingkai Lake Basin. Furthermore, the annual precipitation and mean temperature data, specifically for Jixi City, covering the period from 1990 to 2020, were obtained from the National Oceanic and Atmospheric Administration (NOAA) and retrieved from the website “https://www.noaa.gov/ (accessed on 18 May 2024)”. In addition, these meteorological data were also extracted from the Heilongjiang Statistical Yearbook. The gathered climate data were crucial for conducting comprehensive analyses to elucidate the climatic alterations within the Xingkai Lake Basin during the specified period. Henceforth, the current study did not entail the collection of field samples, nor did it involve any laboratory-based water quality analysis.

2.3. Methods

2.3.1. Water Quality Evaluation

The water quality index (WQI) is a form of quantitative expression of the quality of the water environment, reflecting the environmental conditions of the dimensionless relative number [61]. In this study, seven water quality factors were used to account for the WQI of Xingkai Lake: water temperature (Sept.), pH, electrical conductivity (EC), total nitrogen (TN), ammonia nitrogen (NH3-N), total phosphorus (TP), and chemical oxygen demand (COD). The weights of the water quality factors were selected mainly based on their importance to the health of the lake ecosystem, and their values were referred to in previous related studies [62]. The standard values of the water quality factors were evaluated according to the “Environmental Quality Standard for Surface Water of China (GB 3838–2002)”. Table S3 provides the relative weights and standard scores for the water quality parameters examined in this study. The WQI is calculated according to the formula shown in Equation (1).
W Q I = i = 1 n C i P i i = 1 n P i
WQI is the water quality index; n is the total number of water quality factors used to calculate the WQI; Ci is the standard value of water quality factor i; and Pi is the relative weight of water quality factor i.
The WQI ranges from 0 to 100; low values represent good water quality conditions. According to the WQI value, the water quality was divided into five grades: at 0 ≤ W ≤ 25, the water quality level is excellent, and the water quality category is I; at 25 < W ≤ 50, the water quality level is good, and the water quality category is II; at 50 < W ≤ 70, the water quality level is fair, and the water quality category is III; at 70 < W ≤ 90, the water quality level is poor, and the water quality category is IV; and at W > 90, the water quality grade is very poor, with the water quality category V [63].

2.3.2. Heavy Metal Risk Evaluation

The geo-accumulation index (Igeo) is an evaluation method proposed using the relationship between the heavy metal content in sediments and their regional geochemical background values [64]. It allows quantitative evaluation of the degree of contamination of specific heavy metals in sediments and assessment of the accumulation of heavy metals in sediments due to anthropogenic disturbances. Its calculation formula is shown in Equation (2).
I g e o = log 2 C n K B n
Igeo is the ground cumulative index; Cn is the concentration of element n in the sample; Bn is the regional background value of the heavy metal element in the sediment; and K is the coefficient of variation of the background value, typically 1.5.
The Nemerow index is a weighted multi-factor environmental quality index that takes into account extreme values or highlights the maximum values. While the single-factor index can only reflect the degree of contamination of each heavy metal element, the composite pollution index considers the maximum and average values of the single-factor pollution index, thus highlighting the impact of heavily contaminated heavy metal pollutants more prominently. By using the Nemerow index to replace the ratio of heavy metal concentrations to the corrected background concentrations in the original geo-accumulation index, the improved geo-accumulation index method (INI) can more significantly reflect the impact of high levels of heavy metals on the evaluation results and provide more rigorous and detailed pollution assessment results [65,66]. NI is calculated as shown in Equation (3):
N I = max 2 + a v e 2 2
Ave and max are the mean and maximum values for the heavy metals studied.
The formula for INI is shown in Equation (4):
I N I = log 2 ( ( C max / K B ) 2 + ( C a v e / K B ) 2 2
INI is the improved geo-accumulation index; Cmax is the maximum concentration of an element in a sample; Cave is the average concentration of the element in the sample; B and K are the same as in Equation (2).
Adhering to the classification criteria of the original geo-accumulation index: Igeo ≤ 0: uncontaminated; 0 < Igeo ≤ 1: uncontaminated to moderately contaminated; 1 < Igeo ≤ 2: moderately contaminated; 2 < Igeo ≤ 3: moderately to heavily contaminated; 3 < Igeo ≤ 4: heavily contaminated; 4 < Igeo ≤ 5: heavily to extremely contaminated; and Igeo > 5: extremely contaminated [23].

2.3.3. Data Analysis Methods

To analyze the trend of water quality data for Xinghai Lake, the M-K test was conducted using the “Kendall” package in R software (version 4.4.0). Additionally, a general map of the study area was created using ArcMap 10.8, and land-use data from the Chinese portion of the Xinghai Lake Basin were extracted to establish a land-use transfer matrix. Following this, redundancy analysis was performed with the “vegan” package in R to explore the relationships among land-use area, total annual precipitation, average annual temperature, and water quality factors.

3. Results

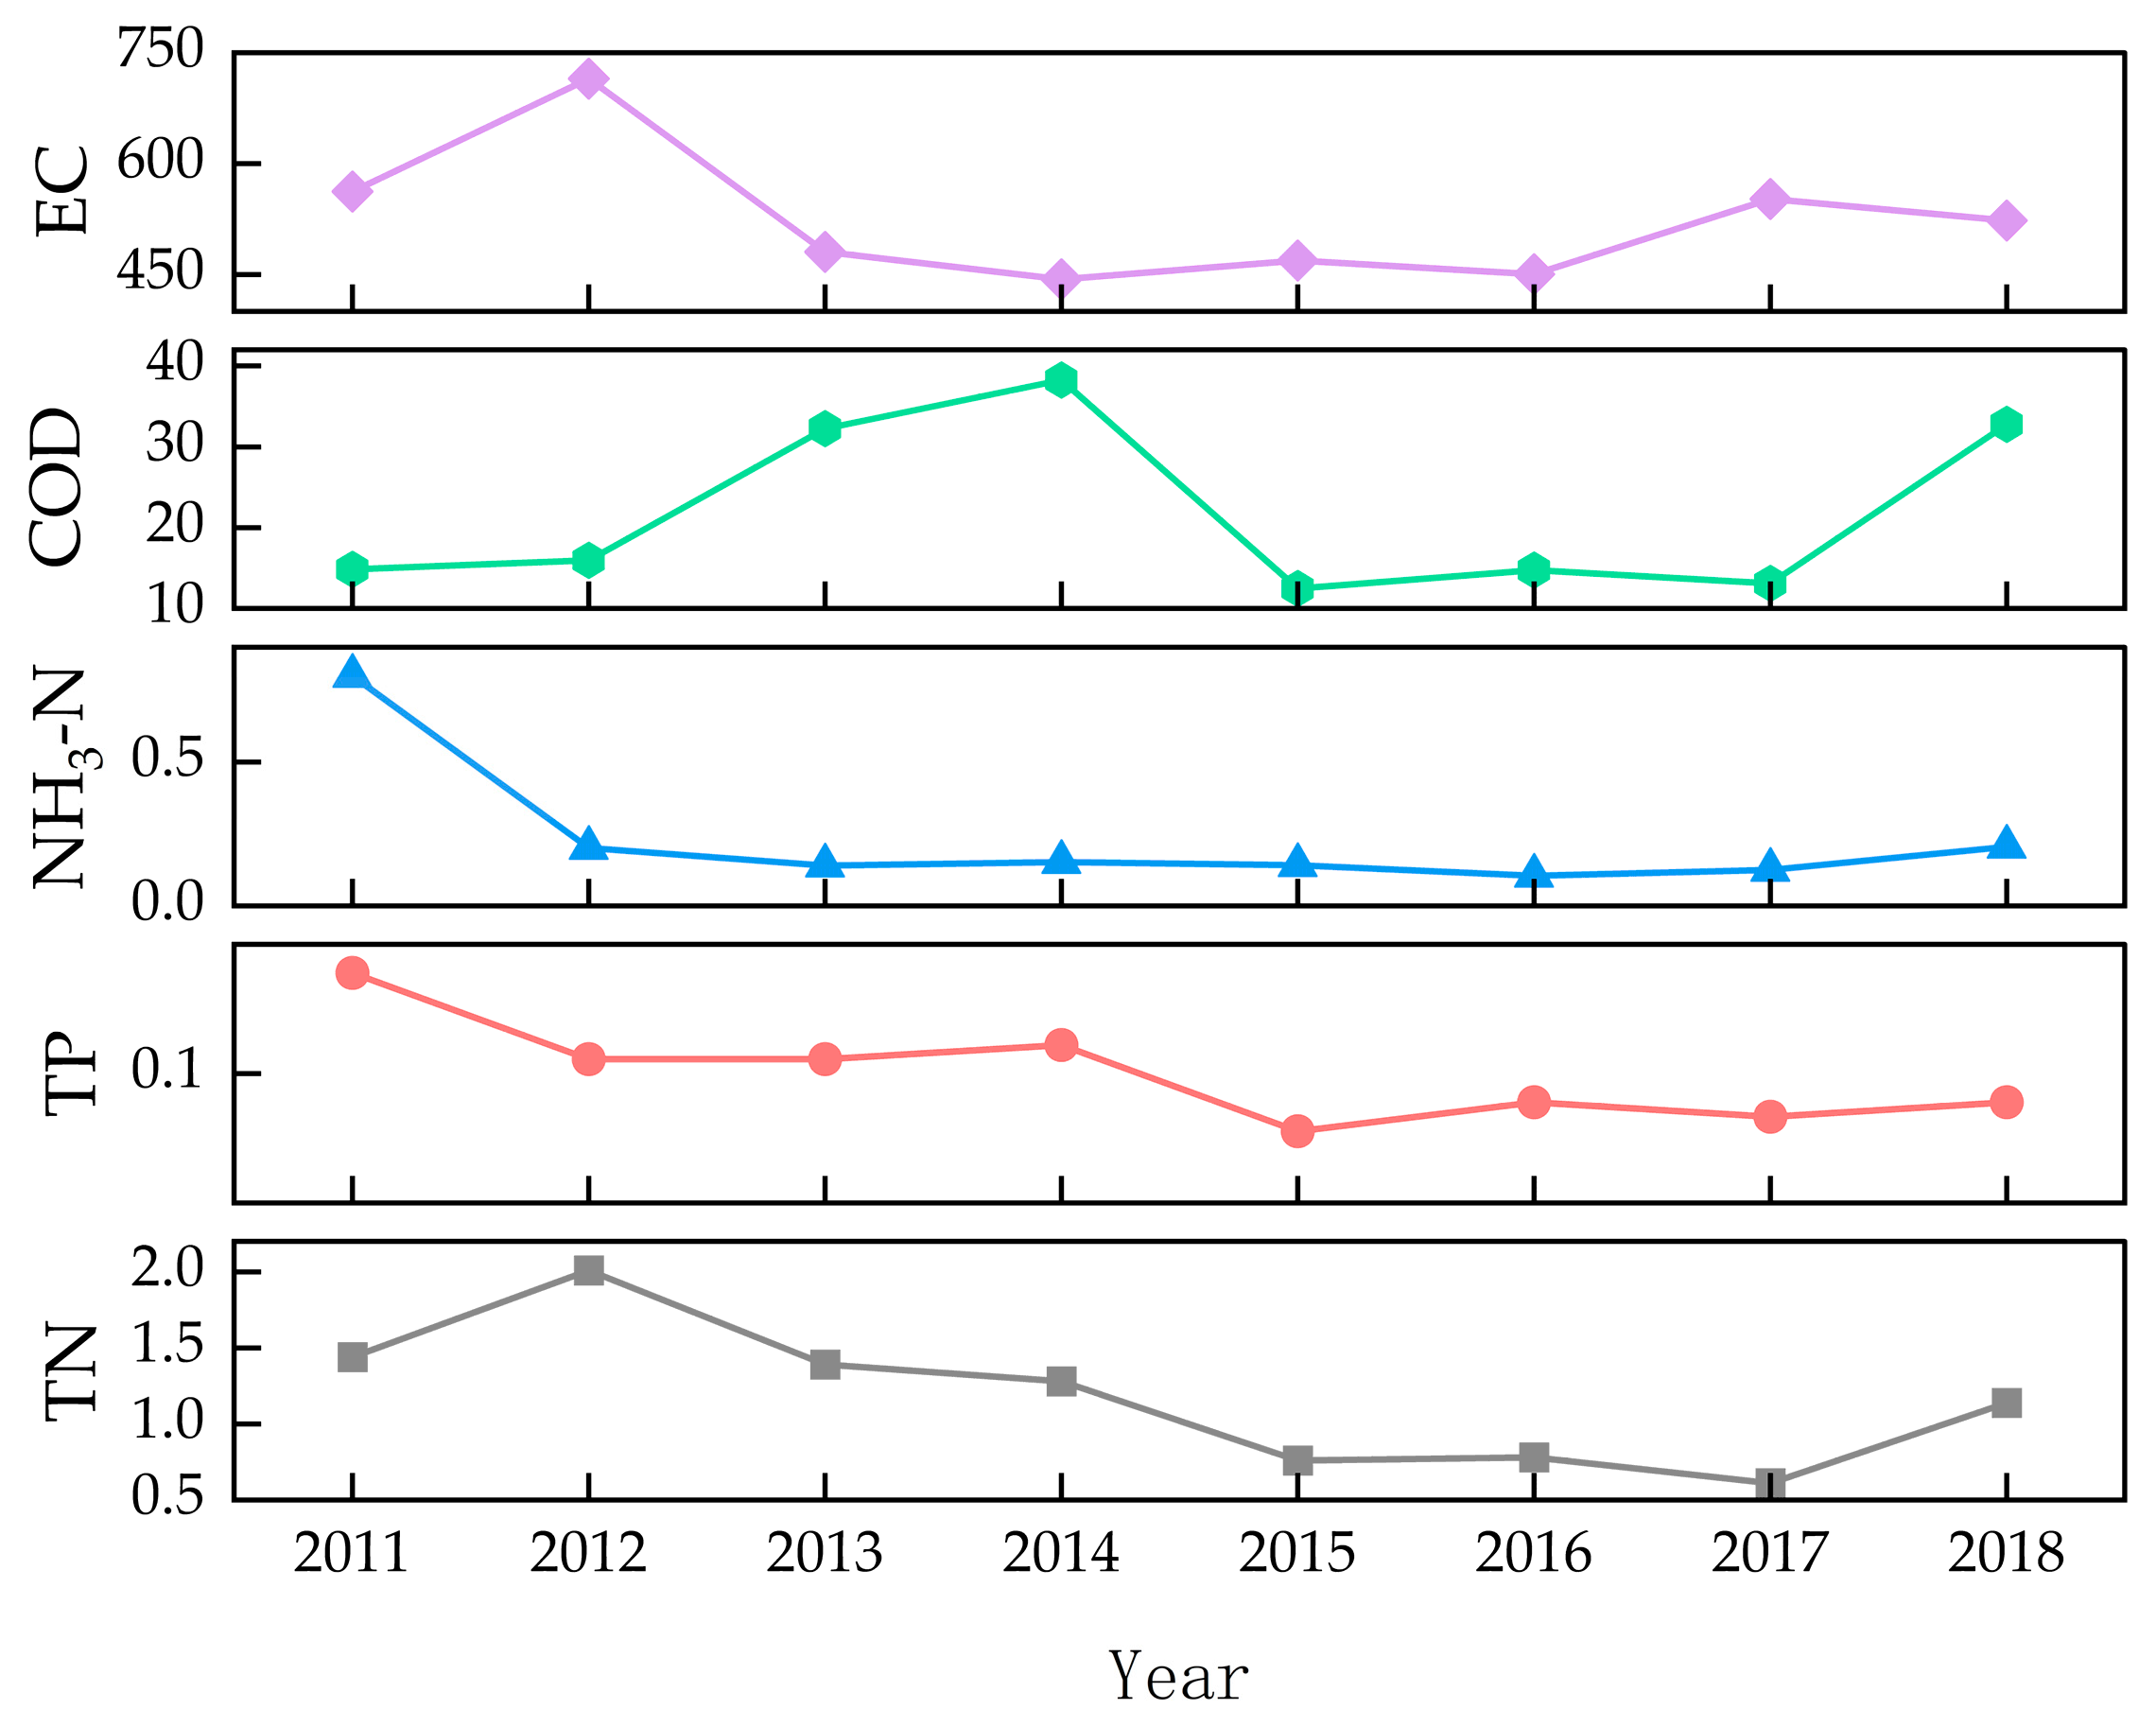
3.1. Temporal Variations in Water Quality

Concentrations of the main water quality factors in Xingkai Lake: The average TN and TP concentrations were 1.19 mg/L (0.09~12.29 mg/L) and 0.12 mg/L (0.01~1.07 mg/L). NH3-N concentration was 0.001~2.64 mg/L, and the average concentration was 0.23 mg/L. COD was 0.16~111.9 mg/L, and the average concentration was 22.48 mg/L.
The range, mean, and coefficient of variation of the water quality factors of Xingkai Lake are shown in Table 3:
To assess the overall water quality condition and seasonal water quality condition of Xingkai Lake, the seasonal data for May and September of each year from 2011 to 2018 were selected to calculate the water quality index (WQI) of Xingkai Lake, which fluctuated greatly during this period. Its WQI value ranged from 47.33 to 72.00, with an average value of 55.67, between Grade II and Grade IV (Table 4). Overall, the water quality of Xingkai Lake showed a trend of gradual improvement, with the WQI value decreasing from 2011 to 2016 and increasing from 2017 to 2018. To gain a deeper understanding of the reasons for the fluctuations in water quality, the annual average data of all sampling points during this period were analyzed in detail (Figure 2). The results show that the content of all water quality factors except COD showed a decreasing trend; however, the content of EC in the water body increased from 2017 to 2018, while COD and TN also increased in 2018. Therefore, the fluctuation in the content of these water quality factors directly led to the rebound of WQI in 2017–2018. In addition, from 2011 to 2013, the WQI value of Xingkai Lake in May was higher than that of September, indicating that the water quality in May was poor, while after 2013, the water quality in May was better than that in September. This is due to more frequent and intensive tourism activities in September against the background of improved water quality, which puts additional pressure on water quality. TN and TP were the main exceedance factors in calculating the water quality index of Xingkai Lake.
In order to further analyze the trend of water quality changes, the M-K trend test was used to analyze the trend of each water quality parameter and WQI value, and the results are shown in Table 5. As can be seen in Table 5, the COD value showed no trend; the annual average WQI value, the average of WQI in September, and the four water quality parameters of pH, EC, TP, and NH3-N had a decreasing trend, but it was not significant; the water temperature showed a significant increase in September; and the average of WQI in May and the average of TN showed a substantial decreasing trend.

3.2. Heavy Metals and Nutrients in Sediments

The pH of the sediments of Xingkai Lake was 4.92~7.71, with an average value of 6.57, which was weakly acidic. The concentration of TN ranged from 188.73 to 12,361 mg/kg, with an average concentration of 1401.29 mg/kg. The concentration of TP ranged from 14.41 to 1989 mg/kg, with an average concentration of 484.59 mg/kg. The heavy metal content is shown in Table 6. The concentrations of each element were in the order Mn > Cr > Zn > Ni > Pb > Cu > As > Cd > Hg. Using the environmental background value of the soil in the Northeast Plains as a reference standard [67], the contents of chromium (Cr), cadmium (Cd), mercury (Hg), and nickel (Ni) in the sediments of Xingkai Lake exceeded the environmental background value of the region. This result suggests that the presence of these elements in the sediments of Xingkai Lake may indicate that the area is somewhat contaminated.
To further understand the enrichment of heavy metals in the sediments of Xingkai Lake, the improved geo-accumulation index (INI) method was used for quantitative analysis, and the specific results are shown in Table 7. The analysis showed that the Igeo values of Hg and Cr were higher than 1, which indicates that their contamination in the sediments of Xingkai Lake reached the level of moderately contaminated. In contrast, the Igeo values of Cd and Pb were between 0 and 1, indicating that their contamination status was uncontaminated to only moderate contamination. Other elements, such as Mn, Cu, Zn, As, Ni, etc., had Igeo values lower than 0, and thus, it was assumed that they did not contaminate the study area. In addition, although the mean value of Pb did not exceed the ambient background value, its maximum value was nearly three times the ambient background value. This high value shows Pb as uncontaminated to mildly contaminated when evaluated by the improved geo-accumulation index method. The extensive cultivated land in the Xingkai Lake Basin and the presence of coal and graphite development in the basin’s upper reaches have resulted in Igeo values of Cr, Pb, Hg, and Cd greater than 0.

3.3. Impact of Human Activities and Climate Factors on Water Quality

Land use serves as a valuable indicator for assessing the impact of human activities on water quality. In the Chinese section of the Xingkai Lake Basin, land-use types are categorized into seven types: cropland, forest, grassland, waterbody, wetland, impervious surface, and barren. Through the utilization of the land-use transition matrix, Figure 3 reveals notable changes in land use from 1990 to 2020. The most significant change occurred in cropland, which accounted for 48.40% of the total area change. Following this, forests experienced a notable shift, accounting for 28.45%. The changes in the other five types of land use were relatively minor, collectively accounting for 23.15% of the total.
According to SDG 15.3.1 and specific Chinese policies [68,69], the final relationship between land-use type conversion and land status results is shown in Table 8. The land degradation area in the Xingkai Lake Basin exceeds the area of land improvement. Specifically, land degradation is mainly manifested in the conversion of forests and wetlands to cropland in large quantities and the conversion of part of the cropland to impervious surface. Land improvement is primarily characterized by converting cropland to forest and grassland, reflecting practices such as “returning farmland to forest and grassland”. Overall, the conversion of forests and wetlands to cropland is still the main trend of land-use change in the Xingkai Lake Basin, with 160.31 km2 of forests and 45.38 km2 of wetlands converted to cropland, respectively, during the period from 1990 to 2020. This change destroys the original ecosystem and exacerbates the risk of agricultural surface pollution. The increase in arable land will lead to the fact that nutrients such as nitrogen and phosphorus and a small amount of organic matter in agricultural soils will be carried into water bodies, which may lead to eutrophication and the formation of water contamination.
Given the profound impact of land-use and land-cover changes on water quality and considering that climate factors are also critical determinants of water quality, this study selected representative land-use types (cropland, impervious surface, forest, and waterbody) and key climate indicators (annual average temperature and annual precipitation) as explanatory variables. Redundancy analysis (RDA) was conducted on five key water quality factors—EC, COD, TN, TP, and NH3-N—after excluding non-significant variables, using annual average values of these indicators. The results are shown in Figure 4. The cumulative explanation ratios for land use and climate change on the first and second axes of the water quality factors were 67.30% and 50.08%, respectively, indicating that land-use types and climate change have significant effects on water quality changes.
The concentrations of EC, TN, TP, and NH3-N in Xingkai Lake were positively correlated with the area of cropland, meaning that the larger the area of cropland, the higher the concentration of these substances, and they were negatively correlated with the area of forests, waterbodies, and impervious surfaces, meaning that an increase in forests, water bodies, and impervious surfaces would decrease the concentration of these substances. COD showed a weaker correlation with cropland, water bodies, annual precipitation, and average annual air temperature but a stronger correlation with impervious surfaces. The correlation suggests that an increase in impervious surfaces may lead to increased COD concentrations. As the cropland area in the watershed increased, the EC value of Xingkai Lake increased, along with the concentrations of TN, TP, and NH3-N. The EC value of the lake increased with the increased area of cultivated land in the watershed. This trend highlights the potential negative impact of agricultural activities on lake water quality. In contrast, the increase in forested, impervious surface areas in the catchment helped reduce these substances’ concentrations.
The data show that EC, TN, and TP were negatively correlated with annual precipitation and annual mean temperature in the Xingkai Lake Basin. At the same time, NH3-N was also negatively correlated with annual precipitation. This indicates that the concentration of these pollutants decreases when the annual precipitation increases; similarly, an increase in the annual average temperature leads to a decrease in the concentration of EC, TN, and TP. The annual precipitation in the Xingkai Lake Basin exhibits an increasing trend, while the average yearly temperature also displays a fluctuating, rising pattern. These changes in meteorological conditions will help to reduce the concentrations of EC, TN, TP, and NH3-N in the water body, thus positively affecting the improvement of the water environment of Xingkai Lake.

4. Discussion

4.1. Characterization of Water Quality Trends and Sediment Contamination

The gradual improvement in water quality may also be related to implementing relevant protection policies in the Xingkai Lake Basin. Beginning in late 2011, the enforcement of the “Heilongjiang Xingkai Lake National Nature Reserve Water Environmental Protection Regulations” explicitly stipulated that within 1 km of the surrounding farmland of the Xiao Xingkai Lake, the promotion of organic bio-fertilizers and the prohibition of the use of pesticides and chemical fertilizers were mandated. Additionally, arable land within 300 m of the north shore of Xingkai Lake was designated for fallow and wetland restoration to rehabilitate the degraded lakeshore wetland pollution zones. Furthermore, the discharge of untreated or incompletely treated industrial wastewater and sewage into the surrounding rivers, drains, or water bubbles of Xingkai Lake was prohibited [70]. These measures were instrumental in protecting the water environment of Xingkai Lake, resulting in a downward trend in the water quality index (WQI) of Xingkai Lake. The M-K analysis indicates a significant decrease in the WQI in May, and the TN content showed a general decline, further suggesting that the water quality of Xingkai Lake is gradually improving. Furthermore, although the EC value of the water body of Xingkai Lake showed a decreasing trend, its content consistently exceeded Grade IV water standards. There was a rebound in 2017 and 2018, which became one of the factors contributing to the increase in the pollution index of Xingkai Lake during that period. EC, as an indicator of the accumulation of dissolved salts and other conductive substances [71], not only reflects the salinity trend in the water body but may also signal the presence of different environmental issues in the lake.
The high level of TN in the sediments of Xingkai Lake has reached a state of moderate pollution according to the U.S. Environmental Protection Agency (U.S. EPA) Sediment Pollution Evaluation Criteria [72], which may cause toxic effects on the ecosystem. High TN in sediments may be another source of nitrogen contamination in water bodies. When the external conditions at the sediment–water interface change, nutrients such as nitrogen and phosphorus in the sediments will be re-released into the overlying water body [73,74], especially in shallow lakes, where water–sediment interactions are more prevalent, and the risk of such endogenous contamination is consequently increased [75]. Elemental enrichment characteristics are generally controlled by various factors, such as the natural environment and soil-forming matrices, resulting in varying environmental background concentrations of various elements in different regions [76]. It should be noted that high background values do not necessarily mean pollution and need to be combined with the specific environment and actual measurements for a comprehensive assessment [77]. Cr, Cd, Hg, and Ni in the sediments of Xingkai Lake have exceeded the environmental background values of the Northeast Plains, of which the Igeo values of Cr, Cd, and Hg are all greater than 0, indicating the presence of pollution. Although the average content of Pb has stayed within the background value, its maximum concentration must be addressed. After comprehensive analysis, it was classified in the uncontaminated to moderately contaminated group. It has been shown that Cr, Pb, and Hg have similar sources or transmission pathways and are closely related to wastewater discharges from mineral development processes, oil refining, and electroplating activities [23]. In contrast, the sources of Cr are more diverse, including the weathering of carbonate rocks into soils and the use of pesticides and fertilizers [78]. When production occurs, these heavy metal elements may be released into the environment [79], thus causing ecological hazards.

4.2. Water Quality Changes in Response to Climate Change and Human Activities

Lakes are facing severe pressure on water quality due to the dual impact of climate change and human activities. Climate change significantly affects the eutrophication process in water [80]. Precipitation not only regulates the transport of pollutants and nutrients in the water column but also indirectly contributes to lake water quality by changing the dynamics of the water column [81]. Based on the RDA results, precipitation was negatively correlated with the water quality factors of Xingkai Lake, indicating that precipitation can prevent the increase in pollutants in the lake water body and positively affect the lake water quality. In the context of changing climate patterns, the water level of Xingkai Lake shows a fluctuating upward trend [82,83], and the high water level also dilutes the effect on nutrients [84]. However, excessive precipitation can lead to the resuspension of sediments or the influx of large amounts of sediment into surface waters, deteriorating water quality [85]. Thus, changes in precipitation affect the degree of flushing and dilution of surface pollutants as well as the inputs of nutrients and sediments, which in turn influence the rate and extent of non-point source pollution in lakes. The effects of temperature on aquatic ecosystems are complex and multifaceted, particularly in enclosed or semi-enclosed water bodies like lakes. Due to rising air temperatures, lake water temperatures are increasing, leading to changes in the mixing state of the lake [86], which in turn affects the rates of biochemical reactions and the ecosystem, causing variations in water quality parameters. According to the results of the redundancy analysis, the air temperature of Xingkai Lake showed a negative correlation with the water quality factors (EC, TN, and TP), indicating that the concentration of these contaminants decreases when the temperature increases. However, this does not indicate that warmer temperatures will improve lake water quality overall [87]. Other studies have shown that increased temperature promotes phosphorus release from lake-bottom sediments, ultimately leading to increased phosphorus concentration in the water [88]. Higher temperatures can stimulate the growth and reproduction of algae [89], leading to high nitrogen consumption and, consequently, a decrease in nitrogen concentration [90].
In addition to climate change, human activities are another critical factor affecting the lake’s water quality, especially agricultural non-point source pollution, which has become the primary factor in surface water eutrophication and ecosystem degradation in China [91]. Different land-use types have different impacts on the water quality of the lake. From 1990 to 2020, a large amount of forested land and wetlands in the Xingkai Lake Basin were converted to cropland due to the continuous expansion of agricultural land. Research has indicated that the cropland in the Xingkai Lake Basin has a negative effect on the water quality of the rivers entering the lake, while the forest improves the water quality of the rivers entering the lake. The waterbody of the Xingkai Lake Basin is extensive, and the waterbody also plays a positive role in the water quality of the rivers entering the lake [92]. Increasing the cropland area means a rise in the use of fertilizers, pesticides, and herbicides, which leads to an increased nutrient load in the lake, promotes excessive algal growth, and subsequently affects the lake’s water quality [93]. Forests increase rainwater infiltration, intercept surface runoff, and absorb pollutants, positively improving water quality [94]. Increasing water bodies enhances the purification and dilution of contaminants, improving lake water quality [95]. In addition, not only does agricultural non-point source pollution affect lake water quality, but urban expansion, mineral resource development, and tourism activities can seriously impact lake water quality as well. Urban sprawl alters the underlying surface type, increasing surface runoff and resulting in more nitrogen and phosphorus pollutants entering waterbodies [96]. Mineral resource development processes may result in the deposition of heavy metals into sediments [97]. Tourism activities generate large quantities of wastewater and solid waste, which may enter lakes if not appropriately treated.

4.3. Water Environmental Management Recommendations

Based on the results of the water quality index and the improved geo-accumulation index, the water quality composite index of Xingkai Lake and most water quality indicators have demonstrated a trend of gradual improvement. However, there exist a few indicators that exhibit a rebound phenomenon. Under more stringent evaluation methods, some heavy metals have shown signs of contamination. In addition, the high nitrogen level in the sediments may be another source of nitrogen pollution in the water body of Xingkai Lake. As Xingkai Lake is a transboundary water body, management authorities must reinforce protective measures to ensure its water environment’s sustained security and integrity. In light of the findings mentioned above, we propose the following recommendations to optimize the water quality management of Xingkai Lake:
First, the discharge of industrial, agricultural, and municipal sewage should be strictly regulated to reduce the inflow of exogenous nutrients and other harmful substances into Xingkai Lake. Regular inspections and maintenance of the established buffer zones will ensure their function and effectiveness. Strengthened monitoring and treatment measures for heavy metal pollution will prevent it from causing long-term negative impacts on the lake’s ecosystem. At the same time, the water quality monitoring of Xingkai Lake should be strengthened during the peak period of agricultural and tourism activities (May to October) and public education actively carried out to raise awareness of the importance of the ecosystem of Xingkai Lake and its cultural value among all sectors of society.
Second, strict restriction of the ecological red line area and active implementation of the policy measures of returning farmland to forests and wetlands will reduce the excessive input of nutrients and other harmful substances carried by surface runoff due to the increase in precipitation to protect the safety of the water quality of Xingkai Lake. At the same time, a water temperature monitoring system should be established to strengthen the monitoring and management of the growth of harmful algae in the lake and to promote vertical mixing of the water body through artificial mixing or the use of an aeration system to improve dissolved oxygen levels. In addition, combined with meteorological data and basin characteristics, the water temperature monitoring and prediction model should be continuously optimized to improve the accuracy and timeliness of the prediction to better cope with emergencies such as early spring flooding and ensure the water quality safety and ecological balance of Xingkai Lake.
Third, the Chinese and Russian governments must cooperate further on transboundary water resource management and establish a unified evaluation system for water quality monitoring, water allocation, ecological protection, and regular data sharing and information exchange to ensure the sustainable use and protection of water resources. In addition, the two sides should strengthen the docking and coordination of laws and regulations to ensure the consistency and effectiveness of the legal framework and enforcement mechanisms for cross-border water resources management.

5. Conclusions

This study integrated the water quality data of Xingkai Lake over the past 30 years. Incorporating human activities and climate change factors, it systematically analyzed the trends and driving forces of water quality changes in Xingkai Lake. The overall status of water quality and heavy metal contamination in Xingkai Lake was assessed using the water quality index and the improved geo-accumulation index method, and the relationship between each water quality indicator and climate change and human activities was analyzed using the RDA. The overall water quality of Xingkai Lake improved as a whole, and the concentrations of most water quality indicators showed a decreasing trend. Protective measures such as banning pesticides and chemical fertilizers and designating ecological protection zones have effectively reduced contaminant discharges. The analysis in this study was based on data obtained from the literature, which reduces the comparability of the data due to the differences between the measures. To improve the accuracy and comprehensiveness of future studies, it is vital to incorporate more comprehensive and diverse empirical data. With climate warming and increased human activities, similar transboundary shallow lakes may face water quality degradation, eutrophication, and transboundary pollution. Therefore, relevant government departments must conduct unified testing and analysis and develop consistent management strategies to address these challenges more effectively.

Supplementary Materials

The following are available online at https://www.mdpi.com/article/10.3390/w16213080/s1, Table S1: Supplementary measurements of water pollution in Lake Xingkai; Table S2. Supplementary measurements of sediment pollution measurements for Xingkai Lake; Table S3. Relative weights and standard values for each water quality factor.

Author Contributions

Conceptualization, P.W.; methodology, D.C.; data curation, Y.W. and D.C.; formal analysis, Y.W.; investigation, Y.W.; resources, P.W. and F.L.; writing—original draft preparation, Y.W., D.C., P.W. and R.W.; writing—review and editing, Y.L., P.W., V.V.S., C.D. and A.-X.Z.; visualization, Y.W.; supervision, P.W. and C.D.; project administration, P.W. and F.L.; funding acquisition, P.W. and F.L. All authors have read and agreed to the published version of the manuscript.

Funding

This research was funded by the National Key Research and Development Program of China—Science & Technology Cooperation Project of Chinese and Russian Government “Sustainable Transboundary Nature Management and Green Development Modes in the context of Emerging Economic Corridors and Biodiversity Conservation Priorities in the South of the Russian Far East and Northeast China (No. 2023YFE0111300)”.

Data Availability Statement

No new data were created or analyzed in this study. Data sharing is not applicable to this article.

Acknowledgments

Vladimir V. Shamov is grateful for support by the Chinese Academy of Sciences President’s International Fellowship Initiative (2024PVB0028).

Conflicts of Interest

The authors declare no conflict of interest.

References

  1. Yao, F.F.; Livneh, B.; Rajagopalan, B.; Wang, J.D.; Crétaux, J.F.; Wada, Y.; Berge-Nguyen, M. Satellites reveal widespread decline in global lake water storage. Science 2023, 380, 743–749. [Google Scholar] [CrossRef] [PubMed]
  2. Lin, Q.; Zhang, K.; McGowan, S.; Capo, E.; Shen, J. Synergistic impacts of nutrient enrichment and climate change on long-term water quality and ecological dynamics in contrasting shallow-lake zones. Limnol. Oceanogr. 2021, 66, 3271–3286. [Google Scholar] [CrossRef]
  3. Marszelewski, W.; Jokiel, P.; Pius, B.; Tomalski, P. River thermal seasons in the Central European Plain and their changes during climate warming. J. Hydrol. 2022, 610, 127945. [Google Scholar] [CrossRef]
  4. Zaqout, T.; Andradóttir, H.O. Impacts of climate change on winter flood mechanisms: Spatial variability, trends, and bivariate frequency of rain-on-snow and soil frost. J. Hydrol. 2024, 638, 131439. [Google Scholar] [CrossRef]
  5. Wang, Q.H.; Li, Y.; Liu, L.; Cui, S.Z.; Liu, X.; Chen, F.Z.; Jeppessen, E. Human impact on current environmental state in Chinese lakes. J. Environ. Sci. 2023, 126, 297–307. [Google Scholar] [CrossRef]
  6. Shear, H.; Stadler-Salt, N.; Bertram, P.E.; Horvatin, P.J. The Development and Implementation of Indicators of Ecosystem Health in the Great Lakes Basin. Environ. Monit. Assess. 2003, 88, 119–151. [Google Scholar] [CrossRef]
  7. Amorim, C.A.; Moura, A.D. Ecological impacts of freshwater algal blooms on water quality, plankton biodiversity, structure, and ecosystem functioning. Sci. Total Environ. 2021, 758, 143605. [Google Scholar] [CrossRef]
  8. Gotama, R.; Baker, D.M.; Guibert, I.; Mcilroy, S.E.; Russell, B.D. How a coastal megacity affects marine biodiversity and ecosystem function: Impacts of reduced water quality and other anthropogenic stressors. Ecol. Indic. 2024, 160, 111683. [Google Scholar] [CrossRef]
  9. Liu, Z.J.; Wang, X.H.; Jia, S.Q.; Mao, B.Y. Multi-methods to investigate spatiotemporal variations of nitrogen-nitrate and its risks to human health in China’s largest fresh water lake (Poyang Lake). Sci. Total Environ. 2023, 863, 160975. [Google Scholar] [CrossRef]
  10. Hou, X.J.; Feng, L.; Dai, Y.H.; Hu, C.A.M.; Gibson, L.; Tang, J.; Lee, Z.P.; Wang, Y.; Cai, X.B.; Liu, J.G.; et al. Global mapping reveals increase in lacustrine algal blooms over the past decade. Nat. Geosci. 2022, 15, 130–134. [Google Scholar] [CrossRef]
  11. Wang, C.-y.; Zhou, B.; Huang, B. A continuing 30-year decline in water quality of Jiaojiang Estuary, China. Water Sci. Eng. 2015, 8, 20–29. [Google Scholar] [CrossRef]
  12. Rajan, D.K.; Mohan, K.; Rajarajeswaran, J.; Divya, D.; Thanigaivel, S.; Zhang, S.B. Toxic effects of organophosphate pesticide monocrotophos in aquatic organisms: A review of challenges, regulations and future perspectives. Environ. Res. 2024, 244, 117947. [Google Scholar] [CrossRef] [PubMed]
  13. Damseth, S.; Thakur, K.; Kumar, R.; Kumar, S.; Mahajan, D.; Kumari, H.; Sharma, D.; Sharma, A.K. Assessing the impacts of river bed mining on aquatic ecosystems: A critical review of effects on water quality and biodiversity. HydroResearch 2024, 7, 122–130. [Google Scholar] [CrossRef]
  14. Huang, Y.N.; Li, Y.P.; Ji, D.B.; Nwankwegu, A.S.; Lai, Q.Y.; Yang, Z.J.; Wang, K.; Wei, J.; Norgbey, E. Study on nutrient limitation of phytoplankton growth in Xiangxi Bay of the Three Gorges Reservoir, China. Sci. Total Environ. 2020, 723, 138062. [Google Scholar] [CrossRef]
  15. Dippong, T.; Resz, M.A.; Tanaselia, C.; Cadar, O. Assessing microbiological and heavy metal pollution in surface waters associated with potential human health risk assessment at fish ingestion exposure. J. Hazard. Mater. 2024, 476, 135187. [Google Scholar] [CrossRef]
  16. He, X.; Han, W.; Chen, Q.; Zhang, Z.; Liu, C.; Zhang, Y.; Liu, Z.; Han, C.; Yao, Z.; Chen, K. Internal loading regulates the phosphorus concentration in a diversion input shallow lake in the semi-humid region of North China: Differentiated processes in littoral wetland and open water areas. Water Res. 2024, 257, 121680. [Google Scholar] [CrossRef]
  17. Zhou, J.; Leavitt, P.R.; Zhang, Y.; Qin, B. Anthropogenic eutrophication of shallow lakes: Is it occasional? Water Res. 2022, 221, 118728. [Google Scholar] [CrossRef]
  18. Ma, C.X.; Mwagona, P.C.; Yu, H.X.; Sun, X.W.; Liang, L.Q.; Mahboob, S.; Al-Ghanim, K.A. Seasonal dynamics of zooplankton functional group and its relationship with physico-chemical variables in high turbid nutrient-rich Small Xingkai Wetland Lake, Northeast China. J. Freshw. Ecol. 2019, 34, 65–79. [Google Scholar] [CrossRef]
  19. Xia, K.; Wu, T.X.; Li, X.T.; Wang, S.D.; Shen, Q. A new method for accurate inversion of Forel-Ule index using MODIS images—Revealing the water color evolution in China’s large lakes and reservoirs over the past two decades. Water Res. 2024, 255, 121560. [Google Scholar] [CrossRef]
  20. Yuan, Y.X.; Jiang, M.; Liu, X.T.; Yu, H.X.; Otte, M.L.; Ma, C.X.; Her, Y.G. Environmental variables influencing phytoplankton communities in hydrologically connected aquatic habitats in the Lake Xingkai basin. Ecol. Indic. 2018, 91, 1–12. [Google Scholar] [CrossRef]
  21. Yuan, Y.X.; Jiang, M.; Zhu, X.Y.; Yu, H.X.; Otte, M.L. Interactions between Fe and light strongly affect phytoplankton communities in a eutrophic lake. Ecol. Indic. 2021, 126, 107664. [Google Scholar] [CrossRef]
  22. Yu, S.L.; Li, X.Y.; Wen, B.L.; Chen, G.S.; Hartleyc, A.; Jiang, M.; Li, X.J. Characterization of Water Quality in Xiao Xingkai Lake: Implications for Trophic Status and Management. Chin. Geogr. Sci. 2021, 31, 558–570. [Google Scholar] [CrossRef]
  23. Jiang, M.Y.; Wang, Q.C.; Tian, X.; Zhu, X.Y.; Dong, X.Q.; Wu, Z.; Yuan, Y.X. Spatiotemporal variation and ecological risk assessment of sediment heavy metals in two hydrologically connected lakes. Front. Ecol. Evol. 2022, 10, 1005194. [Google Scholar] [CrossRef]
  24. Lu, Y.Z.; Zou, Y.C.; Zhao, Z.C.; Zhang, T. A dataset of water physical and chemical properties in Xingkai Lake from 2011 to 2018. China Sci. Data 2023, 8, 196–203, (In Chinese with English abstract). [Google Scholar] [CrossRef]
  25. Ma, Y.Y. Effects of Flood Discharge on Physicochemical Properties and NitrogenTransformation of Lake Xingkai. Master’s Thesis, Northeast Agricultural University, Harbin, China, 2018. (In Chinese with English abstract). [Google Scholar]
  26. Yuan, Y.X. Phytoplankton Community Structure and Analysis of Correlations with Environmental Factors in Xiaoxingkai Lake. Master’s Thesis, Northeastern Forestry University, Harbin, China, 2013. (In Chinese with English abstract). [Google Scholar]
  27. Mao, Y.M.; Wang, Y.F.; Xu, Q.G.; Wei, Z.M.; Xuan, P.L.; Zhang, L.; Zhao, Y. Temporal and spatial distribution of bacteria in XingKai Lake. J. Northeast. Agric. Univ. 2013, 44, 56–60, (In Chinese with English abstract). [Google Scholar] [CrossRef]
  28. Yu, D.H.; Jin, X.C. Study on Lake Eutrophication and Its Countermeasure in China; China Environmental Science Press: Beijing, China, 2001; p. 210. (In Chinese) [Google Scholar]
  29. Piao, D.X.; Wang, F.K. Environmental conditions and the protection countermeasures for waters of Lake Xingkai. J. Lake Sci. 2011, 23, 196–202, (In Chinese with English abstract). [Google Scholar]
  30. Zhao, C.X.; Yao, W.D. Investigation and analysis of changes in water quality status of fisheries in Xingkai Lake. North. Chin. Fish. 2009, 25–28. (In Chinese) [Google Scholar]
  31. Lu, L.; Dong, C.Z.; Zhao, C.X.; Liu, Y.; Zhan, P.R. Physico-chemical characteristics of different waters in Heilongjiang system. J. Fish. China 2003, 364–370, (In Chinese with English abstract). [Google Scholar]
  32. Lu, L.; Liu, Y.; Zhao, C.X.; Dong, C.Z.; Zhan, P.R. Water quality and evaluation of fishery waters of Heilongjiang. Chin. J. Fish. 2002, 69–73, (In Chinese with English abstract). [Google Scholar]
  33. Lu, L.; Zhao, C.X.; Chen, Z.X.; Wang, H.T.; Zhan, P.R. Analysis of Nitrogen and Phosphorus Contents and Assessment on Potential Eutrophication of Water in Xinkai Lake. Heilongjiang Sci. 2011, 2, 1–3, (In Chinese with English abstract). [Google Scholar]
  34. Ma, C.X.; Bian, S.W.; Yu, H.X.; Qu, C. Correlation Between Phytoplankton Abundance and Environmental Factors in Xingkai Lake. J. Northeast. For. Univ. 2012, 40, 78–80, (In Chinese with English abstract). [Google Scholar] [CrossRef]
  35. Qu, C. Biodiversity and Community of Phytoplankton in Xingkai Lake. Master’s Thesis, Northeastern Forestry University, Harbin, China, 2009. (In Chinese with English abstract). [Google Scholar]
  36. Wang, C. Community Structure of Metazoan Zooplankton in Xingkai Lake. Master’s Thesis, Northeastern Forestry University, Harbin, China, 2009. (In Chinese with English abstract). [Google Scholar]
  37. Ji, X.Y.; Liu, T.L.; Liu, J.; Li, J.M.; Pan, F.Q. Investigation and Study on Water Quality and Pollution Condition in Lake Xingkai of China. Environ. Monit. China 2013, 29, 79–84, (In Chinese with English abstract). [Google Scholar] [CrossRef]
  38. Yu, S.L.; Li, X.J.; Li, X.Y.; Wen, B.L. Evaluation of Water Quality of Xiaoxingkai Lake. Wetl. Sci. 2013, 11, 466–469, (In Chinese with English abstract). [Google Scholar] [CrossRef]
  39. Feng, Y.M. Zooplankton Community Structure and Analysis of Correlations with Environmental Factors in Xiaoxingkai Lake. Master’s Thesis, Northeastern Forestry University, Harbin, China, 2014. (In Chinese with English abstract). [Google Scholar]
  40. Ju, Y.F. Biodiversity of Aquatic Organisms and Ecosystem Health Assessment of Xiaoxingkai Lake. Ph.D. Thesis, Northeastern Forestry University, Harbin, China, 2018. (In Chinese with English abstract). [Google Scholar]
  41. Yu, S.S. The Water Quality Change and Driving Force Analysis in Xiaoxingkai Lake. Master’s Thesis, University of Chinese Academy of Sciences, Beijing, China, 2015. (In Chinese with English abstract). [Google Scholar]
  42. Yu, S.S.; Jiang, M.; Yuan, Y.X. Spatial Heterogeneity of Water Quality in Xiaoxingkai Lake. Wetl. Sci. 2015, 13, 166–170, (In Chinese with English abstract). [Google Scholar] [CrossRef]
  43. Yu, S.L.; Li, X.Y.; Zhang, J.T.; Chen, G.S.; Li, X.J. Phsophorus sorption capacity of surface sediments and risk assessment of potential phosphorus release in Lake Xiaoxingkai, China. China Environ. Sci. 2014, 34, 2078–2085, (In Chinese with English abstract). [Google Scholar]
  44. Yu, S.L. The Research on Phosphorus Release Characteristics of Surficial Sediment and Its Effects on Eutrophication in Lake Xiaoxingkai, China. Master’s Thesis, University of Chinese Academy of Sciences, Beijing, China, 2014. (In Chinese with English abstract). [Google Scholar]
  45. Yu, S.L.; Li, X.J.; Chen, G.S.; Zhang, J.T.; Yang, Y.L.; Yan, Y.; Lu, X.R.; Zhang, C.Y. Analysis of Eutrophication and Terrestrialization of Xiaoxingkai Lake. Wetl. Sci. 2016, 14, 271–275, (In Chinese with English abstract). [Google Scholar] [CrossRef]
  46. Jiang, M. Zooplankton Community Structure and Analysis of Correlations with Environmental Factors in Daxiaoxingkai Lake. Master’s Thesis, Northeastern Forestry University, Harbin, China, 2015. (In Chinese with English abstract). [Google Scholar]
  47. An, R. Characteristics and Environmental Effect of Plankton Functional Groups in Sanjiang Plate Wetland. Ph.D. Thesis, Northeastern Forestry University, Harbin, China, 2016. (In Chinese with English abstract). [Google Scholar]
  48. Yuan, Y.X.; Tian, X.; Jiang, M. Structure of Phytoplankton Community in Xiaoxingkai Lake in July 2014 and Its Influence Factors. Wetl. Sci. 2017, 15, 221–228, (In Chinese with English abstract). [Google Scholar] [CrossRef]
  49. Zhu, L.J.; Zhou, H.X.; Xie, X.Y.; Li, X.K.; Zhang, D.Y.; Jia, L.M.; Wei, Q.B.; Zhao, Y.; Wei, Z.M.; Ma, Y.Y. Effects of floodgates operation on nitrogen transformation in a lake based on structural equation modeling analysis. Sci. Total Environ. 2018, 631–632, 1311–1320. [Google Scholar] [CrossRef]
  50. Zhang, L.L. Effect of Artificial Aeration on Carbon and Phosphorus in Glyceria spiculosa Wetland of Xiaoxingkaihu Lake by Inputting Different Iron Dosage. Master’s Thesis, University of Chinese Academy of Sciences, Beijing, China, 2017. (In Chinese with English abstract). [Google Scholar]
  51. Jia, X.Y.; Tian, Z.J.; Zhang, D.J.; Jiang, M.; Wang, L.H. Effect of iron-rich farmland drainage on phosphorus adsorption and release in sediments of Xiaoxingkai Lake. Chin. J. Ecol. 2022, 41, 1128–1134, (In Chinese with English abstract). [Google Scholar] [CrossRef]
  52. Jia, X.Y.; Tian, Z.J.; Zhang, D.J.; Jiang, M. Physical and Chemical Characteristic and Phosphorus Adsorption Efficiency of Surface Sediment in Xiaoxingkai Lake. Wetl. Sci. 2021, 19, 577–584, (In Chinese with English abstract). [Google Scholar] [CrossRef]
  53. Xu, S.Q.; Li, S.J.; Tao, Z.; Song, K.S.; Wen, Z.D.; Li, Y.; Chen, F.F. Remote Sensing of Chlorophyll-a in Xinkai Lake Using Machine Learning and GF-6 WFV Images. Remote Sen. 2022, 14, 5136. [Google Scholar] [CrossRef]
  54. Jiang, M.Y. Spatial and Temporal Characteristics and Drivers of Phytoplankton Community Structure During Ice-Covered Period in Xingkai Lake. Master’s Thesis, Changchun Normal University, Changchun, China, 2023. (In Chinese with English abstract). [Google Scholar]
  55. Wang, Y.; Xie, Z.J.; Sun, D.X.; Li, C.H.; Ye, C.; Wang, W.Q.; Wei, W.W.; Wang, H. Phosphorus morphology characteristics and its response to climate change in Xingkai Lake. J. Environ. Eng. Technol. 2023, 13, 1965–1975, (In Chinese with English abstract). [Google Scholar]
  56. Guo, W.; Huo, S.L.; Xi, B.D.; Zhang, J.T.; Wu, F.C. Heavy metal contamination in sediments from typical lakes in the five geographic regions of China: Distribution, bioavailability, and risk. Ecol. Eng. 2015, 81, 243–255. [Google Scholar] [CrossRef]
  57. Jia, X.Y. Effects of Iron Input on Phosphorus Adsorption of Wetlands—Sediment System in Xiaoxingkai Lake. Ph.D. Thesis, University of Chinese Academy of Sciences, Beijing, China, 2019. (In Chinese with English abstract). [Google Scholar]
  58. Sun, D.X.; Xie, Z.J.; Wang, Y.; Ye, C.; Li, C.H.; Wei, W.W.; Wang, H.; Zheng, X.Y. Distribution characteristics and source analysis of nutrients in sediments of Xingkai Lake. J. Environ. Eng. Technol. 2023, 13, 1976–1986, (In Chinese with English abstract). [Google Scholar]
  59. Xie, Z.J.; Zhao, R.B.; Wang, Y.; Wang, H.; Li, C.H.; Yu, Z.L.; Ye, C. Distribution characteristics and source analysis of nutrients in sediments of Xingkai Lake. J. Environ. Eng. Technol. 2023, 13, 1987–1996, (In Chinese with English abstract). [Google Scholar]
  60. Yang, J.; Huang, X. The 30 m annual land cover dataset and its dynamics in China from 1990 to 2019. Earth Syst. Sci. Data 2021, 13, 3907–3925. [Google Scholar] [CrossRef]
  61. Uddin, M.G.; Nash, S.; Olbert, A.I. A review of water quality index models and their use for assessing surface water quality. Ecol. Indic. 2021, 122, 107218. [Google Scholar] [CrossRef]
  62. Wu, T.; Wang, S.R.; Su, B.L.; Wu, H.X.; Wang, G.Q. Understanding the water quality change of the Yilong Lake based on comprehensive assessment methods. Ecol. Indic. 2021, 126, 107714. [Google Scholar] [CrossRef]
  63. Sang, C.; Tan, L.; Cai, Q.H.; Ye, L. Long-term (2003–2021) evolution trend of water quality in the Three Gorges Reservoir: An evaluation based on an enhanced water quality index. Sci. Total Environ. 2024, 915, 169819. [Google Scholar] [CrossRef]
  64. Yang, J.Y.; Ren, L.J.; Hua, C.Y.; Tian, Y.R.; Yong, X.; Fang, S.M. Identification of toxic metal contamination in surface sediments of the Xiaoqing River under a long-term perspective (1996–2020): Risks, sources and driving factors. Environ. Res. 2024, 251, 118613. [Google Scholar] [CrossRef]
  65. Santos-Francés, F.; Martínez-Graña, A.; Zarza, C.A.; Sánchez, A.G.; Rojo, P.A. Spatial Distribution of Heavy Metals and the Environmental Quality of Soil in the Northern Plateau of Spain by Geostatistical Methods. Int. J. Environ. Res. Public Health 2017, 14, 568. [Google Scholar] [CrossRef] [PubMed]
  66. Men, C.; Liu, R.M.; Xu, L.B.; Wang, Q.R.; Guo, L.J.; Miao, Y.X.; Shen, Z.Y. Source-specific ecological risk analysis and critical source identification of heavy metals in road dust in Beijing, China. J. Hazard. Mater. 2020, 388, 121763. [Google Scholar] [CrossRef] [PubMed]
  67. Zhang, Z.H.; Dai, H.M.; Wei, M.H.; Zhao, J.; Song, Y.H.; Liang, S. Soil geochemical baseline values and background values in Xunke Plain of HeiLongJiang Province. Geol. Bull. China 2024, 43, 1–15, (In Chinese with English abstract). [Google Scholar]
  68. Torres, R.A.C.; Wang, J.L.; Zhang, J.P.; Liu, L.F.; Lan, Y.C. Temporal analysis of land degradation and urban expansion in central Yunnan Province using remote sensing for supporting sustainable development goals 11/15. Ecol. Indic. 2024, 163, 112058. [Google Scholar] [CrossRef]
  69. Sims, N.C.; Newnham, G.J.; England, J.R.; Guerschman, J.; Cox, S.J.D.; Roxburgh, S.H. Good Practice Guidance. SDG Indicator 15.3.1, Proportion of Land That Is Degraded over Total Land Area. Version 2.0.; United Nations Convention to Combat Desertification (UNCCD): Bonn, Germany, 2021. [Google Scholar]
  70. Jixi Government. Regulations on Water Environment Protection in Heilongjiang Xingkai Lake National Nature Reserve. In Jixi Daily; 2011. Available online: https://baike.baidu.com/item/%E9%BB%91%E9%BE%99%E6%B1%9F%E5%85%B4%E5%87%AF%E6%B9%96%E5%9B%BD%E5%AE%B6%E7%BA%A7%E8%87%AA%E7%84%B6%E4%BF%9D%E6%8A%A4%E5%8C%BA%E6%B0%B4%E7%8E%AF%E5%A2%83%E4%BF%9D%E6%8A%A4%E8%A7%84%E5%AE%9A/4285417 (accessed on 2 September 2024). (In Chinese)
  71. Dippong, T.; Resz, M.A. Heavy metal contamination assessment and potential human health risk of water quality of lakes situated in the protected area of Tisa, Romania. Heliyon 2024, 10, e28860. [Google Scholar] [CrossRef]
  72. Cieniawski, S.; Macdonald, D.D.; Ingersoll, C.G. A Guidance Manual to Support the Assessment of Contaminated Sediments in Freshwater Ecosystems; United States Environmental Protection Agency, Great Lakes National Program Office: Chicago, IL, USA, 2002. [Google Scholar]
  73. Liu, C.; Du, Y.H.; Yin, H.B.; Fan, C.X.; Chen, K.N.; Zhong, J.C.; Gu, X.Z. Exchanges of nitrogen and phosphorus across the sediment-water interface influenced by the external suspended particulate matter and the residual matter after dredging. Environ. Pollut. 2019, 246, 207–216. [Google Scholar] [CrossRef]
  74. Zhou, N.; Zhang, G.L.; Liu, S.M. Nutrient exchanges at the sediment-water interface and the responses to environmental changes in the Yellow Sea and East China Sea. Mar. Pollut. Bull. 2022, 176, 113420. [Google Scholar] [CrossRef]
  75. Qin, B.; Zhang, Y.; Zhu, G.; Gao, G. Eutrophication control of large shallow lakes in China. Sci. Total Environ. 2023, 881, 163494. [Google Scholar] [CrossRef]
  76. Hou, Q.Y.; Yang, Z.F.; Yu, T.; You, Y.H.; Dou, L.; Li, K. Impacts of parent material on distributions of potentially toxic elements in soils from Pearl River Delta in South China. Sci. Rep. 2020, 10, 17394. [Google Scholar] [CrossRef]
  77. Ma, Y.; Li, Y.; Fang, T.T.; He, Y.H.; Wang, J.; Liu, X.Y.; Wang, Z.Y.; Guo, G.L. Analysis of driving factors of spatial distribution of heavy metals in soil of non-ferrous metal smelting sites: Screening the geodetector calculation results combined with correlation analysis. J. Hazard. Mater. 2023, 445, 130614. [Google Scholar] [CrossRef]
  78. Xie, Z.J.; Zhao, R.B.; Wang, Y.; Wang, H.; Li, C.H.; Yu, Z.L.; Ye, C. Ecological risk assessment and pollution characteristic analysis of heavy metals in sediments of xingkai lake. J. Environ. Eng. Technol. 2023, 13, 1987–1996, (In Chinese with English abstract). [Google Scholar] [CrossRef]
  79. Onakpa, M.M.; Njan, A.A.; Kalu, O.C. A Review of Heavy Metal Contamination of Food Crops in Nigeria. Ann. Glob. Health 2018, 84, 488–494. [Google Scholar] [CrossRef] [PubMed]
  80. Sinha, E.; Michalak, A.M.; Balaji, V. Eutrophication will increase during the 21st century as a result of precipitation changes. Science 2017, 357, 405–408. [Google Scholar] [CrossRef] [PubMed]
  81. Puchlik, M.; Piekutin, J.; Dyczewska, K. Analysis of the Impact of Climate Change on Surface Water Quality in North-Eastern Poland. Energies 2022, 15, 164. [Google Scholar] [CrossRef]
  82. Speranskaya, N.A.; Fuksova, T.V. Long-term Changes in the Main Components of Lake Khanka Water Regime. Russ Meteorol Hydro+ 2018, 43, 530–538. [Google Scholar] [CrossRef]
  83. Xiao, F.Y.; Wang, X.M.; Fu, C.S. Impacts of land use/land cover and climate change on hydrological cycle in the Xiaoxingkai Lake Basin. J. Hydrol.-Reg. Stud. 2023, 47, 101422. [Google Scholar] [CrossRef]
  84. Geng, M.M.; Wang, K.L.; Yang, N.; Li, F.; Zou, Y.A.; Chen, X.S.; Deng, Z.M.; Xie, Y.H. Spatiotemporal water quality variations and their relationship with hydrological conditions in Dongting Lake after the operation of the Three Gorges Dam, China. J. Clean. Prod. 2021, 283, 124644. [Google Scholar] [CrossRef]
  85. Han, Y.L.; Bu, H.M. The impact of climate change on the water quality of Baiyangdian Lake (China) in the past 30 years (1991-2020). Sci. Total Environ. 2023, 870, 161957. [Google Scholar] [CrossRef]
  86. Woolway, R.I.; Merchant, C.J. Worldwide alteration of lake mixing regimes in response to climate change. Nat. Geosci. 2019, 12, 271–276. [Google Scholar] [CrossRef]
  87. Nakulopa, F.; Bärlund, I.; Borchardt, D. How a reservoir modulates downstream water quality under declining upstream loading and progressing climate change. Sci. Total Environ. 2024, 912, 169460. [Google Scholar] [CrossRef]
  88. Glavan, M.; Ceglar, A.; Pintar, M. Assessing the impacts of climate change on water quantity and quality modelling in small Slovenian Mediterranean catchment—Lesson for policy and decision makers. Hydrol. Process 2015, 29, 3124–3144. [Google Scholar] [CrossRef]
  89. Mei, X.Y.; Gao, S.S.; Liu, Y.; Hu, J.; Razlustkij, V.; Rudstam, L.G.; Jeppesen, E.; Liu, Z.W.; Zhang, X.F. Effects of Elevated Temperature on Resources Competition of Nutrient and Light Between Benthic and Planktonic Algae. Front. Env. Sci-Switz. 2022, 10, 908088. [Google Scholar] [CrossRef]
  90. Hien, H.N.; Hoang, B.H.; Huong, T.T.; Than, T.T.; Ha, P.T.T.; Toan, T.D.; Son, N.M. Study of the Climate Change Impacts on Water Quality in the Upstream Portion of the Cau River Basin, Vietnam. Environ. Model. Assess. 2016, 21, 261–277. [Google Scholar] [CrossRef]
  91. Sun, B.; Zhang, L.X.; Yang, L.Z.; Zhang, F.S.; Norse, D.; Zhu, Z.L. Agricultural Non-Point Source Pollution in China: Causes and Mitigation Measures. Ambio 2012, 41, 370–379. [Google Scholar] [CrossRef]
  92. Xu, Y.X.; Xie, Z.J.; Wang, H.; Li, C.H.; Li, J.; Wei, W.W.; Zheng, Y.; Ye, C. Effect of land use on the water quality of rivers flowing into xingkai lake and ecological restoration strategies. J. Environ. Eng. Technol. 2023, 13, 1997–2005. [Google Scholar] [CrossRef]
  93. Shah, S.T.; Sen, S.; Sahoo, D. State of Indian Northwestern Himalayan lakes under human and climate impacts: A review. Ecol. Indic. 2024, 160, 111858. [Google Scholar] [CrossRef]
  94. Tao, W.H.; Wang, Q.J.; Guo, L.; Lin, H.; Chen, X.P.; Sun, Y.; Ning, S.R. An enhanced rainfall-runoff model with coupled canopy interception. Hydrol. Process 2020, 34, 1837–1853. [Google Scholar] [CrossRef]
  95. Deng, X.J. Influence of water body area on water quality in the southern Jiangsu Plain, eastern China. J. Clean. Prod. 2020, 254, 120136. [Google Scholar] [CrossRef]
  96. Wang, R.J.; Liu, L.J.; Tao, Z.Z.; Wan, B.; Wang, Y.Y.; Tang, X.Y.; Li, Y.; Li, X.Y. Effect of urbanization and urban forests on water quality improvement in the Yangtze River Delta: A case study in Hangzhou, China. J. Environ. Manag. 2024, 351, 119980. [Google Scholar] [CrossRef]
  97. Ullah, S.; Liu, Q.L.; Wang, S.Y.; Jan, A.U.; Sharif, H.M.A.; Ditta, A.; Wang, G.; Cheng, H.F. Sources, impacts, factors affecting Cr uptake in plants, and mechanisms behind phytoremediation of Cr-contaminated soils. Sci. Total Environ. 2023, 899, 165726. [Google Scholar] [CrossRef]
Figure 1. Study area with water sampling points (Data from: [24,25,26,27]).
Water 16 03080 g001
Figure 2. Trends in major water quality factors.
Water 16 03080 g002
Figure 3. Proportional changes in land-use type conversion.
Water 16 03080 g003
Figure 4. RDA results: (a) the relationship between water quality factors and (cropland, forest, waterbody, and impervious surface); (b) the relationship between water quality factors and climate factors (temperature and precipitation).
Water 16 03080 g004
Table 1. Summary of water pollution measurements for Xingkai Lake.
NO.PeriodWT/°CpHEC/
μs/cm
NH3-N/
mg/L
COD/
mg/L
TN/
mg/L
TP/
mg/L
Chl-a/
μg/L
DO/
mg/L
Data from Reference
11985–1998 0.04–2.43 [28]
21994–1998 7.0–7.53 4.09, 4.730.09–2.650.01–0.07 [29]
31998-2007 7.05–7.81 8.89–10.32[30]
4May, Jul., and Sept. 2001217.3–7.8 0.003–1.794.25–7.310.09–2.65 7.3–7.8[31,32,33]
5May, Jul., and Sept. 200718.7–22.237.95–8.89120–215 1.8–162.28.05–11.61[34,35,36]
6May 2008 8.37–8.89130–160 8.05–10.75[34]
7Jan.–Feb., May–Jun, Aug., and Oct. 2010 7.42–7.97185–550 6.6–14.84[27]
82010 0.5–0.70.07–0.08 [37]
9Jan. and May–Sept. 2011 0.4–2.450.04–0.22 [26,37]
10Sept. 2012 6.9–9.62 0.14–0.70.16–44.480.49–8.350.01–0.386–1178.07–15.57[38]
112012–2014 5.86–9.6233.9–260.10.00–0.90.16–85.600.16–12.290.01–0.971.03–65.130.11–14.21[22]
12May and Jul.–Nov. 2013 6.19–9.420–2400.001–0.022.24–78.50.38–5.550.03–0.181.19–99.981.38–12.29[39,40,41,42,43,44,45]
13Apr., May, and Sept.–Dec. 2014 7.85–9.412500.01–0.8731.660.76–1.810.07–0.292.7–9.14.05–4.21[40,46,47,48]
142013–2014 8.17170 42.21.380.11 [20,21]
15Jul.–Sept. 201515.61–16.637.6–7.94 0.20–0.4618.34–20.70.63–2.3 3.45–5.427.1–9.16[25,49]
16Jul. 2016 8.12 7.94[50]
17May, Jul., Sept., and Oct. 2018 37.22–111.91.28–1.790.07–0.12 [51,52]
182011–201815.66–19.675.86–8.71315.34–763.20.01–2.641.6–93.350.26–4.470.01–1.07 [24]
19Oct. 2020 0.85–1.370.12–0.21.46–4.51 [53]
20Aug.–Nov. 202116.75–19.339.93–11.4136.1–257.20.05–0.193.47–5.720.34–9.660.04–0.360.81–346.448.79–10.99[23,54]
21Jan. and May 2022 61.31–270.290.001–0.242.94–5.750.18–3.460.03–0.23.28–380.412.81–18.35[54,55]
Table 2. Summary of sediment pollution measurements for Xingkai Lake.
NO.PeriodTN/
mg/kg
TP/
mg/kg
Mn/
mg/kg
Cr/
mg/kg
Ni/
mg/kg
Cu/
mg/kg
Zn/
mg/kg
As/
mg/kg
Cd/
mg/kg
Pb/
mg/kg
Hg/
mg/kg
Data from Reference
12011 65075.9523.3519.6560.35 0.1421.63 [56]
2Jul. 2013188.73–3224.79181.02–805.73 [43,44]
3Sept. 2016 84.76–1421.79330 [57]
4Sept. 2018 84.76–1305 [51]
5Jul. 2021210.30–4718.4114.41–1272.23 28.6–73.811.6–32.99–29.117–59.72.9–13.20.08–0.214.2–22.80.01–0.13[58,59]
6Jan., May, Jul., and Sept. 2021256.5–12361142.9–1989 28.58–262.3 3.12–28.0518.21–90.732.58–14.350.05–0.2110.87–58.850.003–0.14[23]
Table 3. Ranges, means, coefficients of variation, and relative weights of water quality factors.
ParameterMeanRangeNumber of Samples/nCV/%
Water temperature in Sept./°C17.1215.62~22.231179
pH7.945.86~11.403868
Electrical conductivity (EC)/(μs/cm)277.8920~763.2022154
Ammonia nitrogen (NH3-N)/(mg/L)0.230.001~2.64256165
Chemical oxygen demand (COD)/(mg/L)22.480.16~111.9030680
Total nitrogen (TN)/(mg/L)1.190.09~12.2936658
Total phosphorus (TP)/(mg/L)0.120.01~1.0736246
Table 4. Calculation results of annual changes in WQI values of Xingkai Lake.
YearAnnual AverageAverage Value in MayAverage Value in Sept. Water Quality Grade
20117274.6669.33IV
201262.676461.33III
2013566052III
201458.675265.33III
201547.3345.3349.33II
20164845.3350.66II
201749.3446.6752II
201851.3450.6752III
Table 5. M-K test results for each water quality parameter and WQI value.
ParameterZPVariation Trend
Water temperature in Sept.0.720.02Significant increase
pH−0.330.32Decreasing trend, but not significant
EC−0.140.71Decreasing trend, but not significant
TN−0.640.03Significant decrease
TP−0.520.1Decreasing trend, but not significant
NH3-N−0.360.27Decreasing trend, but not significant
COD01No trend
Annual average WQI−0.50.11Decreasing trend, but not significant
Average WQI (May)−0.620.04Significant decrease
Average WQI (Sept.)−0.420.2Decreasing trend, but not significant
Table 6. Heavy metals content in sediments of Xingkai Lake.
ParameterMinimumMaximumMeanNortheast Plains Soil Background Values
Mn/(mg/kg)330650490616.85
Cr/(mg/kg)28.5875.9562.9752
Cu/(mg/kg)3.1229.114.9918.27
Zn/(mg/kg)1790.7349.455.39
As/(mg/kg)2.5814.357.968.04
Cd/(mg/kg)0.050.210.140.1
Hg/(mg/kg)0.0030.140.050.028
Pb/(mg/kg)10.8758.8619.6222.42
Ni/(mg/kg)22.925.323.7321.84
Table 7. Geo-accumulation index and contamination levels of heavy metals in sediments of Xingkai Lake.
ParameterIgeo ValueContamination LevelContamination Degree
Mn/(mg/kg)−0.680Uncontaminated
Cr/(mg/kg)1.292Moderately contaminated
Cu/(mg/kg)−0.220Uncontaminated
Zn/(mg/kg)−0.180Uncontaminated
As/(mg/kg)−0.060Uncontaminated
Cd/(mg/kg)0.221Uncontaminated to moderately contaminated
Hg/(mg/kg)1.322Moderately contaminated
Pb/(mg/kg)0.381Uncontaminated to moderately contaminated
Ni/(mg/kg)−0.190Uncontaminated
Table 8. Relationship between land-use type conversion and land status.
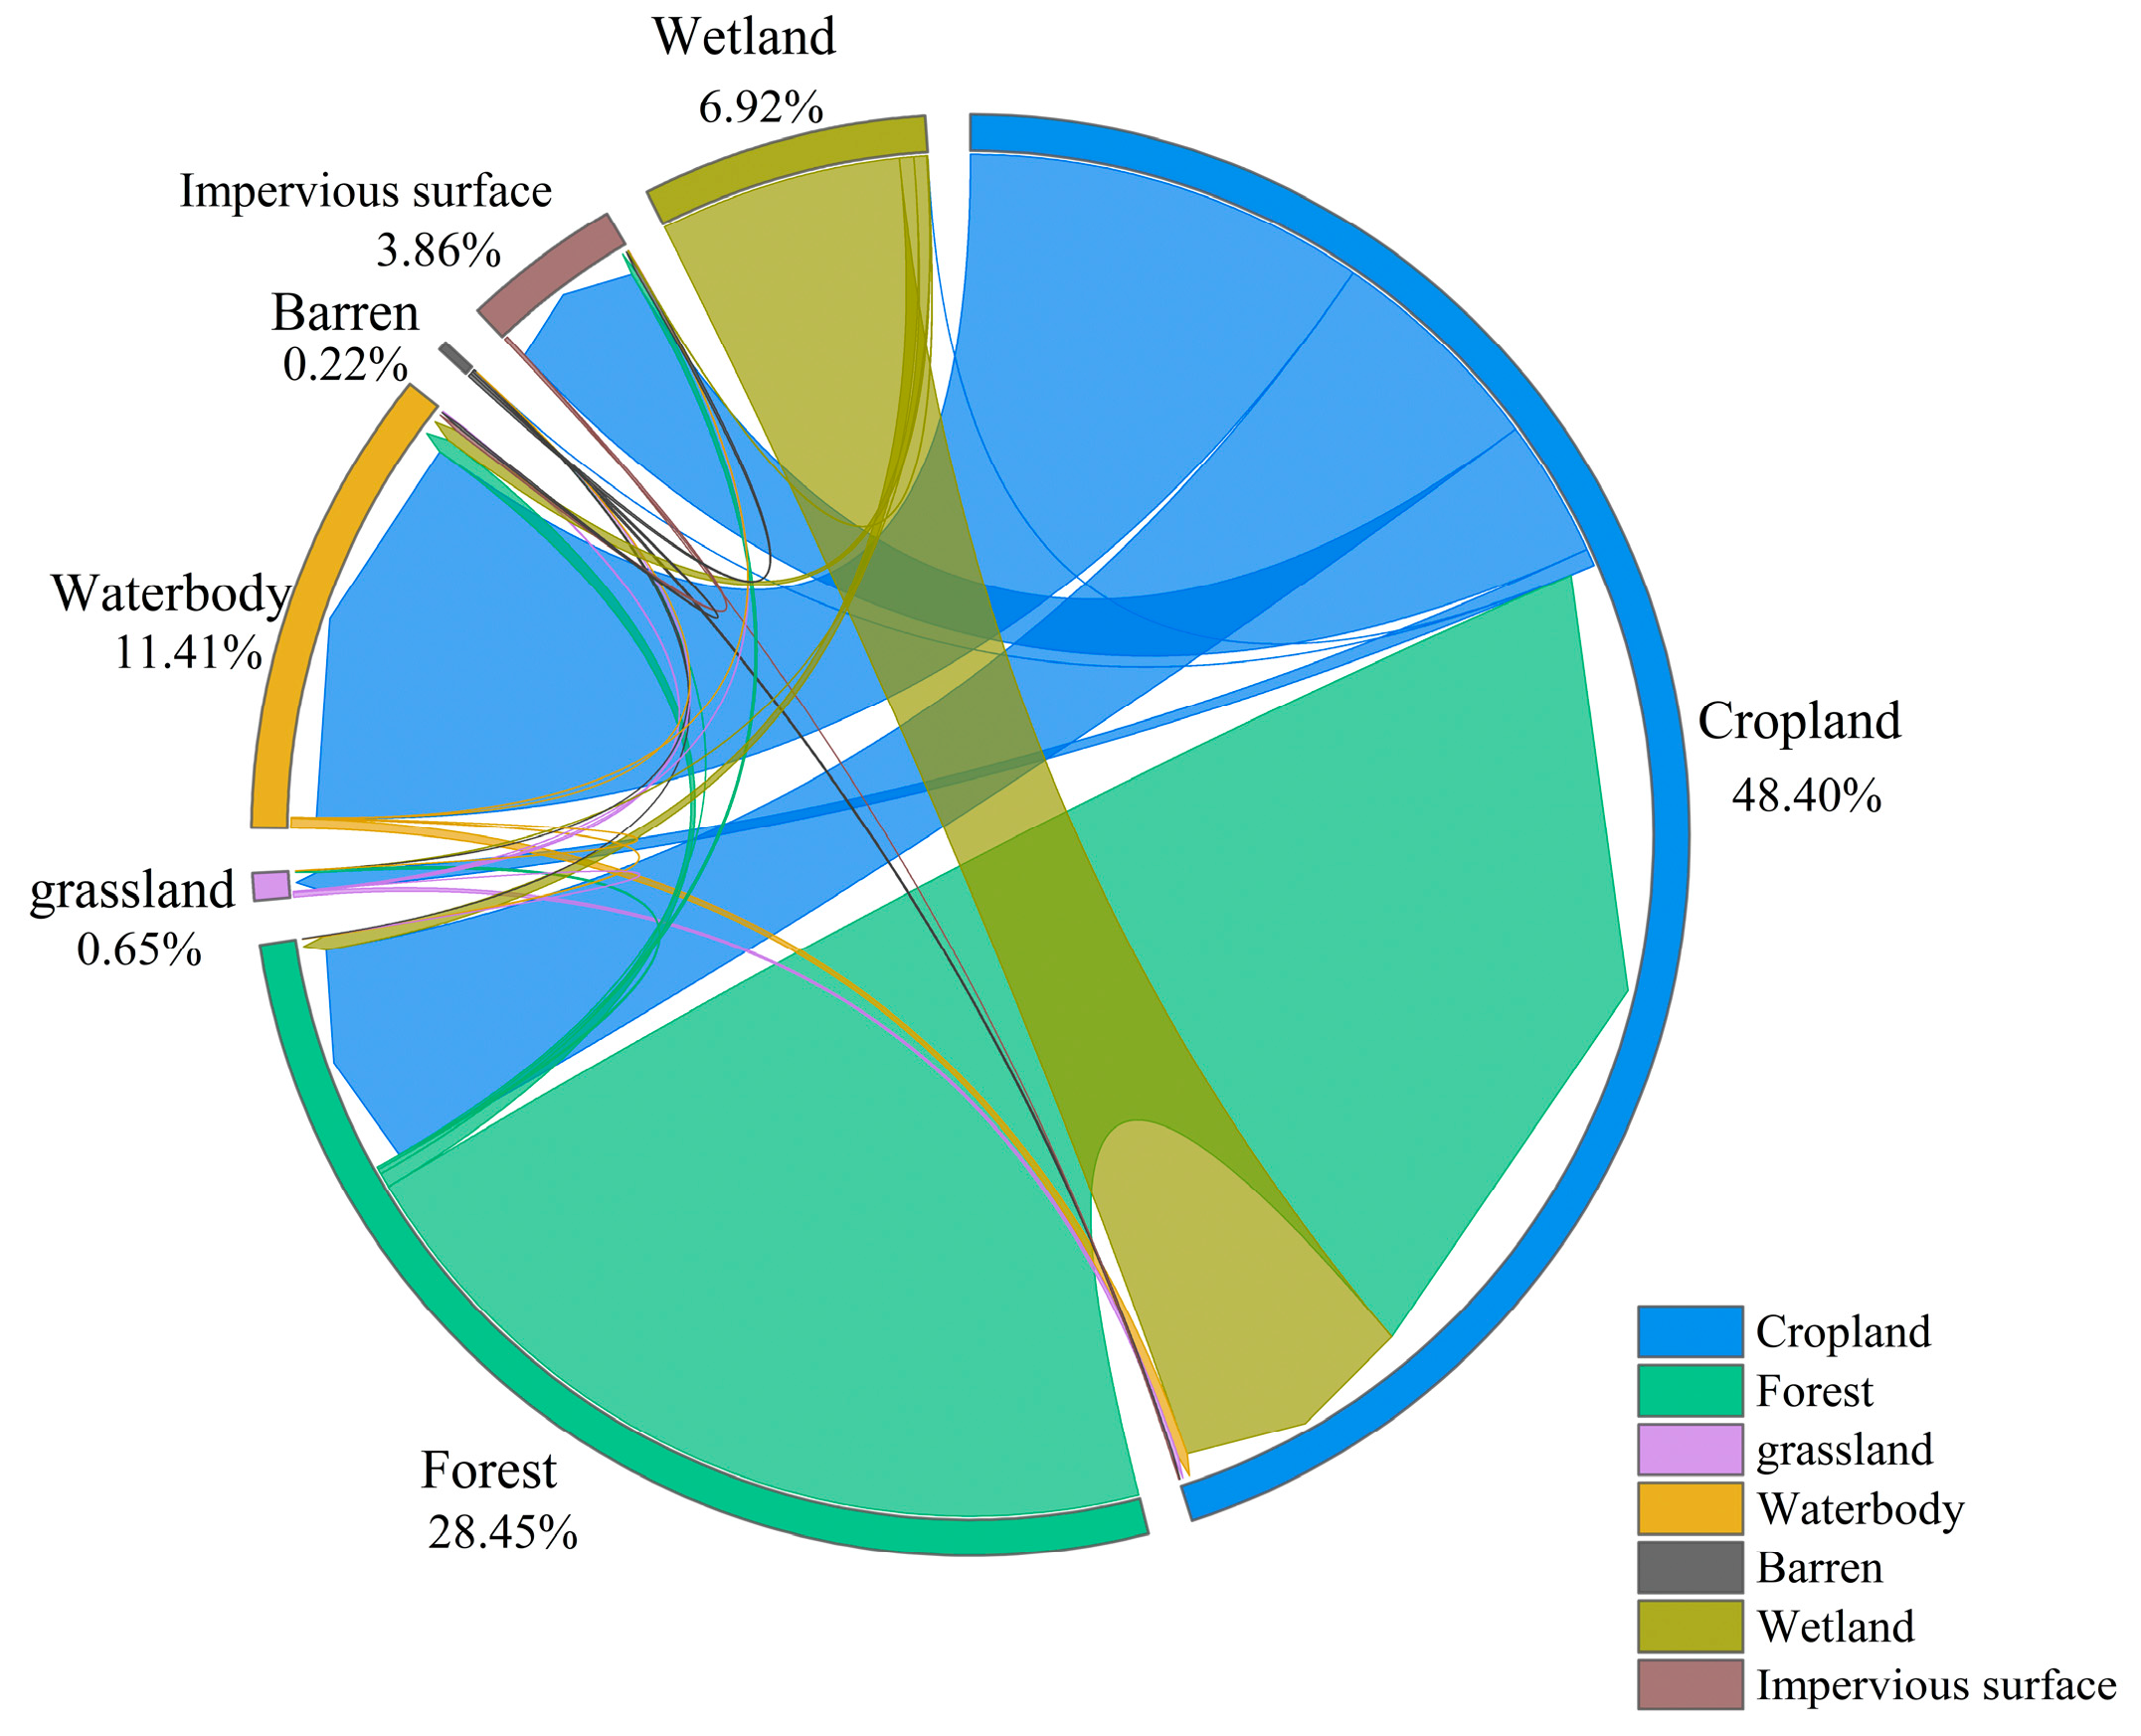
In Target Year (2020)
Cropland
/km²
Forest
/km²
Grassland
/km²
Waterbody
/km²
Barren
/km²
Impervious Surface
/km²
Wetland
/km²
In baseline year
(1990)
Cropland2043.49 41.74 3.23 75.02 0.03 25.78 0.01
Forest160.31 218.01 0.46 2.78 0.02 0.92 0.00
Grassland0.75 0.01 0.07 0.16 0.01 0.05 0.00
waterbody1.84 0.14 0.01 1227.14 0.01 0.08 0.00
Barren0.43 0.01 0.01 0.50 0.54 0.63 0.00
Impervious surface0.02 0.00 0.00 0.680.00 12.71 0.00
Wetland45.38 2.68 0.09 2.39 0.00 0.12 0.84
Notes: Red component: degradation; gray component: stabilization; green component: improvement.
Disclaimer/Publisher’s Note: The statements, opinions and data contained in all publications are solely those of the individual author(s) and contributor(s) and not of MDPI and/or the editor(s). MDPI and/or the editor(s) disclaim responsibility for any injury to people or property resulting from any ideas, methods, instructions or products referred to in the content.

