Article

Water–Energy Nexus-Based Optimization of the Water Supply Infrastructure in a Dryland Urban Setting

by
Charles Odira Maxwell
1,*,
Zablon Isaboke Oonge
1,
Patts M. A. Odira
1,
Gilbert Ong’isa Ouma
2,
Marco Lompi
3,
Tommaso Pacetti
3,
Mario Di Bacco
3 and
Enrica Caporali
3
1
Department of Civil and Construction Engineering, University of Nairobi, Nairobi P.O. Box 30197, Kenya
2
Department of Earth and Climate Sciences, University of Nairobi, Nairobi P.O. Box 30197, Kenya
3
Department of Civil and Environmental Engineering, Università degli Studi di Firenze, 50139 Firenze, Italy
*
Author to whom correspondence should be addressed.
Water 2024, 16(21), 3073; https://doi.org/10.3390/w16213073
Submission received: 24 August 2024 / Revised: 18 October 2024 / Accepted: 19 October 2024 / Published: 27 October 2024

Abstract

:
Managing water supply systems is essential for developing countries to face climate variability in dryland settings. This is exacerbated by high energy costs for pumping, water losses due to aging infrastructures, and increasing demand driven by population growth. Therefore, optimizing the available resources using a water–energy nexus approach can increase the reliability of the water distribution network by saving energy for distributing the same water. This study proposes a methodology that optimizes the Water Distribution Network (WDN) and its management that can be replicated elsewhere, as it is developed in a data-scarce area. Indeed, this approach shows the gathering of WDN information and a model to save energy by optimizing pump schedules, which guarantee water distribution at minimal operational costs. The approach integrates a genetic algorithm to create pumping patterns and the EPANET hydraulic simulator to test their reliability. The methodology is applied for a water utility in the dryland urban setting of Lodwar, Turkana County, Kenya. The results indicate a potential reduction in energy costs by 50% to 57% without compromising the supply reliability. The findings highlight the potential of WEN-based solutions in enhancing the efficiency and sustainability of data-scarce water utilities in dryland ecosystems.

1. Introduction

Drylands are defined as hyper-arid, arid, semi-arid, and dry sub-humid parts of the Earth. They can be found in all the continents and cover approximately 41 to 47 percent of the Earth’s surface and host 39% of the global population [1,2,3]. According to UNEP/GRID [4], Asia and Africa have the largest amount of dryland areas, while Central America and Europe have the least dryland areas. A higher human population in drylands is found in Asia and Africa. The dryland ecosystem supports both rural and urban settings, with examples of large cities like Cairo, New Delhi, and Mexico being located in dryland areas [5,6]. It is projected that about 40% of the urban population will be living in cities located in dryland areas by 2050 [5]. According to Li et al. [6], communities in dryland ecosystems are faced with numerous stressors threatening their livelihood resilience and causing water scarcity, especially as a consequence of climate change, which is one of the main drivers of stressors.
In all dryland areas, water scarcity is a constant feature. This is exacerbated by erratic rainfall from season to season, leading to disasters of drought or floods and increased temperatures attributed to climate variabilities that negatively affect groundwater reserves, which represent the main water supply source in the dryland ecosystem [7,8,9]. According to Gain et al. [10], water security can be viewed in four dimensions: water availability, accessibility, stability, and quality. Pradhan et al. [11] posit that the impact of climate change on water security goes beyond these four dimensions and is closely linked to many other dimensions of sustainable development goals and that increasing water scarcity in dryland areas will make the attainment of these goals more difficult [11,12,13].
Water Distribution Networks (WDNs) play a crucial role in ensuring water security and providing consumers with sufficient water of appropriate quantity and quality. A WDN comprises various elements (such as water sources, reservoirs, treatment plants, pumps, pipes, tanks, and valves), and pumps are the largest energy consumers among the components of a water supply system [14]. Due to high energy prices and the associated GHG emissions, there is an increasing demand to minimize energy requirements and to develop and implement sustainable water use strategies [15].
In this context, adopting a nexus-based approach to managing natural resources appears crucial [16]. Indeed, water management in dryland areas is strictly connected with food security targets and energy production constraints and is considered to be a grand nexus approach [17]. The Water–Energy Nexus (WEN) is a sub-nexus that focuses on the interdependencies between water and energy. On the one hand, energy is used in water production, such as in the water supply systems, while on the other hand, water is used in the generation of energy, such as in hydropower generation [17,18]. As an example, the groundwater depletion observed throughout the world [19] can lead to an escalation of pumping energy costs and affect water yield [20].
Nexus issues in the dryland areas bring water supply management and operations issues to the forefront and demand attention. Sustainable development goals are difficult to reach in developing countries, where 70% of dryland areas are located, and there are several challenges in the management and operation of water services in urban settings. According to Sadoff [12] and Stringer et al. [1], such challenges are the result of population increases in dryland urban ecosystems, climate change, unmatched rates of infrastructure expansion, depletion of groundwater sources, and pollution. It is against this background that Wang et al. [21] observe that the concept of WEN is gaining traction as a useful viewpoint in analyzing and managing the utilization of the two resources with future research directions focusing on modeling and optimization techniques for the WEN. Abegaz et al. [22] observe that there has been an increase in the literature on the assessment of interdependency between energy and water to sustain global water and energy security, whereas Carneiro et al. [23] appreciate the interplay between water and energy in a water utility where water and energy efficiency were used in one of the matrices in their proposed framework to assess the resilience of water distribution system.
Indeed, researchers and practitioners in the water sector are focusing on innovative ways of managing water supply and the associated energy consumption to achieve sustainable development in dryland regions [22,24]. In this context, the application of various optimization techniques has been increasingly explored and reached a degree of maturity in a wide spectrum of industries, including water resources systems [25,26]. WDN optimization entails creating a dependable, efficient, and cost-effective distribution network that meets the necessary water demands while maintaining adequate pressure heads [27]. The recent need for research on WDN operational optimization has been emphasized by factors such as aging network infrastructures leading to more water losses, increased demand due to urbanization, climate change-induced variables, and socio-economic factors within supply areas [28,29]. Several optimization techniques have been developed and applied to water supply systems with continuous refinement as technology advances. They are broadly classified as deterministic optimization techniques or single objective optimization, which include linear programming, nonlinear programming, dynamic programming, and metaheuristic/stochastic or multi-objective optimization techniques, in which genetic algorithm, simulated annealing, ant colony, and particle swarm are among the used techniques [30]. These techniques are used in both the design and operational stages of water supply systems to optimize system component parameters such as pipe diameters, optimal network design, node locations, and optimal pump scheduling [25]. Particularly interesting in the context of WDN optimization appears to be genetic algorithms [31,32], a multi-objective optimization technique that has already been applied to different aspects of optimization in water supply systems to obtain optimal design and operational levels and has demonstrated its capacity to obtain better solutions than classical methods [33,34,35,36]. According to Luna et al. [37], although the use of genetic algorithms in water supply systems optimization suffers from a computational burden, it has proven to be most suited to deal with problems of pump scheduling, which can be parameterized to suit the genetic algorithm structure. Other studies have shown a cost reduction of around 30% when genetic algorithms are applied in pump scheduling optimization [38]. More efficient optimization methods have been introduced, such as the nonlinear chaotic honey badger algorithm (NCHBA). Jafari-Asl et al. [39] state that there is a general consensus among the researchers that there is still no single universal optimizer that can efficiently solve all complex problems related to water distribution systems, a fact earlier reinforced by [40] in their review of different optimization techniques.
The main aim of this study was to develop a WEN-based modeling and optimization technique to support the efficient management of water supply networks in dryland areas. The developed approach is tested in a data-scarce area to provide the optimal strategy for assuring water supply while minimizing energy costs. The study is organized as follows: the next section describes the case study area and the data that are used, the third section presents the applied methodology, and then the results, discussion, and conclusions are given.

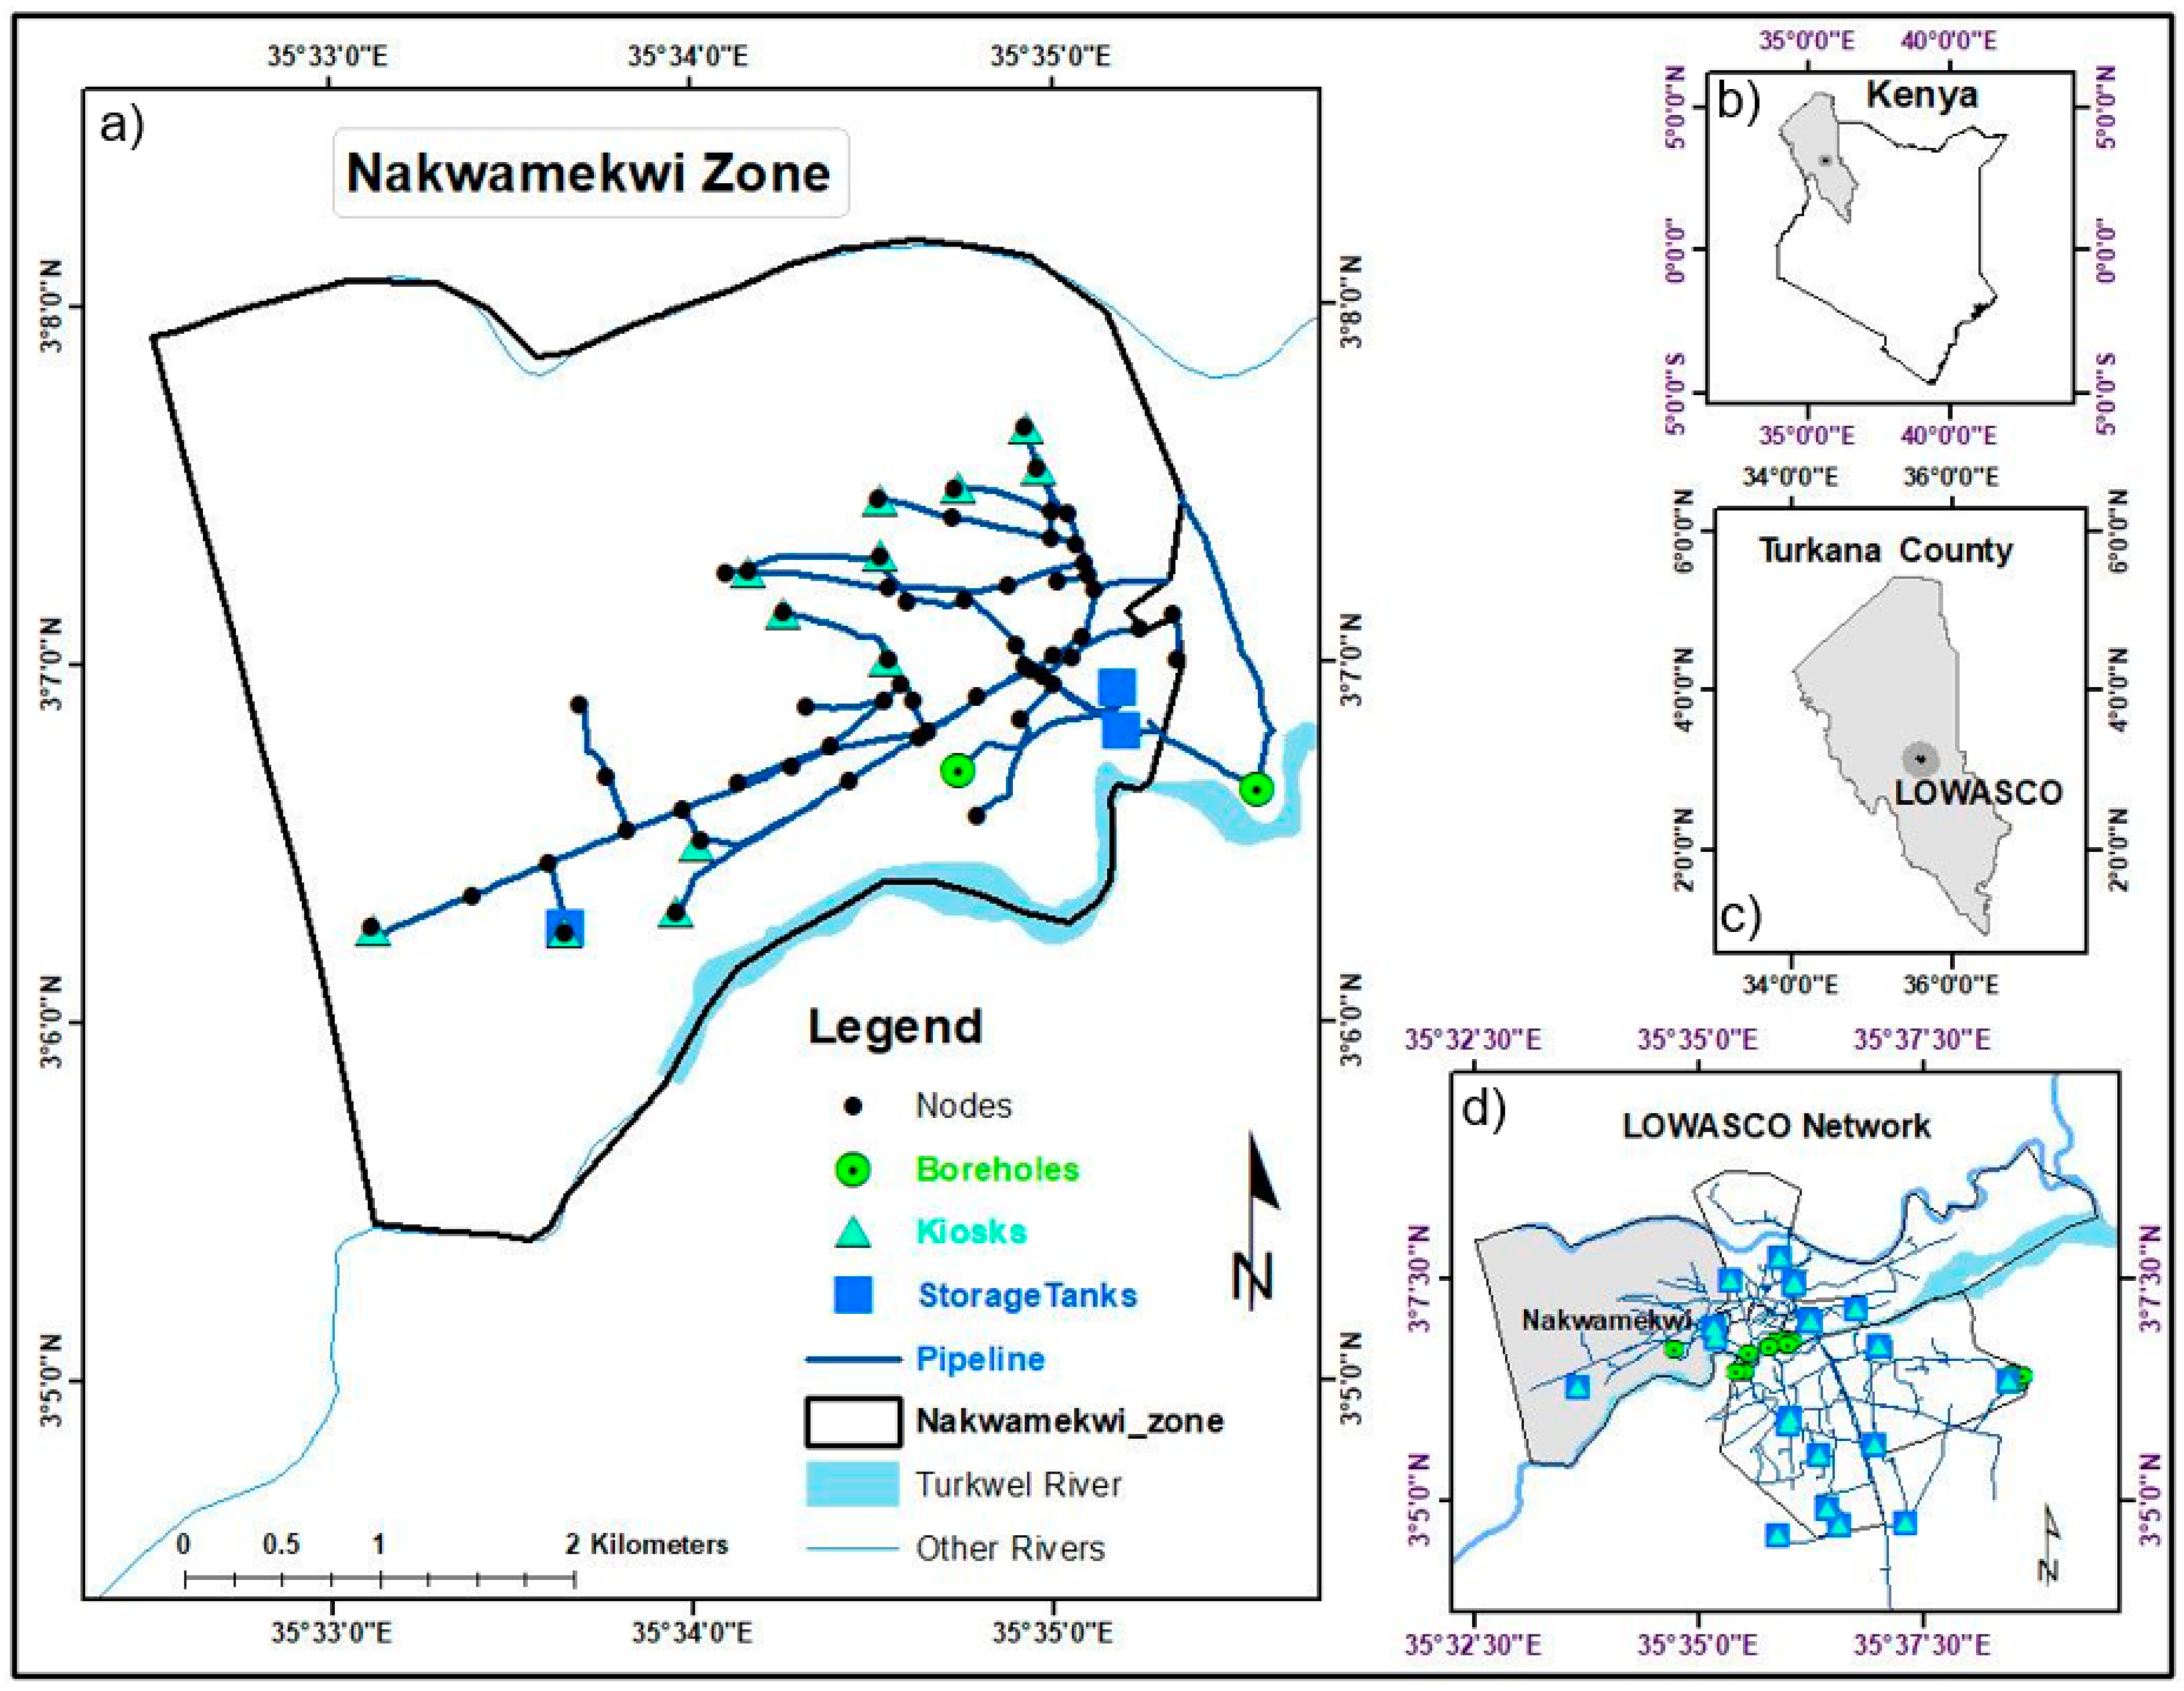
2. Data and Study Area Description

The selected study area is the town of Lodwar in Turkana County, Kenya (Figure 1). The town is in the downstream part of the Turkwel River basin, which is characterized by a warm and hot climate with a temperature range between 20 °C and 41 °C and a mean of 30.5 °C. It has an erratic and unreliable rainfall pattern with a mean annual precipitation of 200 mm. Rainfall often results in flash floods, while surface runoff and potential evaporation rates are extremely high due to little vegetation cover in the river basin [41]. The Turkwel River originates from the Uganda side of Mt. Elgon and flows through Lodwar town, eventually draining into Lake Turkana [42]. The water supply source to the Lodwar municipality relies entirely on groundwater abstracted from 11 boreholes with an average depth of 50 m drilled within shallow aquifers along the Turkwel River [7,42,43] and three boreholes within intermediate to deep aquifers of a depth greater than 50 m in Napuu.
Lodwar municipality’s population growth rate is estimated as 3.6% annually according to Kenya’s population and housing census [44,45], which recorded its population at 58,290 and 82,970 in the years 2009 and 2019, respectively, with a population density of 243 inhabitants per km2. The town is the regional transport and communication hub of Turkana County and a commercial center with major economic activities of small-scale trading, nomadic pastoralists, basket weaving, tourism, and small-scale farming along the Turkwel River [46].
Historically, Lodwar municipal water services have been provided by different agencies such as the Catholic Diocese of Lodwar and other non-governmental organizations that sponsored the drilling, equipping, and construction of water supply infrastructures for different zones within the town. The work finished around the year 2007 without a clear as-built network map [47]. Therefore, an update of the existing network map was necessary to implement the analysis (as explained in Section 3.1). The main water user category is domestic, with a small percentage of commercial and industrial activities. The area is divided into eight supply zones supplied by 14 boreholes with an estimated total daily demand of 2445 m3, which varies with the seasons [48] (Figure 1d). The total network storage capacity is 1249 m3 and the network node elevation within the area covered by the network ranges from 487 m a.s.l. to 547 m a.s.l. Water is pumped from the boreholes to raised steel and masonry tanks located at higher elevations within the supply zones and distributed to consumers via gravity. The pump setup is a hybrid of solar photovoltaic and grid electricity, but the utility occasionally fails to pump water due to disconnected grid electricity, which results in unsettled bills. Out of the eight supply zones, a detailed analysis was carried out in just one of them, namely the Nakwamekwi supply zone (Figure 1a). The procedure can be replicated in other supply zones or in other cities.
The Nakwamekwi supply zone has an approximate total network length of 24 km and a daily demand of 583 m3. The area is served by two boreholes and two masonry storage tanks with a total capacity of 322 m3 at elevations of 520 m a.s.l. and 509 m a.s.l., respectively. Pumps are operated in a hybrid system of solar photovoltaic and grid electricity, which are operated for 20 to 24 h per day. The water user categories are shown in Table 1.
Water consumption follows a diurnal pattern, with the peak hours between 06:00 and 09:00. and between 18:00 and 21:00. Node elevations within the analyzed supply zone range from 490 m a.s.l. to 514 m a.s.l. Table 1 shows the estimated average household size per connection, which is based on the Kenya Housing Population Census 2019 and a demand per capita (liters per day) recommended by the Kenya Ministry of Water and Irrigation Water Supply Services Design Manual 2005 for dryland urban settings.

3. Methodology

The developed methodology is mainly composed of two phases. Firstly, a comprehensive characterization of the network was realized through surveys and GIS data elaboration (Section 3.1) to provide the required input for the model used for WDN simulation and optimization (Section 3.2). The latter section is subdivided into three main blocks: the water network optimization (Section 3.2.1) to determine the changes needed in the WDN to assure its proper hydraulic functioning; the energy optimization (Section 3.2.2) to determine the optimal pumping schedule to minimize energy consumption; and the water–energy nexus (Section 3.2.3) where the outputs of the previous two sections were combined to obtain the final WDN management strategy.

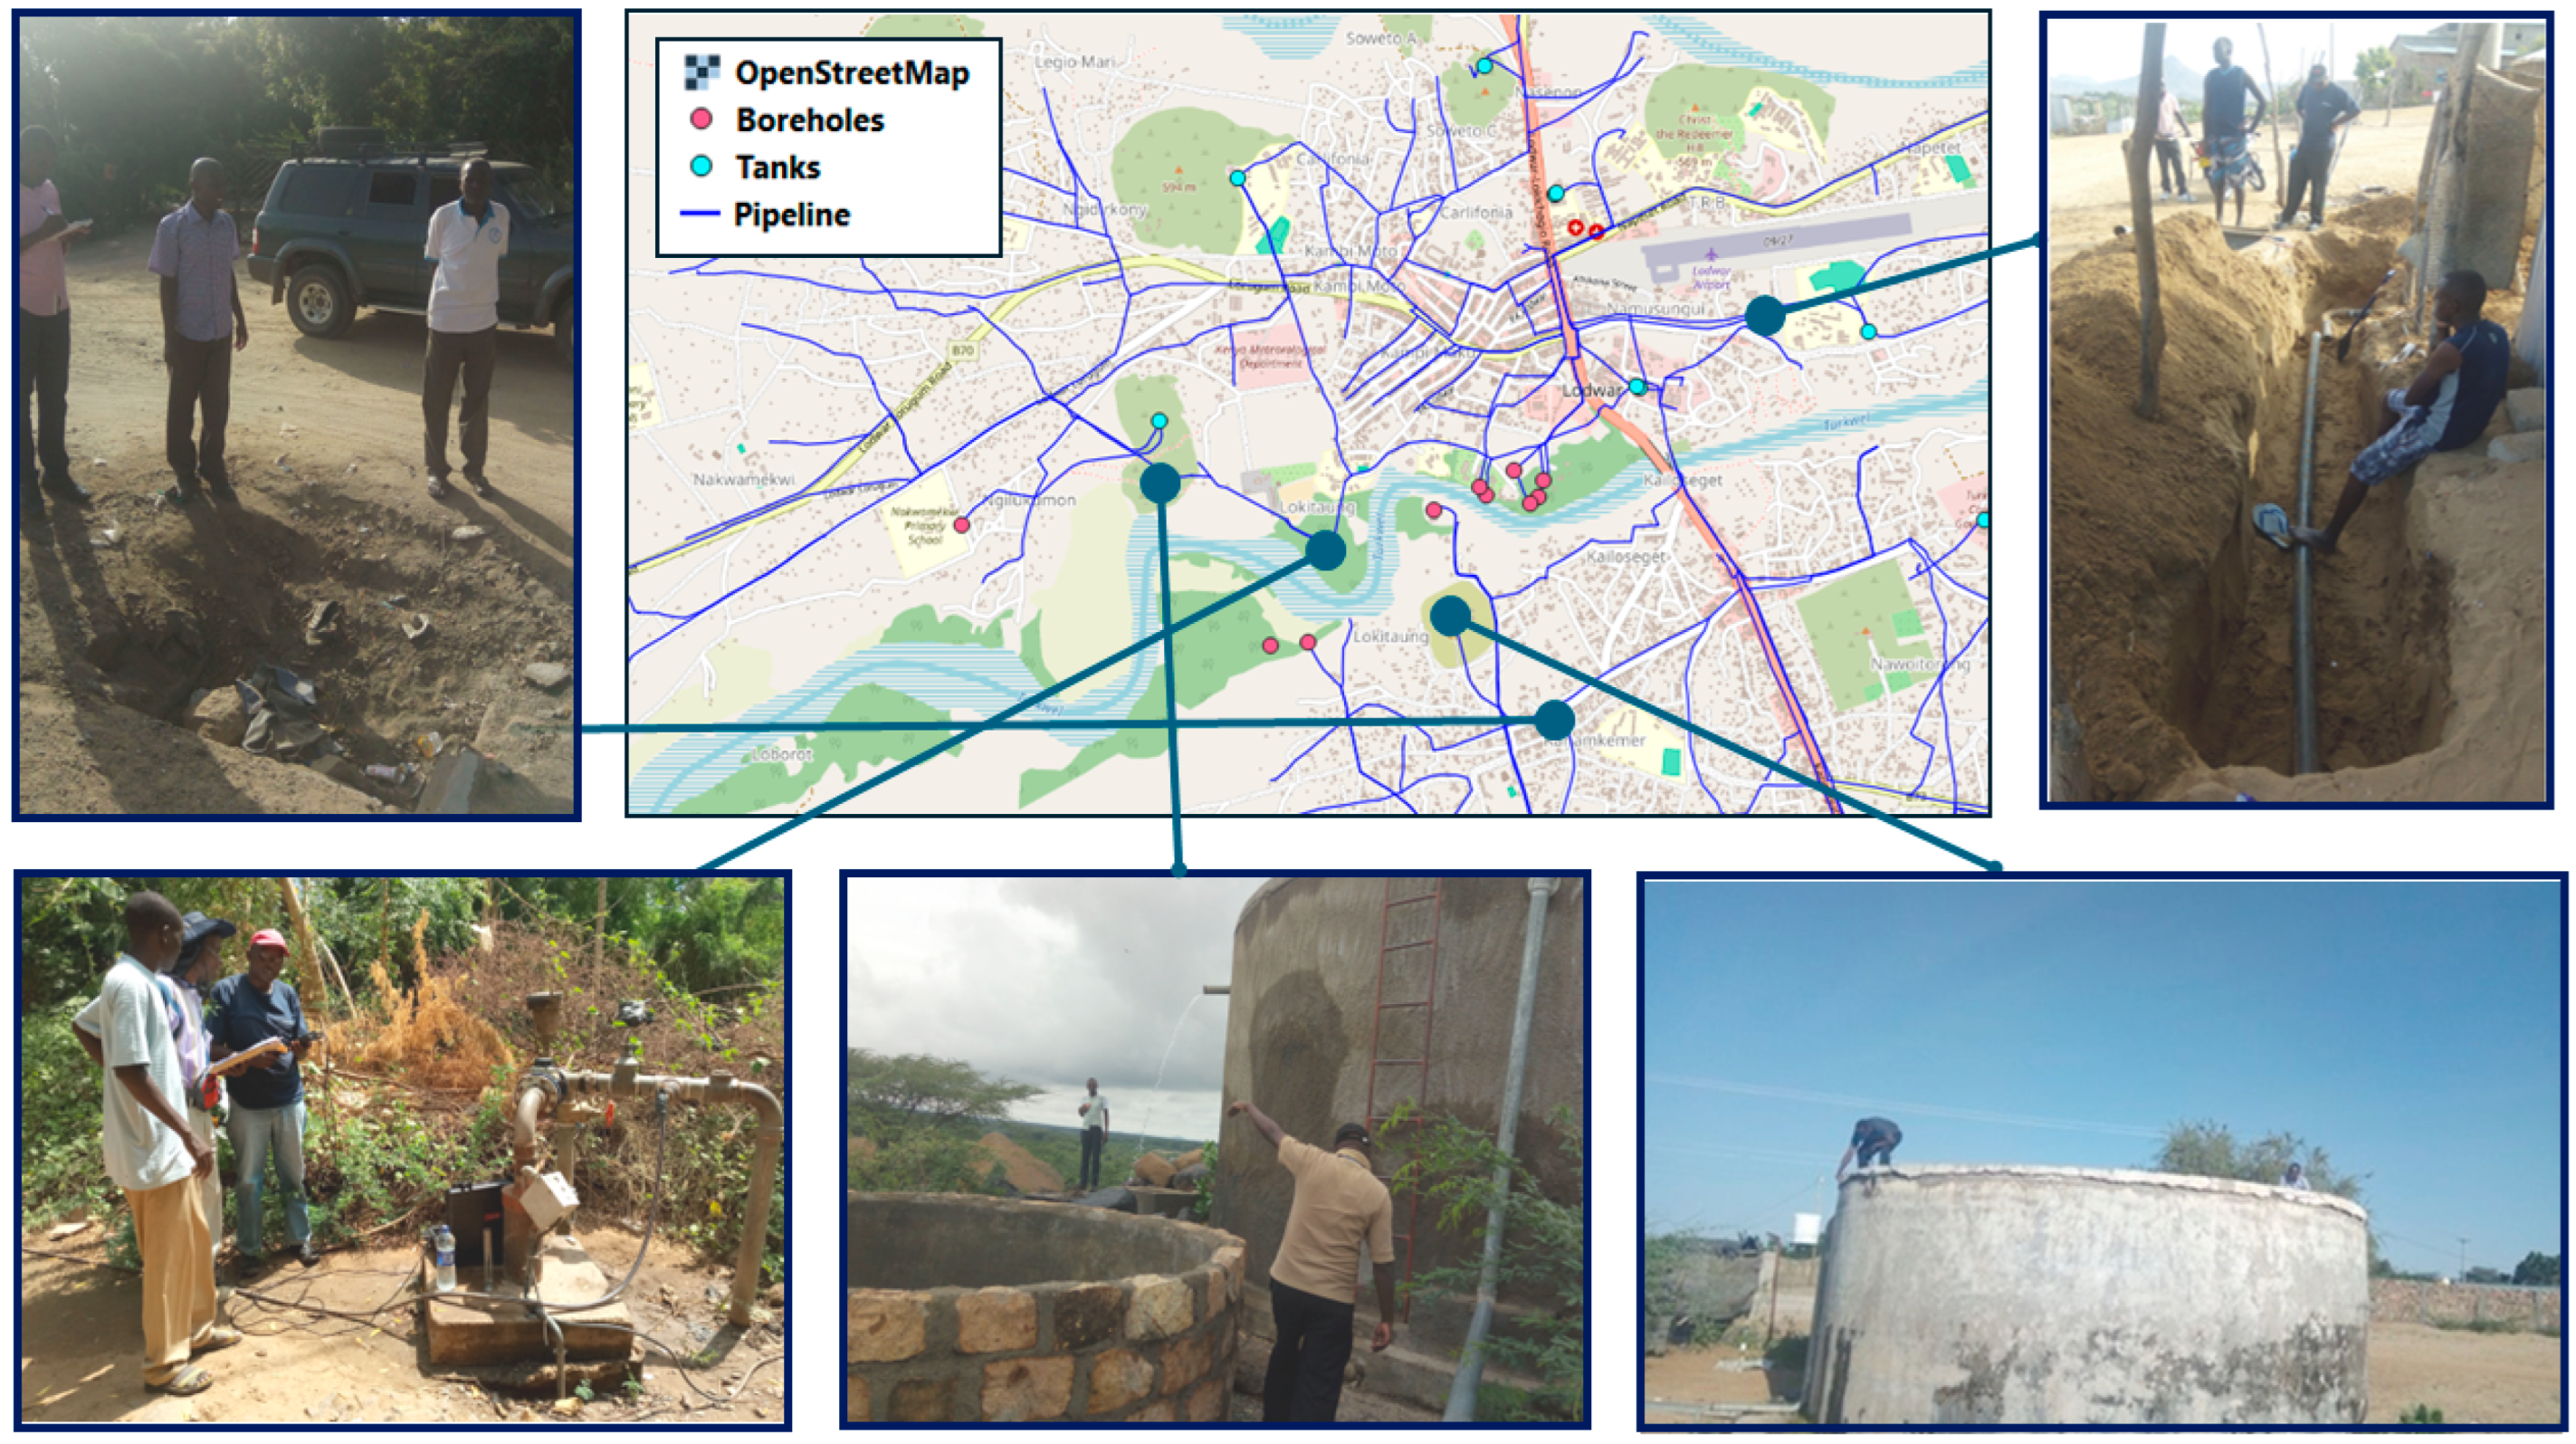
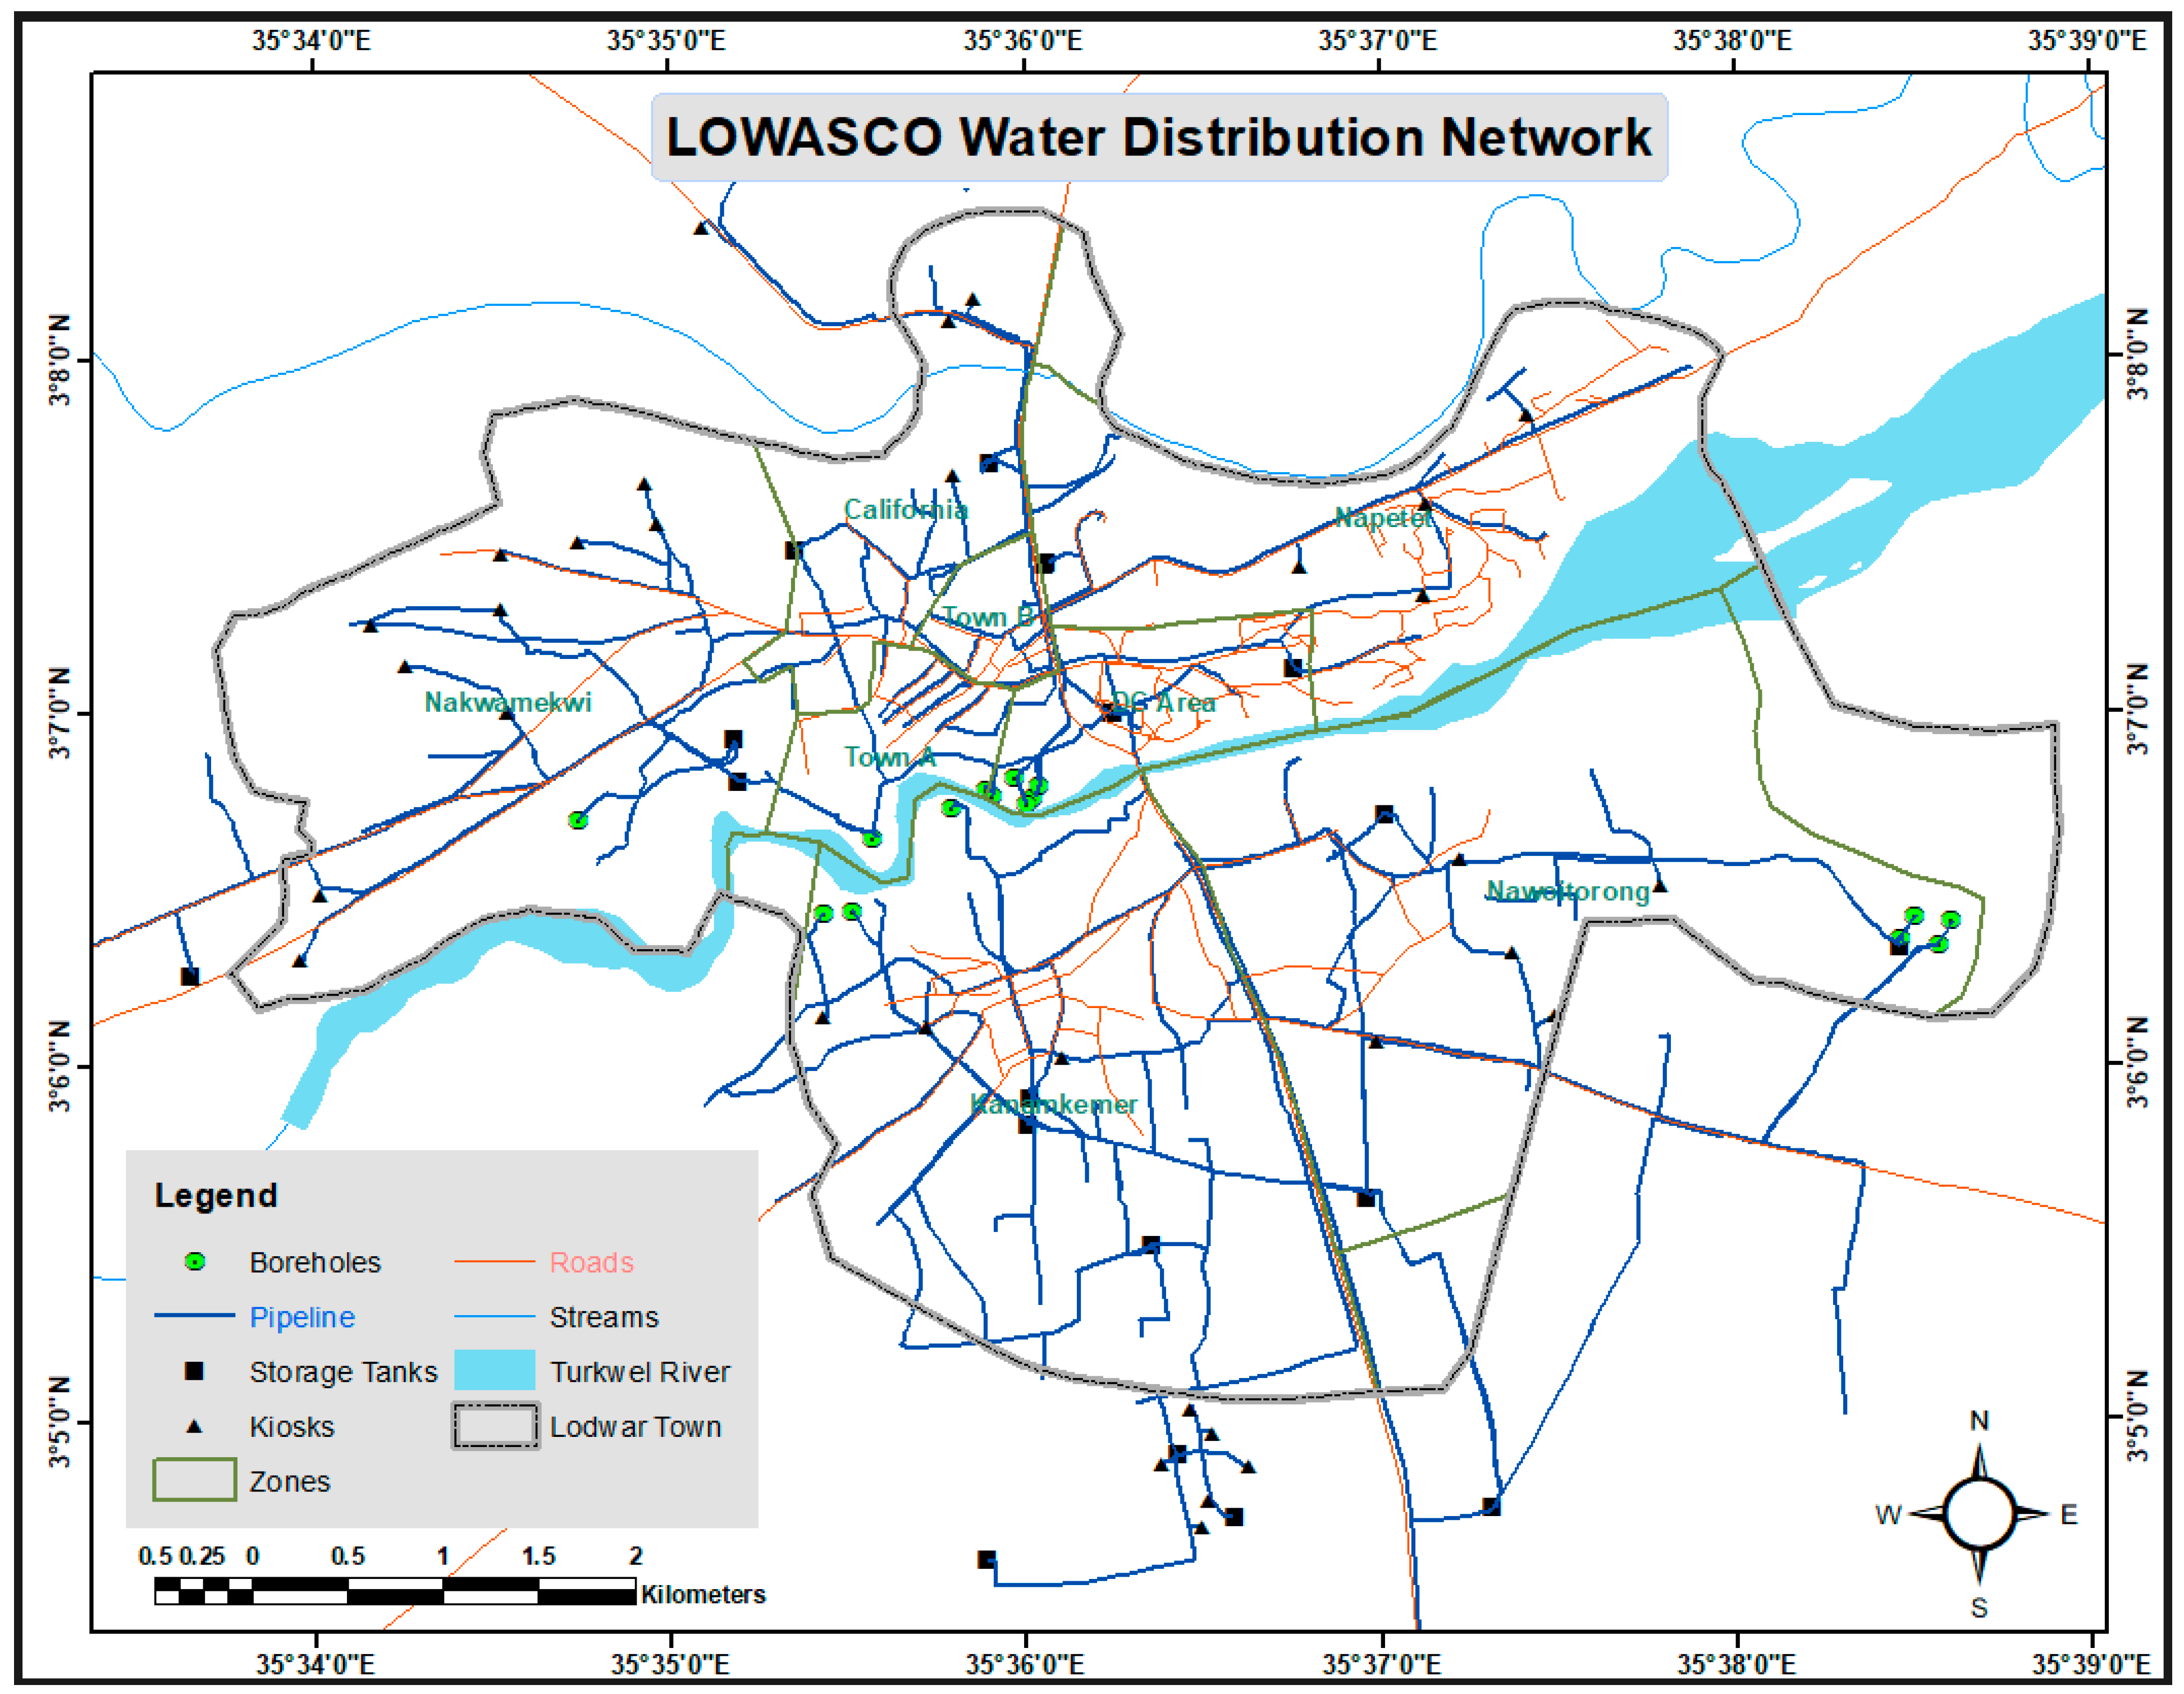
3.1. Water Network Distribution Mapping

Due to the inadequate data on the utility’s water supply infrastructure, a series of surveys was organized to update the existing network map referring to 2014. Baseline data for hydraulic analysis were gathered for one month through field measurements, observations, and administration of questionnaires. The data collected are network node elevation, pipe lengths, materials and diameters where applicable, tanks’ locations, elevations, and dimensions, flow velocities, and flow rates in exposed pipes and borehole drawdown. In some cases, where the nodes were unclear, an institutional memory of a former employee of the utility was solicited, as indicated in Figure 2, during physical mapping and subsequent measurements.
The information derived from the surveys was then combined with a scanned and digitized topographic map of the 2014 water supply network in a GIS environment (i.e., QGIS) to update the map to reflect the status as of 2021. QGIS tools were used to validate the spatial network data. Particularly, node elevation has been validated with a Digital Elevation Model and pipe length has been measured using the software.

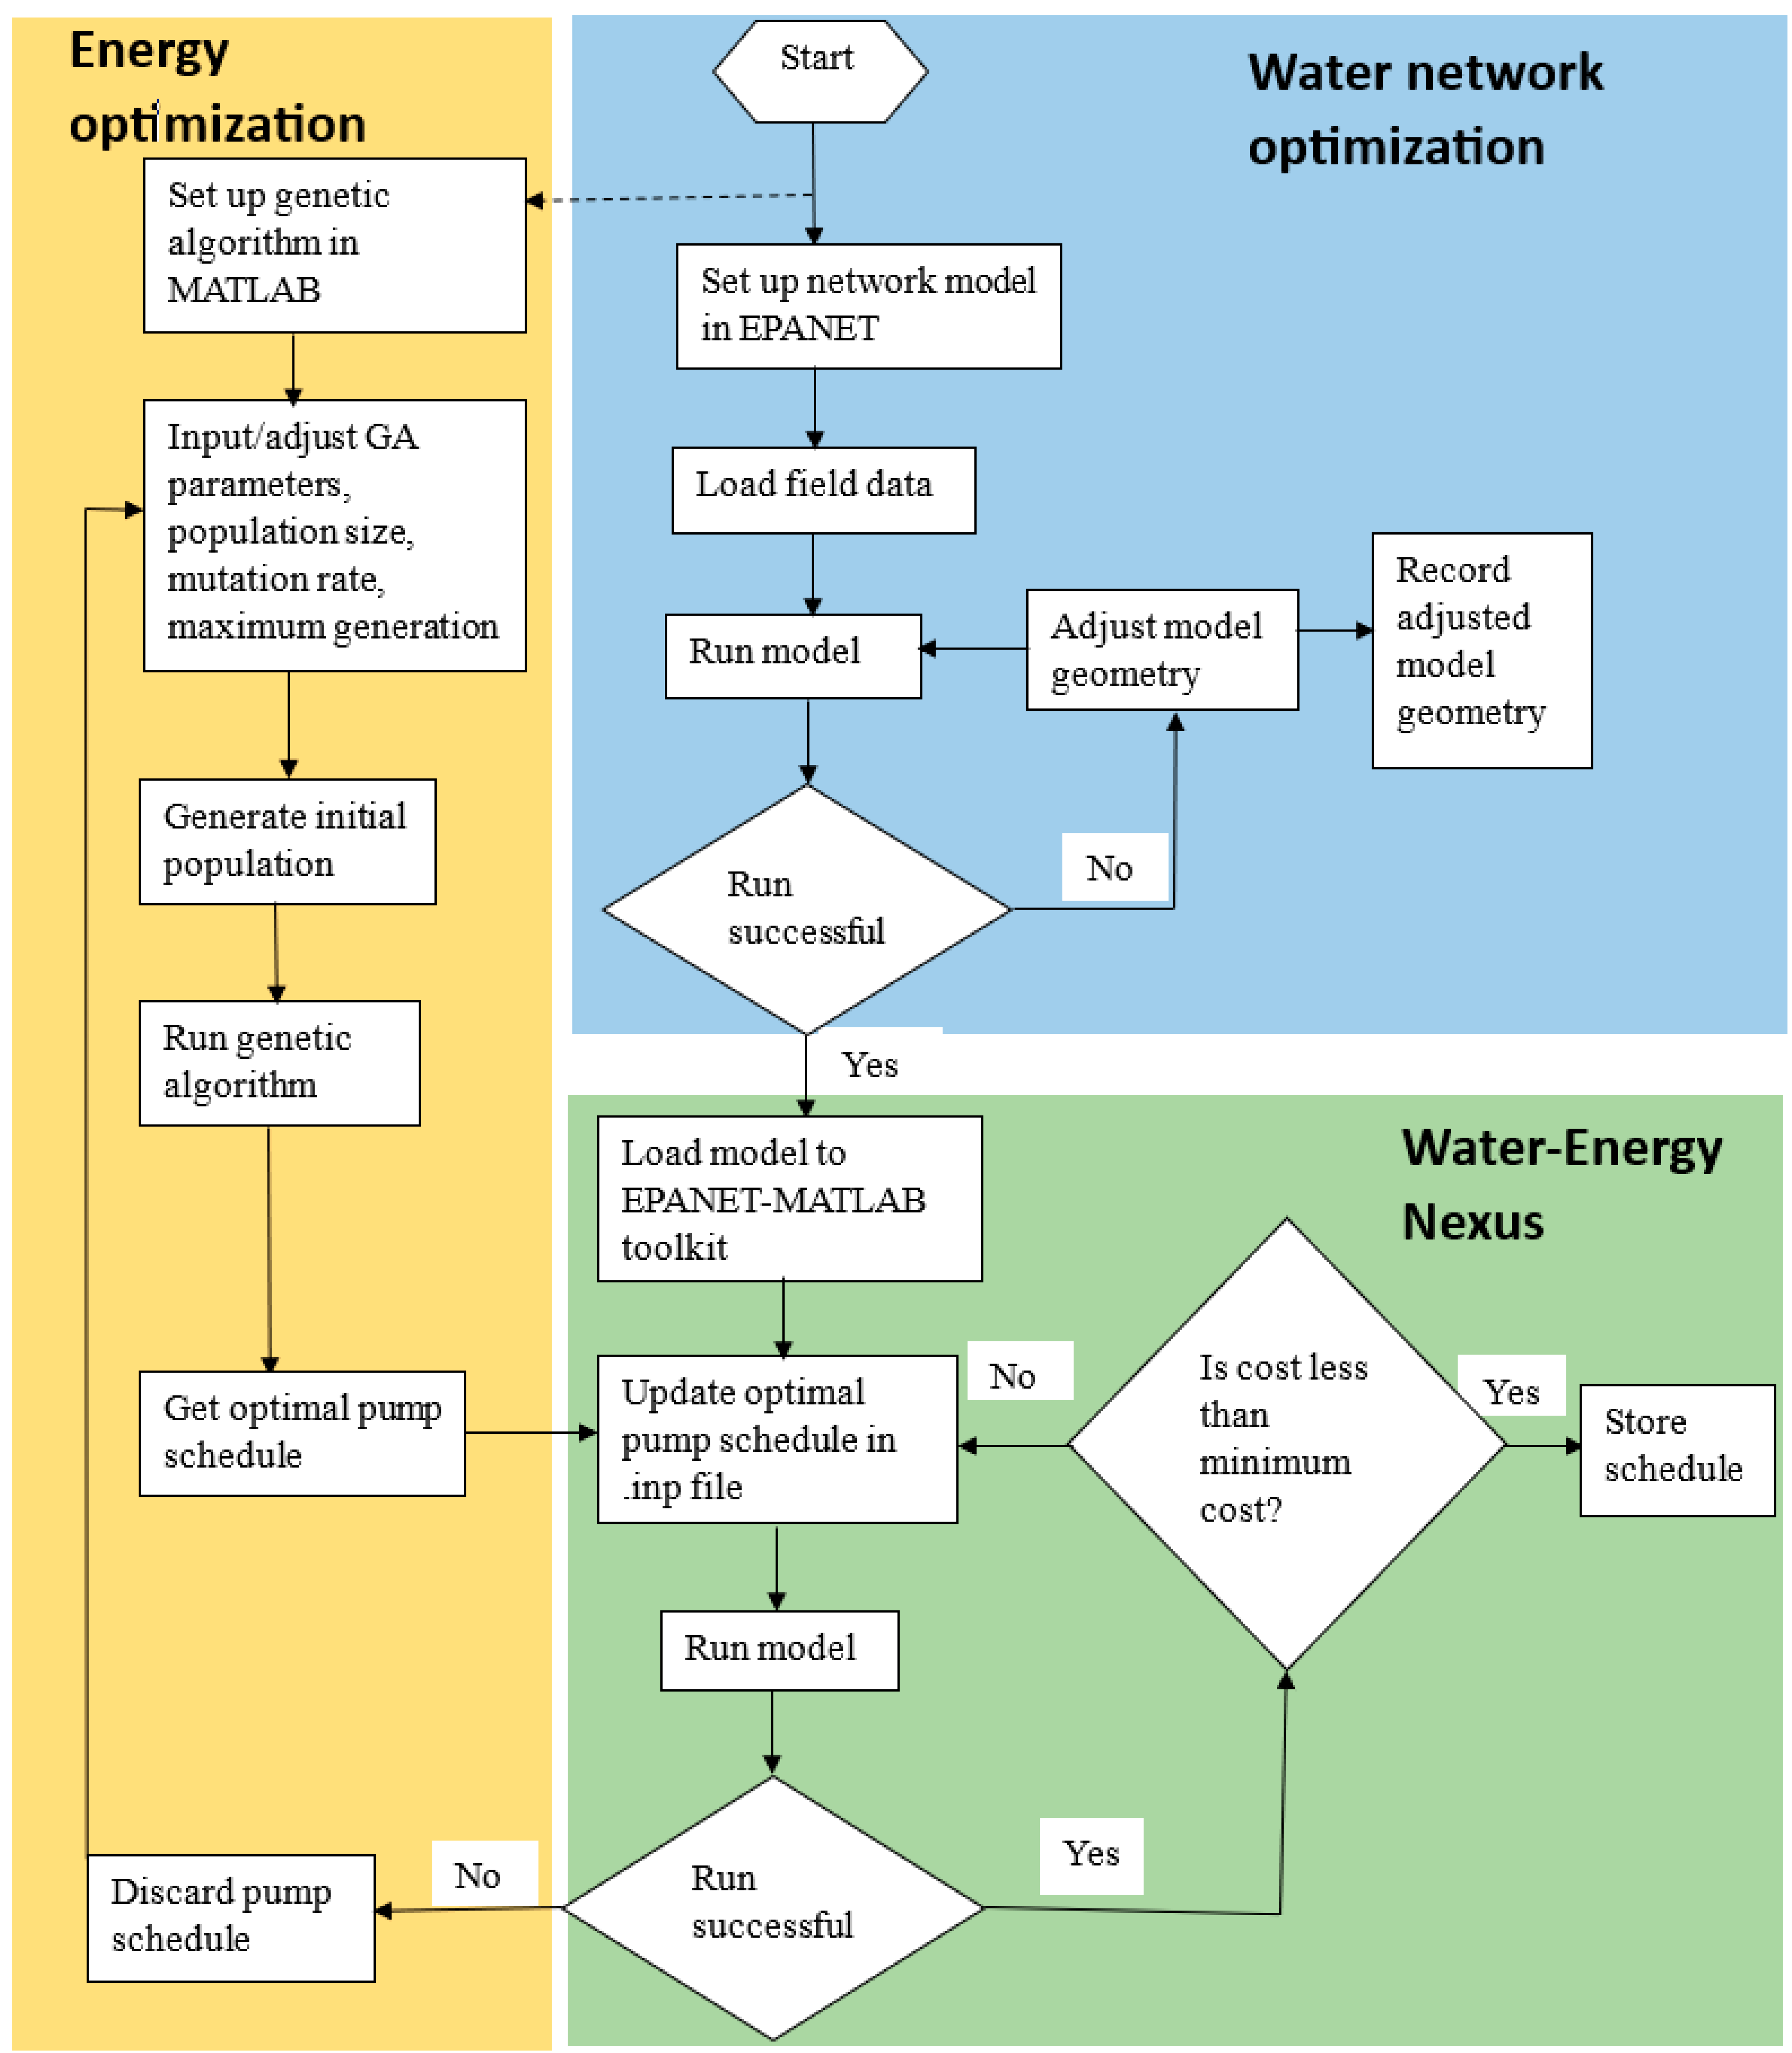
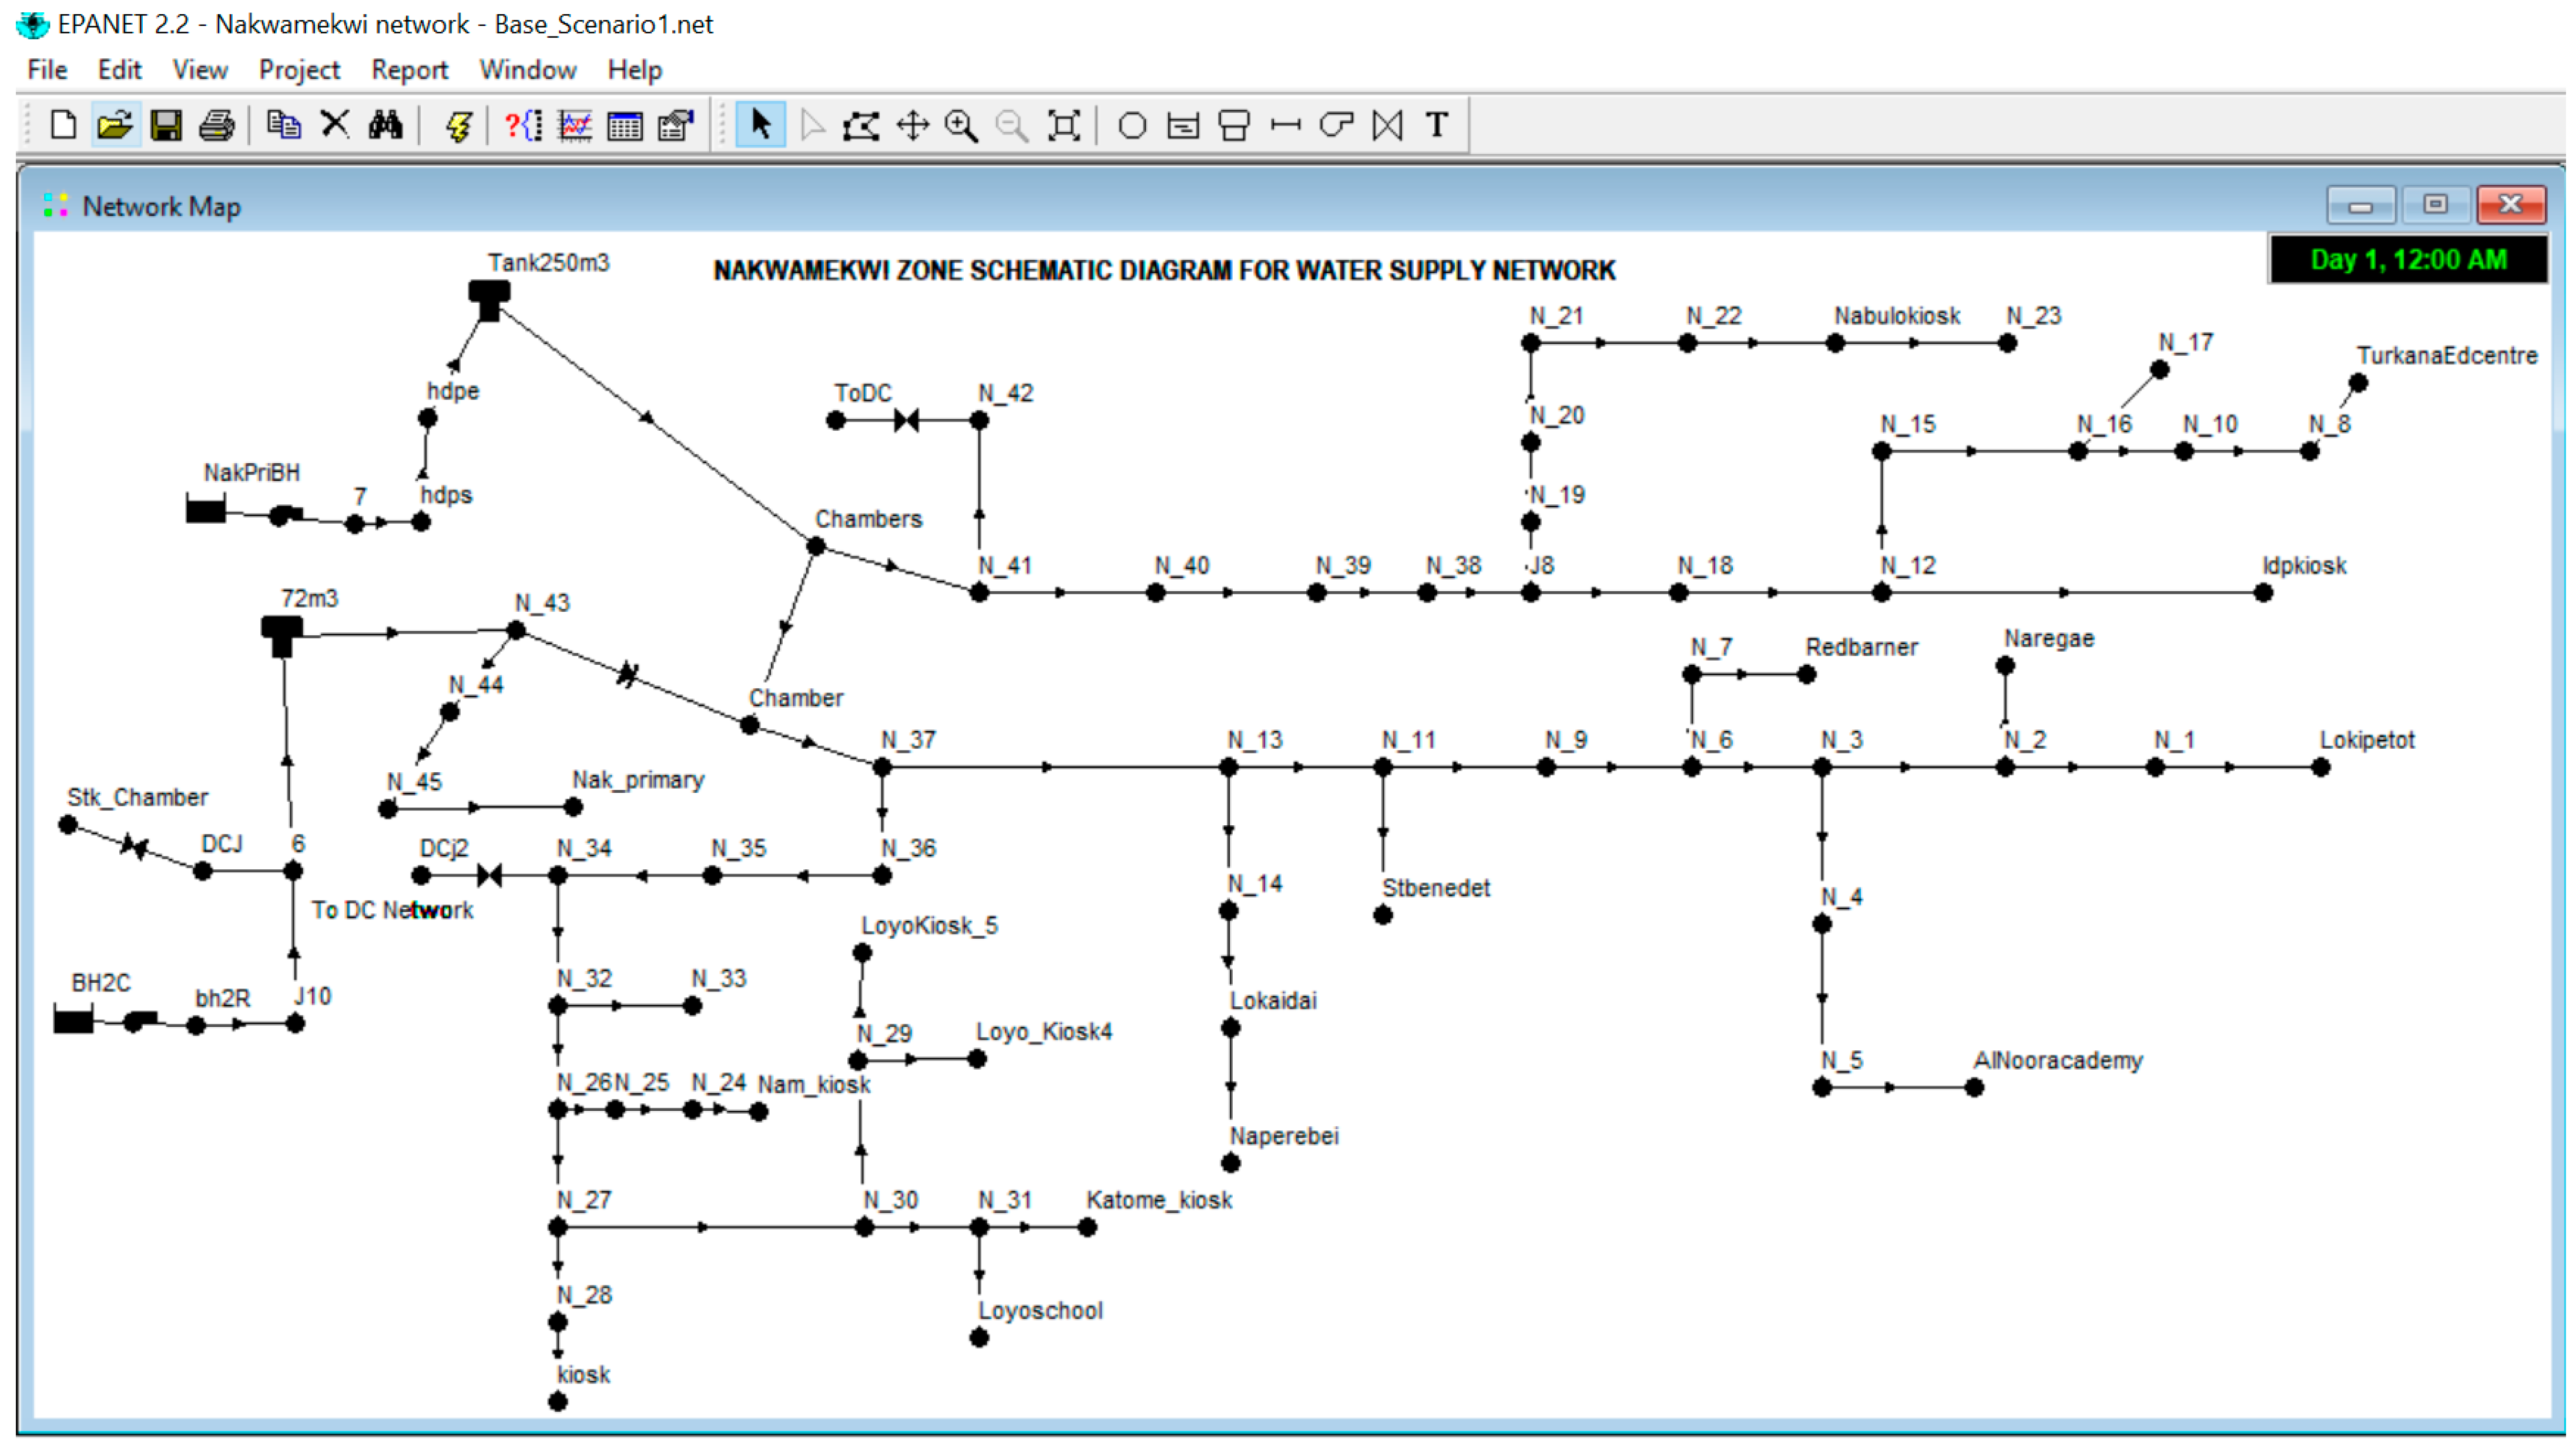
3.2. WDN Simulation and Optimization

Once the WDN has been obtained, its optimization has been achieved following the methodology shown in the flowchart in Figure 3. The process is divided into three main components.
In the water network optimization (blue part of Figure 3 and Section 3.2.1), the process starts by creating a schematic diagram of water supply network elements in the EPANET 2.2 model [50] and characterizing each element using field data. The aim is to provide a coherent representation of the present situation, including the main WDN flaws. Indeed, the WDN had been changed during the recent year, adding new network elements without any hydraulic verification and determining inadequate supply at various points of the network.
The energy optimization component (yellow part of Figure 3 and Section 3.2.2) has the objective of finding pumping patterns with the lowest cost among a population of randomly generated patterns derived from a genetic algorithm, considering some initial pumping schedules as a constraint and the variability of the pumping cost during the day.
The water–energy nexus component (green part of Figure 3 and Section 3.2.3) consists of testing the selected pumping pattern in the EPANET model to verify that each node in the WDN is served in each time step, without the pumps working 24 h a day.

3.2.1. Water Network Optimization

The water network optimization can be conducted using the EPANET 2.2 model. In this study, only the Nakwamekwi water supply zone has been optimized, following the described approach (Figure 4).
The EPANET model was constructed using the field data, which were obtained from the WDN mapping (Section 3.1). In the surveys, all the essential network elements and their properties were collected (Table 2).
In particular, the pipe roughness of 110 for old steel pipes and 150 for new PVC pipes was used to factor in friction losses, while at the nodes suspected to experience leakage, proportionate values of emitter coefficients were set. Water losses due to pipe leakages were simulated by setting up emitter coefficient properties of the pipes to reflect the current state from the following equation:
Q = k P n
where Q is the leakage flow rate, k is the emitter coefficient, P is the pressure in a given node, and n is the pressure exponent. Following the general guidelines for setting coefficient values in EPANET, k has been set following this rule: (i) from 0.001 to 0.01 for small cracks or pinholes in the pipe, (ii) from 0.01 to 0.1 for moderate-sized holes or large cracks, and (iii) from 0.1 to 1.0 for significant raptures or pipe breaks. For very large bursts within sections of the network, the value of k varied between 1.0 and 10.0 to simulate the actual situation on the ground. The actual water demand in each node was evaluated using the Voronoi polygon of distribution nodes and by calculating the population to be served in each area based on the population density in each polygon. The population data in the area were provided by LOWASCO [45,47]. Since the population and the demand do not have a season in which some months require more water than others, only a representative day was modeled in EPANET. Nonetheless, water demand fluctuates during the day, and this has been considered with the demand pattern.
Since the WDN in the town of Lodwar currently has problems in the distribution of water, the model run in EPANET was not successful due to some negative pressures. Therefore, the WDN has been optimized with an iterative process, in which some elements have been changed until a successful run is obtained, which is an indication of a reliable network. Therefore, the results of this iterative process (blue part of the flowchart in Figure 3) are new WDN geometry.

3.2.2. Energy Optimization

The optimization of a water distribution network can be achieved by reducing the energy costs associated with a given water volume or by increasing the water availability in the network with the same energy. For instance, the WDN can be optimized by increasing water availability through reducing leakages within the supply network by employing leakage management strategies [51]. In this study, the optimization was done by just looking at the energy cost of pumping in a hybrid system.
To optimize energy consumption, pumping schedules with the fewest number of pumping hours possible must be found. Daily pumping patterns can be thought of as a vector of 24 elements (one for each hour), with 1 and 0, respectively, for pumps being on or off. A genetic algorithm (GA) was set up in MATLAB R2024ato create random pumping patterns from an initial population, which was used as a constraint. Indeed, a completely random generation would create patterns that are not reliable with very few hours of pumping, causing network disconnection, i.e., negative pressure in some nodes. However, it is not necessary to explore the entire search space of 224, i.e., 16,777,216, daily pumping patterns, as the few optimal solutions must have at least a minimum number of pumping hours in the day. For this reason, the GA was used instead of a complete random generation to create pumping patterns from an initial population with a given mutation rate. Therefore, the parameters of the GA are initial population, mutation rate, and maximum iteration.
The pumping system is a hybrid of solar photovoltaic and grid electricity. According to the utility’s estimates, the cost of running pumps on solar energy is a quarter of the cost of running pumps on grid energy, and in the existing setup, solar energy is available for 9 h a day for all seasons of the year. The energy cost function f ( x ) to determine the cost incurred in running pumps per day is formulated as:
f ( x ) = i = 1 N p t = 0 S t ( E i t × T e )  
where N p is the number of pumps operating within a supply zone, S t represents the number of time steps or the simulation period taken as 24 h for an extended period simulation in this study, and E i t is the energy consumption of pump i during time interval t (kWh). This depends on the pump operation status of on/off and varies with the type and specifications of the pump installed in the borehole. T e is the vector of energy tariff per time step through the simulation period as USD/kWh.
The cost function was evaluated for each generated pattern, and the one with the minimum cost for each run was loaded and tested with an EPANET file “.inp” in an EPANET–MATLAB Toolkit environment developed by Eliades et al. [52] to determine the feasibility of the solutions (see next section).

3.2.3. Water–Energy Nexus

Some of the pumping schedules obtained as described in the previous section may not be reliable, as they may cause negative pressure in the water distribution network. For this reason, the reliability of the generated pumping schedule was conducted using the EPANET–MATLAB toolkit [52], where the optimal pump schedule generated from the genetic algorithm is updated as input.
In case the model run is unsuccessful because of negative pressure in some elements of the network, the model parameters of the genetic algorithm are adjusted, and the procedure described in the previous section is conducted again. If the run in the EPANET–MATLAB toolkit is successful, the pumping schedule is stored. Nevertheless, a successful run is not strictly associated with a fully functioning distribution network, as some schedules can generate positive pressure but still very low pressure among some elements of the WDN. Indeed, according to LOWASCO [53], the common mode of water provision in areas further from the town center is through water kiosks and standpipes requiring a minimum nodal pressure of 2 m [54]. For this reason, the interdependency between water and energy components was tested through optimal schedules of pumps, which resulted in a reliable water supply at a residual node pressure of more than 2 m in all the nodes during the simulation period for the supply zone.

4. Results and Discussion

4.1. Water Distribution Network Mapping Results

Water distribution network mapping with local surveys has produced an updated network map (Figure 5). This result would enable efficient management due to a clear understanding of the network and establishing hotspots associated with leakages and bursts contributing to the current high non-revenue water of 45% [49]. The realized WDN map captures the updated status of the LOWASCO water supply network as of the year 2021 (Figure 5). Three new boreholes, a steel storage tank of 300 m3 in capacity, and an HDPE rising pipe of 6-inch diameter were added to the Nawoitorong supply zone. In the Nakwamekwi supply zone, one borehole was added to the network, while a borehole and its rising main pipes were removed from the network after having been washed away by floods in the year 2019 [48].
The network shown in Figure 5 is for the whole Lodwar municipality. The optimization results of the Nakwamekwi supply zone are shown in the following sections.

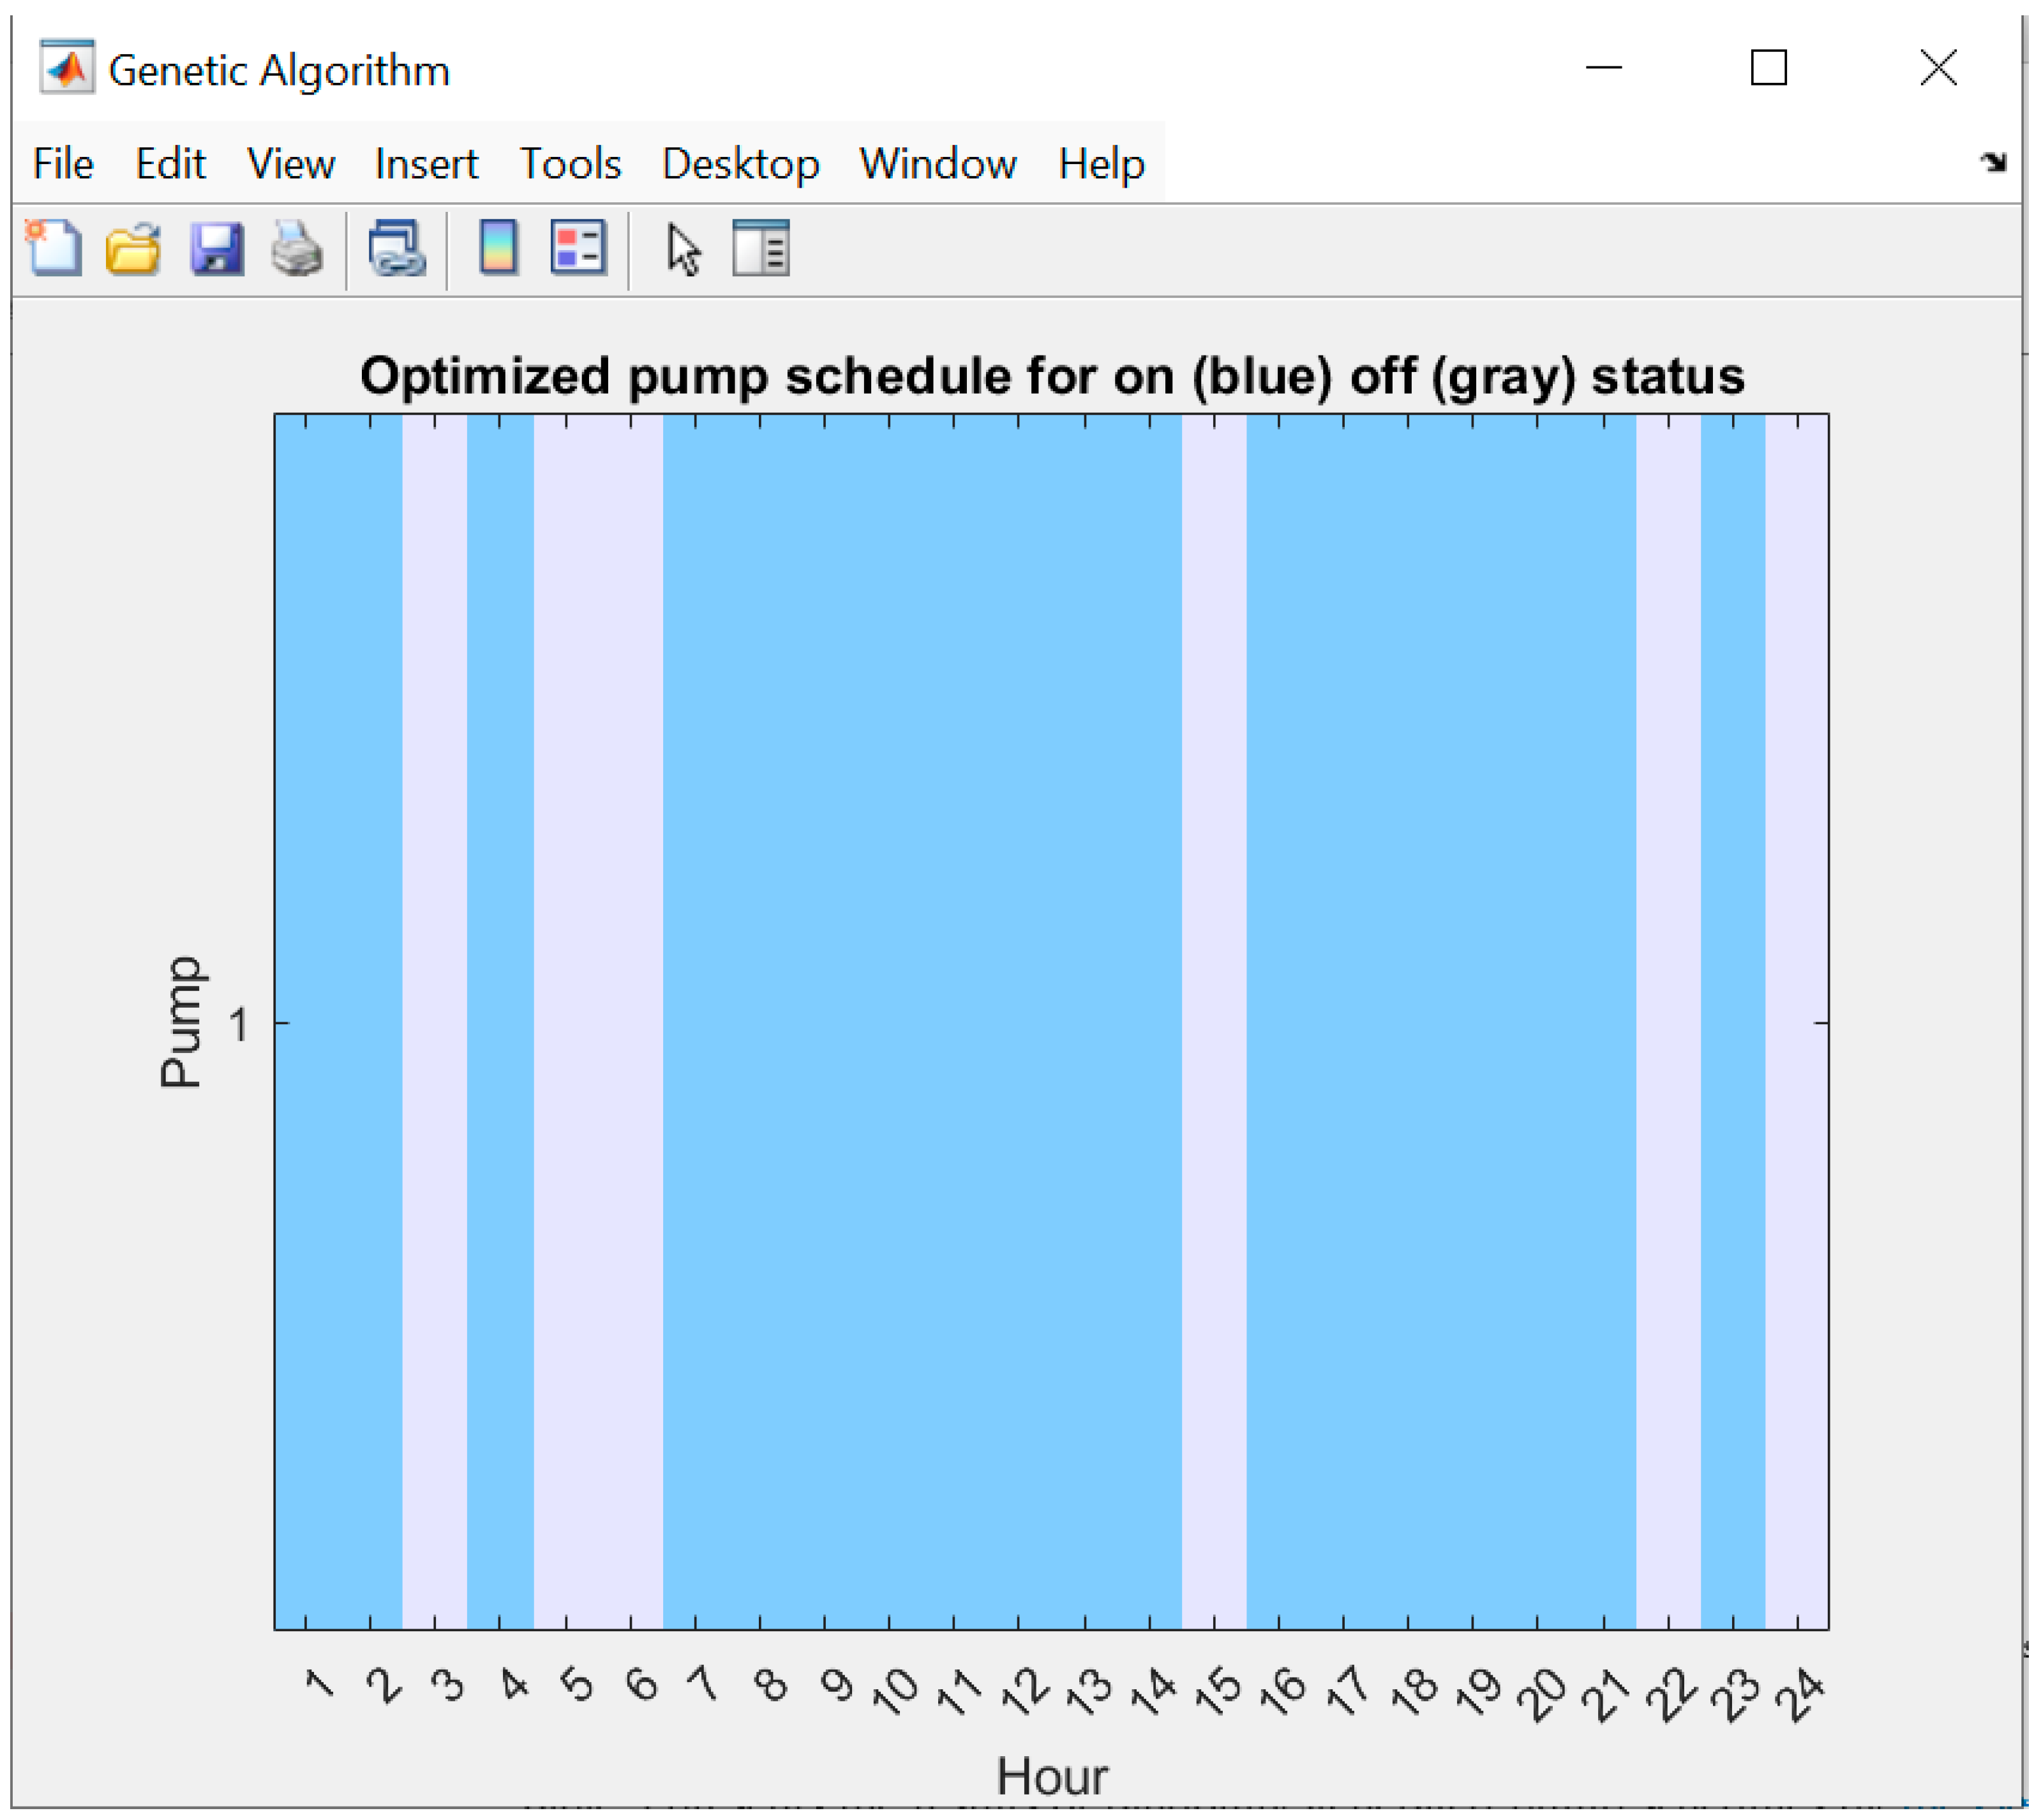
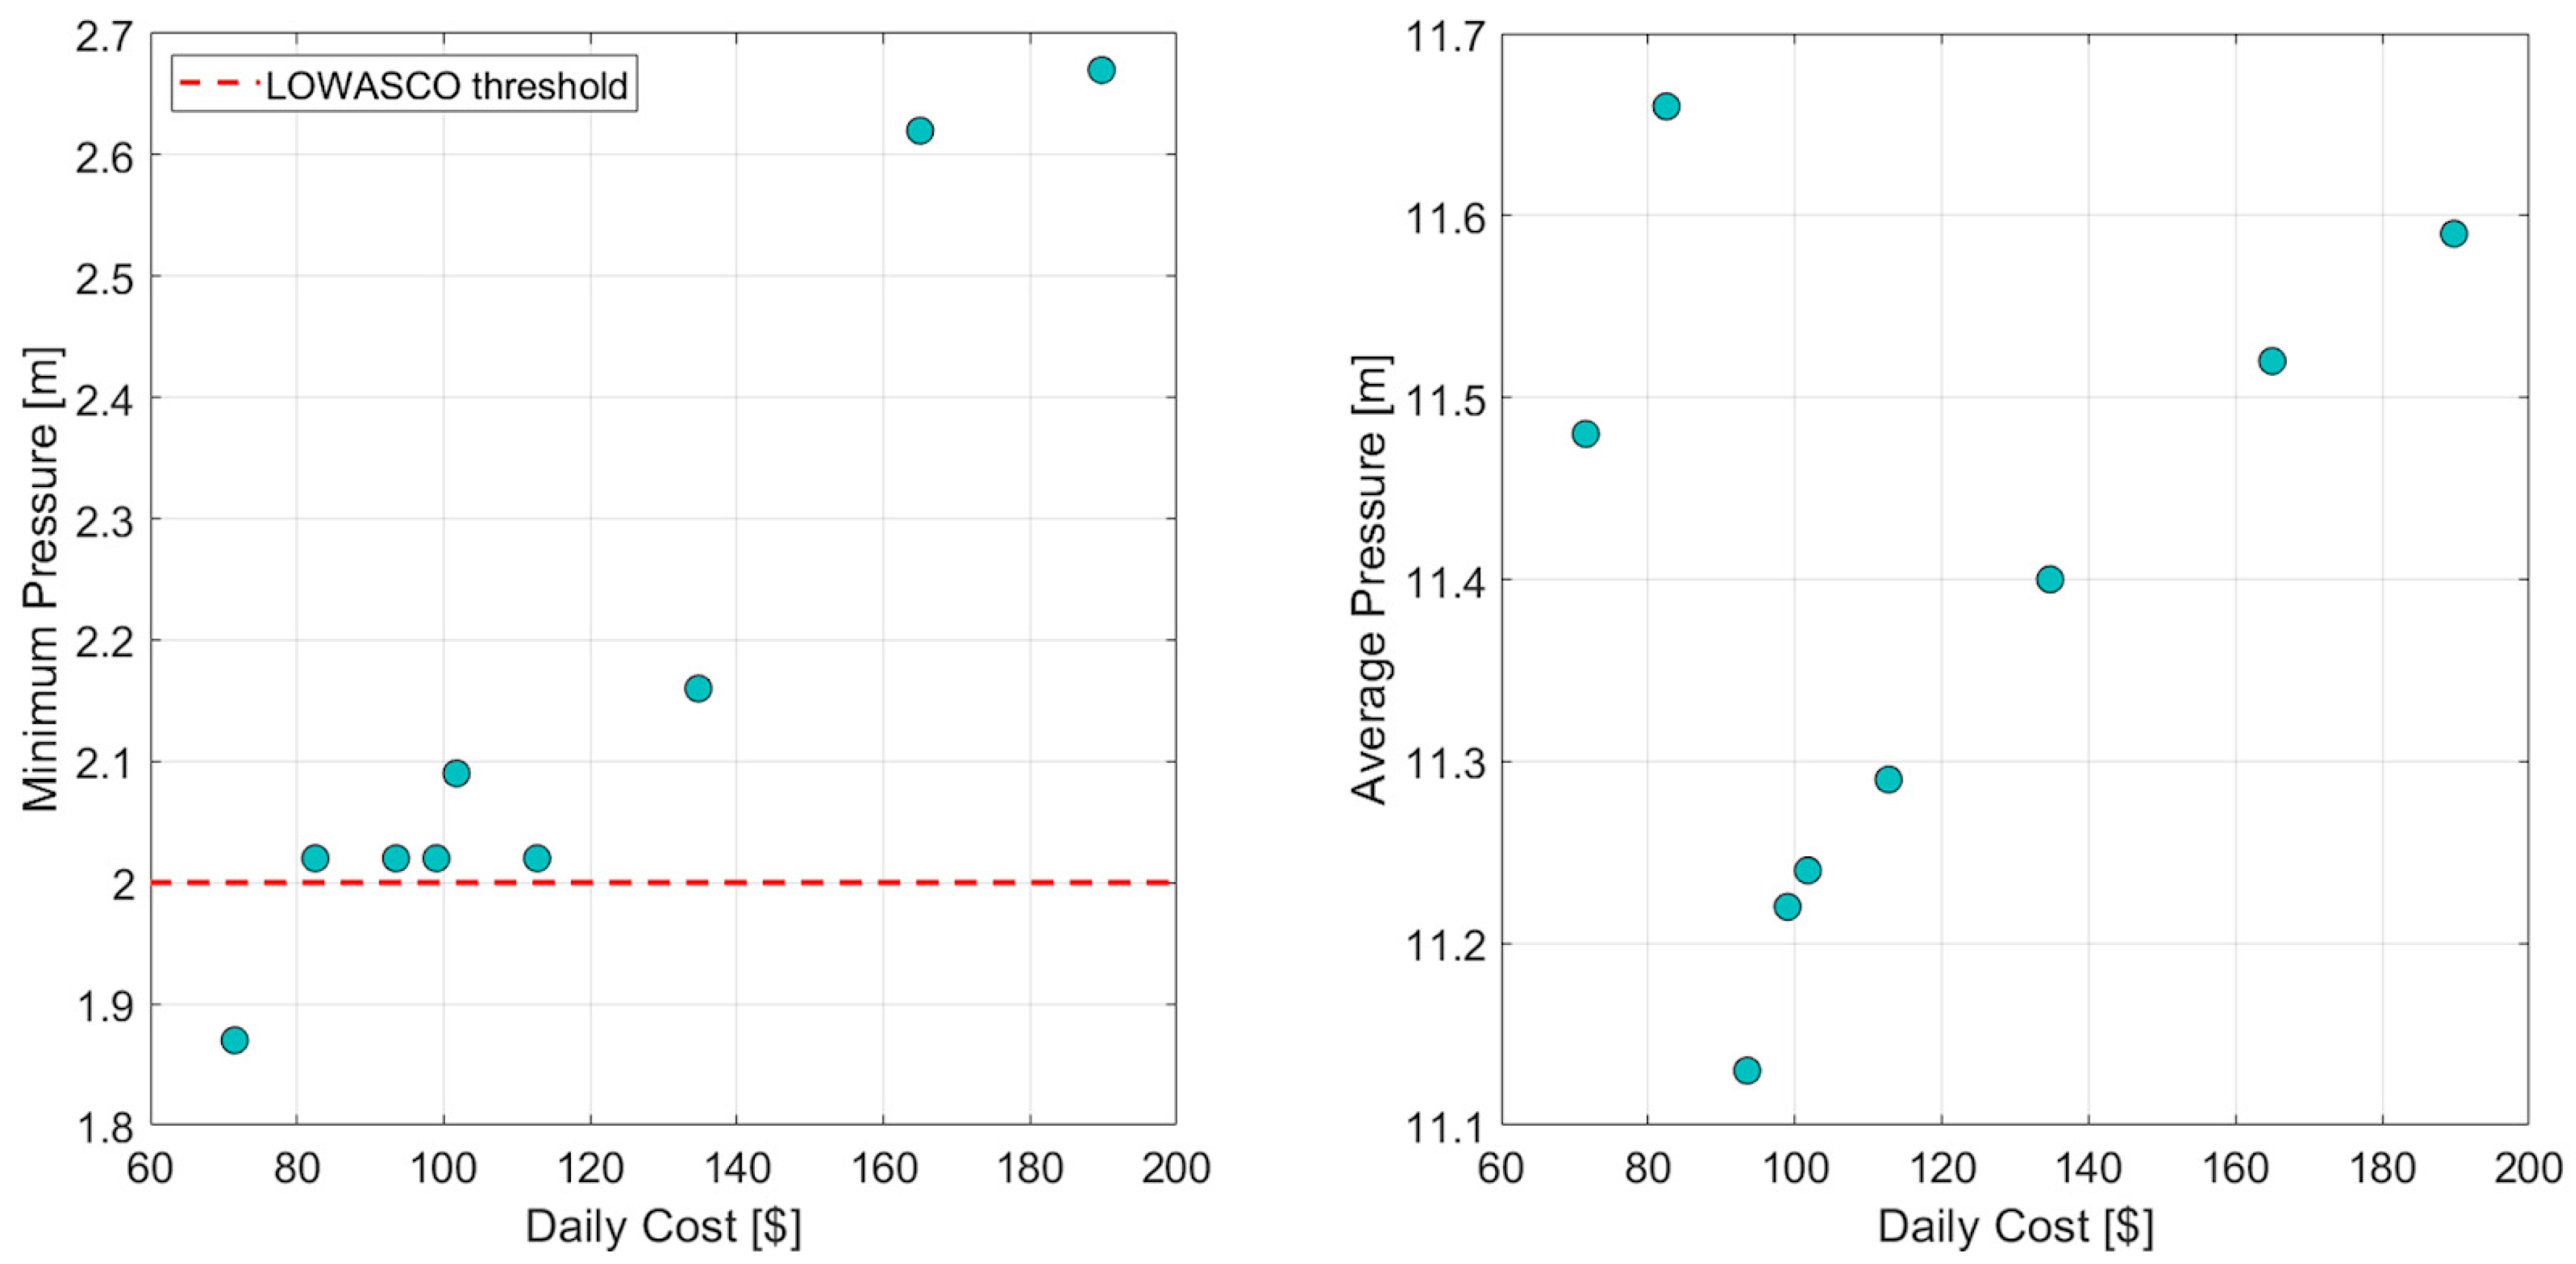
4.2. Water Distribution Network Optimization Results

Nakwamekwi’s current network status is shown in Figure 6, which illustrates network node elevations in green and pipe diameters in blue in the EPANET interface. Figure 6 represents the real status of the network, which experiences high negative pressure because of the low elevation of the tank capacity of 72 m3 at an elevation of 509 m a.s.l. and distribution pipe diameters of 50 mm within the network. The optimized network is proposed to have the masonry tank of 72 m3 replaced with a steel tank raised to a height of 520 m a.s.l. and replacement of distribution pipes of 50 mm diameter to 60 mm diameter within the supply network, as marked in magenta in Figure 6.

4.3. Water–Energy Nexus Results

Since solar energy is cheaper than grid electricity, an initial pumping schedule, from which the genetic algorithm generates random patterns, is shown in Figure 7, which maximizes peak solar hours by ensuring the pumps are on between 08:00 and 16:00. This finding is supported by the conclusion of Urkmez et al. [55], which showed that in an optimized hybrid pumping system, 66.95% of PV energy is required in order to reduce the cost incurred by grid pumping with the use of stochastic optimization.
Table 3 presents the results of randomly generated pump schedules by the genetic algorithm, illustrating the status of the pump in each hour (on “1” or off “0”).
This table presents whether the proposed schedule results in a successful model run in EPANET and the accompanying cost in USD per day for each pattern. Therefore, it shows the reliability of the network based on reaching a minimum pressure in the EPANET simulations. Tao et al. [56] made a similar attempt by coupling genetic algorithms and EPANET simulations to target a balance between economy and reliability. The results indicate that an optimal and cost-effective schedule of USD 82.5 would lead to savings of between 50% and 57% from the current schedule of USD 165 and USD 189.75 when pumps run for between 20 h to 24 h per day. This view of cost saving in water supply systems through GA and hydraulic simulation to pump schedules is also supported by Atkinson et al. [57], who applied GAs and commercial hydraulic simulation, reaching a reduction of the annual operational cost of almost 20% through better utilization of the off-peak electricity tariff periods for pumping.
Different pumping schedules with the same cost can have different results (successful or not), as can be seen by comparing the highlighted schedules in the previous table (Schedules 3 and 5, successful, with Schedules 12 and 13, unsuccessful). Indeed, pumping schedules that follow the water demand pattern have a higher chance of being successful. According to Figure 8, the peak water demand hours are between 4:00 h to 8:00 h and 16:00 h and 20:00 h.
There are a total of 62 water withdrawal nodes considered within the supply zone. A plot of successful cost schedules against minimum pressure and average pressure within the 62 nodes is presented in Figure 9. Figure 9 illustrates the minimum pressure obtained in a single node during the most critical hours associated with the peak of the water demand on the left, while it shows an average pressure considering all the nodes in the same time steps. The pump scheduling scenarios represented in Figure 9 are the first nine scenarios, also shown in Table 3. Since the scenarios are ordered in the table with respect to the daily cost, the first dot on the left is scenario 1 and the last on the right is scenario 9. The first scenario has one of the lowest costs of USD 71.5 /day and results in a minimum node pressure of 1.85 m during the peak demand hours. Nevertheless, the scenario is not reliable, as it is under the threshold of minimum pressure set by [53,54], i.e., the red dashed line in Figure 9 that crosses 2 m. In all the scenarios the average pressure is above 11 m. Scenario 9 in Table 3 (the last point on the right of Figure 9) relates to the current daily prices for the network, as it represents 24 h pumping in a day. This price is determined by the fact that solar and grid energy cost are respectively, USD 0.25 /KWh and USD 1 /KWh. Since the total installed power is 11 KWh and solar energy is available for 9 h in a day, the total price is USD 189.75 /day. Nevertheless, the minimum pressure in this scenario is 0.7 m above the minimum threshold that is needed, resulting in a higher expense than necessary. Indeed, using the pumping schedule of scenario 2, with a cost of USD 82.5 /day, the WDN is reliable, reducing cost by 57%. The cost could be reduced even more by considering the optimization of the water distribution network by reducing leakages [52]. Moreover, this study optimized the network by considering the actual availability and demand of water in the city of Lodwar. Therefore, future development will consider improving the methodology by considering leakage management, climate change, and population growth for a more in-depth analysis that can also guarantee the future reliability of the water distribution network.

5. Conclusions

This work presented a methodology to optimize a water distribution network that allows the distribution of water at the minimum cost of energy. Specifically, the procedure is based on a genetic algorithm that creates pumping schedules coupled with a hydraulic simulator EPANET to test the reliable ones. This study illustrates the possibility of enhancing water supply infrastructure in dryland urban settings by integrating the principles of the water–energy nexus, as the results have shown how the water distribution network can supply water by saving 50% of the energy with respect to the current situation. Moreover, this study demonstrates the potential of using a water–energy nexus approach to optimize the water supply infrastructure in a data-scarce dryland urban setting. Indeed, this work used almost no information except for that which has been retrieved from local surveys and uses an open and freely available hydraulic model. Therefore, this study could represent a model for other studies that want to replicate the approach in areas with a lack of information. The best configuration of the model, i.e., the selected pumping schedules, also allows a reduction in the average pressure on the network, which implies a decrease in water losses due to leakages as well. The water–energy nexus is a promising approach that can be easily followed with data scarcity constraints. This research highlights the possibility of developing optimization frameworks to enhance the sustainability of water infrastructure in dryland urban settings from a holistic nexus-based framework.
Optimizing energy and water in dryland areas is fundamental to increasing the resilience of communities and adapting them to the new challenges of the future when the population will increase in a changing climate.

Author Contributions

Conceptualization, C.O.M., Z.I.O. and P.M.A.O.; methodology, C.O.M., Z.I.O., M.L. and M.D.B.; software, C.O.M. and M.L.; validation, T.P., M.D.B. and M.L.; formal analysis, C.O.M.; investigation, C.O.M. and G.O.O.; resources, Z.I.O. and E.C.; data curation, C.O.M. and M.L.; writing—original draft preparation, C.O.M.; writing—review and editing, E.C., M.L., T.P., M.D.B. and C.O.M.; visualization, C.O.M., M.L. and T.P.; supervision, Z.I.O., P.M.A.O., G.O.O. and E.C. All authors have read and agreed to the published version of the manuscript.

Funding

This document is an output from the REACH programme funded by UK Aid from the UK Foreign, Commonwealth and Development Office (FCDO) to benefit developing countries (Programme Code 201880). However, the views expressed and information contained in it are not necessarily those of or endorsed by FCDO, which can accept no responsibility for such views or information or any reliance placed on them.

Data Availability Statement

Apart from data which are available within the article, more data can be available on request due to privacy of the utility.

Acknowledgments

We are grateful to Lodwar Water Company (LOWASCO) and the staff for providing us with information and enabling us to access their facilities. Special thanks also go to the Erasmus+ KA171 International Credit Mobility(ICM) programme and Università degli Studi di Firenze in Italy, Department of Civil and Environmental Engineering for supporting the work during the Erasmus exchange program period, the county government of Turkana for creating an enabling environment during fieldwork, the University of Nairobi where the study is domiciled, REACH Kenya for their invaluable support during the planning and data collection phases of this study, and to our research assistant Boniface Wagumba for continued support in map development and editing whenever there was such a need.

Conflicts of Interest

The authors declare no conflicts of interest. The funders had no role in the design of the study; in the collection, analyses, or interpretation of data; in the writing of the manuscript; or in the decision to publish the results.

References

  1. Stringer, L.C.; Mirzabaev, A.; Benjaminsen, T.A.; Harris, R.M.; Jafari, M.; Lissner, T.K.; Stevens, N.; der Pahlen, C.T.-V. Climate change impacts on water security in global drylands. One Earth 2021, 4, 851–864. [Google Scholar] [CrossRef]
  2. Koutroulis, A.G. Dryland changes under different levels of global warming. Sci. Total Environ. 2019, 655, 482–511. [Google Scholar] [CrossRef] [PubMed]
  3. Davies, J.; Barchiesi, S.; Ogali, C.J.; Welling, R.; Dalton, J.; Laban, P. Water in Drylands: Adapting to Scarcity Through Integrated Management; IUCN: Gland, Switzerland, 2016; 44p. [Google Scholar]
  4. United Nations Environment Program/Global Resource Information Database (UNEP/GRID). Global Digital Datasets for Land Degradation Studies: A GIS Approach; UNEP/GRID: Geneva, Switzerland, 1991. [Google Scholar]
  5. UNEP. Cities and Drylands: Managing the Complex Relationship Between Cities and Their Dryland Ecosystems; United Nations Environment Programme (UNEP): Nairobi, Kenya, 2006. [Google Scholar]
  6. Li, T.; Wang, Y.; Cui, L.; Singh, R.K.; Liu, H.; Song, X.; Xu, Z.; Cui, X. Exploring the evolving landscape of COVID-19 interfaced with livelihoods. Humanit. Soc. Sci. Commun. 2023, 10, 908. [Google Scholar] [CrossRef]
  7. Olago, D.O. Constraints and solutions for groundwater development, supply, and governance in urban areas in Kenya. Hydrogeol. J. 2018, 27, 1031–1050. [Google Scholar] [CrossRef]
  8. Ghahremaninejad, F.; Hoseini, E.; Fereidounfar, S. Cities in drylands as artificial protected areas for plants. Biodivers. Conserv. 2021, 30, 243–248. [Google Scholar] [CrossRef]
  9. Al-Bakri, J.T.; Shawash, S.; Ghanim, A.; Abdelkhaleq, R. Geospatial Techniques for Improved Water Management in Jordan. Water 2016, 8, 132. [Google Scholar] [CrossRef]
  10. Gain, A.K.; Giupponi, C.; Wada, Y. Measuring global water security towards sustainable development goals. Environ. Res. Lett. 2016, 11, 124015. [Google Scholar] [CrossRef]
  11. Pradhan, P.; Costa, L.; Rybski, D.; Lucht, W.; Kropp, J.P. A systematic study of sustainable development goal (SDG) interactions. Earth’s Future 2017, 5, 1169–1179. [Google Scholar] [CrossRef]
  12. Sadoff, C. Water Security and Sustainable Growth in Drylands. In Proceedings of the 13th International Conference on Development of Drylands, Jodhpur, India, 11–14 February 2019. [Google Scholar]
  13. Sharif, M.N.; Haider, H.; Farahat, A.; Hewage, K.; Sadiq, R. Water–energy nexus for water distribution systems: A literature review. Environ. Rev. 2019, 27, 519–544. [Google Scholar] [CrossRef]
  14. Shammas, N.K.; Wang, L.K. Water Engineering: Hydraulics, Distribution, and Treatment; John Wiley & Sons: Hoboken, NJ, USA, 2015; ISBN 978-0-470-39098-6. [Google Scholar]
  15. Xu, Q.; Chen, Q.; Ma, J.; Blanckaert, K.; Wan, Z. Water saving and energy reduction through pressure management in urban water distribution networks. Water Resour. Manag. 2014, 28, 3715–3726. [Google Scholar] [CrossRef]
  16. Chaibi, M.T.; Soussi, M.; Karnib, A. Enhancing community well-being in African drylands through technology-based solutions in the water–energy–food–ecosystems nexus. Environ. Sci. Water Res. Technol. 2024, 10, 85–104. [Google Scholar] [CrossRef]
  17. Allan, T.; Keulertz, M.; Woertz, E. The water–energy–food nexus: An introduction to nexus concepts and some conceptual and operational problems. In The Water-Energy-Food Nexus in the Middle East and North Africa; Routledge: London, UK, 2017; pp. 13–23. [Google Scholar]
  18. Bideris-Davos, A.A.; Vovos, P.N. Comprehensive Review for Energy Recovery Technologies Used in Water Distribution Systems Considering Their Performance, Technical Challenges, and Economic Viability. Water 2024, 16, 2129. [Google Scholar] [CrossRef]
  19. Kahe, S.; Sharif, A.; Joda, F.; Avami, A.; Kianbakhsh, A. Water-energy nexus in the combined cycle power plant using energy, exergy, economic and environmental analyses. Energy Convers. Manag. 2023, 293, 117493. [Google Scholar] [CrossRef]
  20. Vairavamoorthy, K.; Akinpelu, E.; Lin, Z.; Ali, M. Design of Sustainable Water Distribution Systems in Developing Countries; Water Development Research Unit, Faculty of the Built Environment South Bank University: London, UK, 2001. [Google Scholar]
  21. Wang, S.; Fath, B.; Chen, B. Energy-water nexus under energy mix scenarios using input-output and ecological network analyses. Appl. Energy 2019, 233–234, 827–839. [Google Scholar]
  22. Abegaz, B.W.; Datta, T.; Mahajan, S.M. Sensor technologies for the energy-water nexus—A review. Appl. Energy 2018, 210, 451–466. [Google Scholar] [CrossRef]
  23. Carneiro, J.; Loureiro, D.; Cabral, M.; Covas, D. Comprehensive Resilience Assessment Framework for Water Distribution Networks. Water 2024, 16, 2611. [Google Scholar] [CrossRef]
  24. Carpitella, S.; Brentan, B.; Montalvo, I.; Izquierdo, J.; Certa, A. Multi-criteria analysis applied to multi-objective optimal pump scheduling in water systems. Water Supply 2019, 19, 2338–2346. [Google Scholar] [CrossRef]
  25. Mala-Jetmarova, H.; Sultanova, N.; Savić, D. Lost in Optimisation of Water Distribution Systems? A Literature Review of System Design. Water 2018, 10, 307. [Google Scholar] [CrossRef]
  26. Rao, S.S. Engineering Optimization: Theory and Practice, 4th ed.; John Wiley & Sons Inc.: Hoboken, NJ, USA, 2009. [Google Scholar]
  27. Sangroula, U.; Han, K.-H.; Koo, K.-M.; Gnawali, K.; Yum, K.-T. Optimization of Water Distribution Networks Using Genetic Algorithm Based SOP–WDN Program. Water 2022, 14, 851. [Google Scholar] [CrossRef]
  28. Barnes, P.; Egodawatta, P.; Goonetilleke, A. Modeling resilience in a water supply system: Contrasting conditions of drought and flood. In Proceedings of the 8th Annual Conference of International Institute for Infrastructure, Renewal and Reconstruction: International Conference on Disaster Management (IIIRR 2012), Kumamoto, Japan, 24–26 August 2012. [Google Scholar]
  29. Sahely, H.R.; Kennedy, C.A.; Adams, B.J. Developing sustainability criteria for urban infrastructure systems. Can. J. Civ. Eng. 2005, 32, 72–85. [Google Scholar] [CrossRef]
  30. Awe, O.M.; Okolie, S.T.A.; Fayomi, O.S.I. Optimization of Water Distribution Systems: A Review. J. Phys. Conf. Ser. 2019, 1378, 022068. [Google Scholar] [CrossRef]
  31. Parvaze, S.; Kumar, R.; Khan, J.N.; Al-Ansari, N.; Parvaze, S.; Vishwakarma, D.K.; Elbeltagi, A.; Kuriqi, A. Optimization of Water Distribution Systems Using Genetic Algorithms: A Review. Arch. Comput. Methods Eng. 2023, 30, 4209–4244. [Google Scholar] [CrossRef]
  32. Loucks, D.P.; Van Beek, E. Water Resources Systems Planning and Management: An introduction to Methods, Models and Applications; UNESCO: Paris, France, 2005. [Google Scholar]
  33. Behandish, M.; Wu, Z.Y. Concurrent pump scheduling and storage level optimization using meta-models and evolutionary algorithms. Procedia Eng. 2014, 70, 103–112. [Google Scholar] [CrossRef]
  34. Mackle, G.; Savic, D.; Walters, G. Application of Genetic Algorithms to Pump Scheduling for Water Supply. In Proceedings of the First International Conference on Genetic Algorithms in Engineering Systems: Innovations and Applications, Sheffield, UK, 12–14 September 1995; pp. 400–405. [Google Scholar] [CrossRef]
  35. Ueno, Y.; Mori, K. Optimizing pump operation scheduling for water supply systems. In Proceedings of the 2014 International Conference on System Science and Engineering (ICSSE), Shanghai, China, 11–13 June 2014. [Google Scholar]
  36. Li, X.; Li, G.; Zhao, X. State Estimation of Municipal Water Supply Network Based on BP Neural Network and Genetic Algorithm. In Proceedings of the 2011 International Conference on Internet Computing and Information Services, Hong Kong, China, 17–18 September 2011; pp. 403–406. [Google Scholar] [CrossRef]
  37. Luna, T.; Ribau, J.; Figueiredo, D.; Alves, R. Improving energy efficiency in water supply systems with pump scheduling optimization. J. Clean. Prod. 2019, 213, 342–356. [Google Scholar] [CrossRef]
  38. Costa, L.H.M.; Ramos, H.M.; de Castro, M.A.H. Hybrid genetic algorithm in the optimization of energy costs in water supply networks. Water Sci. Technol. Water Supply 2010, 10, 315–326. [Google Scholar] [CrossRef]
  39. Jafari-Asl, J.; Monfared, S.A.H.; Abolfathi, S. Reducing Water Conveyance Footprint through an Advanced Optimization Framework. Water 2024, 16, 874. [Google Scholar] [CrossRef]
  40. Mala-Jetmarova, H.; Sultanova, N.; Savic, D. Lost in Optimisation of Water Distribution Systems? A Literature Review of System Operation. Environ. Model. Softw. 2017, 93, 209–254. [Google Scholar] [CrossRef]
  41. Opiyo, F.; Nyangito, M.; Wasonga, O.P. Trend analysis of rainfall and temperature variability in the arid environment of Turkana, Kenya. Environ. Earth Sci. 2014, 8, 30–43. [Google Scholar]
  42. Hirpa, F.A.; Dyer, E.; Hope, R.; Olago, D.O.; Dadson, S.J. Finding sustainable water futures in data-sparse regions under climate change: Insights from the Turkwel River basin, Kenya. J. Hydrol. Reg. Stud. 2018, 19, 124–135. [Google Scholar] [CrossRef]
  43. Tanui, F.; Olago, D.; Dulo, S.; Ouma, G.; Kuria, Z. Hydrogeochemistry of a strategic alluvial aquifer system in a semi-arid setting and its implications for potable urban water supply: The Lodwar Alluvial Aquifer System (LAAS). Groundw. Sustain. Dev. 2020, 11, 100451. [Google Scholar] [CrossRef]
  44. Republic of Kenya. Kenya Population and Housing Census Volume IA. Population Distribution by Administrative Units; KNBS: Nairobi, Kenya, 2009. [Google Scholar]
  45. Republic of Kenya. Kenya Population and Housing Census Volume II, Distribution of Population by Administrative Units; KNBS: Nairobi, Kenya, 2019. [Google Scholar]
  46. Korzenevica, M.; Ng’Asike, P.O.; Ngikadelio, M.; Lokomwa, D.; Ewoton, P.; Dyer, E. From fast to slow risks: Shifting vulnerabilities of flood-related migration in Lodwar, Kenya. Clim. Risk Manag. 2024, 43, 100584. [Google Scholar] [CrossRef]
  47. Lodwar Water and Sanitation Company Ltd. Performance Report 2019. Lodwar Water and Sanitation Company Ltd.: Lodwar, Kenya, (unpublished).
  48. Maxwell, C.O.; Dulo, S.; Olago, D.O.; Odira, P.M.A. Water Availability Analysis of Multiple Source Groundwater Supply Systems in Water Stressed Urban Centers: Case of Lodwar municipality, Kenya. J. Civil. Environ. Eng. 2020, 10, 339. [Google Scholar] [CrossRef]
  49. Water Services Regulatory Board. A Performance Report of Kenya’s Water Services Sector 2020/2021. Available online: https://wasreb.go.ke/impact-reports-issue-no-14/ (accessed on 10 May 2024).
  50. Rossman, L.; Woo, H.; Tryby, M.; Shang, F.; Janke, R.; Haxton, T. EPANET 2.2 User Manual; EPA/600/R-20/133; U.S. Environmental Protection Agency: Washington, DC, USA, 2020. [Google Scholar]
  51. Ávila, C.A.M.; Sánchez-Romero, F.-J.; López-Jiménez, P.A.; Pérez-Sánchez, M. Improve leakage management to reach sustainable water supply networks through by green energy systems. Optimized case study. Sustain. Cities Soc. 2022, 83, 103994. [Google Scholar] [CrossRef]
  52. Eliades, D.G.; Kyriakou, M.; Vrachimis, S.; Polycarpou, M.M. EPANET-MATLAB Toolkit: An Open-Source Software for Interfacing EPANET with MATLAB. In Proceedings of the 14th International Conference on Computing and Control for the Water Industry (CCWI), Amsterdam, The Netherlands, 7–9 November 2016; p. 8. [Google Scholar] [CrossRef]
  53. Lodwar Water and Sanitation Company Ltd. Borehole Summary Report 2016. Lodwar Water and Sanitation Company Ltd.: Lodwar, Kenya, (Unpublished company report).
  54. Republic of Kenya. Practice Manual for Water Supply Services in Kenya; Ministry of Water and Irrigation: Nairobi, Kenya, 2005. [Google Scholar]
  55. Ürkmez, M.; Kallesøe, C.; Bendtsen, J.D.; Leth, J. Scenario Based Cost Optimization of Water Distribution Networks Powered by Grid-Connected Photovoltaic Systems. In Proceedings of the 2023 IEEE Conference on Control Technology and Applications (CCTA), Bridgetown, Barbados, 16–18 August 2023. [Google Scholar]
  56. Tao, Y.; Yan, D.; Yang, H.; Ma, L.; Kou, C. Multi-objective optimization of water distribution networks based on non-dominated sequencing genetic algorithm. PLoS ONE 2022, 17, e0277954. [Google Scholar] [CrossRef]
  57. Atkinson, R.; van Zyl, J.E.; Walters, G.A.; Savic, D.A. Genetic algorithm optimisation of level-controlled pumping station operation. In Water Network Modelling for Optimal Design and Management; Centre for Water Systems: Exeter, UK, 2000; pp. 79–90. [Google Scholar]
Figure 1. Study area location. The water distribution network of the town of Lodwar (d) is managed by the Lodwar Water and Sanitation Company (LOWASCO). The town of Lodwar is in Turkana County (c) in the northwestern part of Kenya (b). The methodology to retrieve the water distribution network data was applied to the entire town, while the optimization procedure was conducted in the Nakwamekwi supply zone (a).
Water 16 03073 g001
Figure 2. Water distribution network mapping conducted through local surveys. The photos show some elements (tanks, pipes, boreholes) that have been measured and localized since there was no clear knowledge about the water distribution network.
Water 16 03073 g002
Figure 3. Flowchart of the methodology, which is divided into three parts: water network optimization to improve the reliability of the actual distribution network; energy optimization to obtain pumping schedules with low costs that are tested in the EPANET model; and water–energy nexus.
Water 16 03073 g003
Figure 4. Schematic diagram of the water supply network for the Nakwamekwi zone in the EPANET model.
Water 16 03073 g004
Figure 5. LOWASCO water supply network map of 2021.
Water 16 03073 g005
Figure 6. Nakwamekwi water supply network. The diameters of the pipes are shown in blue (100 mm) and magenta (50 mm), while the elevation of the nodes in meters above sea level follows the legend in the bottom-right corners. The modifications done on the water distribution network are the following: the 50 mm diameter pipes (magenta) have been increased to 60 mm, while the 72 m3 (green) tank was raised by 11 m.
Water 16 03073 g006
Figure 7. Example of pumping schedule that maximizes energy during solar hours.
Water 16 03073 g007
Figure 8. Water consumption pattern for the Nakwamekwi supply zone. The peak of water demand is from 4:00 h to 8:00 h and 16:00 h and 20:00 h.
Water 16 03073 g008
Figure 9. Network nodal pressure against daily pumping cost scenarios. The minimum pressure obtained in a single node during the peak of the water demand is shown on the left with the LOWASCO threshold of 2 m, i.e., the minimum pressure requirement in the network. The average pressure considering all the nodes in the same time steps is shown on the right.
Water 16 03073 g009
Table 1. Nakwamekwi active water connections in 2021 (Source: WASREB, [49]).
Service TypeNo. of ConnectionsEstimated Average Population Per ConnectionTotal PopulationPer Capita in Liters/DayDaily Demand in Liters
Residential13095654575490,875
Water kiosk 1250 households ×5 30002060,000
Standpipe2010 households ×5 10002020,000
School/Institution5300150057500
Business/Commercial10 5005000
Total1356 12,045620583,375
Table 2. EPANET elements and required inputs for model development.
Element NameProperties Set
Junction (Node)id, elevation, base demand, demand pattern
Reservoirid, description, total head
Tankid, elevation, initial, minimum and maximum level, and diameter
Pipeid, start and end node, length, diameter, roughness
Pumpid, pump curve, pattern
Valveid, start and end node, diameter, type, fixed status
LabelText, font
Table 3. Sample scenarios of pump schedules randomly generated by a genetic algorithm and tested in EPANET.
NoGA Generated Pump Schedule in 24 h Period of Hybrid PumpingSuccessful Run?Actual Cost in USD
1 2 3 4 5 6 7 8 9 10 11 12 13 14 15 16 17 18 19 20 21 22 23 24
10 0 0 0 1 1 1 0 1 1 1 0 0 1 1 1 0 1 1 0 0 0 0 0 Yes71.5
21 0 0 0 1 1 0 0 1 1 1 0 0 1 1 1 1 1 1 0 0 0 0 0 Yes82.5
31 0 0 0 1 1 0 0 1 1 1 0 0 1 1 1 1 1 0 1 1 0 0 0 Yes93.5
41 0 0 0 1 1 0 0 1 1 1 1 1 1 1 1 1 1 0 1 1 0 0 0 Yes99
51 1 0 0 1 1 0 1 1 1 1 1 1 1 1 1 1 1 0 0 0 0 1 0Yes101.75
61 0 0 0 1 1 0 1 1 1 1 1 1 1 1 1 1 1 0 1 1 0 1 0 Yes112.75
70 0 1 0 1 1 0 1 1 1 1 1 1 1 1 1 1 1 1 0 1 1 1 1 Yes134.75
80 1 1 1 1 1 1 0 1 1 1 1 1 1 1 1 1 1 1 1 1 1 0 1 Yes165
91 1 1 1 1 1 1 1 1 1 1 1 1 1 1 1 1 1 1 1 1 1 1 1 Yes189.75
100 0 0 0 0 0 0 1 1 1 1 1 1 1 1 1 0 0 0 0 0 0 0 0No24.75
121 0 1 0 1 0 0 1 1 1 1 1 1 1 1 1 1 0 1 0 1 1 0 0No101.75
131 0 0 0 1 1 0 0 1 1 0 1 0 1 1 1 1 1 0 1 1 0 0 0No93.5
Disclaimer/Publisher’s Note: The statements, opinions and data contained in all publications are solely those of the individual author(s) and contributor(s) and not of MDPI and/or the editor(s). MDPI and/or the editor(s) disclaim responsibility for any injury to people or property resulting from any ideas, methods, instructions or products referred to in the content.

