Article

Assessment of Water Status, Bottom Sediments, Macrophytes in the Light of Index Analysis and Geochemical Parameters of Selected Dam Reservoirs of Kielce Upland (Poland)

by
Anna Świercz
and
Ilona Tomczyk-Wydrych
*
Department of Geomorphology and Geoarchaeology, Institute of Geography and Environmental Sciences, Jan Kochanowski University of Kielce, 7 Uniwersytecka St., 25-406 Kielce, Poland
*
Author to whom correspondence should be addressed.
Water 2024, 16(21), 3072; https://doi.org/10.3390/w16213072
Submission received: 14 August 2024 / Revised: 18 October 2024 / Accepted: 23 October 2024 / Published: 26 October 2024

Abstract

:
Concentrations of trace elements such as Cr, Zn, Cd, Co, Mn, Cu, Ni, Pb, and Fe were investigated in water, bottom sediments, and macrophytes (Phragmites australis and Typha latifolia L.) collected from the Borków, Wilków, and Rejów water reservoirs in the Kielce Upland (Poland). The main objective of this study was to investigate the condition of water, bottom sediments, and macrophytes in selected three sedimentary basins of the Kielce Upland and to identify natural and anthropogenic factors influencing this condition. The secondary objectives were (i) to determine the contents of trace metals in water, bottom sediments, and macrophytes, (ii) to assess the quality of abiotic and biotic elements of the ecosystem based on selected criteria, (iii) to compare reservoirs in terms of pollution, and (iv) to determine the ability of macrophytes to be used as a bioindicator of water/sediment pollution. Field tests were conducted in 2021. The trace metals in water were determined by ETAAS (Cr, Cd, Mn, Cu, Ni, Pb) and FAAS (Zn), and spectrophotometry method (Fe). The trace metals in sediments and macrophytes, including Cr, Zn, Cd, Co, Mn, Cu, Ni, Pb, and Fe, were detected using ICP-OES method. Contamination of bottom sediments with potentially toxic metals was determined based on the geo-accumulation index (Igeo), contamination factor (CF), and pollutant load index (PLI). Statistical analyses were performed using the Statistica PL 13.1. The analyses showed that the accumulation of trace elements in the surface layer of the reservoir sediments increases as follows: in Borków, Cd < Co < Ni < Cu < Pb < Cr < Zn < Mn < Fe; in Wilków, Cd < Co < Cu < Ni < Pb < Cr < Zn < Mn < Fe; and in Rejow, Cd < Co = Cu = Ni = Pb < Zn < Cr < Mn < Fe. It was shown that the average distribution of metals in the bottom sediments of the studied reservoirs was as follows: Borków > Wilków > Rejów. Research has shown that the degree of trace metal accumulation increases as follows: water < sediments < macrophytes (except Pb from the reservoir in Borków).

1. Introduction

The natural environment is modified by human activities. This impact appears in the change of geochemical and biological water (e.g., trophy) and sediment parameters (e.g., potentially toxic elements, PTEs), which then causes changes in the world of biota. The quality of water and bottom sediments in reservoirs depends on both natural and anthropogenic factors [1,2]. Most trace elements and organic compounds entering surface waters are retained in bottom sediments. Trace elements (TEs) are defined as chemical elements which usually do not exceed 1000 μg/kg in soil [3]. TEs include metals and non-metals, including cadmium, lead, mercury, chromium, arsenic, selenium, cobalt, or nickel. Trace elements are often mistakenly referred to as toxic elements. However, it is correct to use the term potentially toxic elements [4], as their toxicity directly depends on concentration and environmental conditions. In non-industrialized areas, the composition of sediment accumulating on the bottom, including the concentration of trace elements, will depend on the lithological structure of the catchment and climatic conditions, which determine the weathering processes and the activation of elements. Anthropopressure is strongly associated with Cd, Cr, Cu, Hg, Ni, Pb, and Zn emissions, which are characterized by increasing environmental concentrations, persistence, and toxicity to living organisms. The enrichment of sediments in potentially toxic metals observed in industrialized areas is primarily the result of anthropogenic activities: use of catchment areas, discharge of wastewater, emission of pollutants into the atmosphere, which, as a result of wet and dry deposition, can be released into the surrounding environment, causing pollution of soils, surface waters, and sediments [5,6,7]. Elements that have had or are currently widely used in the economy, including Zn, Cu, Cr, Cd, Pb, Ni, Hg, as well as persistent organic pollutants (POPs), including polycyclic aromatic hydrocarbons (PAHs) and organochlorine compounds such as organochlorine pesticides and polychlorinated biphenyls (PCBs), are accumulated in sediments [8,9]. Metals accumulated in bottom sediments can be released into the water body as a result of various chemical and biochemical processes or can also be collected directly from the sediments by organisms [10].
The bottom sediments of water bodies constitute an important component of aquatic ecosystems, taking an active part in the geochemical cycle of elements and organic matter. Due to these characteristics, environmental pollution of PTEs is considered a global issue, posing a threat to organisms. Aquatic ecosystems are often the last sinks for trace elements, and therefore it is necessary to comprehensively monitor pollution in order to implement appropriate control measures and prevent irreversible negative effects [11]. Due to the toxic nature of PTEs, there is an obvious need to monitor their content in various environmental components. Analysis of the pollutant content accumulated in the bottom sediments of a reservoir can be used to assess the sources, rates, and pathways of distribution of, for example, metals, as well as changes in their concentrations over time. Sediments are the ultimate storage of pollutants and provide valuable information on the environmental status of catchments [12].
In addition to sediments, macrophytes also have an important function in the aquatic environment—they can absorb heavy metals either from sediments via roots, from water via leaves, or from both sources [13,14]. Macrophytes are widely used to remove, transform, or stabilize heavy metals in water and sediments [15]. These plants are good indicators of anthropopressure as they accumulate pollutants throughout the growing season. Shah et al. [16] confirmed that macrophytes have the ability to collect large amounts of metals from the surrounding water, suggesting that they can be used as in situ biomonitors of reservoir pollution.
Sediment contamination can be assessed using geochemical and bioindicator methods, among others, and can also be evaluated with international index such as those established by NOAA and the EPA [1,2,17]. Geochemical assessment is based on the comparison of potentially toxic metal concentrations at specific sites with the geochemical background. Bioindication, on the other hand, is based on the use of aquatic plants that show abilities to accumulate metals. Studies indicate that the distribution and condition of aquatic plants are often correlated with water and sediment quality. Macrophytes are able to accumulate contaminants at higher concentrations, regardless of their content in the surrounding environment [18]. Species widely recognized as showing correlations between sediment/soil and root metal concentrations are Phragmites australis [19] and Typha latifolia L. [20,21].
The literature presents numerous studies on the accumulation of metals either in sediments, water, or macrophytes [5,13,22,23,24,25,26,27,28]. However, there have been few integrated studies on metal contamination simultaneously in water, sediment, and aquatic plants of rivers [29,30] and reservoir ecosystems [15,31,32,33,34]. Therefore, it was decided to determine the concentration of metals (Cr, Zn, Cd, Co, Mn, Cu, Ni, Pb, and Fe), which are considered potentially toxic elements in water, sediment, and macrophyte samples from three dam reservoirs located in the Kielce Highlands, in order to understand the relationship between biotic and abiotic environmental elements. The main objective of this study was to investigate the condition of water, bottom sediments, and macrophytes in three selected sedimentary basins of the Kielce Upland and to identify natural and anthropogenic factors influencing this condition. The secondary objectives were (i) to determine the contents of trace metals in water, bottom sediments, and macrophytes, (ii) to assess the quality of abiotic and biotic elements of the ecosystem based on selected criteria, (iii) to compare reservoirs in terms of pollution, and (iv) to determine the ability of macrophytes to be used as a bioindicator of water/sediment pollution.

2. Materials and Methods
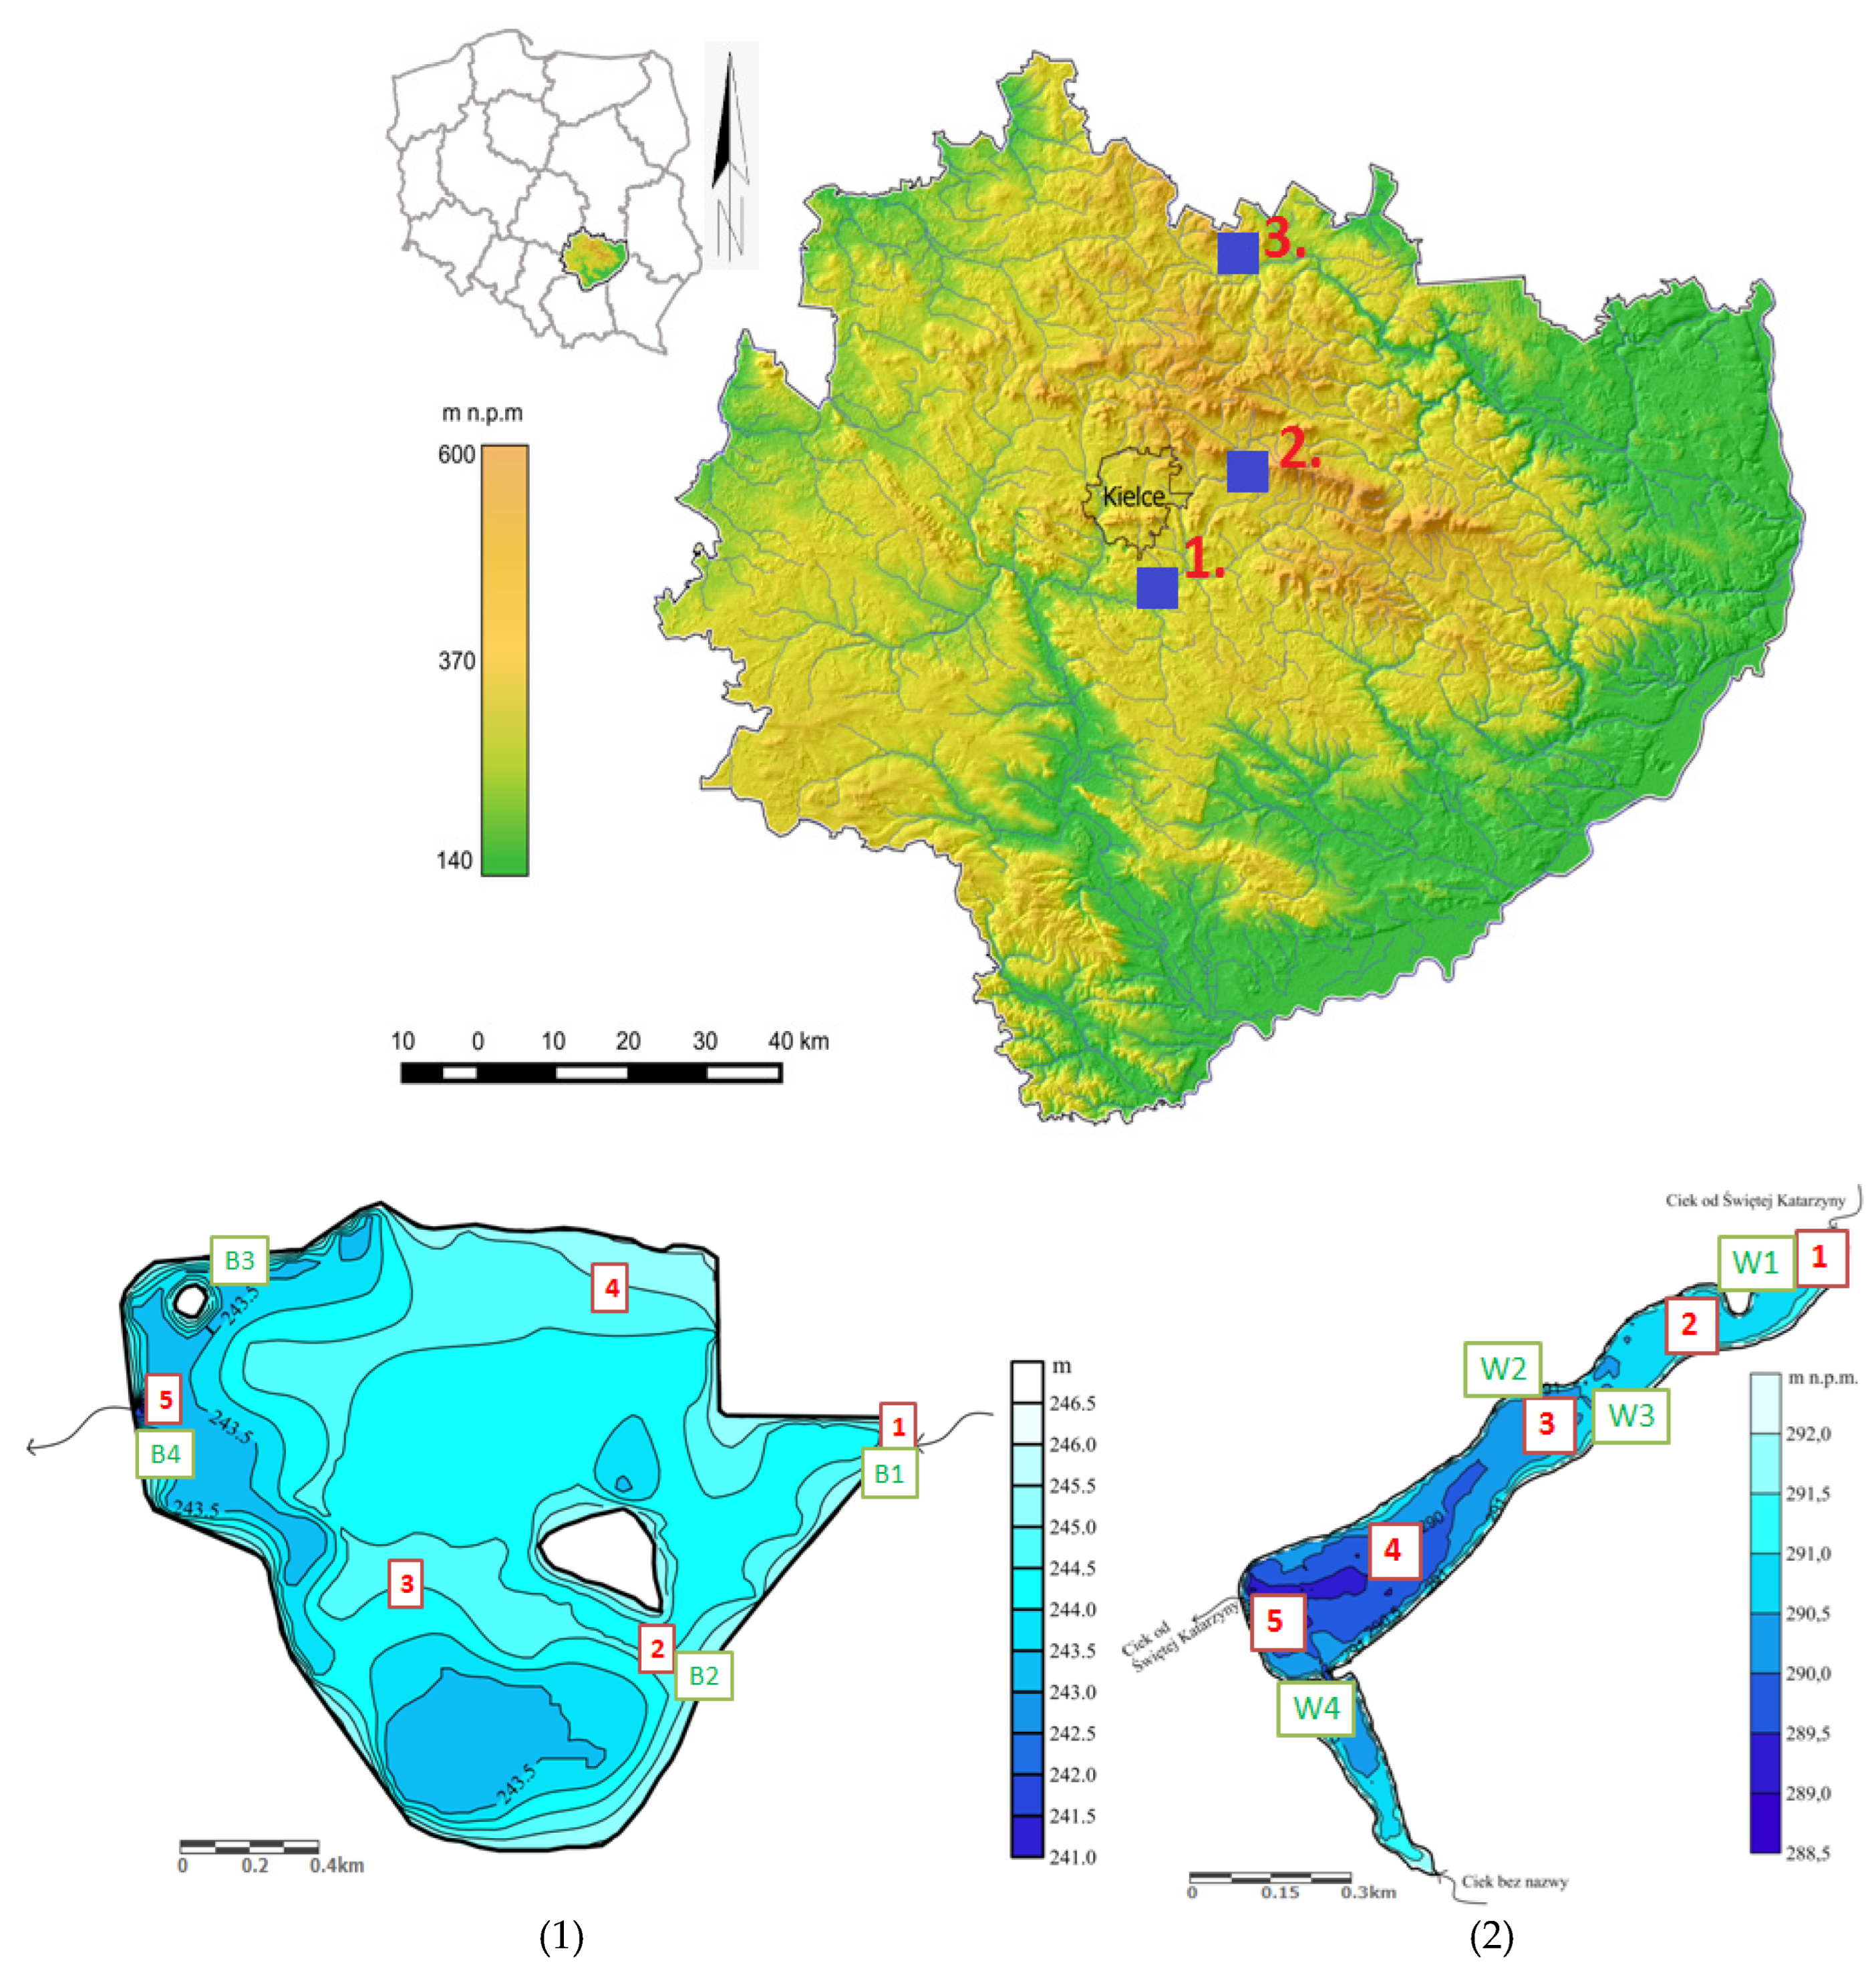
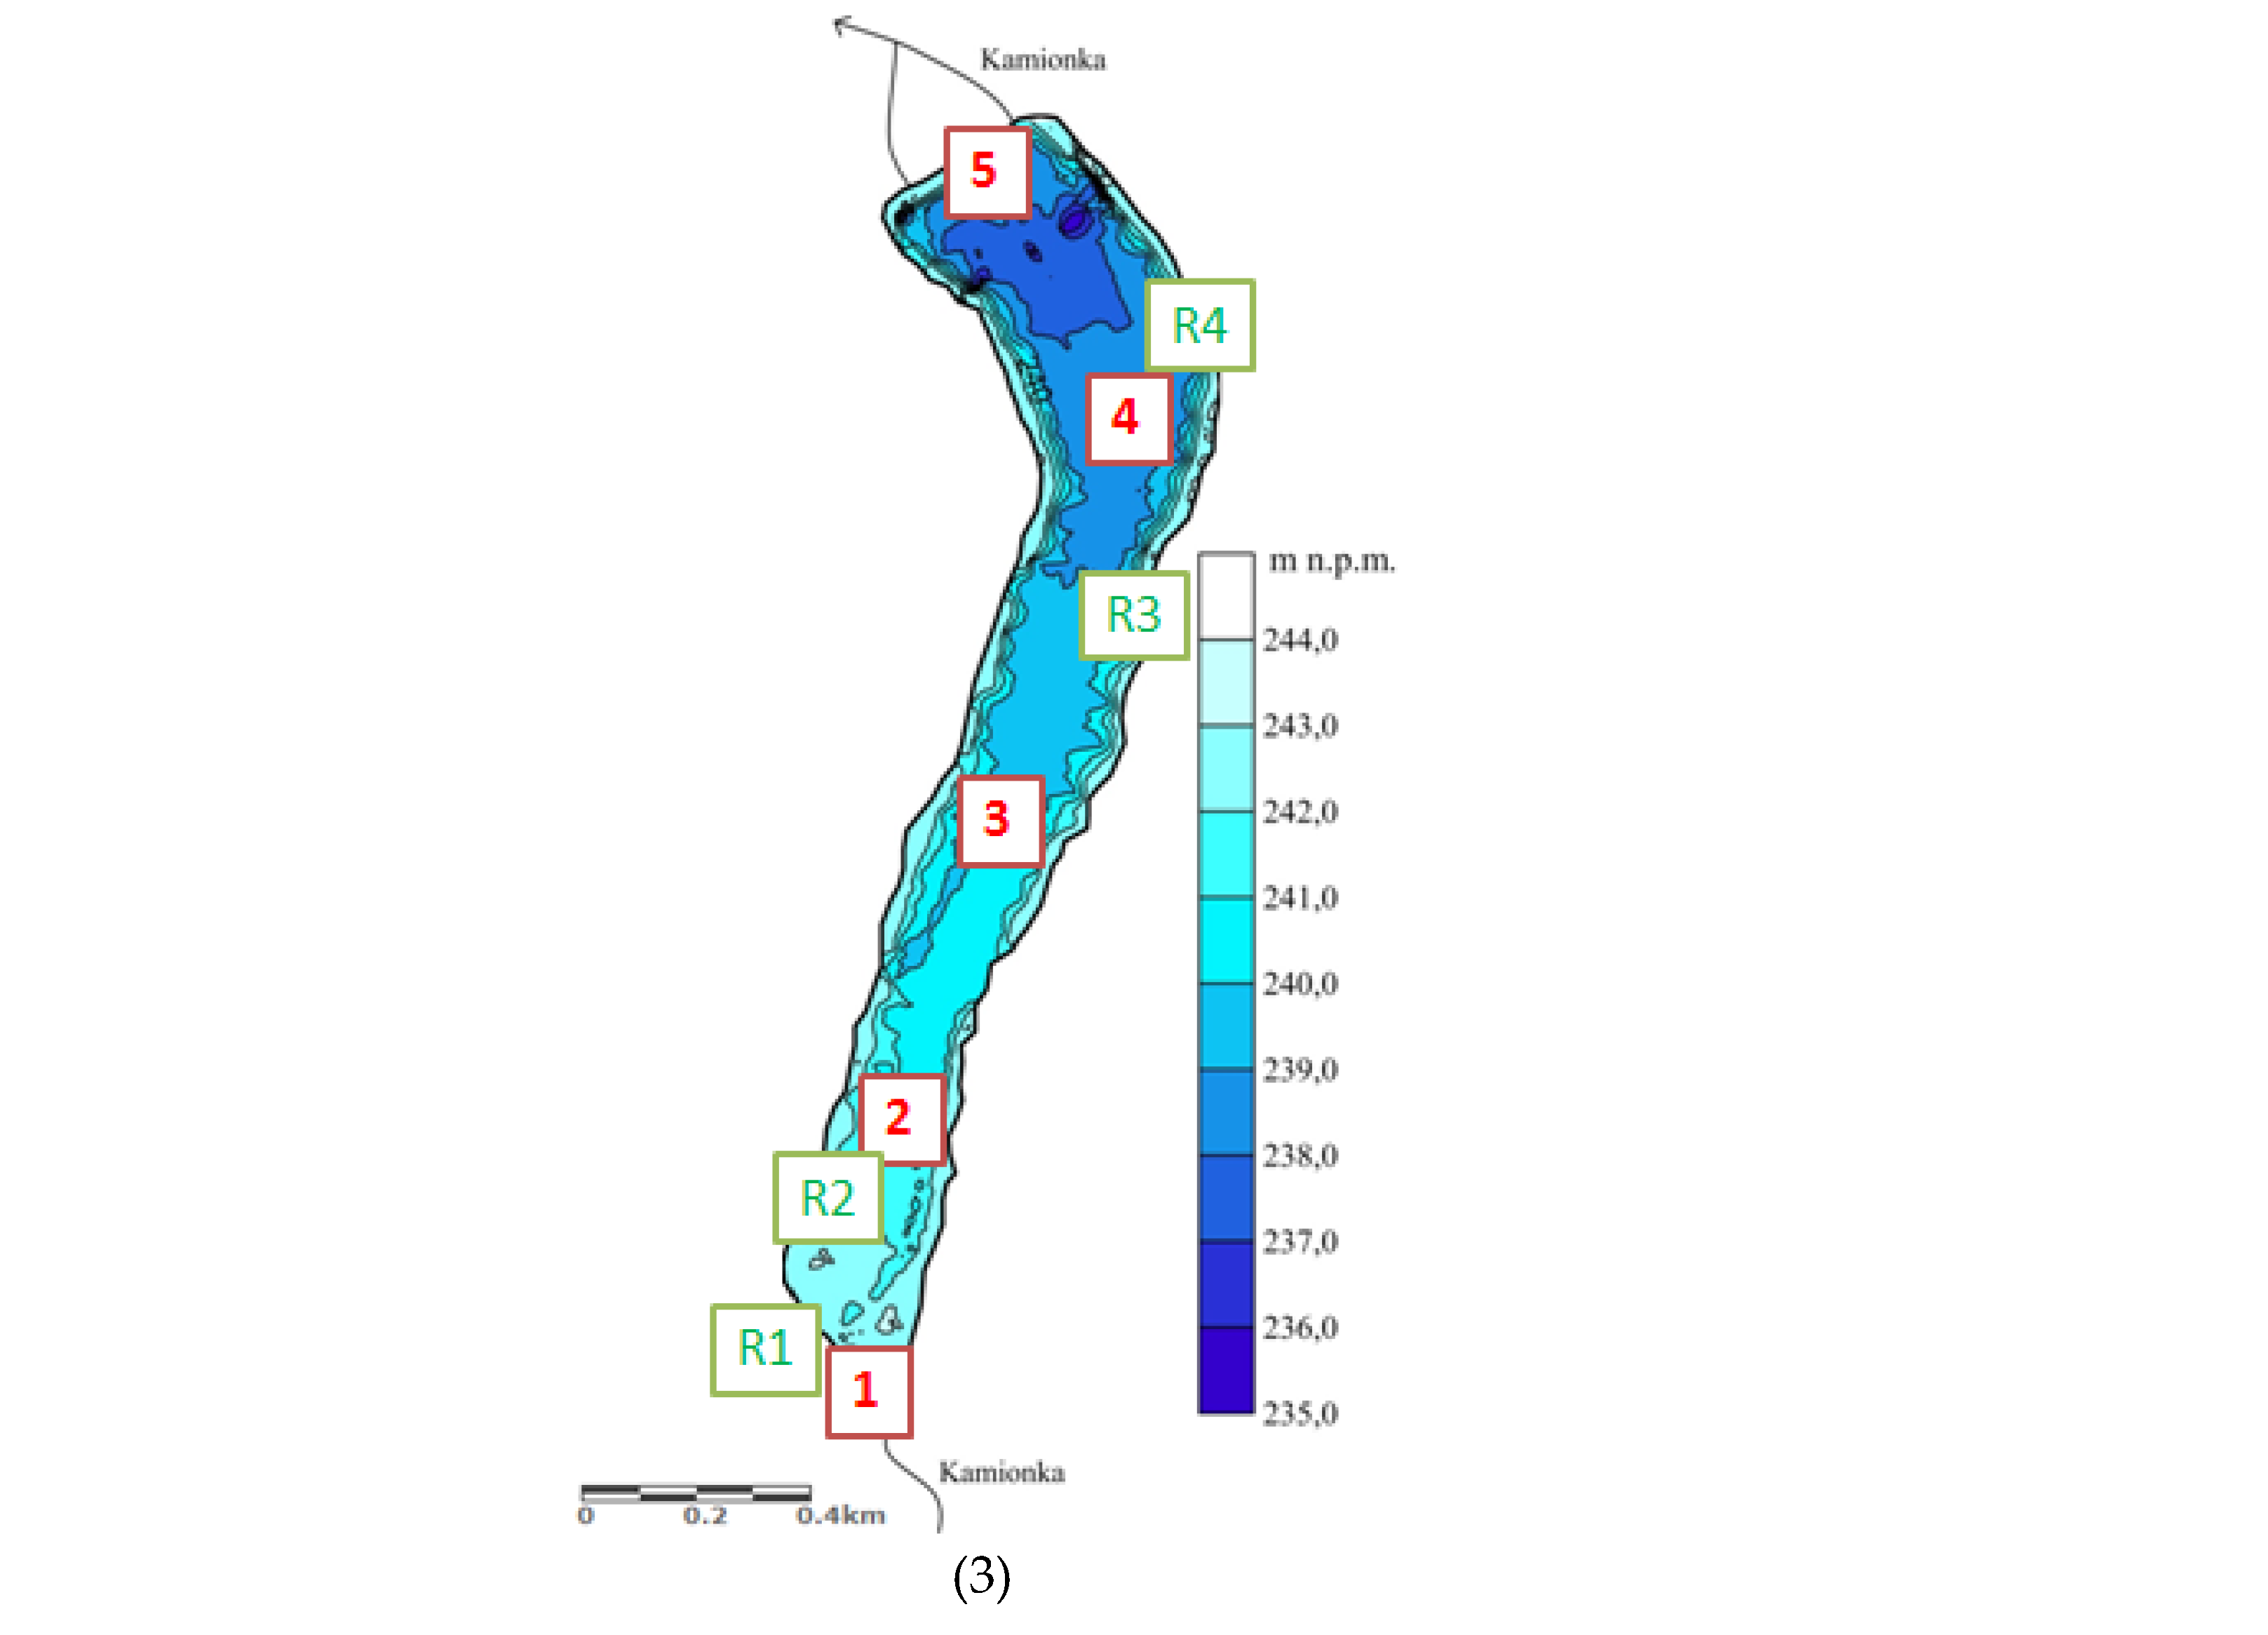
2.1. Study Area

The selected dam reservoirs are Borków (B), Wilków (W), and Rejów (R) located in the Kielce Upland. The Kielce Upland macroregion is located in southeastern Poland and is the central part of the Lesser Poland Upland subprovince. The main element of the geological structure of Kielce Upland is the Upper Cambrian Paleozoic core of the Świętokrzyskie Mountains with its Mesozoic margin, covered locally by Quaternary formations. Tectonically, the area of Kielce Upland is a Laramish (at the turn of the Cretaceous and Tertiary) tectonic uplift, in the central part of which ranges of the strongly undulating Świętokrzyskie Mountains are exposed. Surface waters are the right-bank tributaries of the central Vistula River. There are several retention reservoirs in the area, some with abandoned recreational functions. Groundwater originates from the Triassic, Devonian, Jurassic, Cretaceous, and Neogene periods at various depths, which is determined by the geological structure. The area is dominated by brown soils formed from glacial till, rusty and podzolic soils formed from glacial sands and gravels, flat and gley soils formed from formations influenced by hydration, rendzina formed on carbonate formations, chernozem and black earth on loess formations, and Holocene peats, muck, and muds formed mainly in river valleys [35].
The Borków reservoir is located on the Czarna Nida (Belnianka) River by damming it with an earth dam and weir at river kilometer 36 + 850, at a distance of 14 km southeast of Kielce, on the border of Borków and Słopiec Szlachecki villages. The damming level NPP = 245.50 m above sea level. The volume of water at normal damming is V = 685,600 m3. The reservoir was constructed in 1970–1971 on the site of an existing floodplain. During the 1997 and 2001 floods, the reservoir was damaged. In 1997, the side dike of the reservoir was broken. During the floods of July 2001, there was a construction disaster. As a result of the rapid surge of water in the river, among others, the head dam in the area of damming weir, on both sides of it, and the side dam were broken and the reservoir was completely emptied. The reservoir was taken out of service. In 2003, a water-legal permit was issued for the construction of structures and equipment for the proper reservoir operation. The reservoir is a small retention facility and, due to its small volume, cannot be used for flood purposes, as a result of which water management should consist in letting all the water flowing into it pass through the reservoir. The reservoir has a shape similar to a trapezoid in plan, with a long base of about 650 m located on the northern side and a short base of about 210 m located on the southern side. The river enters the reservoir from the eastern side, dividing it by a channel practically in half. The inlet to the reservoir is triangular in shape with a deviation towards the south. The river in this area rapidly loses its rate, depositing the transported mineral suspension. Currently, the region is silted and overgrown with very dense aquatic vegetation (mainly common reed) [36].
The Wilków reservoir is created on a watercourse from Święta Katarzyna at kilometer 4 + 281, at a distance of 20 km northeast of Kielce, in the village of Wilków. It was put into operation in 2004. The damming element is an earth dam with a length of 390 m. The dam, located just below the junction of the main watercourse and its unnamed tributary, dams the waters of both these watercourses, hence the reservoir is L-shaped in plan. The spillway structure, combining an overflow and spillway, was designed in the form of a tower overflow with a reinforced concrete structure in the shape of a hexagon with a length of overflow edges of 21.5 m. It provides damming of the reservoir waters to the ordinate of NPP = 292.00 m above sea level. The average elevation of the basin of this reservoir, the gradient of which exceeds 300 m, is 342 m above sea level. Currently, the reservoir has a retention and recreational function [37].
The Rejów reservoir is located in Skarżysko-Kamienna, 40 km northeast of Kielce. It was formed as a result of partitioning the valley of the Kamionka River, a right-bank tributary of the Kamienna River. The reservoir dams the waters of the Kamionka River by means of an earth dam. An overflow weir and a bottom bleeder are built into the dam body. The slopes on the downstream side are reinforced with concrete slabs, and on the upstream side they have been sown in grass. On the banks, the edges of Pleistocene terrace of the artificial Rejowski Lagoon, there are numerous landslides associated with lake abrasion. These landslides also occur close to buildings and roads. Mass movements become active after heavy precipitation [38]. The reservoir was created in the early 19th century. The fact that the reservoir is missing from the map of the early 20th century can be related to the destruction of dam as a result of the First World War hostilities. The Rejów reservoir reappears on the 1938 map, and it continues to function to this day. After the First World War, it was rebuilt to secure the water needs of the MESKO Metal Works. The basin lies within the boundaries of the Old Polish and Central Industrial District, which resulted in the remodeling of its valley and the river itself to meet the needs of the rapidly developing industry based on the mining and processing of iron ore. Nowadays, the reservoir fulfills retention, equalization and recreational functions [38].
The selected dam reservoirs are differ in age, capacity, catchment area, and land use. This suggests that the sedimentological and geochemical diversity of bottom sediments may differ, which may be the result of anthropogenic pressure (Table 1).

2.2. Field Sampling and Chemical Analysis

The study was conducted from June to July 2021. Water and bottom sediments were collected from five sites designated in each reservoir taking into account the location: bottom, outflow, and inflow (Figure 1). Water for laboratory analysis was collected with a telescopic scoop. At each sampling site, five water samples were obtained for laboratory analysis, and the result was averaged. Surface sediments were collected from a pontoon with a bottom sediment catcher type Van Veen by Eijkelkamp. Five sediment samples were collected from each site, and then the result was averaged. Water and sediment were placed in appropriately labeled polyethylene containers and sealed. The study sites are characterized by typical rush vegetation for water bodies, mainly common reed (Phragmites australis) and bullrush (Typha latifolia L.). Macrophytes (Phragmites australis and Typha latifolia L.) were collected with a plant grab (Figure 1). Aboveground parts of submerged macrophytes were thoroughly rinsed to completely remove sediment, algae, and invertebrates. Plant surfaces (roots and rhizomes) were cleaned with deionized water and, after identification, placed in zip-lock bags with waterproof labels. A species of common reed (Phragmites australis) was identified in the Borków and Rejów reservoirs, while in Wilków, a species of bullrush (Typha latifolia) was identified.
The pH and Cr, Zn, Cd, Mn, Cu, Ni, Pb, Fe concentrations were determined in water samples. Physio–chemical analyses were carried out in an accredited testing laboratory (accreditation for testing laboratory No. AB 1779 issued by Polish Center for Accreditation), using the electrochemical atomic absorption spectrometry (ETAAS) method for the determination of Cr, Cd, Mn, Cu, Ni, Pb, the flame atomic absorption spectrometry (FAAS) method for Zn, and the spectrophotometric method for Fe. The pH of water and sediment was determined by potentiometric method according to PN-EN 15933:2013-02E [39] using an Elmetron pH meter with a pH-EPS-1 electrode (Elmetron, Zabrze, Poland). The grain size of bottom sediments was analyzed by sieve method and laser diffraction method using a “Mastersizer 3000” (Malvern, UK). The results were converted using the Folk-Ward [40] grain size parameters in the “GRANULOM” program with help of Paweł Przepióra (Department of Geomorphology and Geoarchaeology, Institute of Geography and Environmental Sciences, Jan Kochanowski University in Kielce). CaCO3 was determined using the Scheibler method. The analysis of trace metal content in bottom sediments was carried out in an accredited laboratory according to the following procedure: drying of sediments, sieving (with holes < 2 mm), mineralization (with aqua regia in a CEM Mars 6 microwave mineralizer), and analysis of metals by inductively coupled plasma atomic emission spectrometry (ICP-OES) technique using an Agilent Technologies model 5100 SVDV (Santa Clara, CA, USA) emission spectrometer.
The macrophytes (roots and rhizomes) were left to dry, and then were ground with a grinder to obtain a sample with as uniform a particle diameter as possible. In the material thus prepared, trace metals were determined in an accredited laboratory: Cr, Zn, Cd, Co, Mn, Cu, Ni, Pb, Fe by inductively coupled plasma atomic emission spectrometry technique (ICP-OES) using an Agilent Technologies model 5100 SVDV emission spectrometer. Quality control and method validation were done using standard reference materials.

2.3. Statistical Analysis

Statistical analyses were performed using the Statistica PL 13.1 package. For each potentially toxic metal, the mean value (M) and standard deviation (SD) were determined. An analysis of variance (ANOVA) was performed to assess the significance of differences between tanks, and a post hoc analysis—a paired comparison test—was used when significant differences were found. A Kruskal Wallis ANOVA was used, and Shapiro–Wilk test results: p < 0.05. A significance level of 0.05 was assumed.

2.4. Assessment of the Contamination of Bottom Sediments

The geoaccumulation index (Igeo), the contamination index (CF), and the pollutant load index (PLI) were used to assess the contamination of bottom sediments with potentially toxic metals, which were compared with the results obtained for other reservoirs.

2.4.1. Geo-Accumulation Index (Igeo)

The geoaccumulation index (Igeo) proposed by Müller [41]) was used to assess the metal contamination level of sediments. The geoaccumulation index consists of seven classes, the highest of which reflects a 100-fold enrichment relative to the geochemical background (Table 2):
Igeo = log 2(Ci/1.5Cn),
where: Ci—concentration of the analyzed element in sediment [mg/kg], Cn—geochemical background for the analyzed element (Cr = 5 mg/kg, Zn= 48 mg/kg, Cd = 0.5 mg/kg, Co = 2 mg/kg, Cu = 6 mg/kg, Ni = 5 mg/kg, Pb = 10 mg/kg [42], Mn = 770 mg/kg, Fe = 18,000 mg/kg [17]); 1.5—a factor that takes into account the lithological variability of the catchment.

2.4.2. CF Contamination Factor

Another index that has been introduced to classify the quality of environmental samples is the contamination factor (CF) (Table 3):
CF = Ci/Cn,
where: Ci—concentration of the analyzed element in bottom sediment [mg/kg], oraz Cn—geochemical background for the analyzed element [mg/kg] [43]. The background values were taken as: Cr = 5 mg/kg, Zn= 48 mg/kg, Cd = 0.5 mg/kg, Co = 2 mg/kg, Cu = 6 mg/kg, Ni = 5 mg/kg, Pb = 10 mg/kg [42], Mn = 770 mg/kg, Fe = 18,000 mg/kg [17].
CF coefficients were calculated for Cr, Zn, Cd, Co, Cu, Ni, Pb, Mn, and Fe, for which geochemical background values are available.

2.4.3. PLI Index

The Igeo and CF indices allow assessing the contamination of bottom sediments individually for each element, while the total contamination of bottom sediments by heavy metals was assessed using the PLI index [43].
P L I = ( C F 1 · C F 2 · C F n ) 1 / n
where: n—number of elements analyzed, CFi—contamination index for the element analyzed.
The values of the PLI index allow to assess the contamination of bottom sediments with heavy metals to one of two classes: uncontaminated (PLI = 1) or contaminated (PLI > 1) [44].

3. Results

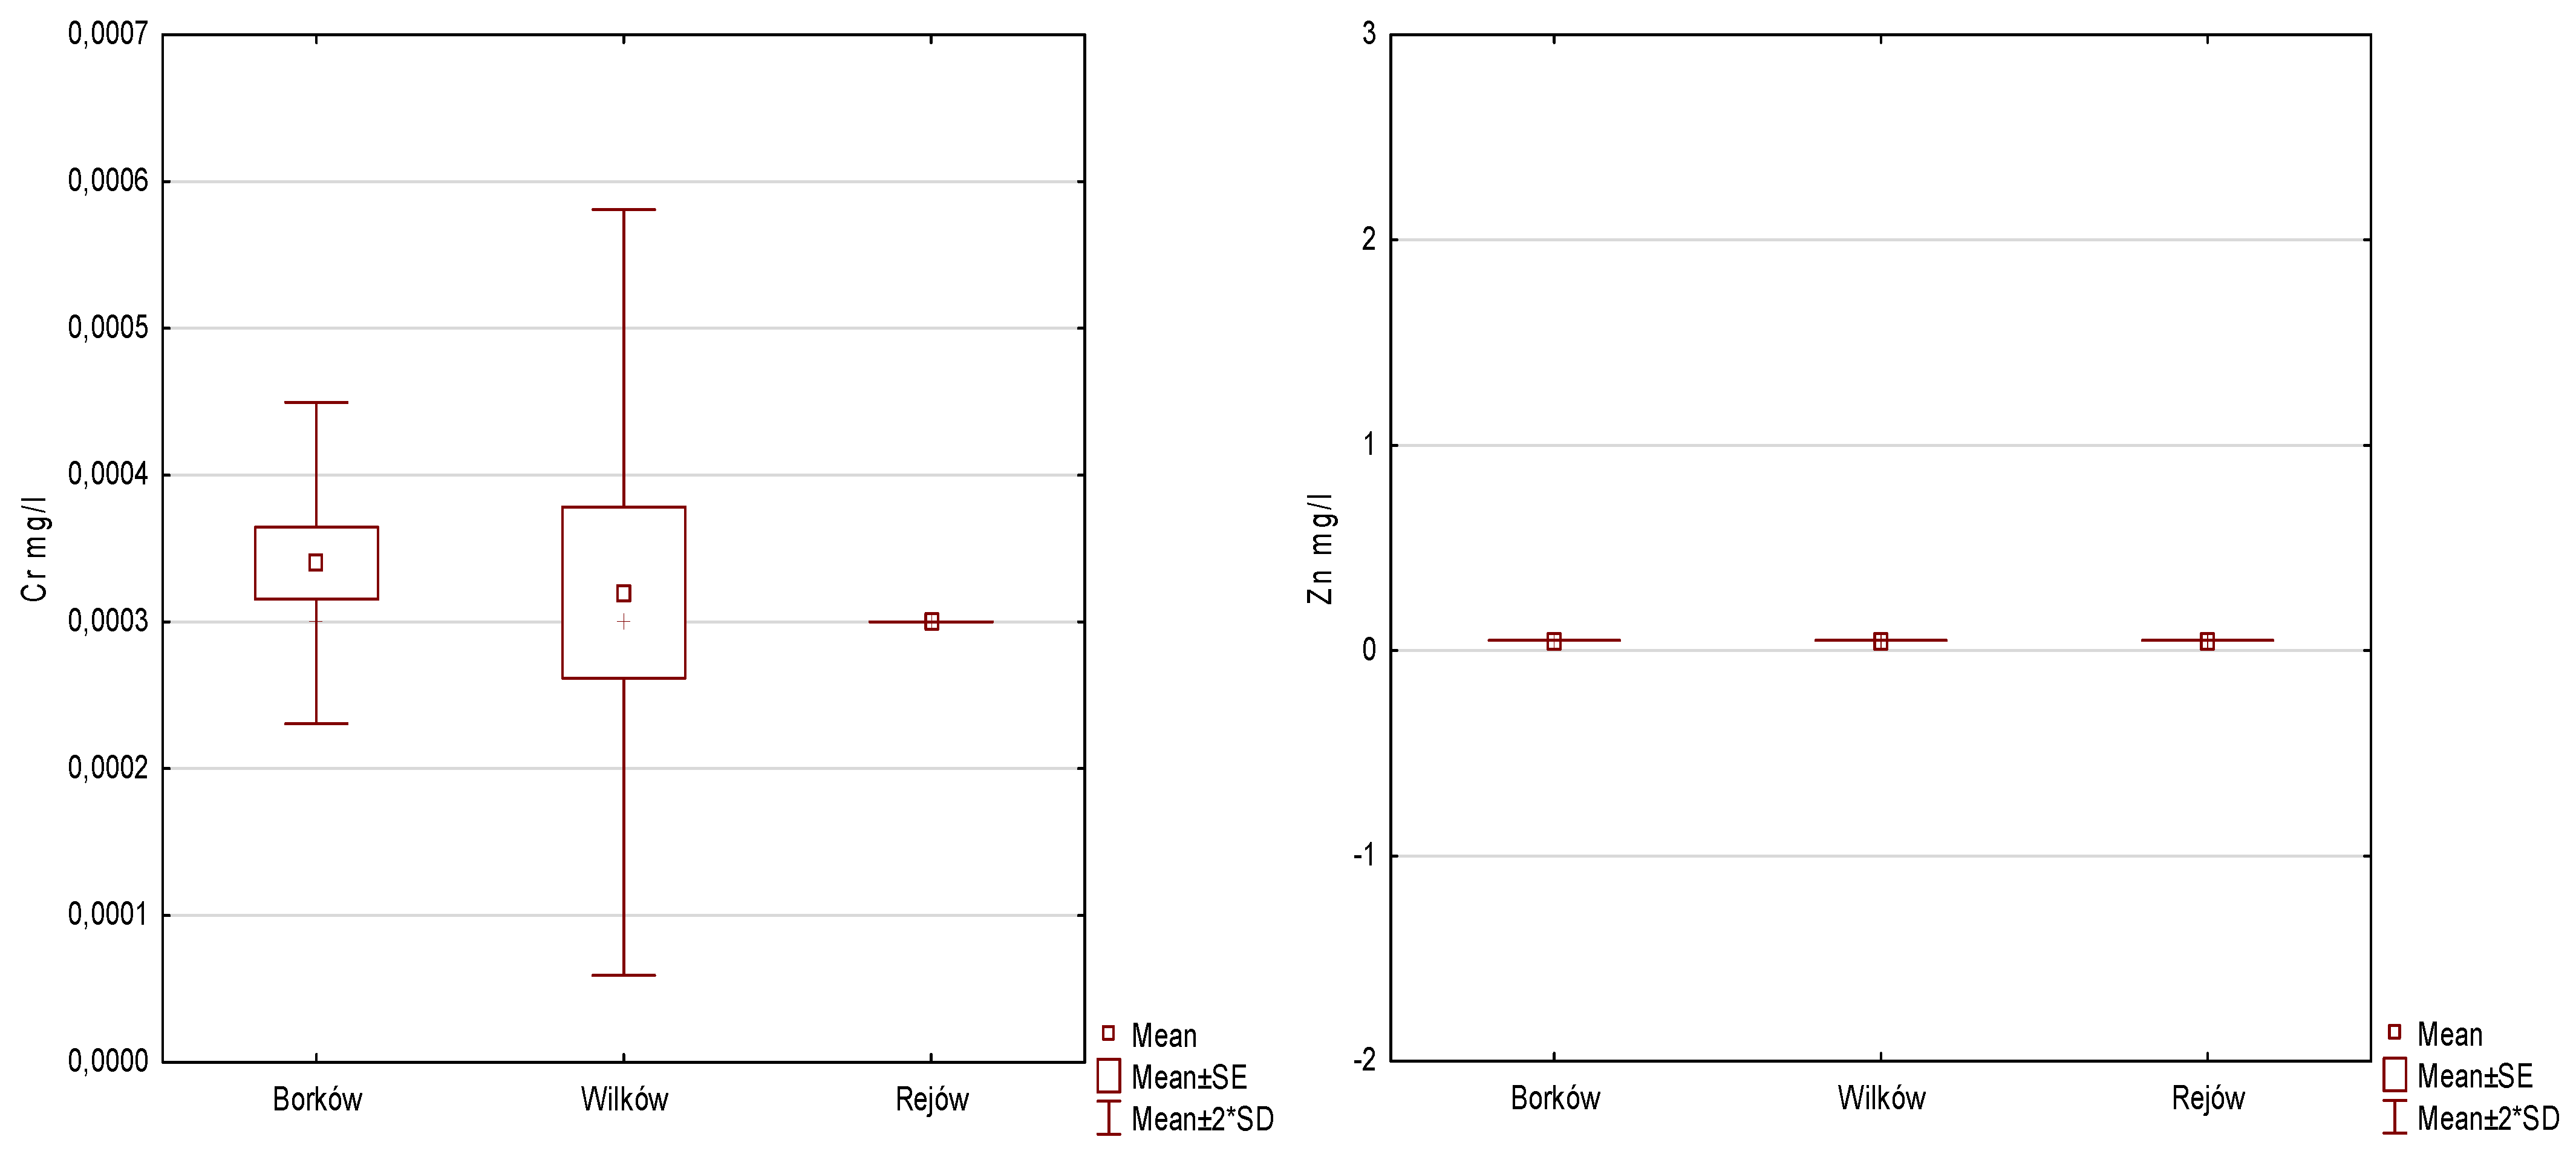
3.1. Physical and Chemical Properties of Water

The physical and chemical properties of water for three dam reservoirs are shown in Figure 2. It was noted that the average pH values of water samples were 9.15 for Borków, 8.71 for Wilków, and 9.41 for Rejów, respectively, indicating an alkaline reaction. The average concentrations of trace metals in water samples collected from Borków reservoir were Cr 0.00034 mg/L, Zn 0.05 mg/L, Cd 0.0001 mg/L, Cu 0.003 mg/L, Ni 0.0018 mg/L, Pb 0.0016 mg/L, Mn 0.005 mg/L, and Fe 0.2638 mg/L. From Wilków reservoir, the concentrations were Cr 0.00032 mg/L, Zn 0.05 mg/L, Cd 0.00016 mg/L, Cu 0.00284 mg/L, Ni 0.0014 mg/L, Pb 0.002 mg/L, Mn 0.14 mg/L, and Fe 0.403 mg/L. From Rejów reservoir, the concentrations were Cr 0.0003 mg/L, Zn 0.05 mg/L, Cd 0.0001 mg/L, Cu 0.002 mg/L, Ni 0.001 mg/L, Pb 0.002 mg/L, Mn 0.0112 mg/L, and Fe 0.1474 mg/L.

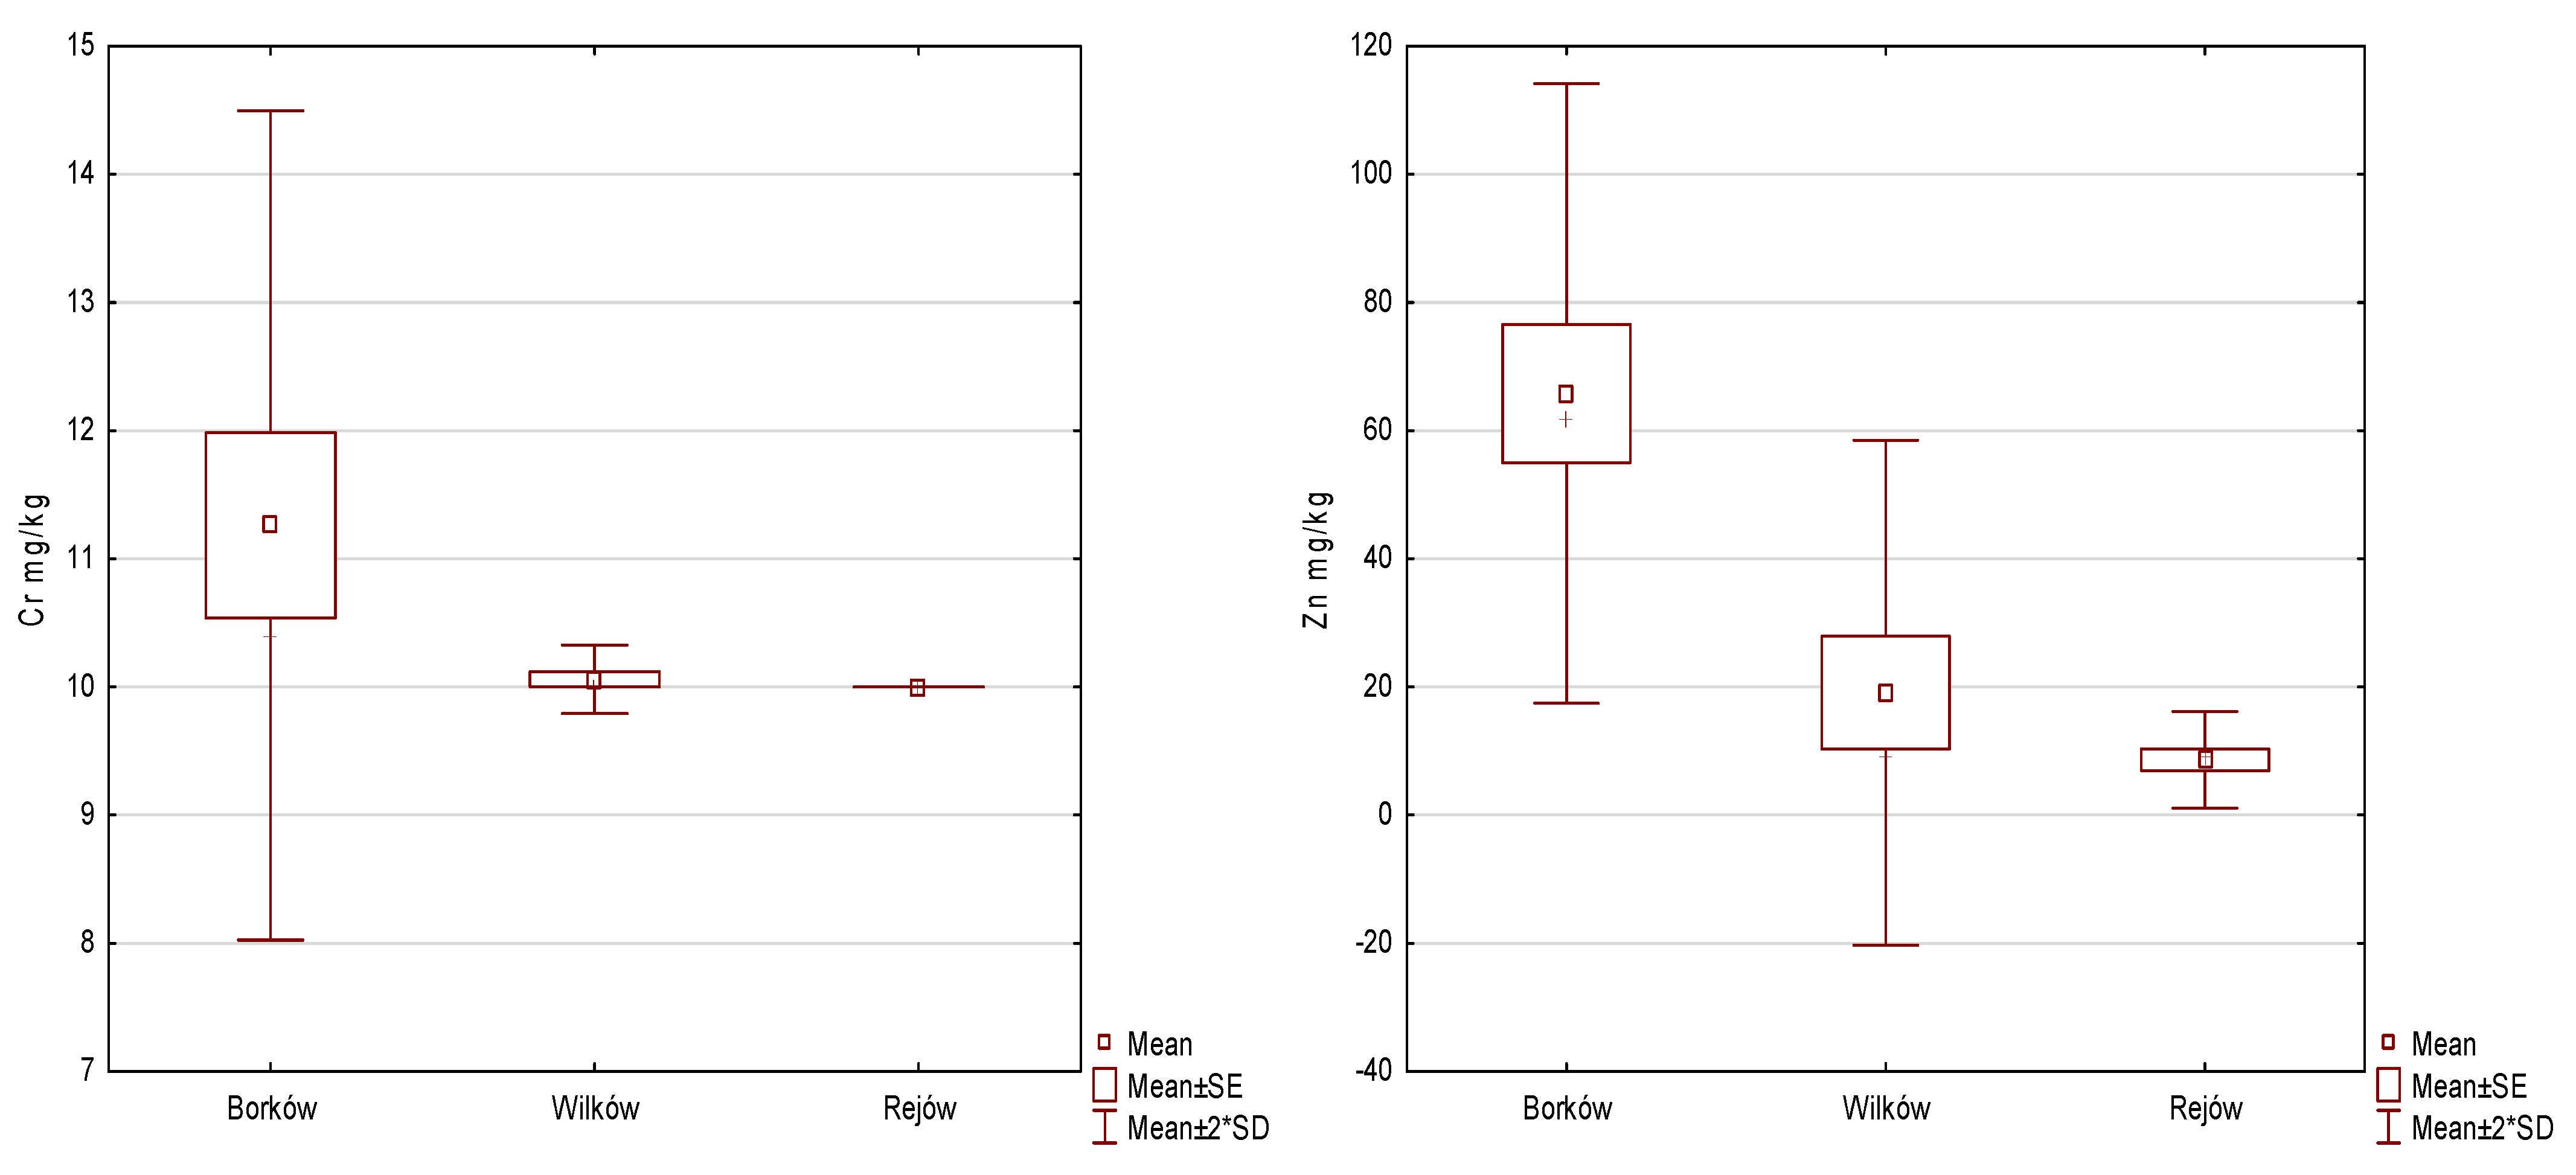
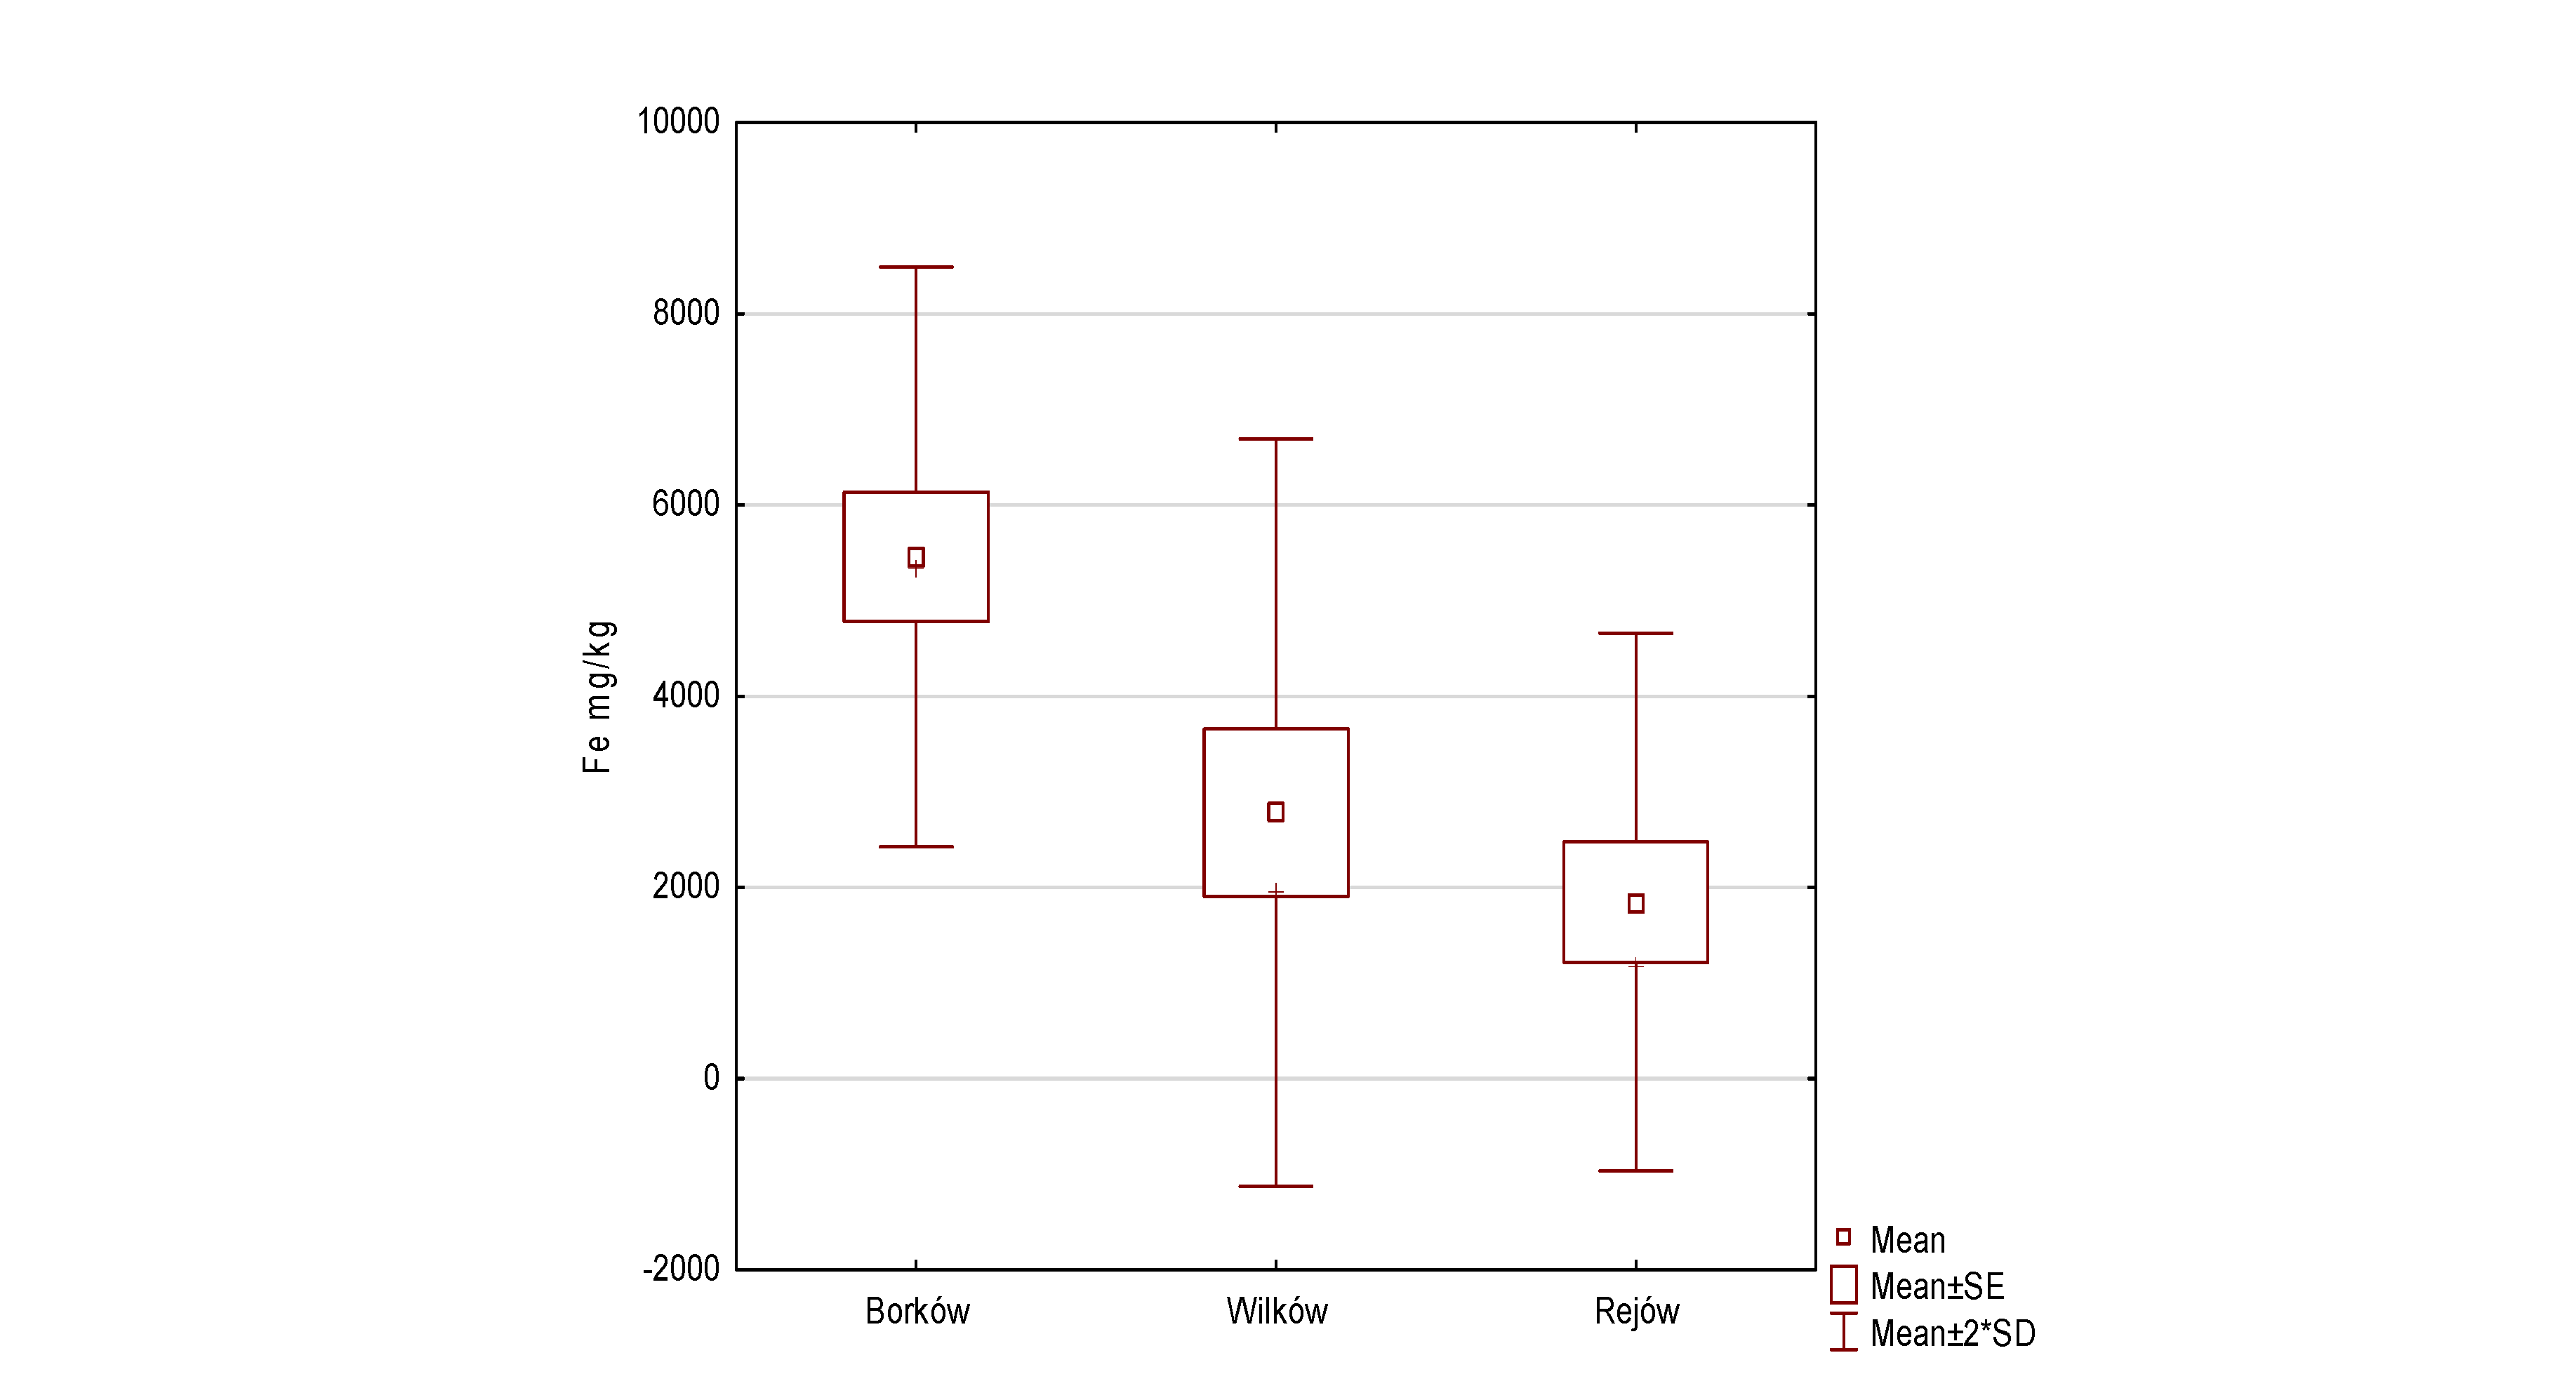
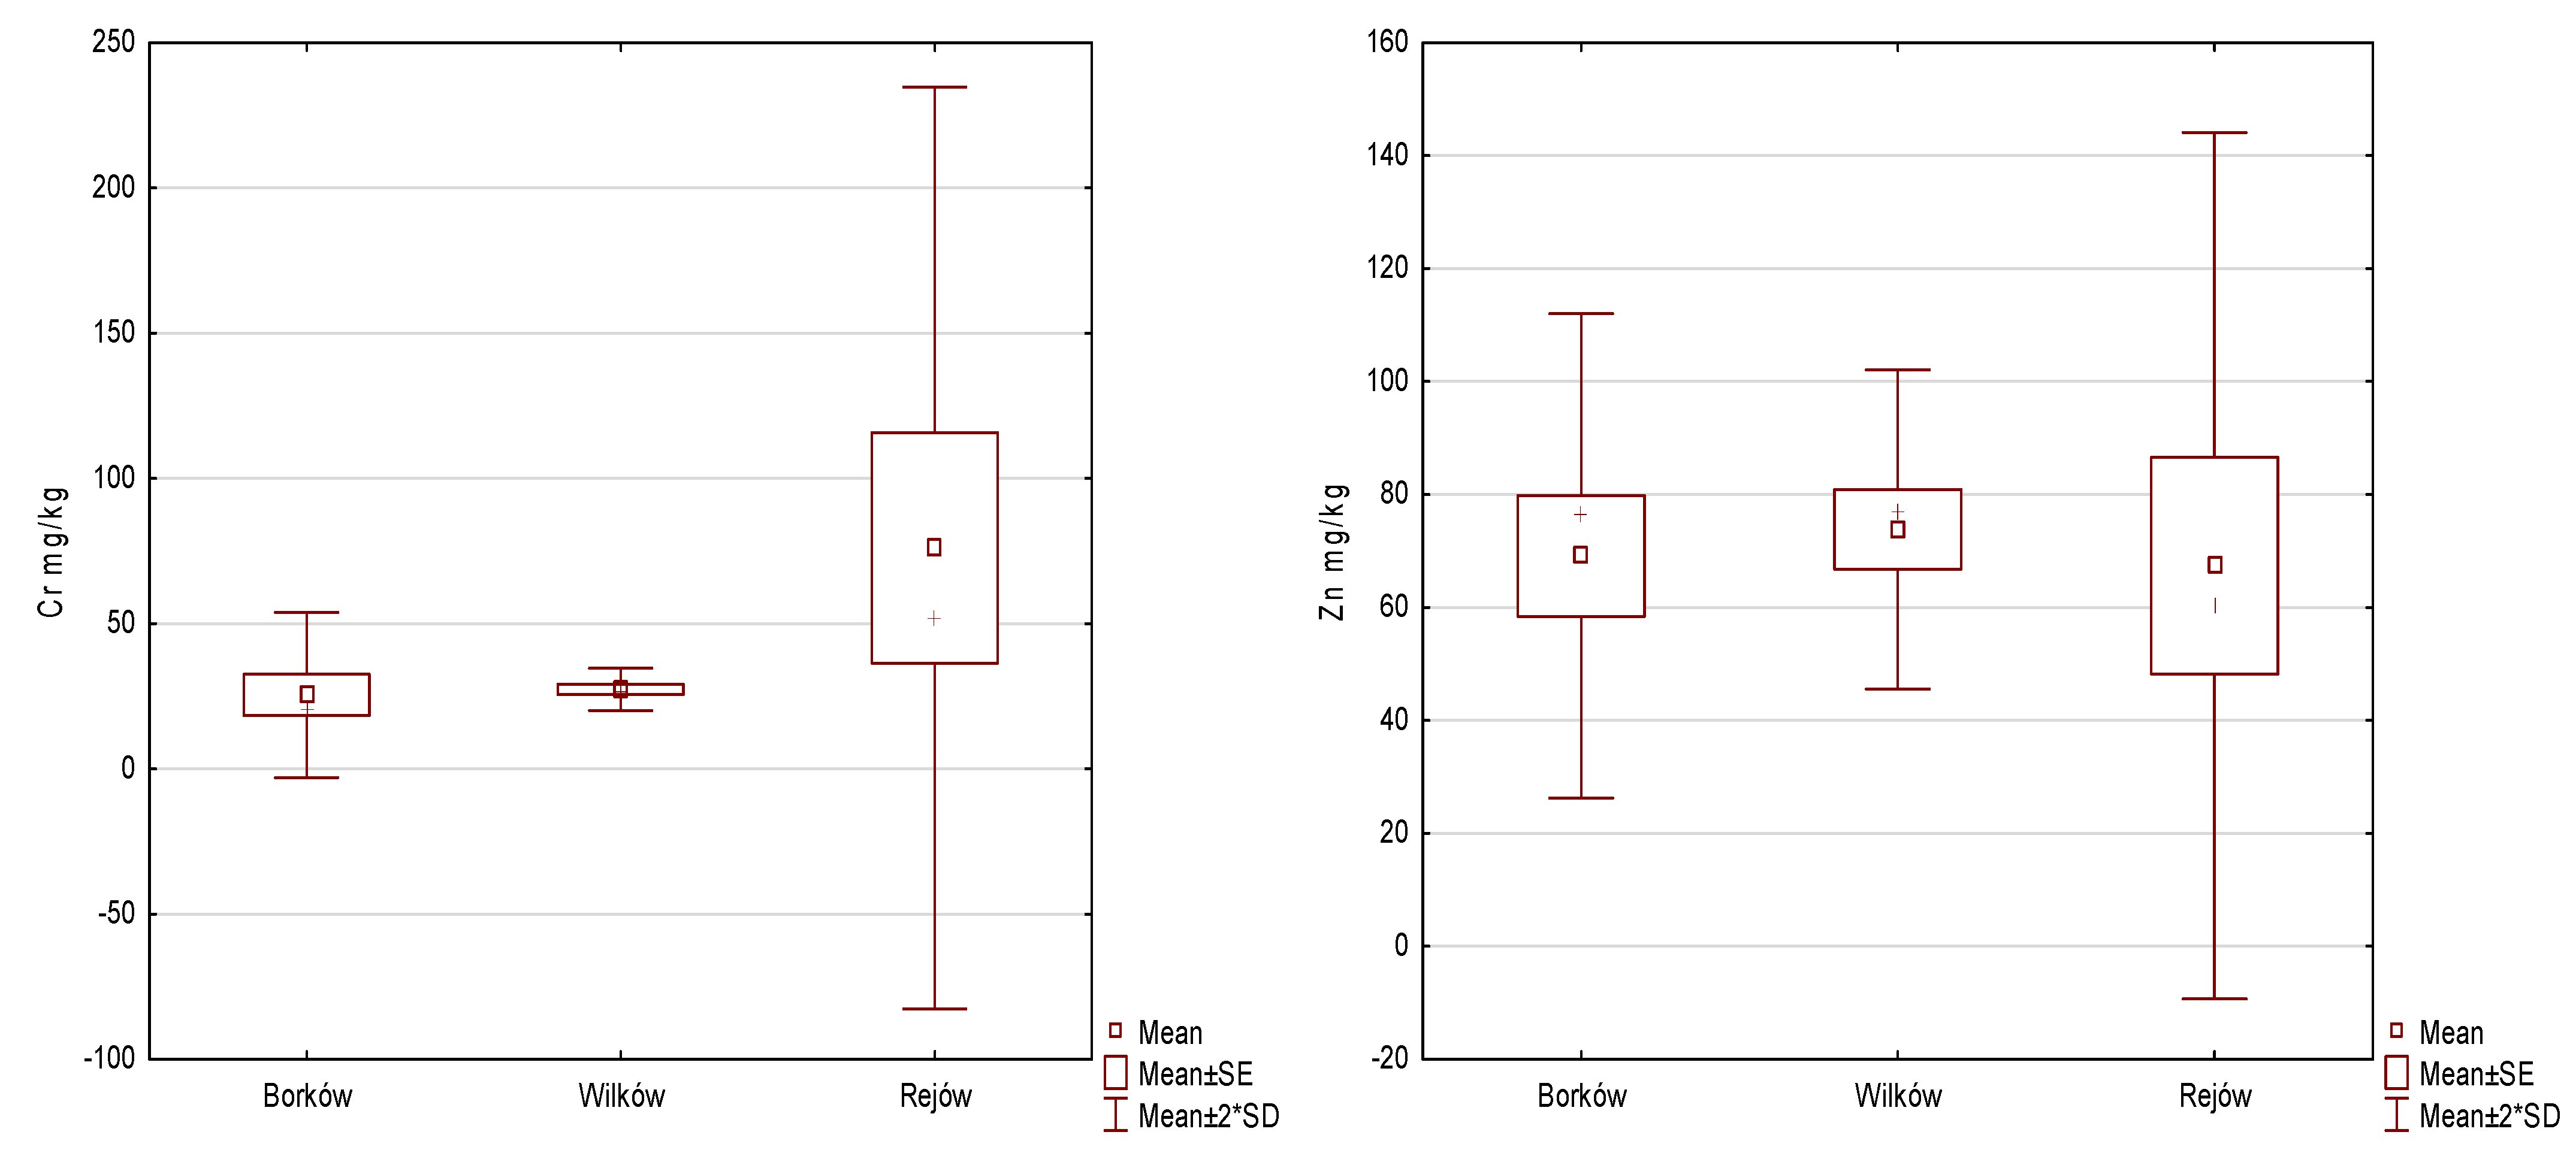
3.2. Physicochemical Properties of Bottom Sediments

The granulometric composition of bottom sediments in dam reservoirs is shown in Figure 3.
All five samples collected from the bottom of Borków reservoir represent sandy-gravel sediments with an admixture of clay sediments. In samples 2–5, the amount of gravel exceeds 10%, while in sample 1, it does not exceed 1%. Also evident in this sample is an increase in clay content (about 18%) relative to the other samples (about 10%). In sample 1, the average grain diameter is about 2.8 φ, and sorting is poor (δI = 1.2). In the other samples (2–5), the average diameter varies between 1.1 φ and 1.8 φ, while sorting is weak or very weak (δI = 1.9–2.1). The obliquity (SkI) for all samples varies from 0.2 to −0.2, and kurtosis (KG) varies from 0.9 to 1.6.
Sediment samples taken from the Wilków reservoir represent sand and gravel deposits. In samples 2–5, the amount of gravel reaches about 10% (sand with single gravel pieces), while in sample 1, it exceeds 25% (sand with gravel). In sample 1, the average grain diameter is about 0.8 φ, and sorting is poor (δI = 1.7). In the other samples (2–5), the average grain diameter varies between 1.2 φ and 1.6 φ, while sorting is moderate (δI = about 0.9). The obliquity (SkI) for all samples varies from −0.2 to −0.5, and kurtosis (KG) varies from 0.5 to 1.6.
The bottom of the Rejów reservoir is represented by sandy-gravel deposits. In samples 2 and 4, there is a clear increase in the content of silt-laden matter, ranging from about 9% to 20% (sands with single gravel fed), and the amount of gravels in all samples reaches about 8 to 13% (sand with single gravel). For samples with an increased content of finer fraction (2, 4), the average grain diameter is about 2.0 φ to 2.4 φ, and sorting is poor (δI = 1.2–1.9). In the other samples (1, 3, 5), the average grain diameter varies between 1.3 φ and 2.0 φ, while sorting is poor (δI = about 1.1–1.3). The obliquity (SkI) for all samples varies from −0.5 to 0.0, and kurtosis (KG) varies from 1.1 to 2.1.
The physical and chemical properties of bottom sediments collected from the reservoirs are shown in Figure 4. There was little variation in the reaction of sediments, mostly weakly acidic or on the verge of neutral, as reflected in pHH2O values (active acidity) in the range from 6.6–6.94, 4.50–6.60, and 6.28–6.43 for Borków, Wilków, and Rejów, respectively. The pHKCl (exchangeable acidity) values ranged from 6.67–7.10, 4.61–6.62, and 6.13–6.52 for Borków, Wilków, and Rejów, respectively. The lowest pH values were found in samples collected from Wilków reservoir point W4 (tributary from agricultural fields), while the highest values were found from point B3 in Borków. The average content of CaCO3 [%] was 2.35, 0.40, and 0 for Borków, Wilków, and Rejów, respectively.
The analyses showed that the accumulation of trace elements in the surface layer of reservoir sediments increased in the following order in Borków: Cd < Co < Ni < Cu < Pb < Cr < Zn < Mn < Fe; Wilków: Cd < Co < Cu < Ni < Pb < Cr < Zn < Mn < Fe; and Rejów: Cd < Co = Cu = Ni = Pb < Zn < Cr < Mn < Fe, respectively. It was shown that the average distribution of metals in the bottom sediments of the studied reservoirs was as follows: Borków > Wilków > Rejów.

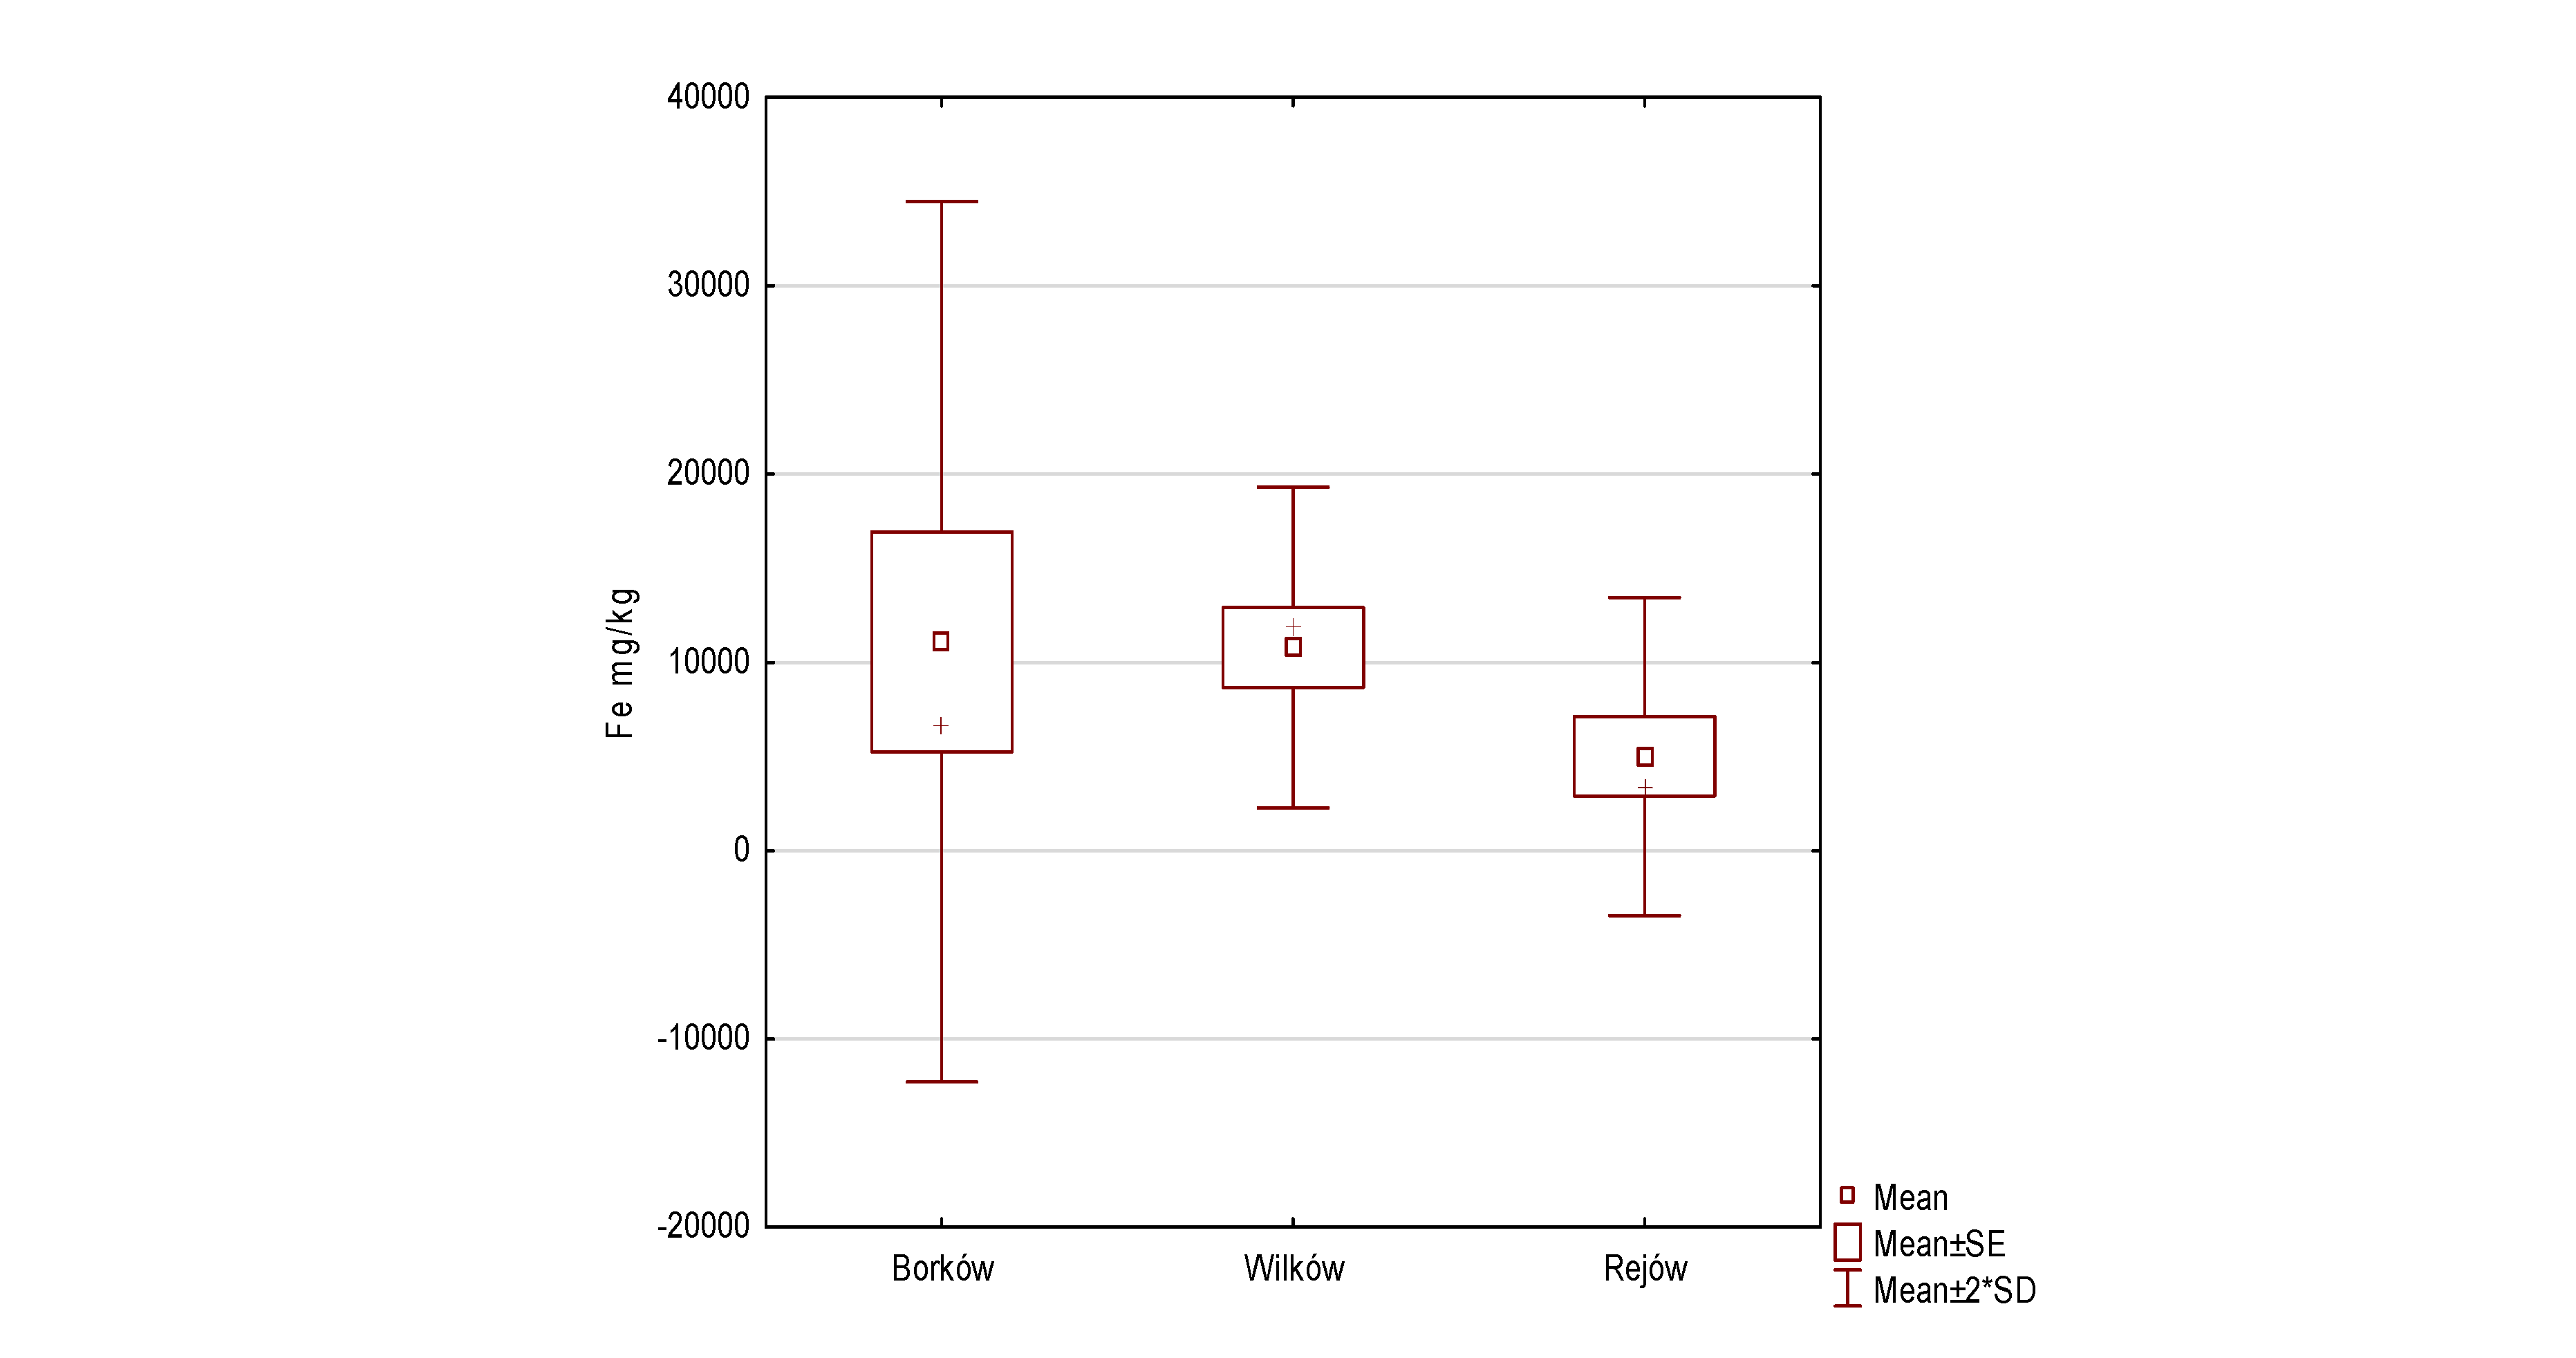
3.3. Concentrations of PTEs in Macrophytes

The metal content of macrophytes is shown in Figure 5. The highest average concentrations of Cd (3.07 mg/kg) and Fe (11,089.5 mg/kg) were recorded in macrophytes from the Borków reservoir, Zn (73.85 mg/kg), Mn (2307.75 mg/kg), and Pb (10.85 mg/kg) in plants collected from Wilków, while the highest average concentrations of Cr (76.05 mg/kg), Cu (11.85 mg/kg), Ni (29.22 mg/kg) were recorded in Rejów reservoir.
The analyses showed that the concentration of trace elements in macrophytes increased in the following order in Borków: Cd < Co < Pb < Cu < Ni < Cr < Zn < Mn < Fe; Wilków: Cd < Co < Pb < Cu < Ni < Cr < Zn < Mn < Fe; and Rejów: Cd < Co = Pb < Cu < Ni < Zn < Cr < Mn < Fe, respectively. The study shows that the level of trace metal accumulation in each of the reservoirs selected for the study increases as follows: water < sediment < macrophytes (except for Pb in the Borków reservoir).

3.4. Correlations Among PTEs Concentrations in Water, Sediments, and Macrophytes

In order to check whether there were statistically significant differences between the contents of individual metals in the three reservoirs: Rejów, Borków, and Wilków by intake site: water, sediment, and macrophytes, a Kruskal Wallis ANOVA analysis was carried out, with results shown by the Shapiro–Wilk test: p < 0.05. A significance level of 0.05 was adopted (Table 4).
Table 4 shows the content of heavy metals in the water from the three reservoirs: Rejów, Borków, and Wilków. The mean value (M) and standard deviation (SD) were determined for each metal. An analysis of variance (ANOVA) was performed to assess the significance of differences between reservoirs, and a post hoc analysis—a pairwise comparison test—was conducted when significant differences were found. For manganese (Mn), statistically significant differences were observed between reservoirs (p = 0.002). The highest Mn content was recorded in the water of Wilków reservoir (0.1400 mg/L), significantly higher than in Borków (0.0050 mg/L) and Rejów (0.0112 mg/L) reservoirs. The post hoc results indicate that the manganese content in Wilków was statistically significantly higher compared to both Rejów and Borków. Wilków also had a statistically significantly higher Mn content in the water than Rejów. Copper (Cu) content also showed significant differences between reservoirs (p = 0.047). The highest mean Cu values were recorded in Wilków (M = 0.0028 mg/L) and Borków (M = 0.0027 mg/L), which were significantly higher than in Rejów (M = 0.0020 mg/L). Post hoc analysis confirmed that copper content was higher in Borków and Wilkow than in Rejów. For the iron (Fe) content of the water, statistically significant differences were also found between reservoirs (p = 0.031). Mean Fe content was highest in Wilków reservoir (M = 0.4030 mg/L), and was statistically significantly higher than in Borków (M = 0.2638 mg/L) and Rejów (M = 0.1474 mg/L). Post hoc analysis also showed that the mean Fe content was statistically significantly higher in Borków than in Rejów. Statistically significant differences in heavy metal content in water from Rejów, Borów, and Wilków reservoirs were observed for manganese, copper, and iron. The highest values of these metals were present in Wilków reservoir.
Table 5 shows the results of the analysis of heavy metals in the bottom sediments taken from the three water bodies: Rejów, Borków, and Wilków. The analysis showed statistically significant differences (p = 0.014) in the mean zinc content of the sediments between the compared reservoirs. The highest mean zinc content was recorded in Borków (M = 65.82 mg/kg), which was statistically significantly higher than in Wilków (M = 19.10 mg/kg) and Rejów (M = 8.62 mg/kg). There were also statistically significant differences (p = 0.007) in sediment manganese content in the three analyzed reservoirs. The mean manganese content was highest in Borków (170.60 mg/kg), followed by Wilków (M = 140.88 mg/kg) and Rejów (M = 52.52 mg/kg) reservoirs. Post hoc analysis showed that the manganese content in Wilków and Borków reservoirs was statistically significantly higher than in Rejów reservoir. Significant differences (p = 0.032) were observed in copper (Cu) content between reservoirs. The mean copper content in Borków reservoir was M = 6.72 mg/kg, which was higher than in Rejów reservoir (M = 5.00 mg/kg). Post hoc results indicated that the copper content in Borków reservoir was statistically significantly higher than in Rejów reservoir. For lead, statistically significant differences were also found (p = 0.005). The mean lead content in Borków reservoir was M = 8.66 mg/kg, which was statistically significantly higher than in Wilków (M = 5.74 mg/kg) and Rejów (M = 5.00 mg/kg) reservoirs. Significant differences were also observed for iron (p = 0.018). The mean iron content in Borków reservoir was M = 5456.60 mg/kg, which was higher than in Wilków (M = 2780.00 mg/kg) and Rejów (M = 1844.80 mg/kg) reservoirs. Significant differences in zinc, manganese, copper, lead, and iron were observed in the bottom sediments from Rejów, Borków, and Wilków reservoirs. The highest values of these metals were recorded in Borków reservoir.
The Table 6 shows the content of heavy metals in macrophytes taken from the three water bodies: Rejów, Borków, and Wilków. For most metals, no statistically significant differences were found in their content between reservoirs (p > 0.05). The exception is cadmium (Cd), where the p-value was 0.077, which is close to the limit of statistical significance, but was not reached. Despite the lack of statistically significant differences, the highest mean values for chromium (Cr) and nickel (Ni) were recorded in Rejów Reservoir. Manganese (Mn) had the highest mean value in Wilków reservoir. Lead (Pb) showed the highest mean value also in Wilków reservoir, while values were similar in Borków and Rejów. In order to test whether there were statistically significant differences between the contents of individual metals in water, sediment, and macrophytes depending on the reservoir from which they were collected, a Kruskal Wallis ANOVA analysis was carried out (Shapiro–Wilk test results: p < 0.05). A significance level of 0.05 was assumed.
For most metals, significant differences were found between the contents in the different environments, as confirmed by ANOVA analysis (Table 7). A post hoc analysis was carried out to check for differences between groups. In terms of chromium (Cr) content, the highest concentration was observed in macrophytes (M = 25.48 mg/kg, SD = 14.21), followed by sediment (M = 11.26 mg/kg, SD = 1.62) and the lowest in water (M = 0.0003 mg/kg, SD = 0.0000). ANOVA analysis showed significant differences (F(2) = 11.752, p = 0.003), and post hoc analysis confirmed that chromium content in macrophytes was statistically significantly higher than in water and sediment. Zinc (Zn) content was highest in macrophytes (M = 69.13 mg/kg, SD = 21.44) and sediments (M = 65.82 mg/kg, SD = 24.18) and lowest in water (M = 0.0500 mg/kg, SD = 0.0000). ANOVA results indicated significant differences (F(2) = 9.414, p = 0.009), and post hoc analysis showed that zinc content in sediment and macrophytes was significantly higher than in water. Cadmium (Cd) showed the highest mean content in macrophytes (M = 3.08 mg/kg, SD = 3.31), followed by sediment (M = 1.12 mg/kg, SD = 0.18) and the lowest in water (M = 0.0001 mg/kg, SD = 0.0000). ANOVA analysis showed significant differences (F(2) = 10.468, p = 0.005), and post hoc analysis confirmed that cadmium content in sediment and macrophytes was statistically significantly higher than in water. For manganese (Mn), the highest mean content was observed in macrophytes (M = 1501.75 mg/kg, SD = 1269.70), followed by sediment (M = 170.60 mg/kg, SD = 56.00) and the lowest in water (M = 0.0050 mg/kg, SD = 0.0000). ANOVA analysis showed significant differences (F(2) = 10.732, p = 0.005), and post hoc analysis confirmed that manganese content was higher in sediment and macrophytes than in water. For copper (Cu), the highest mean concentration was recorded in macrophytes (M = 8.03 mg/kg, SD = 0.90), followed by sediment (M = 6.72 mg/kg, SD = 1.77) and the lowest in water (M = 0.0027 mg/kg, SD = 0.0007). ANOVA results indicate significant differences (F(2) = 9.685, p = 0.008), and post hoc analysis confirmed that copper content in sediment and macrophytes was higher than in water. The mean nickel (Ni) content was highest in macrophytes (M = 13.58 mg/kg, SD = 5.60), followed by sediments (M = 6.16 mg/kg, SD = 1.77) and lowest in water (M = 0.0018 mg/kg, SD = 0.0018). ANOVA analysis showed significant differences (F(2) = 11.435, p = 0.003) and post hoc analysis confirmed that nickel content in sediment and macrophytes was statistically significantly higher than in water. Lead (Pb) showed the highest mean content in sediments (M = 8.66 mg/kg, SD = 2.69), followed by macrophytes (M = 6.25 mg/kg, SD = 1.48) and the lowest in water (M = 0.0016 mg/kg, SD = 0.0009). The ANOVA results indicate significant differences (F(2) = 10.036, p = 0.007), and post hoc analysis confirmed that lead content in sediment and macrophytes was higher than in water. For iron (Fe), the highest mean concentration was observed in macrophytes (M = 11,089.5 mg/kg, SD = 11,687.97), followed by sediments (M = 5456.60 mg/kg, SD = 1516.06) and the lowest in water (M = 0.2638 mg/kg, SD = 0.0450). ANOVA analysis showed statistically significant differences between uptake sites (F(2) = 9.103, p = 0.011), and post hoc analysis confirmed that the iron content in sediment and macrophytes was statistically significantly higher than in water. The metal content of Borków Reservoir shows significant differences between water, sediment, and macrophytes. In most cases, the highest metal concentrations were recorded in macrophytes, followed by sediments, and the lowest in water.
The results showed statistically significant differences between the metal contents in the different environments (Table 8). In terms of mean chromium (Cr) content, the highest concentration was found in macrophytes (M = 27.33 mg/kg, SD = 3.63), followed by sediment (M = 10.06 mg/kg, SD = 0.13) and the lowest in water (M = 0.0003 mg/kg, SD = 0.0001). ANOVA analysis showed statistically significant differences (F(2) = 11.858, p = 0.003), and post hoc analysis confirmed that chromium content in macrophytes was statistically significantly higher than in water and sediment, and also higher in sediment than in water. The mean zinc (Zn) content was highest in macrophytes (M = 73.85 mg/kg, SD = 14.12), followed by sediment (M = 19.10 mg/kg, SD = 19.72) and lowest in water (M = 0.0500 mg/kg, SD = 0.0000). The ANOVA results show statistically significant differences (F(2) = 12.103, p = 0.002) and post hoc analysis showed that the zinc content in macrophytes and sediments was statistically significantly higher than in water. Zn content was also shown to be statistically significantly higher in macrophytes compared to sediments. Cadmium (Cd) showed the highest mean content in macrophytes (M = 2.65 mg/kg, SD = 0.66), followed by sediment (M = 1.02 mg/kg, SD = 0.04) and the lowest in water (M = 0.0002 mg/kg, SD = 0.0001). ANOVA analysis showed significant differences (F(2) = 11.939, p = 0.003), and post hoc analysis confirmed that cadmium content in macrophytes and sediments was higher than in water, and also higher in macrophytes than in sediments. For manganese (Mn), the highest mean content was observed in macrophytes (M = 2307.75 mg/kg, SD = 1470.72), followed by sediments (M = 140.88 mg/kg, SD = 50.34) and the lowest in water (M = 0.1400 mg/kg, SD = 0.0000). ANOVA analysis showed significant differences (F(2) = 12.103, p = 0.002), and post hoc analysis confirmed that manganese content in macrophytes and sediments was statistically significantly higher than in water, and also higher in macrophytes than in sediments. For copper (Cu), the highest mean concentration was recorded in macrophytes (M = 11.03 mg/kg, SD = 1.62), followed by sediments (M = 5.38 mg/kg, SD = 0.85) and the lowest in water (M = 0.0028 mg/kg, SD = 0.0004). ANOVA results indicate significant differences (F(2) = 11.831, p = 0.003), and post hoc analysis confirmed that copper content in macrophytes and sediments was higher than in water, and also higher in macrophytes than in sediments. Nickel (Ni) content was highest in macrophytes (M = 17.00 mg/kg, SD = 2.10), followed by sediments (M = 5.42 mg/kg, SD = 0.94) and lowest in water (M = 0.0014 mg/kg, SD = 0.0005). ANOVA analysis showed significant differences (F(2) = 11.966, p = 0.003), and post hoc analysis confirmed that nickel content in macrophytes and sediments was statistically significantly higher than in water, and also higher in macrophytes than in sediments. Lead (Pb) showed the highest mean content in macrophytes (M = 10.85 mg/kg, SD = 3.94), followed by sediment (M = 5.74 mg/kg, SD = 1.65) and the lowest in water (M = 0.0020 mg/kg, SD = 0.0000). ANOVA results indicate significant differences (F(2) = 11.249, p = 0.004), and post hoc analysis confirmed that lead content in macrophytes and sediments was statistically significantly higher than in water, and also higher in macrophytes than in sediments. For iron (Fe), the highest mean concentration was observed in macrophytes (M = 10,793.25 mg/kg, SD = 4259.45), followed by sediments (M = 2780.00 mg/kg, SD = 1955.05) and the lowest in water (M = 0.4030 mg/kg, SD = 0.1761). ANOVA analysis showed statistically significant differences (F(2) = 11.083, p = 0.004), and post hoc analysis confirmed that iron content in macrophytes and sediments was statistically significantly higher than in water, and also higher in macrophytes than in sediments. The metal content in Wilków Reservoir shows statistically significant differences between water, sediment, and macrophytes. The highest metal concentrations were found in macrophytes, followed by sediments, and the lowest in water.
The results showed significant differences between metal contents in different environments, as confirmed by ANOVA analysis, and post hoc analyses were performed for significant differences (Table 9). In terms of mean chromium (Cr) content, the highest concentration was found in macrophytes (M = 76.05 mg/kg, SD = 79.37), followed by sediments (M = 10.00 mg/kg, SD = 0.00) and the lowest in water (M = 0.0003 mg/kg, SD = 0.0000). ANOVA analysis showed significant differences (F(2) = 11.883, p = 0.003), and post hoc analysis confirmed that chromium content in macrophytes was higher than in water. The mean zinc (Zn) content was highest in macrophytes (M = 67.40 mg/kg, SD = 38.35), followed by sediments (M = 8.62 mg/kg, SD = 3.77) and lowest in water (M = 0.0500 mg/kg, SD = 0.0000). ANOVA results indicate significant differences (F(2) = 12.131, p = 0.002), and post hoc analysis showed that the zinc content in sediments was higher than in water, and also higher in macrophytes than in sediments. Cadmium (Cd) showed the highest mean content in macrophytes (M = 1.25 mg/kg, SD = 0.50), followed by sediment (M = 1.00 mg/kg, SD = 0.00) and the lowest in water (M = 0.0001 mg/kg, SD = 0.0000). ANOVA analysis showed significant differences (F(2) = 11.875, p = 0.003), and post hoc analysis confirmed that cadmium content was higher in sediment and macrophytes than in water. For manganese (Mn), the highest mean content was observed in macrophytes (M = 1287.75 mg/kg, SD = 1521.24), followed by sediment (M = 52.52 mg/kg, SD = 14.66) and the lowest in water (M = 0.0112 mg/kg, SD = 0.0091). ANOVA analysis showed significant differences (F(2) = 11.571, p = 0.003), and post hoc analysis confirmed that manganese content was higher in sediment and macrophytes than in water. For copper (Cu), the highest mean concentration was recorded in macrophytes (M = 11.85 mg/kg, SD = 7.25), followed by sediments (M = 5.00 mg/kg, SD = 0.00) and the lowest in water (M = 0.0020 mg/kg, SD = 0.0005). The ANOVA results indicate significant differences (F(2) = 12.103, p = 0.002), and post hoc analysis confirmed that the copper content in macrophytes was higher than in water. Mean nickel (Ni) content was highest in macrophytes (M = 29.23 mg/kg, SD = 19.35), followed by sediments (M = 5.00 mg/kg, SD = 0.00) and lowest in water (M = 0.0010 mg/kg, SD = 0.0000). ANOVA analysis showed statistically significant differences (F(2) = 12.687, p = 0.002), and post hoc analysis confirmed that the mean nickel content in sediment and macrophytes was higher than in water, and also higher in macrophytes than in sediment. Lead (Pb) showed equal content in both sediments and macrophytes (M = 5.00 mg/kg, SD = 0.00), and was lowest in water (M = 0.0020 mg/kg, SD = 0.0000). The ANOVA results indicate significant differences (F(2) = 13.000, p = 0.002), and post hoc analysis confirmed that the lead content in sediments and macrophytes was higher than in water. For iron (Fe), the highest mean concentration was observed in macrophytes (M = 5004.50 mg/kg, SD = 4223.45), followed by sediment (M = 1844.80 mg/kg, SD = 1406.41) and the lowest in water (M = 0.1474 mg/kg, SD = 0.0692). ANOVA analysis showed significant differences (F(2) = 10.260, p = 0.006), and post hoc analysis confirmed that iron content in sediment and macrophytes was higher than in water, and also higher in macrophytes than in sediment. The metal content in Rejów Reservoir shows significant differences between water, sediment, and macrophytes. The highest metal concentrations were found in macrophytes, followed by sediments, and the lowest in water. In most cases, macrophytes contained significantly higher metal concentrations than sediment and water.

3.5. Assessment of Pollution of Bottom Sediments

Selected criteria were used to assess the level of trace metal contamination of sediments: (a) Igeo classification, (b) CF contamination index, and (c) PLI index. Based on the average values of trace metals in the analyzed samples, an assessment of the contamination of reservoir sediments was carried out using Igeo index. According to the classification provided in Table 2, the calculated Igeo values for Zn (Borków, Rejów), Mn, Cu, Ni, Pb, and Fe classify sediments as “unpolluted” (class 0); Cr, Cd, Co—to class 1 (“unpolluted” to moderately polluted). Only for bottom sediments of the Wilków reservoir, the Igeo for Zn values were “moderately polluted” (class 2).
Similar results were obtained for CF index. The values of CF index ranged from 0.22 to 2.5 in Borków, 0.15–2.5 in Wilków, and 0.07–2.5 in Rejów, which allowed the sediments to be classified as low contamination (class 1) and moderate contamination (class 2). The PLI values were 1.07 in Borków reservoir, 0.73 in Wilków reservoir, and 0.55 in Rejów reservoir. A combined assessment of bottom sediment contamination based on all elements indicates that sediments in Borków are polluted, while those in Wilków and Rejów are unpolluted.

4. Discussion

Based on the study, it was found that the metal content of water, bottom sediment, and aquatic plants of dam reservoirs was largely dependent on the geochemical structure of catchment. Nevertheless, the sediment metal content is also affected by the state of its management. Concentrations of Mn, Fe, Pb, Zn (Wilków and Rejów), Cu (Wilków and Rejów), Ni (Rejów) in the bottom sediments of reservoirs were at levels below the geochemical background. This indicates their origin from geogenic sources. Increased values of Cr, Cd, Co, Ni (Borków and Wilków), Cu (Borków), Zn (Borków) indicate the supply of these elements from anthropogenic sources, such as municipal and industrial wastewater discharges (Belnianka, Kamionka catchment), surface runoff from agricultural fields, and transportation routes. According to Kozłowski et al., 2016 [45], the high concentrations of chloride and sodium cations found in Belnianka, especially in late winter and spring, may be due to the location of roads and developed areas in relation to the river. Although the proportion of built-up areas in the analyzed catchment was small, their location along the river channels facilitated the migration of ions with snowmelt or rainwater. Developed areas are an important source of ions in question in the water due to winter road maintenance [46]. In the material collected from the Wilków reservoir, sample W4 stands out in particular, in which the highest concentrations of all tested elements were recorded. The location of material collection was deliberate in order to verify the possible inflow from agricultural fields and the influence of local agriculture as an anthropopressure factor. Sałata et al., 2019, report that elevated Cu concentrations may be related to the nature of the direct catchment (arable land), and copper may be used in fertilizers and crop protection products [24]. Considering Mn, it is uncertain whether the exceedances shown are anthropogenic in origin or related to geological structure because this element occurs naturally in the environment [17]. According to Górski et al., 2016 [47], the content of trace metals in bottom sediments is an individual feature of reservoirs. Analysis of geoaccumulation indices (Igeo), accumulation factor (CF), and pollutant loading index (PLI) of sediments collected from Lubianka reservoir, indicate that Cd, Cr, Cu, Ni, and Pb in bottom sediments originate from geogenic sources—weathering of rock material, while Zn comes from anthropogenic sources (wastewater management). The analysis has shown that areas adjacent to reservoirs can affect the distribution of trace metals, and Ni concentrations can additionally be affected by traffic [47]. Studies [27,44] show that the highest concentrations of trace metals in bottom sediments in samples collected from dam reservoirs are observed at the reservoir inlet and near the dam. The highest concentrations of Ni, Cd, Zn, and Cr in bottom sediments were found in the upper part of Lubianka reservoir, Fe—in the middle part, and Cu, Hg, Pb, and Mn—in the lower part of reservoir [47]. The study conducted only in the case of Rejów reservoir partially confirms this thesis, as the highest concentrations of Zn, Mn, and Fe were recorded near the dam. Correlations between individual trace elements in sediments may be due to their geochemical relationships, as well as provide information on the sources and pathways of metals [27]. In the sediments of Sołtmany Lake, a significant correlation was found between Cu and Cr, Ni, and Cr, and Zn and Ni, which may confirm their common origin from a single source(s). The study also showed a strong positive correlation between Ni, Zn, and the content of clay fraction [22]. Fine sediment fractions have a high sorption capacity for metals [48] and may flow into the reservoir with surface runoff from adjacent agricultural fields.
The results of Świercz and Tomczyk-Wydrych’s [22] analysis showed that Sołtmany Lake is not contaminated with trace metals. Analysis of the scale of bottom sediment contamination using geochemical and ecotoxicological indicators showed that bottom sediments collected from Sołtmany Lake can be classified as first class in terms of the content of all tested trace metals except Cd (second class for the three sampling sites 2, 4, 5). After calculating Igeo index, the sediments were found to belong to class 0 (practically unpolluted) and first class (unpolluted to moderately polluted). Similar results were obtained in the present study. Calculated Igeo values for Zn (Borków, Rejów), Mn, Cu, Ni, Pb, and Fe classify sediments as “practically unpolluted” (class 0); Cr, Cd, Co—first class (“unpolluted to moderately polluted”). Only in the case of bottom sediments of Wilków reservoir, the values of Igeo for Zn were “moderately polluted” (second class). The values of CF index allowed the sediments to be classified as poorly contaminated (first class) and moderately contaminated (second class).
The study conducted by Germ et al., 2023 [13] in the Bohinj alpine lake (in Triglav National Park, Julian Alps, Slovenia) showed that the average content of some toxic elements, especially in sediments (Cd 0.52 mg/kg; Hg 0.03 mg/kg) and plants (Co 0.71 mg/kg; Cr 5.88 mg/kg), was elevated compared to natural background values. The high Hg content may be related to natural geological sources, while the other elements are likely to be of anthropogenic origin. The high levels of all elements in the eastern part of the lake indicated long-term pollution, which may have been a consequence of iron mining, metallurgical activities, and military activities in the area. Current human activities such as agriculture on the eastern shore of the lake and sewage disposal could also be a possible cause of high elemental content in the lake’s sediments. The area pollution is evidenced by the elevated content of Cd, Co, Hg, and Ni in macrophytes compared to other parts of the lake [13].
An additional element in assessing the content of potentially toxic metals in reservoirs is their concentration in aquatic plants. Macrophytes, as a group of organisms strongly associated with the aquatic environment and sensitive to changes in the ecosystem, are the subject of research by many scientists [20,21,29]. Studies conducted by Klink et al. (2013) have shown that T. latifolia can be used for bioindication of Mn, Zn, Cd, Pb, Ni, Cu, and Co. According to Klink et al. (2013) T. latifolia contained the highest proportion of all metals tested in the roots suggests the existence of some kind of protective barrier that prevents toxic compounds from entering the rhizomes and aboveground parts of the plant [21]. The positive correlation found between metal content in the environment and in the plant’s organs indicates the possibility of using T. latifolia as a biomonitor plant [18,21]. Aquatic plants purify surface water by accumulating dissolved metals in their tissues. They are a valuable complement to bottom sediment studies [29]. Studies have shown that the average Cu and Zn contents (except for Rejów) are within the natural contents proposed by Kabata-Pendias and Pendias (2001) [49]. Nevertheless, the concentrations of Cr, Ni, and Co were found to be higher than the maximum values reported by Kabata-Pendias and Pendias (2001) [49]. According to Otte and Jacob (2005), deviations from the natural content may indicate plants that may be suitable for biological monitoring [50]. The metals studied were accumulated in the following trends: Fe > Mn > Zn > Cr > Ni > Cu > Pb > Co > Cd (Borków), Fe > Mn > Zn > Cr > Ni > Cu > Pb > Co > Cd (Wilków), Fe > Mn > Cr > Zn > Ni > Cu > Pb = Co > Cd (Rejów). The high content of Zn in the plant organs studied may be an indicator of industrial pollution. Similar conclusions were reached by Skorbiłowicz et al., 2016, in plants recorded the highest Zn concentrations, while the lowest Co. The study conducted by Skorbiłowicz et al. (2016) also showed that the highest amounts of metals accumulate in the roots, while only a small part is transported to the stem and leaves. The translocation coefficient for all analyzed metals (excluding Co) was below 1, which confirms the high retention capacity of metals in the root. The present study confirms the validity of the selection of macrophyte roots for our study. The high concentration of Fe in sediments and aquatic plants has a natural or anthropogenic origin from sources such as soil erosion or salt dissolution in water. The high content of Cu is caused by excessive use of fungicides in agriculture and contamination by domestic wastewater [29].
Greger and Kautshy (1991) [51] report that the metal content of aquatic plant roots depends mainly on their content in bottom sediments, and is mainly correlated with the metal content of <63 µm fraction of sediments. In general, metal concentrations in sediment increase with decreasing particle size and increasing organic content [29]. Perhaps this is the reason for the low concentrations of PTEs in sediments of Rejów reservoir where sandy formations predominate, and where we expected high concentrations due to the existing anthropogenic pressure in the catchment (i.e., surface runoff from communications, road dust, receiving domestic, municipal, and industrial wastewater).
The study shows that the level of trace metal accumulation in each of the basins selected for the study increases as follows: water < sediment < macrophytes (except Pb in Borków reservoir). Which confirms the thesis of Skorbiłowicz et al., 2016, where the content of Fe, Mn, and Cd in aquatic plants is higher than in sediments while it contradicts the results on the content of Co, Cu, Ni, and Pb, which are higher in sediments than in aquatic plants. The results of our study and that of Flefel et al., 2020 [33] indicate that the concentrations of heavy metals accumulated in aquatic plants and sediments are higher than those found in water samples.
The quality of aquatic sediments is important for the good status of the water environment, as they are an integral part of the surface water environment, and the aquatic organisms living in them participate not only in bigeochemical transformations, but also play a fundamental role in the maintenance of water cleanliness, decomposition of organic matter. The presence of high levels of PTEs in sediments negatively affects the quality of the surface water environment. Contaminated sediments can have detrimental effects on the biological resources of waters. Heavy metals and other hazardous substances present in sediments can accumulate in the trophic chain to levels that are toxic to aquatic organisms, especially predators, and can also pose risks to humans. Sediments with a high content of harmful components are potential focus of environmental pollution. Some of the harmful components contained in sediments can be re-activated into the water as a result of chemical and biochemical processes taking place in the sediments, as well as mechanical movement of previously deposited contaminated sediments due to natural processes. Sediments deposited at the bottom of rivers, lakes, dammed reservoirs, canals, as well as off sea shores are commonly used to monitor environmental quality for contamination by both heavy metals and harmful organic compounds. Due to the multiple higher concentrations of harmful substances in sediments, compared to their content in water, chemical analysis of sediments allows detection and observation of changes in their content even at relatively low levels of pollution [22].
In Poland, monitoring of the chemical status of surface water bodies is carried out on the basis of, among others, the Regulation of the Minister of Infrastructure of 25 June 2021, on the classification of ecological status, ecological potential, and chemical status, and the method of classifying the status of surface water bodies, as well as environmental quality standards for priority substances (Journal of Laws 2021 item 1475). Based on the document, the Maximum Allowable Concentration Environmental Quality Standards (MAC-EQS) of individual elements in water are: Cd µg/L: 0.45 (class 1 and 2), 0.6 (class 3), 0.9 (class 4), 1.5 (class 5); Pb 14 µg/L, Ni 34 µg/L, Cr ≤0.05 mg/L, Zn ≤1 mg/L, Cu ≤0.05 mg/L. In assessing the water quality status of reservoirs at the surveyed measurement points based on determined trace metals, these waters should be classified in the first water quality class. None of the concentrations exceed the limit values of water quality indicators for the first class according to the aforementioned Regulation of the Minister of Infrastructure [52].

5. Conclusions

Control of the pollution status of reservoirs allows early identification of adverse environmental changes and their counteraction to maintain the ability of water bodies to perform their associated biocenotic functions.
  • The study showed that the water quality status of selected dam reservoirs allows them to be classified in the first class of water quality in accordance with the Regulation of the Minister of Infrastructure of June 25, 2021, on the classification of ecological status, ecological potential, and chemical status, as well as the method of classifying the surface water bodies status, and environmental quality standards for priority substances (Journal of Laws 2021 item 1475).
  • The analyses showed that the accumulation of trace elements in the surface layer of reservoir sediments increased in the following order in Borków: Cd < Co < Ni < Cu < Pb < Cr < Zn < Mn < Fe; Wilków: Cd < Co < Cu < Ni < Pb < Cr < Zn < Mn < Fe; and Rejów: Cd < Co = Cu = Ni = Pb < Zn < Cr < Mn < Fe, respectively.
  • It was indicated that the average distribution of metals in the bottom sediments of the studied reservoirs was as follows Borków > Wilków > Rejów.
  • The concentration of Mn, Fe, Pb, Zn (Wilków and Rejów), Cu (Wilków and Rejów), Ni (Rejów) in the bottom sediments of reservoirs was at levels below the geochemical background. This indicates their origin from geogenic sources. Increased values of Cr, Cd, Co, Ni (Borków and Wilków), Cu (Borków), and Zn (Borków) indicate the supply of these elements from anthropogenic sources.
  • The values of Igeo, CF, and PLI indices indicate low contamination of the bottom sediments of reservoirs with heavy metals.
  • The content of PTEs in the macrophytes of reservoirs can be arranged in ascending order in Borków: Cd < Co < Pb < Cu < Ni < Cr < Zn < Mn < Fe; Wilków: Cd < Co < Pb < Cu < Ni < Cr < Zn < Mn < Fe; and Rejów: Cd < Co = Pb < Cu < Ni < Zn < Cr < Fe < Mn.
  • The metal content of all reservoirs shows significant differences between water, sediment, and macrophytes. The study shows that trace metal accumulation rates in each of the reservoirs selected for the study increase as follows: water < sediment < macrophytes (except for Pb in the Borków reservoir).
  • Aquatic plants are an effective barrier to surface water, accumulating heavy metals in their biomass. Macrophytes such as Phragmites australis and Typha latifolia L., among others, are proposed for monitoring reservoirs pollution.

Author Contributions

Conceptualization, A.Ś. and I.T.-W.; methodology, A.Ś. and I.T.-W.; software, I.T.-W.; validation, A.Ś. and I.T.-W.; formal analysis, A.Ś. and I.T.-W.; investigation, A.Ś. and I.T.-W.; resources, A.Ś. and I.T.-W.; data curation, I.T.-W.; writing—original draft preparation, A.Ś. and I.T.-W.; writing—review and editing, A.Ś. and I.T.-W.; visualization, I.T.-W.; supervision, A.Ś. and I.T.-W.; project administration, A.Ś. and I.T.-W.; funding acquisition, A.Ś. and I.T.-W. All authors have read and agreed to the published version of the manuscript.

Funding

This research was funded by Jan Kochanowski University of Kielce no SUPB.RN23094/2024 and SUPD.RN.24.018. Publication co-financed by the Support Fund for Authors KOPIPOL Association.

Data Availability Statement

Data is contained within the article.

Acknowledgments

The authors are grateful to Tomasz Kalicki for providing the software for granulometric analyses and Paweł Przepióra for assistance with laboratory works and granulometric analysis. We also express our gratitude to Łukasz Bąk for performing the bathymetric maps by GIS. All the authors want to acknowledge the Editor and the Referees for their constructive comments that contributed to improving the manuscript’s original version.

Conflicts of Interest

The authors declare no conflicts of interest.

References

  1. Robledo Ardila, P.A.; Álvarez-Alonso, R.; Árcega-Cabrera, F.; Durán Valsero, J.J.; Morales García, R.; Lamas-Cosío, E.; Oceguera-Vargas, I.; DelValls, A. Assessment and Review of Heavy Metals Pollution in Sediments of the Mediterranean Sea. Appl. Sci. 2024, 14, 1435. [Google Scholar] [CrossRef]
  2. Ardila, P.A.R.; Alonso, R.Á.; Valsero, J.J.D.; García, R.M.; Cabrera, F.Á.; Cosío, E.L.; Laforet, S.D. Assessment of heavy metal pollution in marine sediments from southwest of Mallorca island, Spain. Env. Sci. Pollut. Res. 2023, 30, 16852–16866. [Google Scholar] [CrossRef] [PubMed]
  3. Hem, J.D. Study and Interpretation of the Chemical Characteristics of Natural Water; Department of the Interior, US Geological Survey: Reston, VA, USA, 1992; Volume 254, p. 263. [Google Scholar]
  4. Hood, A.P. Trace Elements in Soils; John Wiley and Sons Ltd.: New York, NY, USA, 2010. [Google Scholar]
  5. Kalicki, T.; Kozłowski, R.; Przepióra, P.; Szwed, M. The geochemical diversity of lacustrine sediments of the Suchedniów water reservoir (Świętokrzyskie voivodeship, Poland)—Preliminary results. Acta Geobalcanica 2021, 7, 159–165. [Google Scholar] [CrossRef]
  6. Wang, F.; Wang, B.; Qu, H.; Zhao, W.; Duan, L.; Zhang, Y.; Zhou, Y.; Yu, G. The Influence of Nanoplastics on the Toxic Effects, Bioaccumulation, Biodegradation and Enantioselectivity of Ibuprofen in Freshwater Algae Chlorella Pyrenoidosa. Environ. Pollut. 2020, 263, 114593. [Google Scholar] [CrossRef]
  7. Przybylska, J.; Kozłowski, R. Pierwiastki śladowe w wodach wybranych rzek Gór Świętokrzyskich (Trace elements in water from selected rivers in the Świętokrzyskie Mountains). Monit. Sr. Przyr. 2018, 20, 61–69. [Google Scholar]
  8. Wuana, R.A.; Okieimen, F.E. Heavy metals in contaminated soils: A review of sources, chemistry, risks and best available strategies for remediation. Int. Sch. Res. Not. Ecol. 2011, 2011, 402647. [Google Scholar] [CrossRef]
  9. Nawrot, N.; Wojciechowska, E.; Mohsin, M.; Kuittinen, S.; Pappinen, A.; Rezania, S. Trace Metal Contamination of Bottom Sediments: A Review of Assessment Measures and Geochemical Background Determination Methods. Minerals 2021, 11, 872. [Google Scholar] [CrossRef]
  10. Kulbat, E.; Sokołowska, A. Methods of Assessment of Metal Contamination in Bottom Sediments (Case Study: Straszyn Lake, Poland). Arch. Environ. Contam. Toxicol. 2019, 77, 605–618. [Google Scholar] [CrossRef]
  11. Polechońska, L.; Klink, A. Macrophytes as passive bioindicators of trace element pollution in the aquatic environment. Wiley Interdiscip. Rev. Water 2022, 10, e1630. [Google Scholar] [CrossRef]
  12. Kluska, M.; Jabłońska, J. Variability and Heavy Metal Pollution Levels in Water and Bottom Sediments of the Liwiec and Muchawka Rivers (Poland). Water 2023, 15, 2833. [Google Scholar] [CrossRef]
  13. Germ, M.; Golob, A.; Zelnik, I.; Klink, A.; Polechońska, L. Contents of Metals in Sediments and Macrophytes Differed between the Locations in an Alpine Lake Revealing Human Impacts—A Case Study of Lake Bohinj (Slovenia). Water 2023, 15, 1254. [Google Scholar] [CrossRef]
  14. Polechońska, L.; Klink, A.; Dambiec, M.; Rudecki, A. Evaluation of Ceratophyllum Demersum as the Accumulative Bioindicator for Trace Metals. Ecol. Indic. 2018, 93, 274–281. [Google Scholar] [CrossRef]
  15. Ali, M.B.; Tripathi, R.D.; Rai, U.N.; Pal, A.; Singh, S.P. Physico-chemical characteristics and pollution level of lake Nainital (U.P., India): Role of macrophytes and phytoplankton in biomonitoring and phytoremediation of toxic metal ions. Chemosphere 1999, 39, 2171–2182. [Google Scholar] [CrossRef]
  16. Shah, A.B.; Rai, U.N.; Singh, R.P. Correlations between Some Hazardous Inorganic Pollutants in the Gomti River and Their Accumulation in Selected Macrophytes under Aquatic Ecosystem. Bull. Environ. Contam. Toxicol. 2015, 94, 783–790. [Google Scholar] [CrossRef]
  17. Kabata-Pendias, A.; Pendias, H. Biogeochemistry of Trace Elements; Polish Scientific Publishing Company: Warsaw, Poland, 1999; Volume 2, ISBN 0849315751. [Google Scholar]
  18. Bonanno, G.; Borg, J.A.; Di Martino, V. Levels of heavy metals in wetland and marine vascular plants and their biomonitoring potential: A comparative assessment. Sci. Total Environ. 2017, 576, 796–806. [Google Scholar] [CrossRef]
  19. Nour, H.E.; El-Sorogy, A.S.; Abdel-Wahab, M.; Almadani, S.; Alfaifi, H.; Youssef, M. Assessment of sediment quality using different pollution indicators and statistical analyses, Hurghada area, Red Sea coast. Egypt. Mar. Pollut. Bull. 2018, 133, 808–813. [Google Scholar] [CrossRef]
  20. Oladele, A.H.; Umaru, J.; Andy, N. Assessment of metals in sediments and Typha latifolia of Zobe Reservoir, Nigeria. J. Energy Nat. Resour. Manag. (JENRM) 2022, 8, 63–68. [Google Scholar] [CrossRef]
  21. Klink, A.; Macioł, A.; Wisłocka, M.; Krawczyk, J. Metal accumulation and distribution in the organs of Typha latifolia L. (cattail) and their potential use in bioindication. Limnologica 2013, 43, 164–168. [Google Scholar] [CrossRef]
  22. Świercz, A.; Tomczyk-Wydrych, I.; Bąk, Ł. Quality of Bottom Sediments of Sołtmany Lake (Masurian Lake District, Poland) in the Light of Geochemical and Ecotoxicological Criteria—Case Study. Water 2022, 14, 2045. [Google Scholar] [CrossRef]
  23. Sojka, M.; Jaskuła, J.; Barabach, J.; Ptak, M.; Zhu, S. Heavy metals in lake surface sediments in protected areas in Poland: Concentration, pollution, ecological risk, sources and spatial distribution. Sci Rep. 2022, 12, 15006. [Google Scholar] [CrossRef] [PubMed]
  24. Sałata, A.; Bąk, Ł.Z.; Chmielowski, K.; Rabajczyk, A. Metal pollution of sediments in small water reservoirs in the Kielce Highland (South Eastern Poland). Arch. Environ. Prot. 2019, 45, 12–21. [Google Scholar] [CrossRef]
  25. Tarnawski, M.; Baran, A.; Koniarz, T.; Wyrębek, M.; Grela, J.; Piszczek, M.; Koroluk, A. The possibilities of the environmental use of bottom sediments from the silted inlet zone of the Rożnów Reservoir. Geol. Geophys. Environ. 2017, 43, 335–344. [Google Scholar] [CrossRef]
  26. Lee, P.K.; Kang, M.J.; Yu, S.; Ko, K.S.; Ha, K.; Shin, S.C.; Park, J.H. Enrichment and geochemical mobility of heavy metals in bottom sediment of the Hoedong reservoir, Korea and their source apportionment. Chemosphere 2017, 184, 74–85. [Google Scholar] [CrossRef]
  27. Baran, A.; Tarnawski, M.; Koniarz, T. Spatial distribution of trace elements and ecotoxicity of bottom sediments in Rybnik reservoir, Silesian-Poland. Environ. Sci. Pollut. Res. Int. 2016, 23, 17255–17268. [Google Scholar] [CrossRef] [PubMed]
  28. Hou, D.; He, J.; Lü, C.; Ren, L.; Fan, Q.; Wang, J.; Xie, Z. Distribution characteristics and potential ecological risk assessment of heavy metals (Cu, Pb, Zn, Cd) in water and sediments from Lake Dalinouer, China. Ecotoxicol. Environ. Saf. 2013, 93, 135–144. [Google Scholar] [CrossRef]
  29. Skorbiłowicz, E.; Skorbiłowicz, M.; Malinowska, D. Accumulation of heavy metals in organs of aqueous plants and its association with bottom sediments in Bug river (Poland). J. Ecol. Eng. 2016, 17, 295–303. [Google Scholar] [CrossRef]
  30. Chabukdhara, M.; Nema, A.K. Assessment of heavy metal contamination in Hindon River sediments: A chemometric and geochemical approach. Chemosphere 2012, 87, 945–953. [Google Scholar] [CrossRef]
  31. Krivokapić, M. Study on the Evaluation of (Heavy) Metals in Water and Sediment of Skadar Lake (Montenegro), with BCF Assessment and Translocation Ability (TA) by Trapa natans and a Review of SDGs. Water 2021, 13, 876. [Google Scholar] [CrossRef]
  32. Keser, G.; Topak, Y.; Sevgiler, Y. Concentrations of some heavy metal and macroelements in sediment, water, macrophyte species, and leech (Hirudo sulukii n. sp.) from the Kara Lake, Adiyaman, Turkey. Environ. Monit. Assess. 2020, 192, 75. [Google Scholar] [CrossRef]
  33. Flefel, H.; Nokhrin, D.; Donnik, I. Determine heavy metals in water, aquatic plants, and sediment in water systems. E3S Web of Conf. 2020, 222, 02028. [Google Scholar] [CrossRef]
  34. Kastratovic, V.; Jacimovic, Z.; Bigović, M.; Djurovic, D.; Krivokapic, S. The distribution and accumulation of chromium in the water, sediment and macrophytes of Skadar lake. Kragujev. J. Sci. 2016, 38, 125–134. [Google Scholar] [CrossRef]
  35. Richling, A.; Solon, J.; Macias, A.; Balon, J.; Borzyszkowski, J.; Kistowski, M. (Eds.) Regionalna Geografia Fizyczna Polski: Praca Zbiorowa; Bogucki Wydawnictwo Naukowe: Poznań, Poland, 2021. [Google Scholar]
  36. Decyzja Starosty Powiatowego w Kielcach znak: RO-II.6341.117.2013.JM z dn. 29.08.2013 o udzieleniu pozwolenia wodnoprawnego na piętrzenie i retencjonowanie wód rzeki Czarna Nida dla potrzeb istniejącego zbiornika wodnego Borków, gm. Daleszyce oraz o zatwierdzenie instrukcji gospodarowania wodą dla ww. zbiornika (Decision of the District Head in Kielce, reference number: RO-II.6341.117.2013.JM, of August 29, 2013, on granting a water-law permit for damming and retaining the waters of the Czarna Nida River for the needs of the existing Borków water reservoir, Daleszyce commune and on approving the water management instructions for the reservoir).
  37. Bąk, Ł. Zamulenie i osady małych zbiorników retencyjnych na Wyżynie Kieleckiej (Silting and Bottom Sediments of Small Water Reservoirs in the Kielce Upland); Monografie, Studia, Rozprawy nr M96; Wydawnictwo Politechniki Świętokrzyskiej: Kielce, Poland, 2017. [Google Scholar]
  38. Przepióra, P. Subatlantyckie przemiany zlewni Kamionki na Wyżynie Kieleckiej (Subatlantic Transformations of the Kamionka Catchment in the Kielce Upland). In Geografia i Geoarcheologia Tom I; Kalicki, T., Ed.; Monografie; Ośrodek Badań Europy Środkowo–Wschodniej: Białystok, Poland, 2021; Available online: https://www.researchgate.net/profile/Pawel-Przepiora/publication/351249183_Subatlantyckie_przemiany_zlewni_Kamionki_na_Wyzynie_Kieleckiej_The_Subatlantic_Transformations_of_the_Kamionka_Catchment_in_the_Kielce_Upland/links/63f3c64b0cf1030a563a062f/Subatlantyckie-przemiany-zlewni-Kamionki-na-Wyzynie-Kieleckiej-The-Subatlantic-Transformations-of-the-Kamionka-Catchment-in-the-Kielce-Upland.pdf (accessed on 22 October 2024).
  39. PN-EN 15933:2013-02E; Osady ściekowe, uzdatnione bioodpady oraz gleba–Oznaczanie pH [Soil, treated bio-waste and sewage sludge–Determination of pH]. Polski Komitet Normalizacyjny: Warszawa, Poland, 2013.
  40. Folk, R.L.; Ward, W.C. A Study in the Significance of Grain-Size Parameters. J. Sediment. Petrol. 1957, 27, 3–26. [Google Scholar] [CrossRef]
  41. Müller, G. Index of geoaccumulation in sediments of the Rhine River. GeoJournal 1969, 2, 108–118. [Google Scholar]
  42. Bojakowska, I. Criteria for evaluation of water sediments pollution. Pol. Geol. Rev. 2001, 49, 213–219. [Google Scholar]
  43. Gałuszka, A.; Migaszewski, Z. Geochemical background—An environmental perspective. Mineralogia 2012, 42, 7–17. [Google Scholar] [CrossRef]
  44. Sojka, M.; Kałuża, T.; Siepak, M.; Strzeliński, P. Zawartość metali ciężkich w osadach dennych śródleśnych zbiorników wodnych. Sylwan 2019, 163, 694–704. [Google Scholar]
  45. Kozłowski, R.; Przybylska, J.; Szwed, M. Chemizm małych rzek wyżynnych na przykładzie Gór Świętokrzyskich. Proc. ECOpole 2016, 10, 667–675. [Google Scholar]
  46. Ciupa, T. Wpływ zagospodarowania terenu, w tym urbanizacji, na stężenie głównych jonów w wodach rzeki Silnicy i Sufragańca (Kielce). Ochr Środow I Zasob Nat. 2009, 38, 44–53. [Google Scholar]
  47. Górski, J.; Bąk, Ł.; Szeląg, B. Jakość wody i osadów dennych zbiornika wodnego Lubianka w Starachowicach. Proc. ECOpole 2016, 10, 635–643. [Google Scholar]
  48. Bąk, Ł.; Górski, J.; Sałata, A.; Gawdzik, J.; Muszyńska, J.; Górska, K. Ecological risk assessment and spatial distribution of heavy metals in surface sediments. A case study of two small storage reservoirs, SE Poland. Desalination Water Treat. 2020, 186, 206–215. [Google Scholar] [CrossRef]
  49. Kabata-Pendias, A.; Pendias, H. Trace Elements in Soils and Plants, 3rd ed.; CRC Press: Boca Raton, FL, USA; London, UK; New York, NY, USA; Washington, DC, USA, 2001. [Google Scholar]
  50. Otte, M.L.; Jacob, D.L. Chemical fingerprinting of plants from contrasting wetlands–salt marsh, geothermal and mining impacted. Phyton 2005, 45, 303–316. [Google Scholar]
  51. Greger, M.; Kautsky, L. Use of macrophytes for mapping bioavailable heavy metals in shallow coastal areas, Stockholm, Sweden. Appl. Geochem. 1993, 8, 37–43. [Google Scholar] [CrossRef]
  52. Regulation of the Minister of Infrastructure of June 25, 2021 on the Classification of Ecological Status, Ecological Potential and Chemical Status and the Method of Classifying the Status of Surface Water Bodies, as Well as Environmental Quality Standards for Priority Substances (Journal of Laws 2021 item 1475). Available online: https://isap.sejm.gov.pl/isap.nsf/DocDetails.xsp?id=WDU20210001475 (accessed on 22 October 2024).
Figure 1. Study area and sampling sites: (1). Borków reservoir, (2). Wilków reservoir, (3). Rejów reservoir; 1–5 location of sampling points of water and bottom sediments, B1–B4; W1–W4 and R1–R4—macrophyte collection sites (DEM; created by M. Frączek on the basis of data obtained from CODGiK, MGGP Aero, nr GI-FOTO.703.44.2014, and bathymetric maps created by Ł. Bąk using GIS; Surfer ver. 11.0).
Water 16 03072 g001aWater 16 03072 g001b
Figure 2. Content of trace metals in water reservoirs: Borków, Wilków, Rejów.
Water 16 03072 g002aWater 16 03072 g002b
Figure 3. The results of granulometric analysis of deposits: 1—Borków, 2—Wilków, 3—Rejów. Lithology of Borków: A—sands with gravels; Lithology of Wilków: A—sands with single gravels, B—sands with gravels. Lithology of Rejów: A—sand with gravels, B—sands with single gravels. Fractions: 1—gravel (below −1 φ); 2—coarse sand (1–1 φ), 3—medium sand (1–2 φ), 4—fine sand (2–4 φ), 5—coarse and medium grained dusts (4–6 φ), 6—fine-grained dusts (6–8 φ), 7—clay (>8 φ). Folk-Ward’s distribution parameters: Mz—mean diameter, δl—standard deviation (sorting), Skl—skewness, KG—kurtosis (created by P. Przepióra).
Water 16 03072 g003
Figure 4. Content of trace metals in bottom sediments of reservoirs: Borków, Wilków, Rejów.
Water 16 03072 g004aWater 16 03072 g004bWater 16 03072 g004c
Figure 5. Content of metals in macrophytes collected from reservoirs: Borków, Wilków, Rejów.
Water 16 03072 g005aWater 16 03072 g005bWater 16 03072 g005c
Table 1. Parameters of selected dam reservoirs along with catchment management.
ReservoirAdministrative LocationYear of Construction of the Dam ReservoirReservoir Area [ha]Depth [m]Catchment AreaCatchment Development [%]Sources of Pollution Located Above Structures
BorkówKielce district, Daleszyce commune197136
35.7
avg. 2 m; max. 4 mZlewnia Belnianki (Czarna Nida)agricultural areas (57.63%),
forest areas (37.21%),
built-up areas (5.12%) [7]
Sewage treatment plant in Daleszyce (Czarna Nida receiver); Daleszyce sewage treatment plant (Kakonianka receiver), Bieliny sewage treatment plant (Belnianka receiver), main source of chemical pressures: development of urban areas: transport, tourism, urban runoff; agriculture, industrial sewage discharge points.
WilkówKielce district, Bodzentyn commune200410.4avg. 1.57 m; max. 3.0 mDopływ ze Św. Katarzyny, (Ciek od Psar, Ciek od Zagórza)forest areas (44.3%);
agricultural areas (44.2%),
grasslands (7.9%),
loose construction (2.5%),
industrial/commercial zones (1.1%)
[37]
Sewage treatment plant in Św. Katarzyna (Lubrzanka receiver), agriculture.
RejówSkarżysko district, Skarżysko-Kamienna commune193930avg. 1.5 m; max. 7 mKamionkaforest areas (59%); agricultural areas (31.2%), meadows (4.8%), other (5%) [24].Sewage treatment plant in Kamionki (Kamionka receiver); Sewage treatment plant in Suchedniów (Kamionka receiver); industrial, municipal and domestic sewage discharge points.
Table 2. Classification of bottom sediments by geo-accumulation index (Igeo).
Igeo ValueClassPollution Degree
<00Unpolluted
0–11Unpolluted to moderately polluted
1–22Moderately polluted
2–33Moderately to highly polluted
3–44Highly polluted
4–55Highly to very highly polluted
>56Very highly polluted
Table 3. Classification of bottom sediments by contamination factor (CF) [43].
CFClassPollution Degree
<11Low contamination
1 ≤ CF < 32Moderate contamination
3 ≤ CF < 63Considerable contamination
≤64Very high contamination
Table 4. PTEs content of Rejów, Borków, Wilków reservoirs in water.
PTEs [mg/L]Borków (1)Wilków (2)Rejów (3)AnovaPost Hoc
MSDMSDMSDFdfp
Cr0.00030.00000.00030.00010.00030.00001.00420.605-
Zn0.05000.00000.05000.00000.05000.00000.00021.000-
Cd0.00010.00000.00020.00010.00010.00004.28620.117-
Mn0.00500.00000.14000.00000.01120.009112.61420.0021 < 2, 1 < 3, 2 > 3
Cu0.00270.00070.00280.00040.00200.00056.09820.0471 > 3, 2 > 3
Ni0.00180.00180.00140.00050.00100.00002.04120.360-
Pb0.00160.00090.00200.00000.00200.00002.50020.287-
Fe0.26380.04500.40300.17610.14740.06926.98020.0312 > 1, 2 > 3, 1 > 3
Notes: Source: Own research. Statistically significant results in bold.
Table 5. Metal content of Rejów, Borków, Wilków reservoirs in sediments.
Metal [mg/kg]Borków (1)Wilków (2)Rejów (3)AnovaPost Hoc
MSDMSDMSDFdfp
Cr11.261.6210.060.1310.000.005.13920.077-
Zn65.8224.1819.1019.728.623.778.55520.0141 > 2, 1 > 3
Cd1.120.181.020.041.000.002.64720.266-
Co5.000.005.000.005.000.000.00021.000-
Mn170.6056.00140.8850.3452.5214.669.89320.0071 > 3, 2 > 3
Cu6.721.775.380.855.000.006.91120.0321 > 3
Ni6.161.775.420.945.000.002.29920.317-
Pb8.662.695.741.655.000.0010.41120.0051 > 2, 1 > 3
Fe5456.601516.062780.001955.051844.801406.418.06020.0181 > 2, 1 > 3
Notes: Source: Own research. Statistically significant results in bold.
Table 6. Metal content of macrophytes in Rejów, Borków, Wilków reservoirs.
Metal [mg/kg]Borków (1)Wilków (2)Rejów (3)AnovaPost Hoc
MSDMSDMSDFdfp
Cr25.4814.2127.333.6376.0579.371.66020.436-
Zn69.1321.4473.8514.1267.4038.350.80820.668-
Cd3.083.312.650.661.250.505.12620.077-
Co5.000.005.000.005.000.000.00021.000-
Mn1501.751269.702307.751470.721287.751521.242.00020.368-
Cu8.030.9011.031.6211.857.254.69920.095-
Ni13.585.6017.002.1029.2319.352.19220.334-
Pb6.251.4810.853.945.000.005.30920.070-
Fe11,089.511,687.9710,793.254259.455004.504223.453.50020.174-
Notes: Source: Own research.
Table 7. Metal content of water, sediment, macrophytes in Borków reservoir.
Metal [mg/kg]Water (1)Bottom Sediment (2)Macrophytes (3)AnovaPost Hoc
MSDMSDMSDFdfp
Cr0.00030.000011.261.6225.4814.2111.75220.0033 > 1, 3 > 2
Zn0.05000.000065.8224.1869.1321.449.41420.0092 > 1, 3 > 1
Cd0.00010.00001.120.183.083.3110.46820.0052 > 1,3 > 1
Co--5.000.005.000.000.00011.000-
Mn0.00500.0000170.6056.001501.751269.7010.73220.0052 > 1, 3 > 1
Cu0.00270.00076.721.778.030.909.68520.0082 > 1, 3 > 1
Ni0.00180.00186.161.7713.585.6011.43520.0032 > 1, 3 > 1
Pb0.00160.00098.662.696.251.4810.03620.0072 > 1, 3 > 1
Fe0.26380.04505456.601516.0611,089.511,687.979.10320.0112 > 1, 3 > 1
Notes: Source: Own research. Statistically significant results in bold.
Table 8. Metal content in water, sediment, macrophytes in Wilków reservoir.
Metal [mg/L; mg/kg]Water (1)Bottom Sediments (2)Macrophytes (3)AnovaPost Hoc
MSDMSDMSDFdfp
Cr0.00030.000110.060.1327.333.6311.85820.0032 > 1, 3 > 1, 3 > 2
Zn0.05000.000019.1019.7273.8514.1212.10320.0022 > 1, 3 > 1, 3 > 2
Cd0.00020.00011.020.042.650.6611.93920.0032 > 1, 3 > 1, 3 > 2
Co--5.000.005.000.000.00011.000-
Mn0.14000.0000140.8850.342307.751470.7212.10320.0022 > 1, 3 > 1, 3 > 2
Cu0.00280.00045.380.8511.031.6211.83120.0032 > 1, 3 > 1, 3 > 2
Ni0.00140.00055.420.9417.002.1011.96620.0032 > 1, 3 > 1, 3 > 2
Pb0.00200.00005.741.6510.853.9411.24920.0042 > 1, 3 > 1, 3 > 2
Fe0.40300.17612780.001955.0510,793.254259.4511.08320.0042 > 1, 3 > 1, 3 > 2
Notes: Source: Own research. Statistically significant results in bold.
Table 9. Metal content of water, sediment, macrophytes in Rejów reservoir.
Metal [mg/kg]Water (1)Sediment (2)Macrophytes (3)AnovaPost Hoc
MSDMSDMSDFdfp
Cr0.00030.000010.000.0076.0579.3711.88320.0033 > 1
Zn0.05000.00008.623.7767.4038.3512.13120.0022 > 1, 3 > 2
Cd0.00010.00001.000.001.250.5011.87520.0032 > 1,3 > 1
Co--5.000.005.000.000.00011.000-
Mn0.01120.009152.5214.661287.751521.2411.57120.0032 > 1, 3 > 1
Cu0.00200.00055.000.0011.857.2512.10320.0023 > 1
Ni0.00100.00005.000.0029.2319.3512.68720.0022 > 1, 3 > 1, 3 > 2
Pb0.00200.00005.000.005.000.0013.00020.0022 > 1, 3 > 1
Fe0.14740.06921844.801406.415004.504223.4510.26020.0062 > 1, 3 > 1, 3 > 2
Notes: Source: Own research. Statistically significant results in bold.
Disclaimer/Publisher’s Note: The statements, opinions and data contained in all publications are solely those of the individual author(s) and contributor(s) and not of MDPI and/or the editor(s). MDPI and/or the editor(s) disclaim responsibility for any injury to people or property resulting from any ideas, methods, instructions or products referred to in the content.

