Abstract
Deep sea water (DSW) is a globally utilized source of renewable energy and other resources. To understand the characteristics of DSW resources in the South China Sea, in July 2022, the Guangzhou Marine Geological Survey (GMGS) investigated temperature, salinity, pH, dissolved oxygen (DO), inorganic salts (DIN, PO43−-P, and SiO3-Si), heavy metals (Hg, Pb, As, and Cd), trace elements (Cu, Zn, Fe, Mn, Ni, Se, and Mo), and other related indicators. The results of this investigation elucidate the horizontal and vertical changes in the physical and chemical properties of deep sea water in the Xisha Sea. The surface seawater quality in Xisha was found to be excellent and to meet first-class seawater survey standards. However, the concentrations of various nutrient salts in the surface layer were relatively low. As the seawater depth increased, different trace elements and heavy metals exhibited variations, and the concentrations of various nutrients also gradually increased.
1. Introduction
With the significant increase in population and economic growth, many countries face problems such as the depletion of terrestrial resources, space constraints, and environmental degradation, which gravely affect sustainable development [1]. To address resource constraints, countries worldwide have been focusing on the development and utilization of marine resources [1]. The oceans, as a pool of resources for the entire world, have considerable social and economic significance and are crucial to national security and strategic interests. Therefore, China has launched a key development strategy aimed at its emergence as a maritime power [2]. The South China Sea (SCS) is a strategically important tropical marginal sea at low latitudes connecting the East China Sea and the Pacific Ocean via the Taiwan Strait in the northeast; the Java Sea, the Andaman Sea, and the Indian Ocean via the Strait of Malacca in the south; and the Sulu Sea via the Bashi Channel in the east [3]. The South China Sea, driven by the water exchange in the strait, exhibits a remarkable three-layered circulation structure, with an upper layer (from the surface to 750 m), a middle layer (from 75 to 2400 m), and a lower layer (from 2400 m to the deeper layer); through the Luzon Channel, Pacific Ocean waters enter the SCS through the upper and lower layers and SCS waters return to the Pacific Ocean from the middle layer [4].
Deep sea water (DSW), which constitutes 95% of all seawater, generally refers to depths greater than 200 m [5,6,7]. It originates in the Arctic Sea near Greenland, where the seawater density increases due to the formation of ice on the surface, leading to vertical sinking. This process contributes to the formation of deep sea currents that flow through the Atlantic and Indian Oceans, upwelling along the western Pacific coast [8]. Deep sea water is low in temperature and high in purity, nutrients, and trace elements [9,10,11]. It has been widely used in Japan, the USA, and South Korea as a raw material in the medical, agriculture, cosmetics, aquaculture, environmental restoration, and food industries [5,12], as it effectively enhances the value and quality of products. Previous studies have shown that DSW can improve cholesterol profiles in the serum and liver [13,14,15], prevent the atherogenesis process [16], reduce blood pressure [14,16,17], and be used in the treatment of diabetes [18]. A total of 222 Korean patents relating to DSW have been registered, of which 126 relate to the manufacturing and the treatment of foods, foodstuffs, or non-alcoholic beverages; 50 to production for medical, dental, or cosmetic purposes; 38 to water purification and the treatment of wastewater, sewage, and sludge; and 8 to fishery and farming [19].
The DSW resources in the SCS have attracted the interest of researchers in recent years [20]. Chinese DSW-related manufacturers mainly rely on imported DSW from overseas, which restricts the development of the DSW-related industry. The SCS, the largest and deepest sea in China, has the potential to provide high-quality deep sea water resources. Thus, an investigation of DSW in the Xisha area was carried out with the purpose of determining the quantity and quality of DSW resources in the area and providing baseline data for the further exploitation and utilization of DSW.
2. Materials and Methods
2.1. Survey Area and Stations
In July 2022, the Guangzhou Marine Geological Survey conducted a marine survey in the Xisha area, obtaining multidisciplinary and comprehensive survey data on the marine geology, marine physics, and physical and chemical properties of the seawater. The survey area was in the waters around the Yongle and Xuande Atolls, with 10 stations (Figure 1); different sampling depths were set up at different stations according to the topography and actual water depth, and a total of 90 seawater samples were collected. To investigate the correlations of the physical and chemical properties of deep ocean water at different latitudes and longitudes, stations XS-01, XS-02, XS-03, and XS-04 were used as longitudinal sections (DM1), and stations XS-03, XS-07, and XS-10 were used as latitudinal sections (DM2).
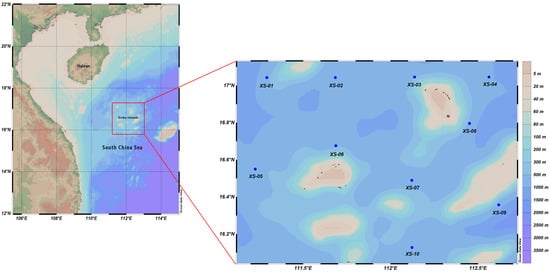
Figure 1.
Location of study area and survey stations in Xisha.
2.2. Sample Collection and Storage
Field sampling was conducted on Cruise 2023-07 of the Marine Geology Survey No. 4 on 17–27 July 2022 in Xisha. Seawater samples were collected from the surface to the bottom with an SBE 917 Plus conductivity–temperature–density and rosette system. Then, sterilized plastic sampling bottles were moistened twice with seawater and used for collecting 6.5 L of seawater. A volume of 500 mL was tested for acidity and alkalinity (pH), dissolved oxygen (DO), inorganic nitrogen (DIN), phosphates (PO43−-P), and silicates (SiO3-Si) on site. The remaining 6 L of each sample was stored in the ship’s cooler at 4 °C for refrigeration and preservation for heavy metal and trace element analyses in the lab. The collection, storage, and transportation of seawater samples referred to “Specification for Marine Investigation Part 4: Investigation of Seawater Chemical Elements” (GB/T 12763.4-2007) [21] and “Specification for Marine Monitoring Part 3: Sample Collection, Storage and Transportation” (GB/T 17378.3-2007) [22].
2.3. Physical and Chemical Property Detection
Temperature, salinity, and depth were determined according to the CTD sampling process, and pH, dissolved oxygen, and nutrient salts were determined according to the “Specifications for oceanographic survey—Part 4: Survey of chemical parameters in seawater” (GB/T 12763.4-2007) [21].
2.4. Testing of Trace Elements
Cu, Zn, Fe, Mn, Ni, Se, and Mo were tested with an inductively coupled plasma mass spectrometer, iCAPQ (Thermo, Waltham, MA, USA). Each seawater sample was filtered with a 0.22 μm filter membrane; then, 8 mL was filtered and diluted 10-fold, and the sample was transferred to an injection tube. The following were employed: the Rh action internal standard, collision gas mode (KED mode), a cleaning time of 15 s, a sample lifting time of 90 s, a residence or dwell time of 0.02 s, a plasma radio frequency power of 1400 W, a nebulizing gas (argon) volume flow rate of 1.08 L/min, a plasma flow rate of 14 L/min, and a temperature of the nebulization chamber of 3 °C. Data collection was repeated three times to take the average value. Hg was tested by using a BAF-2000 four-channel atomic fluorescence photometer (Beijing Baode Instrument Co., Ltd., Beijing, China). An appropriate amount of water sample was passed through a 0.22 μm filter membrane, and 8 mL was transferred to an injection tube. Multi-element Calibration Standard 2A-HG (containing 10 µg/mL elemental mercury) was selected as the standard sample, with the following settings: carrier current, 5% hydrochloric acid solution; reducing agent, 0.5% sodium hydroxide+2% potassium borohydride; negative high voltage, 300 V; lamp current, 30 mA; carrier gas flow, 400 mL/min; shielding gas flow, 800 mL/min; atomizer height, 8 mm; and atomizer temperature, 200 °C.
2.5. Statistical Analysis
The DSW data were processed by using Excel. The Pearson correlation analysis of the physical and chemical parameters was performed with SPSS 25.0 software and mapping with Ocean Data View 4.4 software.
3. Results and Discussion
3.1. Characteristics of Horizontal Distribution of Deep Sea Water in Xisha
3.1.1. Temperature, Salinity, and pH
There was significant spatial variability in seawater temperature, salinity, and pH in the survey area. The variation range of the sea surface temperature was 28.6–29.4 °C, with the highest value being found at station XS-06. With the increase in depth, the variation in seawater temperature gradually decreased, and the overall trend was relatively higher in the southwest direction and lower in the northeast direction (Figure 2). The salinity of the surface seawater was low, with a variation range between 33.11‰ and 33.38‰; that at depths of 200 m, 600 m, and 1000 m was higher than that in the surface layer, showing a trend of higher values in the northwest–southeast direction and lower values in the southwest–northeast direction (Figure 3). The pH of seawater at each station was in the range of 7.71~8.16, i.e., alkaline, with little change among stations, with the highest and lowest values occurring at stations XS-01 and XS-02, respectively; in contrast, at the depth of 600 m, the pH varied greatly (Figure 4).
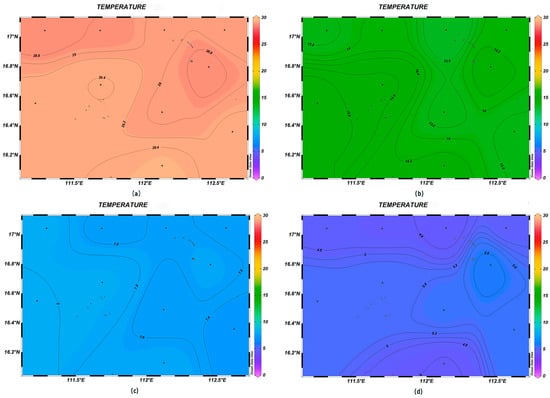
Figure 2.
Horizontal distribution of seawater temperature (°C) at different depths in Xisha: (a) 0 m, (b) 200 m, (c) 600 m, and (d) 1000 m.
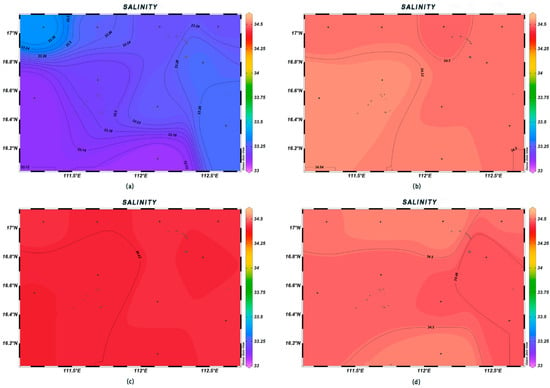
Figure 3.
Horizontal distribution of seawater salinity at different depths in Xisha: (a) 0 m, (b) 200 m, (c) 600 m, and (d) 1000 m.
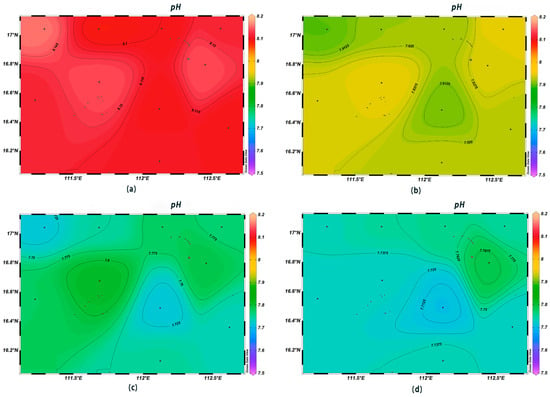
Figure 4.
Horizontal distribution of seawater pH at different depths in Xisha: (a) 0 m, (b) 200 m, (c) 600 m, and (d) 1000 m.
3.1.2. Dissolved Oxygen
At all stations, the surface seawater DO varied from 5.55 mg/L to 5.60 mg/L, and the mean value was 5.17 mg/L, with the maximum and minimum values occurring at stations XS-10 and XS-06, respectively. DO significantly decreased until the depth of 200 m and then gradually decreased until 1000 m below sea level. High DO values were found in the surface layer; those at the 200 m depth were high in the north and low in the south (Figure 5a,b), but at the 600 m and 1000 m depths, values were high in the west and low in the east (Figure 5c,d). In the marine environment, chronic oxygen deficiency occurs when DO levels fall between 2.0 and 6.0 mg/L [23]. It is hypothesized that these values were recorded because the survey was conducted during the summer months, when biological respiration and organic matter decomposition continuously consume the dissolved oxygen in the water [24], resulting in its low levels in the surface layer.
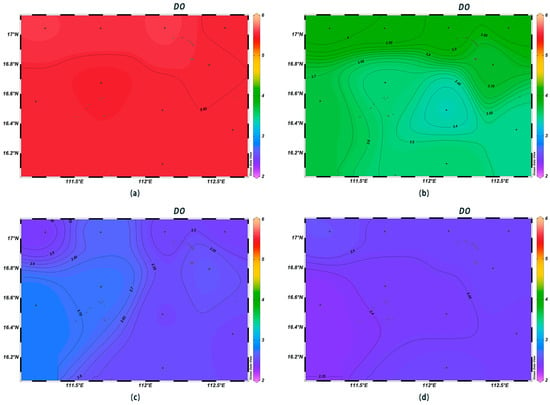
Figure 5.
Horizontal distribution of seawater DO (mg/L) at different depths in Xisha: (a) 0 m, (b) 200 m, (c) 600 m, and (d) 1000 m.
3.1.3. Nutrients
The DIN concentrations in the surface seawater at each station ranged from 0.003 to 0.194 mg/L, complying with first-class seawater quality standards. The DIN contents in the surface layer were low, with little variation among different areas, and they increased with depth. The highest DIN content was observed at 1000 m below sea level (Figure 6). The concentrations of PO43−-P in the surface water ranged from 0.008 to 0.039 μmol/L, with an average value of 0.03 μmol/L; they increased sharply in the range of 0–200 m, and from 200 m to 600 m, they were high in the west and low in the east (Figure 7). The surface concentrations of SiO3-Si ranged from 0.14 to 1.08 μmol/L, with an average value of 0.27 μmol/L; they increased sharply from 200 m to 600 m, and the highest content, 120 μmol/L, was found at the depth of 1000 m (Figure 8). The low concentrations of various nutrient salts in the surface seawater in Xisha are consistent with those observed in previous studies in the open waters of the South China Sea [25], the North Pacific Ocean [26], the North Atlantic Ocean [27], and the Southern Indian Ocean [28]. This was interpreted as a result of the strong phytoplankton production, the phenomenon of water column stratification, and the weak nutrient salt inputs.
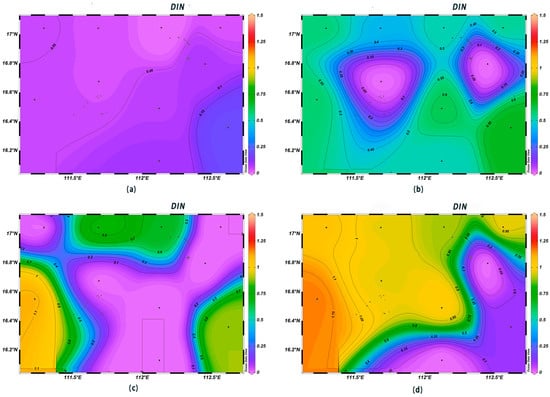
Figure 6.
Horizontal distribution of DIN (mg/L) in Xisha: (a) 0 m, (b) 200 m, (c) 600 m, and (d) 1000 m.
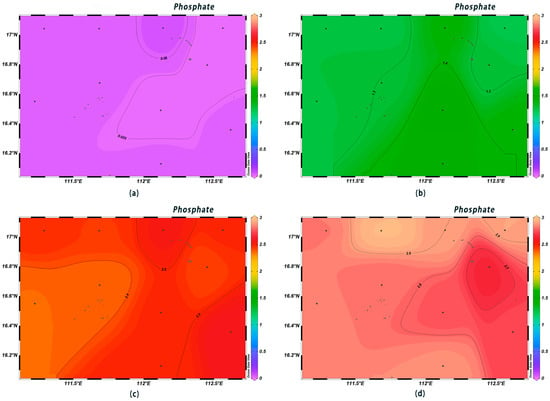
Figure 7.
Horizontal distribution of phosphate (μmol/L) in Xisha: (a) 0 m, (b) 200 m, (c) 600 m, and (d) 1000 m.
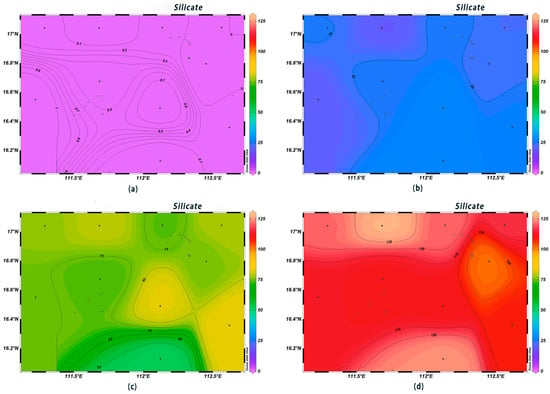
Figure 8.
Horizontal distribution of silicate (μmol/L) in Xisha: (a) 0 m, (b) 200 m, (c) 600 m, and (d) 1000 m.
3.1.4. Heavy Metals
Seawater is an important carrier of marine heavy metal elements, and their contents can reflect the quality of the marine water environment [29]. The Hg and Pb concentrations within the survey area were high in the northeast and showed a decreasing trend with the increase in depth. The As and Cd concentrations showed an increasing trend with the increase in depth, and low concentrations were observed in the northwestern and southeastern corners of the study area.
The concentrations of Hg at the depth of 200 m were in the range of 0.00–6.0 × 10⁻⁴ μmol/L, which was much lower than in the surface layer, which presented an average value of 3.79 × 10⁻⁴ μmol/L. The highest value occurred at station XS-01, and the lowest ones at stations XS-03 and XS-04. The Hg concentrations gradually decreased with an increase in depth, and at 1000 m, they were below 4.7 × 10⁻⁴ μmol/L (Figure 9). The Pb concentrations at the 200 m depth in the study area were in the range of 0.001–0.257 μmol/L, which was much lower than those of surface seawater, where the average value was 0.060 μmol/L, with the highest value occurring at station XS-09 and the lowest one at station XS-01. The Pb concentrations gradually decreased with an increase in depth, and the highest value was found at station XS-08 at 1000 m (Figure 10).
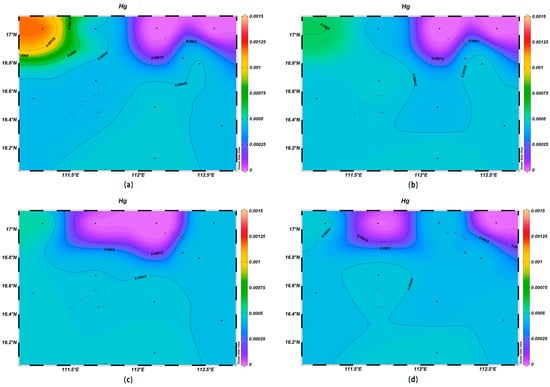
Figure 9.
Horizontal distribution of Hg (μmol/L) in Xisha: (a) 0 m, (b) 200 m, (c) 600 m, and (d) 1000 m.
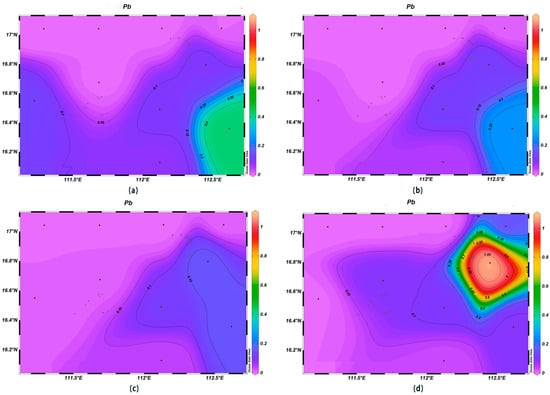
Figure 10.
Horizontal distribution of Pb (μmol/L) in Xisha: (a) 0 m, (b) 200 m, (c) 600 m, and (d) 1000 m.
The As concentrations were in the range of 0.011–0.030 μmol/L at the depth of 200 m, which was higher than in the surface layer, which had with an average value of 0.021 μmol/L. The highest value was found at station XS-02, and the lowest one at station XS-04; the concentrations of As gradually increased with an increase in depth, and the highest value was found at the depth of 1000 m at XS-10 (Figure 11). The Cd concentrations were in the range of 1.9 × 10⁻⁴–7.2 × 10⁻⁴ μmol/L at the depth of 200 m. In the surface layer, they were low, with a mean value of 4.1 × 10⁻⁴ μmol/L. The highest value was found at station XS-08 at the 1000 m depth, and the lowest one at station XS-06 (Figure 12).
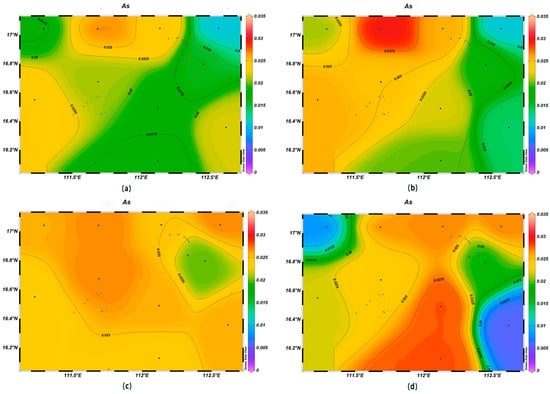
Figure 11.
Horizontal distribution of As (μmol/L) in Xisha: (a) 0 m, (b) 200 m, (c) 600 m, and (d) 1000 m.
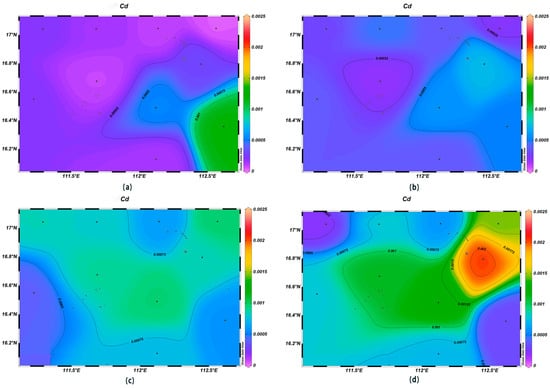
Figure 12.
Horizontal distribution of Cd (μmol/L) in Xisha: (a) 0 m, (b) 200 m, (c) 600 m, and (d) 1000 m.
3.1.5. Trace Elements
The concentrations of various trace elements exhibited varying trends with depth. Copper (Cu) concentrations ranging from 0.00 to 0.002 mg/L were recorded at the depth of 200 m, lower than surface seawater levels. Spatially, higher concentrations of Cu were noted in the northeast and lower ones in the southwest (Figure 13). For zinc (Zn), the highest concentrations were found in surface seawater, with a range of 0.000–0.011 mg/L, while at the depth of 200 m, its concentrations varied with a northeast–southwest high-concentration trend and lower levels elsewhere (Figure 14). The iron (Fe) concentrations at the depth of 200 m were between 0.041 and 0.083 mg/L, showing a central high-concentration area, with lower levels at the periphery of the study area (Figure 15). The manganese (Mn) concentrations at the 200 m depth were between 0.00019 and 0.00327 mg/L, lower than surface levels, with varying ranges at different depths (Figure 16). The nickel (Ni) concentrations at 200 m were higher than surface levels, ranging from 0.001 to 0.003 mg/L, with a general trend of higher concentrations in the south and lower in the north and consistent levels at the depths of 600 m and 1000 m (Figure 17). Selenium (Se) concentrations were uniform at different depths, meeting the criteria for first-class seawater, with a range of 0.0 to 9 × 10⁻⁴ mg/L at the depth of 200 m (Figure 18). The molybdenum (Mo) concentrations at the 200 m depth were higher than surface levels, with a range of 0.005 to 0.013 mg/L, and showed consistent planar distribution from the surface to the 200 m depth (Figure 19).
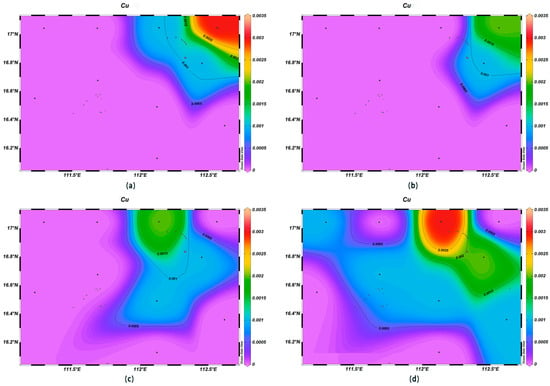
Figure 13.
Horizontal distribution of Cu (μmol/L) in Xisha: (a) 0 m, (b) 200 m, (c) 600 m, and (d) 1000 m.
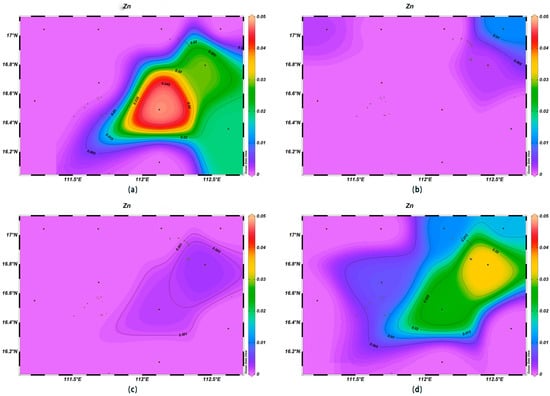
Figure 14.
Horizontal distribution of Zn (μmol/L) in Xisha: (a) 0 m, (b) 200 m, (c) 600 m, and (d) 1000 m.
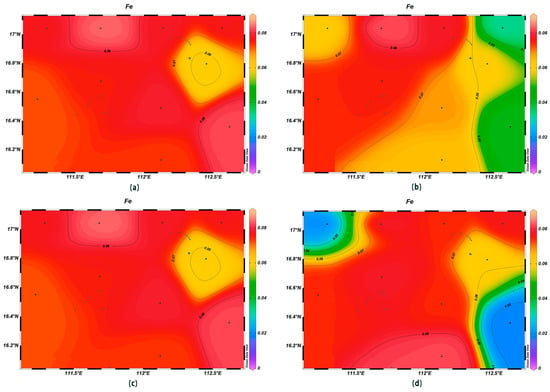
Figure 15.
Horizontal distribution of Fe (μmol/L) in Xisha: (a) 0 m, (b) 200 m, (c) 600 m, and (d) 1000 m.
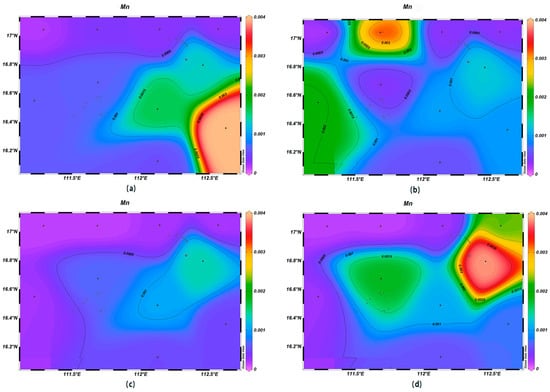
Figure 16.
Horizontal distribution of Mn (μmol/L) in Xisha: (a) 0 m, (b) 200 m, (c) 600 m, and (d) 1000 m.
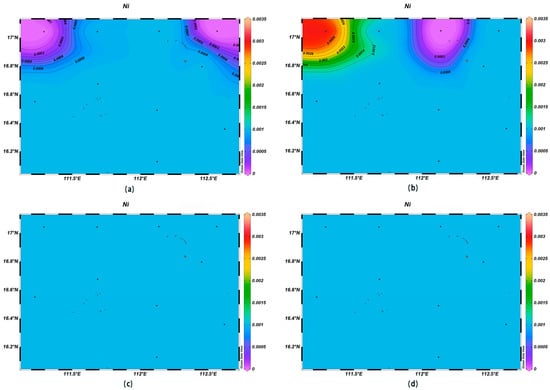
Figure 17.
Horizontal distribution of Ni(μmol/L) in Xisha: (a) 0 m, (b) 200 m, (c) 600 m, and (d) 1000 m.
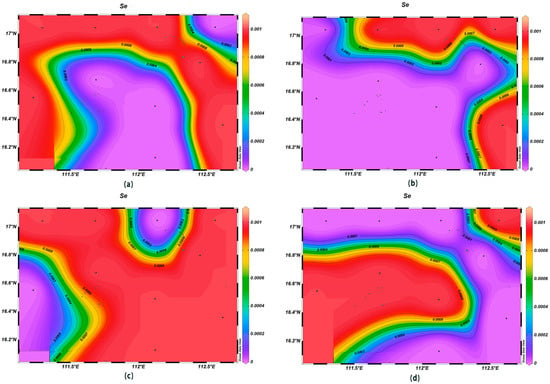
Figure 18.
Horizontal distribution of Se(μmol/L) in Xisha: (a) 0 m, (b) 200 m, (c) 600 m, and (d) 1000 m.
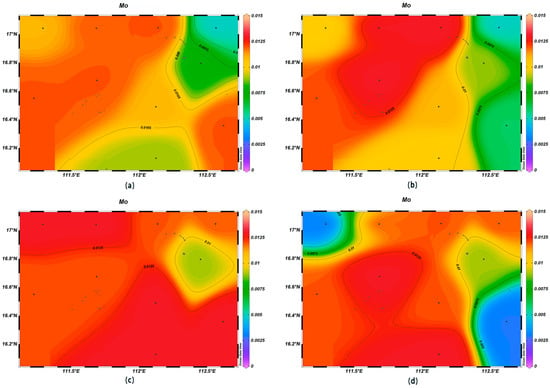
Figure 19.
Horizontal distribution of Mo (μmol/L) in Xisha: (a) 0 m, (b) 200 m, (c) 600 m, and (d) 1000 m.
3.2. Characteristics of Vertical Distribution of Deep Seawater in Xisha Sea Area
3.2.1. Temperature, Salinity, and pH
With an increase in seawater depth, the temperature and salinity showed regular changes. The former showed a decreasing gradient, reaching 4–5 °C at the depth of 1000 m; the latter increased to a peak at the depth of 200 m, then gradually decreased, and then increased again at the depth of 1000 m.
The pH values of seawater at varying latitudes and longitudes within the investigated region exhibited a decline with depth. At depths less than 500 m, the pH exhibited a more pronounced decline, decreasing from 8.16 to approximately 7.775. At depths greater than 500 m, the pH change was less pronounced, exhibiting a gradual tendency towards neutrality. In DM1, at 16.5°N, the lowest values were recorded at 600 m and 1000 m. With regard to DM2, 16.4°N to 16.6°N at depths of 500-800m, pH shows a trend of initially decreasing, then increasing, and subsequently decreasing again. (Figure 20). As Table 1 shows, the Pearson correlations calculated with SPSS between water temperature, salinity, pH, and dissolved oxygen and seawater depth, respectively, were found to be highly significant.
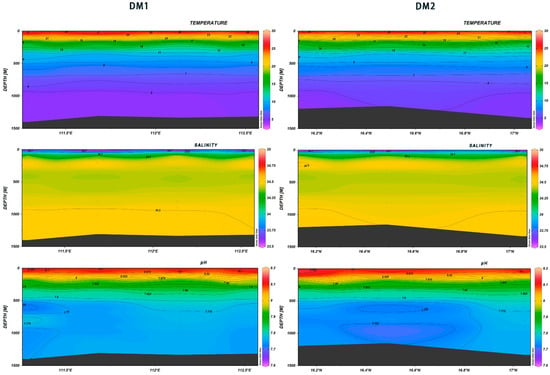
Figure 20.
Vertical distribution of temperature (°C) and salinity in Xisha.

Table 1.
The results of the correlation analyses of the physical and chemical properties of seawater and depth.
3.2.2. Dissolved Oxygen
The vertical distributions of DO in DM1 and DM2 showed some similarities, and overall, DO tended to decrease with the depth of the water layer. In DM2, at 111.25° E, the 600 m depth showed a steep decline in DO, followed by a gradual increase (Figure 21). The vertical distribution of dissolved oxygen in seawater is influenced by a multitude of factors, with the content in the surface layer typically being maintained at saturation levels by the water temperature [30]. Prior research has demonstrated that the annual variation in water temperature in the South China Sea is minimal, thereby reducing the impact of the temperature on DO concentrations. Consequently, biological factors emerge as the primary determinants of the vertical distribution of DO [31].

Figure 21.
Vertical distribution of DO in Xisha.
3.2.3. Nutrients
As illustrated in Figure 22, the DIN content exhibited a gradual increase with depth. However, the DM1 and DM2 data sets display divergent trends. The DM1 data demonstrate that DIN initially increased, then decreased, and subsequently increased again within the 112° E~112.5° E range. The data indicate that the DIN content reached its maximum value at the depth of 750 m in the area between 16.12° N and 16.65° N, after which it declined. The concentrations of phosphate and silicate demonstrated regular changes with the increase in depth in both the DM1 and DM2 data sets, although there were slight differences. A zone of slowly increasing salinity was observed between 16.3° N and 16.8° N in DM2, accompanied by a gradual increase in phosphate and silicate concentrations. A zone of gradually increasing silicate concentrations was observed between 112.3° E and 112.6° E. As Table 2 shows, the Pearson correlations calculated with SPSS between DIN, phosphate, and silicate and seawater depth, respectively, were found to be highly significant.
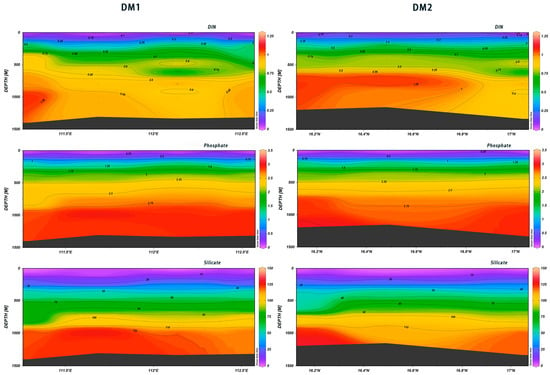
Figure 22.
Vertical distribution of nutrient salts in Xisha.

Table 2.
The correlation analysis between the nutrient salts of seawater and its depth.
3.2.4. Heavy Metals
The vertical distribution of heavy metals in natural seawater is typically influenced by a range of environmental factors associated with ocean dynamo processes, including current movement, temperature, salinity, and dissolved oxygen levels [32,33]. This investigation revealed that the concentrations of both Hg and Pb exhibited a slight increase with depth. Additionally, the concentrations of both elements demonstrated similarities within the same section, with DM1 concentrations being in the range of 111.25° E to 111.5° E, higher than those observed in other areas. Furthermore, the difference between surface and deeper seawater was more significant at station XS-01 (Figure 23). As demonstrated by the data, both As and Cd exhibited a pattern of increasing concentrations with the increase in depth across various sections. Notably, both elements demonstrated the lowest values at depths between 750 m and 850 m in the Deep Marine (DM) sections. The concentrations increased and then decreased at 111.25° E, with Cd showing very high values in the range of 16.3° N~16.8° N from 800 m to 1100 m (Figure 24). Despite its toxicity towards marine life, As is used as a micronutrient by phytoplankton in surface ocean waters [34,35]. Cd is regarded as a “nutrient” metal that is recycled by primary producers in the photic zone and is mainly used as a surrogate indicator of paleoproductivity. The sources of heavy metals at different depths in the Xisha area of the South China Sea can be categorized into two main types: natural sources and anthropogenic sources [35]. Heavy metals in surface seawater such as Pb and Hg may originate from atmospheric deposition; these elements enter the atmosphere due to industrial emissions, coal combustion, transportation, and other human activities and are then deposited into the ocean via precipitation or dry deposition [36]. Further, the uptake and recycling processes of phytoplankton affect the concentrations of certain metals, such as cadmium and copper. Phytoplankton absorb these metals during photosynthesis, and as biological matter sinks to the middle and deep water layers, the metals are released during the decomposition process [37]. In deeper waters, sediment resuspension and the release of seabed sediments are major sources of heavy metals. When seabed sediments are disturbed by ocean currents, tides, or geological activities, metals such as Cd and Ni, which have settled in the seabed, are re-released into the water [38,39].
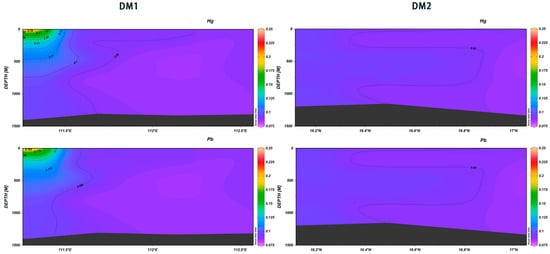
Figure 23.
Vertical distribution of Hg and Pb in Xisha.
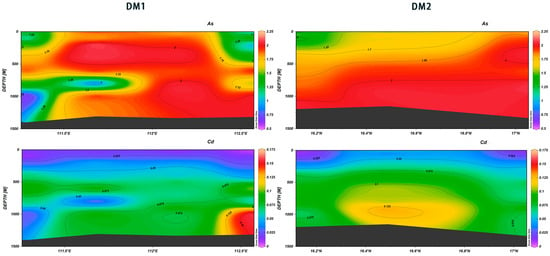
Figure 24.
Vertical distribution of As and Cd in Xisha.
3.2.5. Trace Elements
The vertical distribution of trace metal elements in the ocean can reflect their concentration and the balance of income and expenditure of these elements. In this study, it was found that the latitudinal and longitudinal sections of different trace elements showed different vertical distribution trends with the increase in depth. The concentrations of Cu, Zn, and Ni demonstrated consistency in DM2, and two high-value zones for Cu concentrations were found in the ranges of 400–600 m and 750–900 m at 16.3° N–16.8° N. At the depth of 900 m, two high-value zones were identified for Zn from 400 m to 500 m and from 800 m to 1100 m. Similarly, two high-value zones for Ni were observed at the depths of 400 m to 500 m and 750 m to 1100 m (Figure 25). Zn and Cu are essential to biological cycling by eukaryotes; they exhibit a nutrient-type profile in modern oceans with distinct surface water depletion [40,41] and are released back into deep ocean waters through the oxidation of organic matter [42]. Zinc is typically co-enriched with Cu and Ni, where the latter is a micronutrient essential for phytoplankton growth in the photic zone and is recycled during the remineralization of sinking organic particles in the water column [43]. Consequently, the vertical distribution characteristics of these three elements are hypothesized to be more consistent.
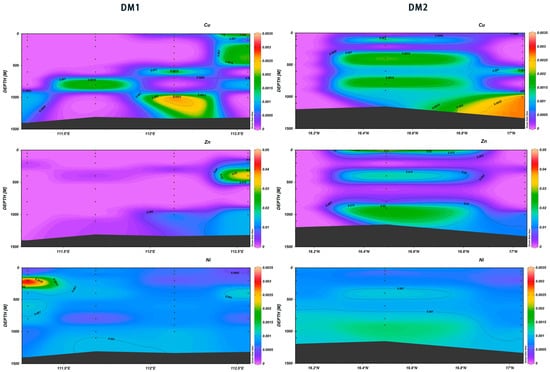
Figure 25.
Vertical distribution of Cu, Zn, and Ni in Xisha.
In the DM1 111.25° E~111.4° E range at the depth of 600 to 800 m, the maximum values of Fe and the minimum values of Mn were observed. In the DM2 16.3° N~16.8° N range, the concentration of Mn was the highest in the surface layer, while Fe exhibited the highest concentration at 700–800 m (Figure 26). Fe is a necessary trace element for the growth of phytoplankton, with N, P, and other nutrients having a similar function; due to the majority of dissolved iron being in surface seawater and organic complexing agent binding, its concentration is very low. Iron limitation of primary producers is prevalent in large sectors of the world’s oceans [44]. It has been reported that the increase in Fe (III) solubility with nutrient concentrations is likely related to the decomposition and transformation of sinking organic matter [45].
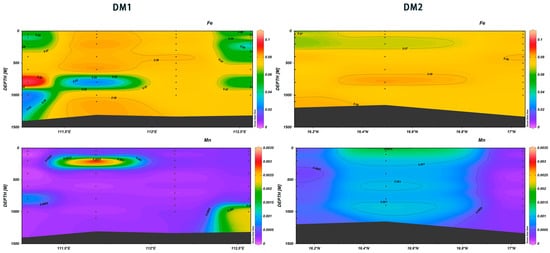
Figure 26.
Vertical distribution of Fe and Mn in Xisha.
In the range of DM1 111.5° E~112° E, for Se and Mo, extremely low values were recorded at 750–950 m and high values at 250–500 m. In the range of DM2 16.3° N~16.8° N, high values of Se and Mo were found at 500–900 m (Figure 27). Selenium is a required nutrient for phytoplankton in the photic zone, and it exhibits nutrient-like behavior in seawater [46]. Its biological interaction produces multiple forms of dissolved biomethylated Se species both in oxic and anoxic waters, which complicates the aqueous Se chemistry.
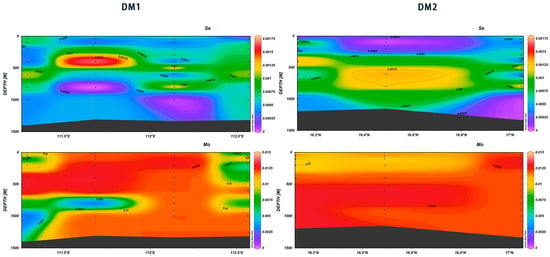
Figure 27.
Vertical distribution of Se and Mo in Xisha.
4. Conclusions
- The survey area is situated at a considerable distance from the mainland and is thus mainly affected by human activities on the islands and reefs in Xisha waters. The surface seawater quality was found to be excellent and to meet first-class seawater survey standards, which is consistent with the findings of previous surveys.
- The concentrations of various nutrient salts in the surface seawater of the Xisha Sea were relatively low. As the depth increased, the concentrations of various nutrient salts also increased in a gradual manner. Deep seawater contained relatively high nutrient and trace element concentrations, which provides an optimal environment for the growth of deep sea organisms and the maintenance of the ecosystem.
- This investigation elucidated the horizontal and vertical changes in the physical and chemical properties of deep seawater in the Xisha Sea, thereby providing theoretical support for the desalination and comprehensive utilization of seawater.
Author Contributions
Conceptualization, X.F. and D.L.; methodology, D.L. and X.L.; software, X.L.; validation, F.T.; formal analysis, X.G.; investigation, C.X.; data curation, C.J.; writing—original draft preparation, X.F.; writing—review and editing, X.F.; visualization, Y.W. and X.H.; supervision, M.H., L.T. and H.Z.; project administration, L.H. and M.C.; funding acquisition, L.H. and M.C. All authors have read and agreed to the published version of the manuscript.
Funding
This research was funded by China Geological Survey Projects, grant numbers DD20243522 and DD20221725; the National Natural Science Foundation of China, grant number 42376078; the Yazhou Bay Elite Talent Project, grant number SCKJ-JYRC-2023-05; and the Research Foundation of National Engineering Research Center for Gas Hydrate Exploration and Development, Innovation Team Project, grant number 2022GMGSCXYF410010.
Data Availability Statement
The data presented in this study are available upon request from the corresponding author.
Acknowledgments
The authors acknowledge their colleagues and HaiYangDiZhi 4 group, Guangzhou Marine Geological Survey, for data acquisition and analytical support.
Conflicts of Interest
The authors declare no conflicts of interest.
References
- Ahmad, F.; Saeed, Q.; Shah, S.M.U.; Gondal, M.A.; Mumtaz, S. Environmental sustainability: Challenges and approaches. Nat. Resour. Conserv. Adv. Sustain. 2022, 243–270. [Google Scholar]
- Group, M. Development strategy for China’s marine engineering science and technology to 2035. China Eng. Sci. 2017, 19, 108–117. [Google Scholar]
- Yang, H.; Liu, Q. A Review of Research on Ocean Circulation in the South China Sea. Adv. Earth Sci. 1998, 13, 5. (In Chinese) [Google Scholar]
- Wang, D.; Wang, Q.; Cai, S.; Shang, X.; Peng, S.; Shu, Y. Advances in research of the mid-deep South China Sea circulation. Sci. China Earth Sci. 2019, 62, 1192–2004. (In Chinese) [Google Scholar] [CrossRef]
- Nakasone, T.; Akeda, S. The application of deep sea water in Japan. In Proceedings of the 28th UJNR Aquaculture Panel Symposium, Kihei, HI, USA, 10–12 November 1999; UJNR Technical Report. Volume 28, pp. 69–75. [Google Scholar]
- Mohd Nani, S.Z.; Majid, F.A.A.; Jaafar, A.B.; Mahdzir, A.; Musa, M.N. Potential health benefits of deep sea water: A review. Evid. -Based Complement. Altern. Med. 2016, 2016, 6520475. [Google Scholar] [CrossRef]
- Takeuchi, H.; Yoshikane, Y.; Takenaka, H.; Kimura, A.; Islam, J.M.; Matsuda, R.; Ishizuka, S. Health effects of drinking water produced from deep sea water: A randomized double-blind controlled trial. Nutrients 2022, 14, 581. [Google Scholar] [CrossRef]
- Dickson, R.R.; Gmitrowicz, E.M.; Watson, A.J. Deep-water renewal in the northern North Atlantic. Nature 1990, 344, 848–850. [Google Scholar] [CrossRef]
- Gao, C.; Zhang, Y.; Wu, D.; Ma, L.; Zhang, Y.; Zhang, Q.; Huang, X. Development Status and Prospects of Deep Seawater Comprehensive Utilization Industry. IOP Conf. Ser. Earth Environ. Sci. 2019, 384, 012030. [Google Scholar] [CrossRef]
- Hwang, H.S.; Kim, H.A.; Lee, S.H.; Yun, J.W. Anti-obesity and antidiabetic effects of deep sea water on ob/ob mice. Mar. Biotechnol. 2009, 11, 531–539. [Google Scholar] [CrossRef]
- Qiu, J.; Wang, J.; Wang, J.; Si, X.; Chen, J. Role, Development and Utilization of Deep Sea Water. Ocean. Dev. Manag. 2017, 34, 97. (In Chinese) [Google Scholar]
- Fu, Z.Y.; Yang, F.L.; Hsu, H.W.; Lu, Y.F. Drinking deep seawater decreases serum total and low-density lipoprotein–cholesterol in hypercholesterolemic subjects. J. Med. Food 2012, 15, 5–541. [Google Scholar] [CrossRef] [PubMed]
- Sheu, M.J.; Chou, P.Y.; Lin, W.H.; Pan, C.H.; Chien, Y.C.; Chung, Y.L.; Wu, C.H. Deep sea water modulates blood pressure and exhibits hypolipidemic effects via the AMPK-ACC pathway: An in vivo study. Mar. Drugs 2013, 11, 2183–2202. [Google Scholar] [CrossRef] [PubMed]
- Hsu, C.L.; Chang, Y.Y.; Chiu, C.H.; Yang, K.T.; Wang, Y.; Fu, S.G.; Chen, Y.C. Cardiovascular protection of deep-seawater drinking water in high-fat/cholesterol fed hamsters. Food Chem. 2011, 127, 46–1152. [Google Scholar] [CrossRef] [PubMed]
- Miyamura, M.; Yoshioka, S.; Hamada, A.; Takuma, D.; Yokota, J.; Kusunose, M.; Nishioka, Y. Difference between deep seawater and surface seawater in the preventive effect of atherosclerosis. Biol. Pharm. Bull. 2004, 27, 1784–1787. [Google Scholar] [CrossRef]
- Chang, M.H.; Tzang, B.S.; Yang, T.Y.; Hsiao, Y.C.; Yang, H.C.; Chen, Y.C. Effects of deep-seawater on blood lipids and pressure in high-cholesterol dietary mice. J. Food Biochem. 2011, 35, 241–259. [Google Scholar] [CrossRef]
- Ha, B.G.; Shin, E.J.; Park, J.E.; Shon, Y.H. Anti-diabetic effect of balanced deep-sea water and its mode of action in high-fat diet induced diabetic mice. Mar. Drugs 2013, 11, 4193–4212. [Google Scholar] [CrossRef]
- Mac Takahashi, M.; Huang, P. Novel renewable natural resource of deep ocean water (DOW) and their current and future practical applications. Kuroshio Sci. 2012, 2000, 101–113. [Google Scholar]
- Chung, K.T.; Lee, S.H. Current status of applied Korean patents regarding the deep sea water. Korean J. Food Nutr. 2009, 22, 261–271. [Google Scholar]
- Ma, X.; Duan, M.; Duan, D.; Qiu, J.; Cao, J. A Study on Comprehensive Evaluation of Multiple-depth Sea Water Quality in the South China Sea. IOP Conf. Ser. Earth Environ. Sci. 2021, 809, 012013. [Google Scholar] [CrossRef]
- Zhu, Z.Y.; Zhang, J.; Wu, Y.; Zhang, Y.Y.; Lin, J.; Liu, S.M. Hypoxia off the Changjiang (Yangtze River) Estuary: Oxygen depletion and organic matter decomposition. Mar. Chem. 2011, 125, 108–116. [Google Scholar] [CrossRef]
- Ram, A.; Jaiswar, J.R.M.; Rokade, M.A.; Bharti, S.; Vishwasrao, C.; Majithiya, D. Nutrients, hypoxia and mass fishkill events in Tapi Estuary, India. Estuar. Coast. Shelf Sci. 2014, 148, 48–58. [Google Scholar] [CrossRef]
- Chen, C.T.A.; Wang, S.L.; Wang, B.J.; Pai, S.C. Nutrient budgets for the South China Sea basin. Mar. Chem. 2001, 75, 281–300. [Google Scholar] [CrossRef]
- Koike, I.; Ogawa, H.; Nagata, T.; Fukuda, R.; Fukuda, H. Silicate to Nitrate Ratio of the Upper Sub-Arctic Pacific and the Bering Sea Basin in Summer: Its Implication for Phytoplankton Dynamics. J. Oceanogr. 2001, 57, 253–260. [Google Scholar] [CrossRef]
- Louanchi, F.; Najjar, R.G. Annual cycles of nutrients and oxygen in the upper layers of the North Atlantic Ocean. Deep. Sea Res. Part. II Top. Stud. Oceanogr. 2001, 48, 2155–2171. [Google Scholar] [CrossRef]
- Jian-Yu, N.; Fang-Guo, W.; Xu-Ying, Y.; Min-Hui, Z.; Hong-Qiao, Z. Nutrients distribution in the South Indian Ocean. Geoscience 2011, 25, 322. [Google Scholar]
- Zaynab, M.; Al-Yahyai, R.; Ameen, A.; Sharif, Y.; Ali, L.; Fatima, M. Health and environmental effects of heavy metals. J. King Saud. Univ. -Sci. 2022, 34, 101653. [Google Scholar] [CrossRef]
- Joseph, L. Distribution of Dissolced Oxygen in the Summer Thermocline. J. Mar. Res. 1972, 30, 138–147. [Google Scholar]
- Lin, H.; Han, W.; Wang, H.; Cheng, S. Seasonal features of the dissolved oxygen maximum in vertical distribution in the Nansha Islands. Haiyang Xuebao 2001, 23, 5. (In Chinese) [Google Scholar]
- Bruland, K.W. Trace elements in seawater. Chem. Oceanogr. 1983, 8, 157–200. [Google Scholar]
- Nyamukamba, P.; Moloto, M.J.; Tavengwa, N.; Ejidike, I.P. Evaluating physicochemical parameters, heavy metals, and antibiotics in the influents and final effluents of South African wastewater treatment plants. Pol. J. Environ. Stud. 2019, 28, 1305–1312. [Google Scholar] [CrossRef]
- Andreae, M.O.; Froelich Jr, P.N. Arsenic, antimony, and germanium biogeochemistry in the Baltic Sea. Tellus B Chem. Phys. Meteorol. 1984, 36, 101–117. [Google Scholar] [CrossRef]
- Hanying, D.; Juan, S.U.; Shengzhen, Z.; Shaoxia, L.; Guanyu, C.; Fan, W. Investigating the contents and sources of heavy metals in winter season in the Xisha waters of South China Sea. J. Trop. Oceanogr. 2023, 42, 169–177. [Google Scholar]
- Xie, S.; Jiang, W.; Sun, Y.; Yu, K.; Feng, C.; Han, Y.; Wei, C. Interannual variation and sources identification of heavy metals in seawater near shipping lanes: Evidence from a coral record from the northern South China Sea. Sci. Total Environ. 2023, 854, 158755. [Google Scholar] [CrossRef] [PubMed]
- Cui, D.Y.; Wang, J.T.; Tan, L.J.; Dong, Z.Y. Impact of atmospheric wet deposition on phytoplankton community structure in the South China Sea. Estuar. Coast. Shelf Sci. 2016, 173, 1–8. [Google Scholar] [CrossRef]
- Xu, F.; Tian, X.; Yin, F.; Zhao, Y.; Yin, X. Heavy metals in the surface sed-iments of the northern portion of the South China Sea shelf: Distribution, contamination, and sources. Environ. Sci. Pollut. Res. 2016, 23, 8940–8950. [Google Scholar] [CrossRef]
- Xiaodong, L.; Liguang, S.; Xuebin, Y.; Yuhong, W. Heavy metal distributions and source tracing in the lacustrine sediments of Dongdao Island, South China Sea. Acta Geol. Sin. -Engl. Ed. 2008, 82, 1002–1014. [Google Scholar] [CrossRef]
- Sanders, J.G. Arsenic cycling in marine systems. Mar. Environ. Res. 1980, 3, 257–266. [Google Scholar] [CrossRef]
- Vallee, B.L.; Auld, D.S. Zinc: Biological functions and coordination motifs. Acc. Chem. Res. 1993, 26, 543–551. [Google Scholar] [CrossRef]
- Vance, D.; Baar, H.J.W.D.; Zhao, Y.; Abouchami, W. Biogeochemical cycling of zinc and its isotopes in the Southern Ocean. Geochim. Et. Cosmochim. Acta J. Geochem. Soc. Meteorit. Soc. 2014, 125, 653–672. [Google Scholar]
- Wen, L.S.; Jiann, K.T.; Santschi, P.H. Physicochemical speciation of bioactive trace metals (Cd, Cu, Fe, Ni) in the oligotrophic South China Sea. Mar. Chem. 2006, 101, 104–129. [Google Scholar] [CrossRef]
- Bruland, K.W. Oceanographic distributions of cadmium, zinc, nickel, and copper in the North Pacific. Earth Planet. Sci. Lett. 1980, 47, 176–198. [Google Scholar] [CrossRef]
- Hawkings, J.R.; Wadham, J.L.; Tranter, M.; Raiswell, R.; Benning, L.G.; Statham, P.J. Ice sheets as a significant source of highly reactive nanoparticulate iron to the oceans. Nat. Commun. 2014, 5, 3929. [Google Scholar] [CrossRef] [PubMed]
- Kuma, K.; Nishioka, J.; Matsunaga, K. Controls on iron (III) hydroxide solubility in seawater: The influence of pH and natural organic chelators. Limnol. Oceanogr. 1996, 41, 396–407. [Google Scholar] [CrossRef]
- Hu, M.; Yang, Y.; Martin, J.-M.; Yin, K.; Harrison, P.J. Preferential uptake of Se (IV) over Se (VI) and the production of dissolved organic Se by marine phytoplankton. Mar. Environ. Res. 1997, 44, 225–231. [Google Scholar] [CrossRef]
- Cooke, T.D.; Bruland, K.W. Aquatic chemistry of selenium: Evidence of biomethylation. Environ. Sci. Technol. 1987, 21, 1214–1219. [Google Scholar] [CrossRef]
Disclaimer/Publisher’s Note: The statements, opinions and data contained in all publications are solely those of the individual author(s) and contributor(s) and not of MDPI and/or the editor(s). MDPI and/or the editor(s) disclaim responsibility for any injury to people or property resulting from any ideas, methods, instructions or products referred to in the content. |
© 2024 by the authors. Licensee MDPI, Basel, Switzerland. This article is an open access article distributed under the terms and conditions of the Creative Commons Attribution (CC BY) license (https://creativecommons.org/licenses/by/4.0/).