Article

Case Study on the Adaptive Assessment of Floods Caused by Climate Change in Coastal Areas of the Republic of Korea

by
Taeuk Kang
1 and
Jungmin Lee
2,*
1
Industry-University Cooperation Foundation, Kyungsung University, Busan 48434, Republic of Korea
2
Land and Housing Research Institute, 99, Expo-ro 539beon-gil, Yuseong-gu, Daejeon 34047, Republic of Korea
*
Author to whom correspondence should be addressed.
Water 2024, 16(20), 2987; https://doi.org/10.3390/w16202987
Submission received: 29 August 2024 / Revised: 14 October 2024 / Accepted: 16 October 2024 / Published: 19 October 2024

Abstract

:
This study aims to assess the adaptability of coastal areas in the Republic of Korea to future climate change-induced flooding. Coastal areas can be susceptible to complex external factors, including rainfall, tide levels, storm surge wave overtopping, etc. The study employs an integrated approach to address this, connecting hydrological and marine engineering technologies. The models utilized in this study encompass XP-SWMM, ADCIRC, SWAN, and FLOW-3D. This study analyzed floods in 2050 and 2100, considering expected rainfall patterns, sea level rising, and an increase in typhoon intensity based on climate change scenarios for six coastal areas in the Republic of Korea. We reviewed the adaptability of flooding to climate change in each region.

1. Introduction

Many of the global population lives in low-lying coastal areas [1]. Furthermore, the number of people living in coastal areas globally is expected to increase from 1.8 billion to 5.2 billion by the 2080s [2]. However, coastal areas are exposed to flood drivers, such as high tides, extreme storm surges and precipitation (seawater and pluvial flooding), and river overflows (fluvial flooding) [3].
Climate change due to recent global warming raises the risk of disasters occurring in those coastal regions [4]. It is widely recognized that climate change can affect the drivers of flood events, including heavy rainfall, river discharge, and coastal water levels [5]. Tropical cyclones, such as typhoons, cyclones, and hurricanes, which cause storm surges and overtopping, are also risk factors in coastal areas. Many researchers have indicated that the intensity of these tropical systems, including their early stages as tropical depressions, is increasing due to climate change [6,7,8,9,10,11,12].
It is widely accepted that climate change will increase rainfall intensities by at least 6–7% per degree of global warming [13]. Consequently, many studies have analyzed the impact of floods, considering the effect of rainfall due to climate change [13,14,15,16,17]. Low-lying coastal environments are particularly susceptible to climate change impacts, especially sea level rise [18]. The global sea level is rising at ~3–4 mm/yr and is expected to accelerate due to ocean warming and land-based ice melt [19].
Sea level rise can lead to backwater in coastal area drainage systems, impeding the smooth disposal of rainwater and runoff, thus causing inland flooding. Wang et al. [5] and Li et al. [20] have analyzed future flood increases considering increased rainfall and sea level rise due to climate change. Specifically, Wang et al. [5] also took into account storm surge heights. These analysis approaches are primarily based on hydraulic engineering, considering sea level and storm surge heights as boundary conditions in hydraulic models for the hydrological analysis of watershed rainfall–runoff phenomena and drainage systems. Meanwhile, ocean engineering approaches to the flood risk in coastal areas due to climate change mainly involve studies related to sea level rise and overtopping caused by storm surges [21,22].
In the case studies based on these physical models, hydraulic engineers mainly focused on the watershed’s rainfall–runoff phenomena, often needing to concretely reflect ocean engineering physical phenomena. In particular, hydraulic engineers find it difficult to consider overtopping, which directly impacts coastal flooding. On the other hand, from an ocean engineering perspective, while focusing on sea level rise and increased typhoon intensity due to climate change, there is a limitation in implementing the watershed’s rainfall–runoff phenomena and drainage system. However, flooding in coastal areas is caused by a complex combination of factors such as rainfall, tide levels, and wave overtopping. Therefore, research focused on individual fields cannot accurately assess the impact of climate change-induced flooding in coastal areas.
Recently, studies have considered rainfall, tidal levels, storm surges, etc., due to climate change from a statistical perspective [23,24]. Additionally, Park and Lee [2] attempted to predict the impact of flooding in coastal areas due to climate change using machine learning. However, these studies can only provide a general overview of the effects of climate change on a global scale.
The preceding study by Lee et al. [4] analyzed detailed flooding issues caused by complex external forces in coastal areas by linking physical-based models such as XP-SWMM, ADCIRC, UnSWAN, and FLOW-3D. The factors considered in the study affecting flooding in coastal regions are watershed rainfall–runoff, tidal levels, storm surge heights, and wave overtopping. This study is a follow-up to the previous research, and it analyzes the flooding characteristics in coastal areas due to climate change. To this end, rainfall, tidal levels, storm surge heights, and wave overtopping were estimated, along with external force conditions that could occur in 2050 and 2100, for the flood analysis. The return period of all external force conditions was set at 100 years. In particular, hundreds of hypothetical typhoon scenarios were constructed and analyzed to account for the typhoons that could induce 100-year return period storm surge heights. This study implemented changes in the flooding patterns of coastal areas due to climate change by linking physical models from hydraulic and ocean engineering fields. Then, the adaptability to flooding issues in six coastal areas of the Republic of Korea due to climate change was evaluated.

2. Methods

2.1. Study Area

South Korea, located on a peninsula surrounded by three seas (the South Sea, the West Sea, and the East Sea), has distinct geographic characteristics. In this study, six areas, two from each coastal region, were selected to examine the adaptability of flood response to climate change in South Korea’s major coastal areas. All areas are susceptible to flooding due to rainfall-induced inland flooding, tidal levels, and storm surges causing overtopping. Figure 1 (left) shows the locations of the six coastal areas selected for this study.
High-resolution spatial information about areas prone to flooding is needed to improve the accuracy of flood analysis. In this study, high-resolution digital surface models (DSM) were developed using unmanned aerial surveys and terrestrial LiDAR (Light Detection and Ranging), taking into account the characteristics of each region (Figure 1 (right)). Table 1 presents vital information such as the watershed area and flooding characteristics for each target area.

2.2. Climate Change Scenario

2.2.1. Rainfall

In recent decades, climate change has manifested in changing frequencies and intensities of rainfall events [13,25]. Accordingly, various institutions in South Korea have conducted studies to estimate future rainfall amounts considering climate change. Future probable rainfall amounts were calculated using data derived from the Korea Meteorological Administration’s general circulation model (GCM), HadGem2-AO, and by performing temporal and spatial refinement. The Ministry of the Interior and Safety (MOIS), South Korea’s government agency responsible for disaster management, has presented the regional increase rates of probable rainfall in South Korea by ensemble averaging the probabilistic rainfall amounts analyzed in various ways to consider the increase in rainfall due to climate change [26]. This study utilized this data, and Table 2 shows the increased rates of probable rainfall for the target areas for the years 2050 and 2100.
Meanwhile, in this study, the 100-year return period probable rainfall was used to analyze the impact of flooding in coastal areas due to climate change. Table 3 presents the probable rainfall values for each region and rainfall duration for the present, 2050, and 2100. The 100-year return period probable rainfall for the present is based on the values provided by the Ministry of Environment (ME), the Republic of Korea [27], and the probable rainfall for 2050 and 2100 was calculated by applying the increased rates due to climate change, as shown in Table 2. In addition, this study used the region-specific Huff third-quartile distribution [27] to distribute the probable rainfall over time. It determined the rainfall duration by considering the critical duration for each region.

2.2.2. Storm Surge and Sea Level Rise

Tidal data have been observed for over 30 years for all selected coastal areas. In this study, the 100-year return period storm surge heights for the present were estimated using the Weibull Least Square Method (LSM) (3rd column in Table 4). Meanwhile, sea-level rise projections range from 0.3 to 2.0 m by 2100, depending on the methodology and emission scenario [19].
South Korea’s MOIS (2018) calculated sea-level rise rates for the short, medium, and long term to understand the trends of sea-level rise due to climate change. Table 4 shows the sea-level rise rates for each maritime area for 2050 and 2100, as determined in this study, using the rates provided by MOIS [28]. The sea-level rise rate for the Jeju region was calculated separately, as it is higher compared to the southern coast of the Korean Peninsula.

2.2.3. Typhoon Scenario and Intensity Increase

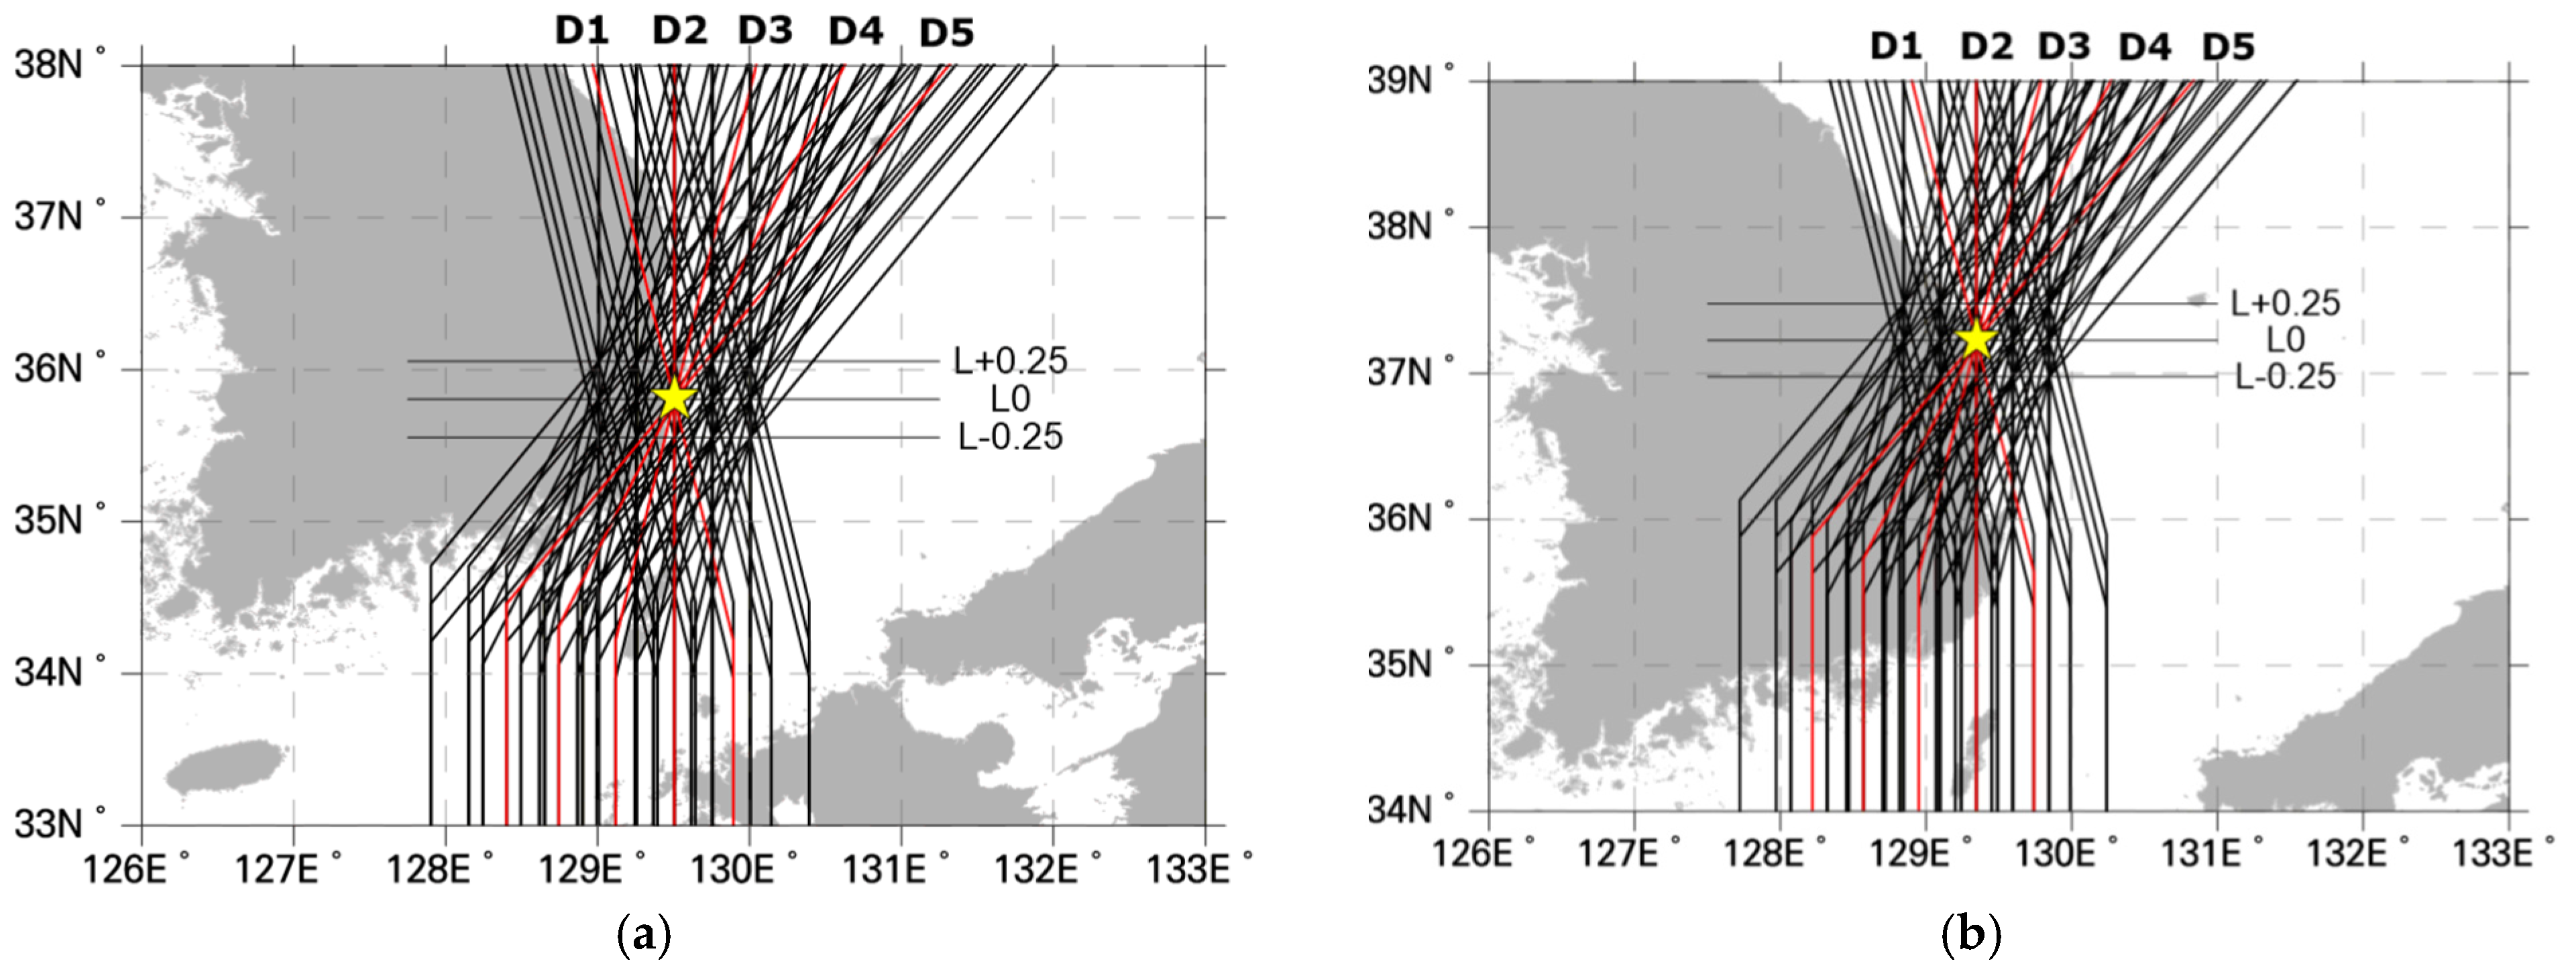
Typhoon scenarios were constructed to reproduce the 100-year return period storm surge heights (Table 4) for the study areas. The typhoon scenarios were developed based on the movement speed, landfall angle, trajectory, and central pressure of typhoons for each sea area, resulting in a total of 900 scenarios, including 260 scenarios for the southern coast, as shown in Table 5. Figure 2 illustrates hypothetical typhoon scenarios for Gampo Port (Gyeongju) and Imwon Port (Samcheok), located along the east coast.
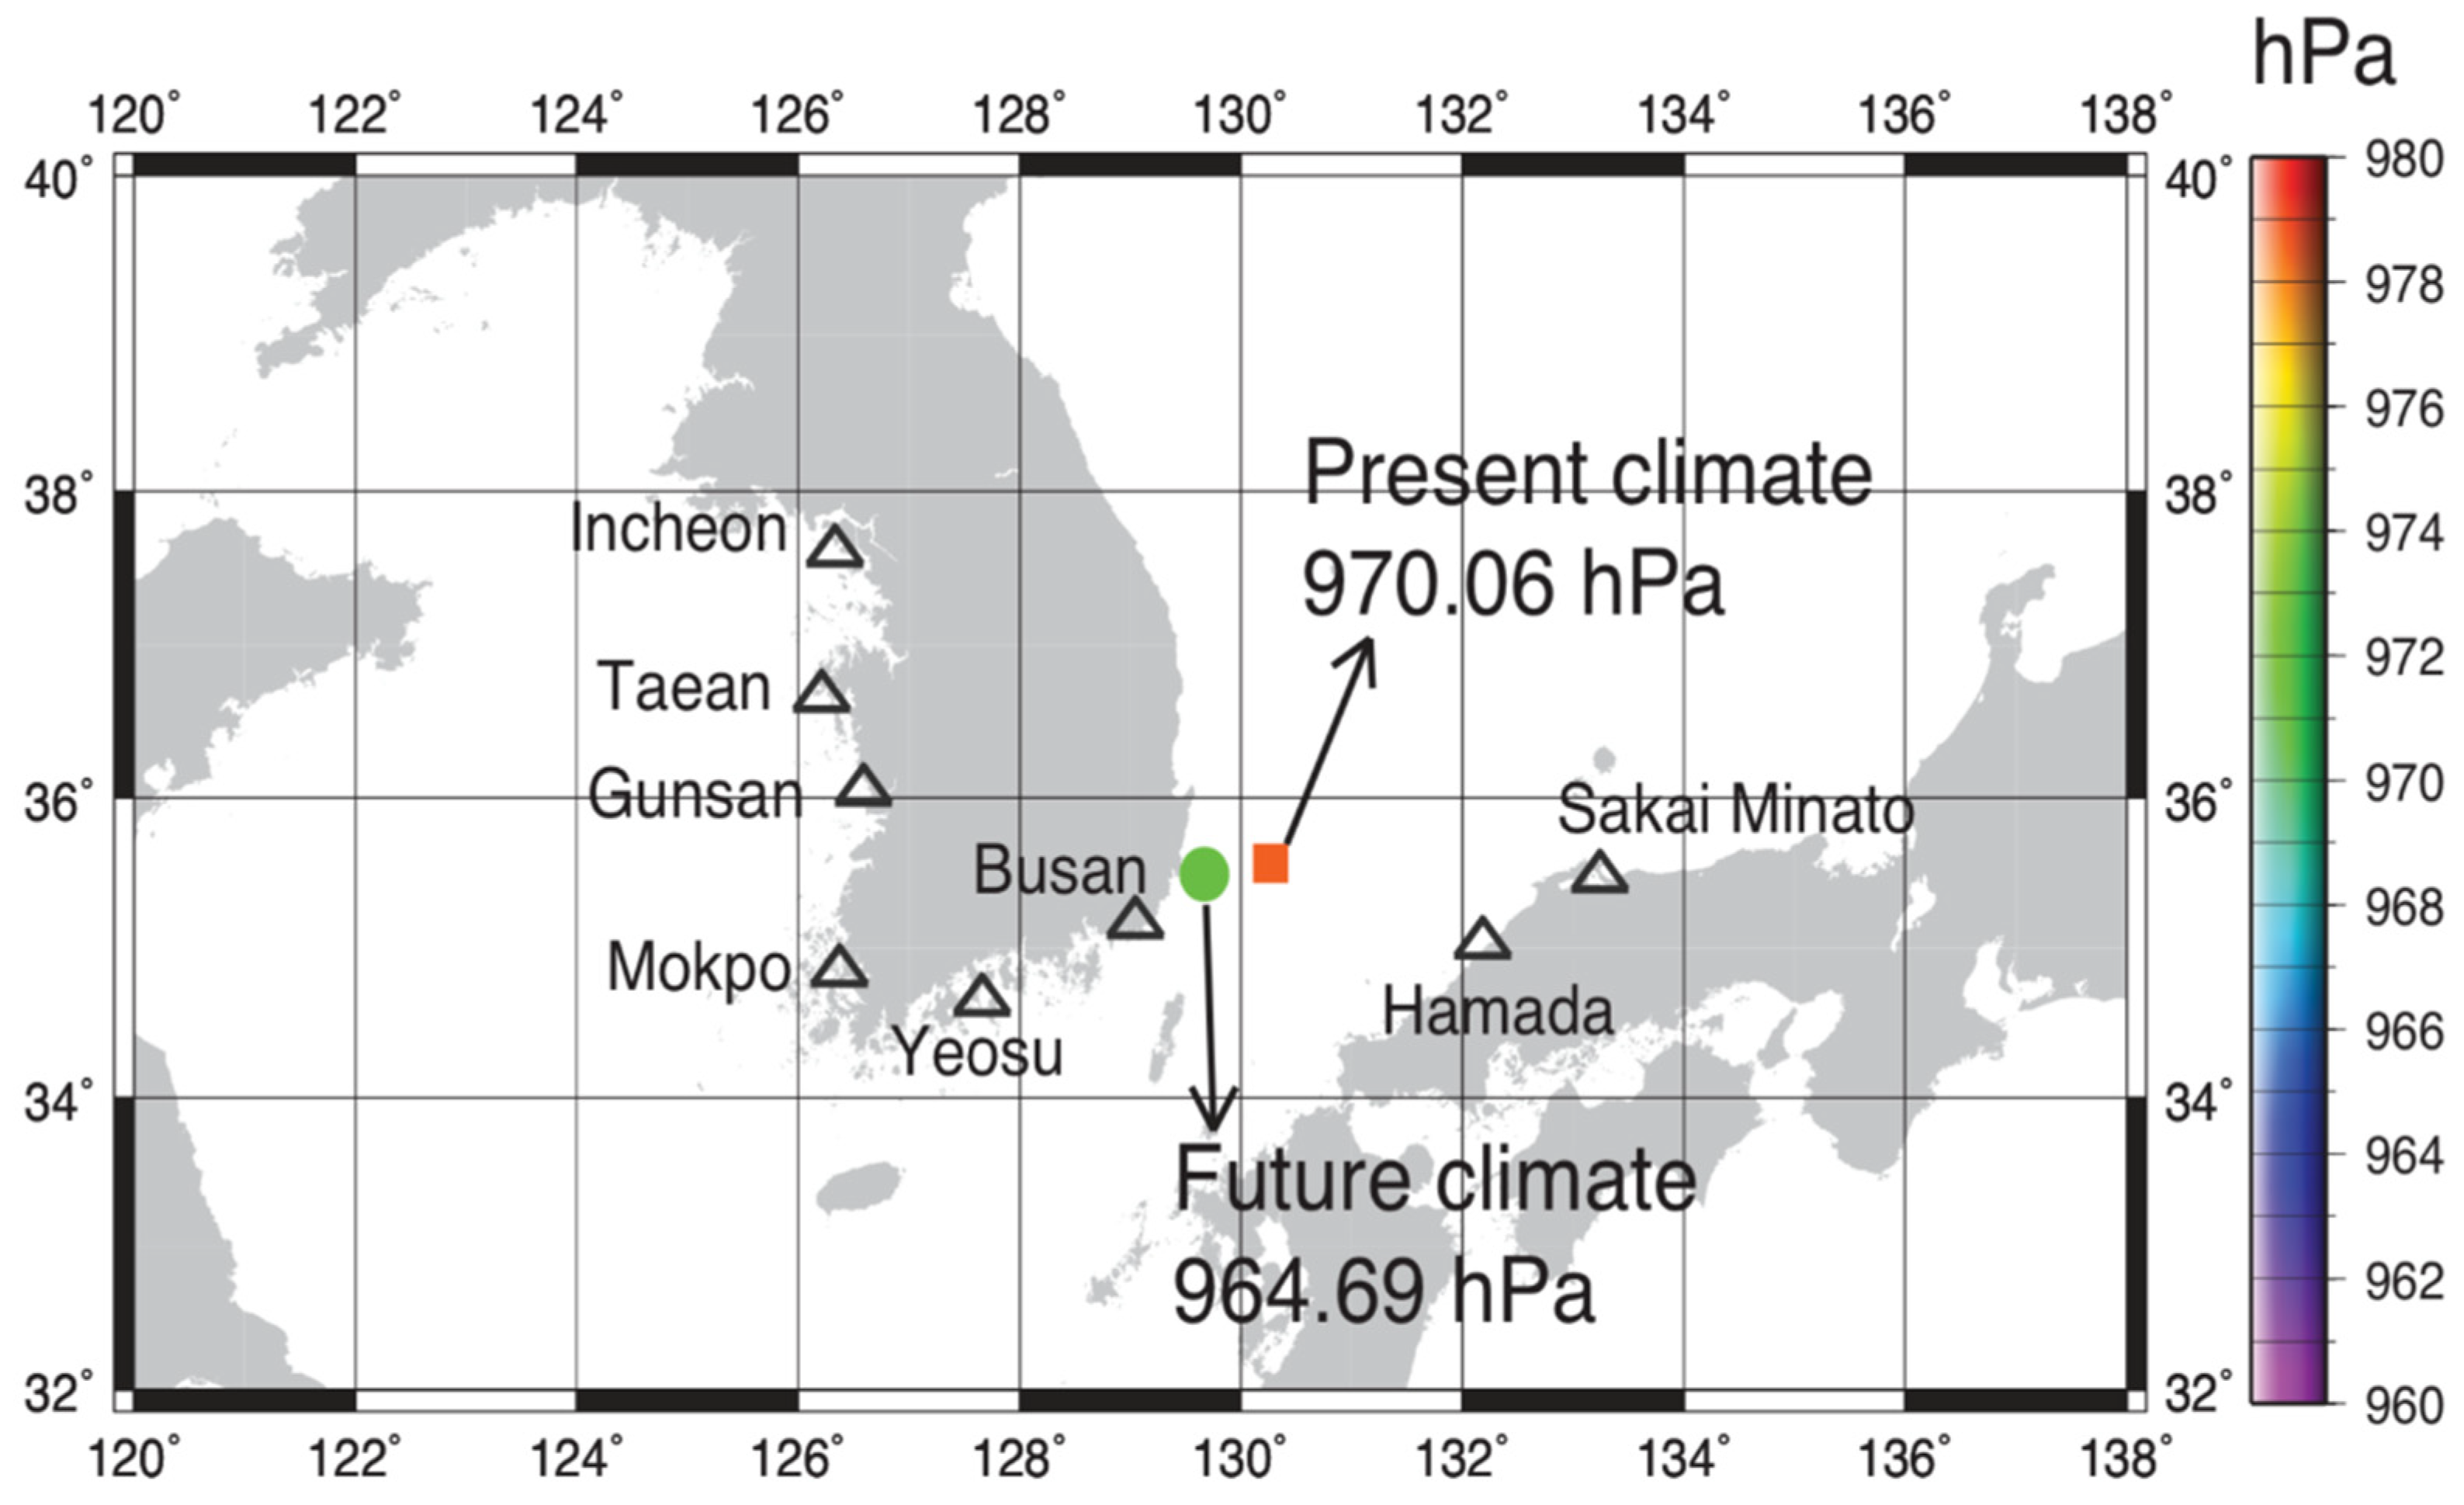
Meanwhile, typhoons are predicted to increase in size and frequency globally due to global warming, which affects factors such as the rise in surface water temperature [29,30]. Kim et al. [31] and Yang et al. [32] conducted quantitative research on changes in the intensity of typhoons affecting the Korean Peninsula due to climate change (Figure 3). In this study, we considered the increased rate of future typhoon intensity (central pressure) based on the results of these studies. Accordingly, the central pressure of typhoons is deemed to decrease by 0.7% by 2050 compared to the present and by 1.4% by 2100.

2.3. Models

This study considered tidal levels, overtopping, and rainfall as external conditions for flooding occurrences in coastal areas. Therefore, it was necessary to perform flood analysis considering these external conditions. Related to this, Lee et al. [4] proposed a method for flood analysis that considers tides, overtopping, and rainfall through the integration of physical-based models used in hydraulic, hydrological, and ocean engineering fields, as shown in Figure 4. This method was employed in this study.
Firstly, to analyze the impact of storm surges caused by typhoons, it is essential to adequately reproduce changes in sea levels, tides, and waves, considering factors such as pressure drops, sea winds, and progression speeds caused by typhoons. This study used the validated and accredited storm surge model ADCIRC and the wave model UnSWAN, combined as ADCSWAN (coupled model of ADCIRC and UnSWAN). While the hydrostatic assumption of ADCSWAN has the disadvantage of applying a simple empirical formula for overtopping calculation, FLOW-3D can reproduce high-resolution coastal boundaries. Therefore, ADCSWAN was used for analysis in the open sea, while FLOW-3D was used for study in the coastal sea areas and calculating overtopping rates.
On the other hand, to simulate flooding in coastal areas, it is necessary to analyze rainfall–runoff phenomena in watersheds and the drainage system, including stormwater conduits. Investigating water flow over the surface from overflowing drainage systems and including sea tides and overtopping rates as boundary conditions is also essential. This study employed XP-SWMM, which is highly effective in simulating urban flooding for these phenomena.

3. Results

3.1. Analysis of Storm Surge and Validation

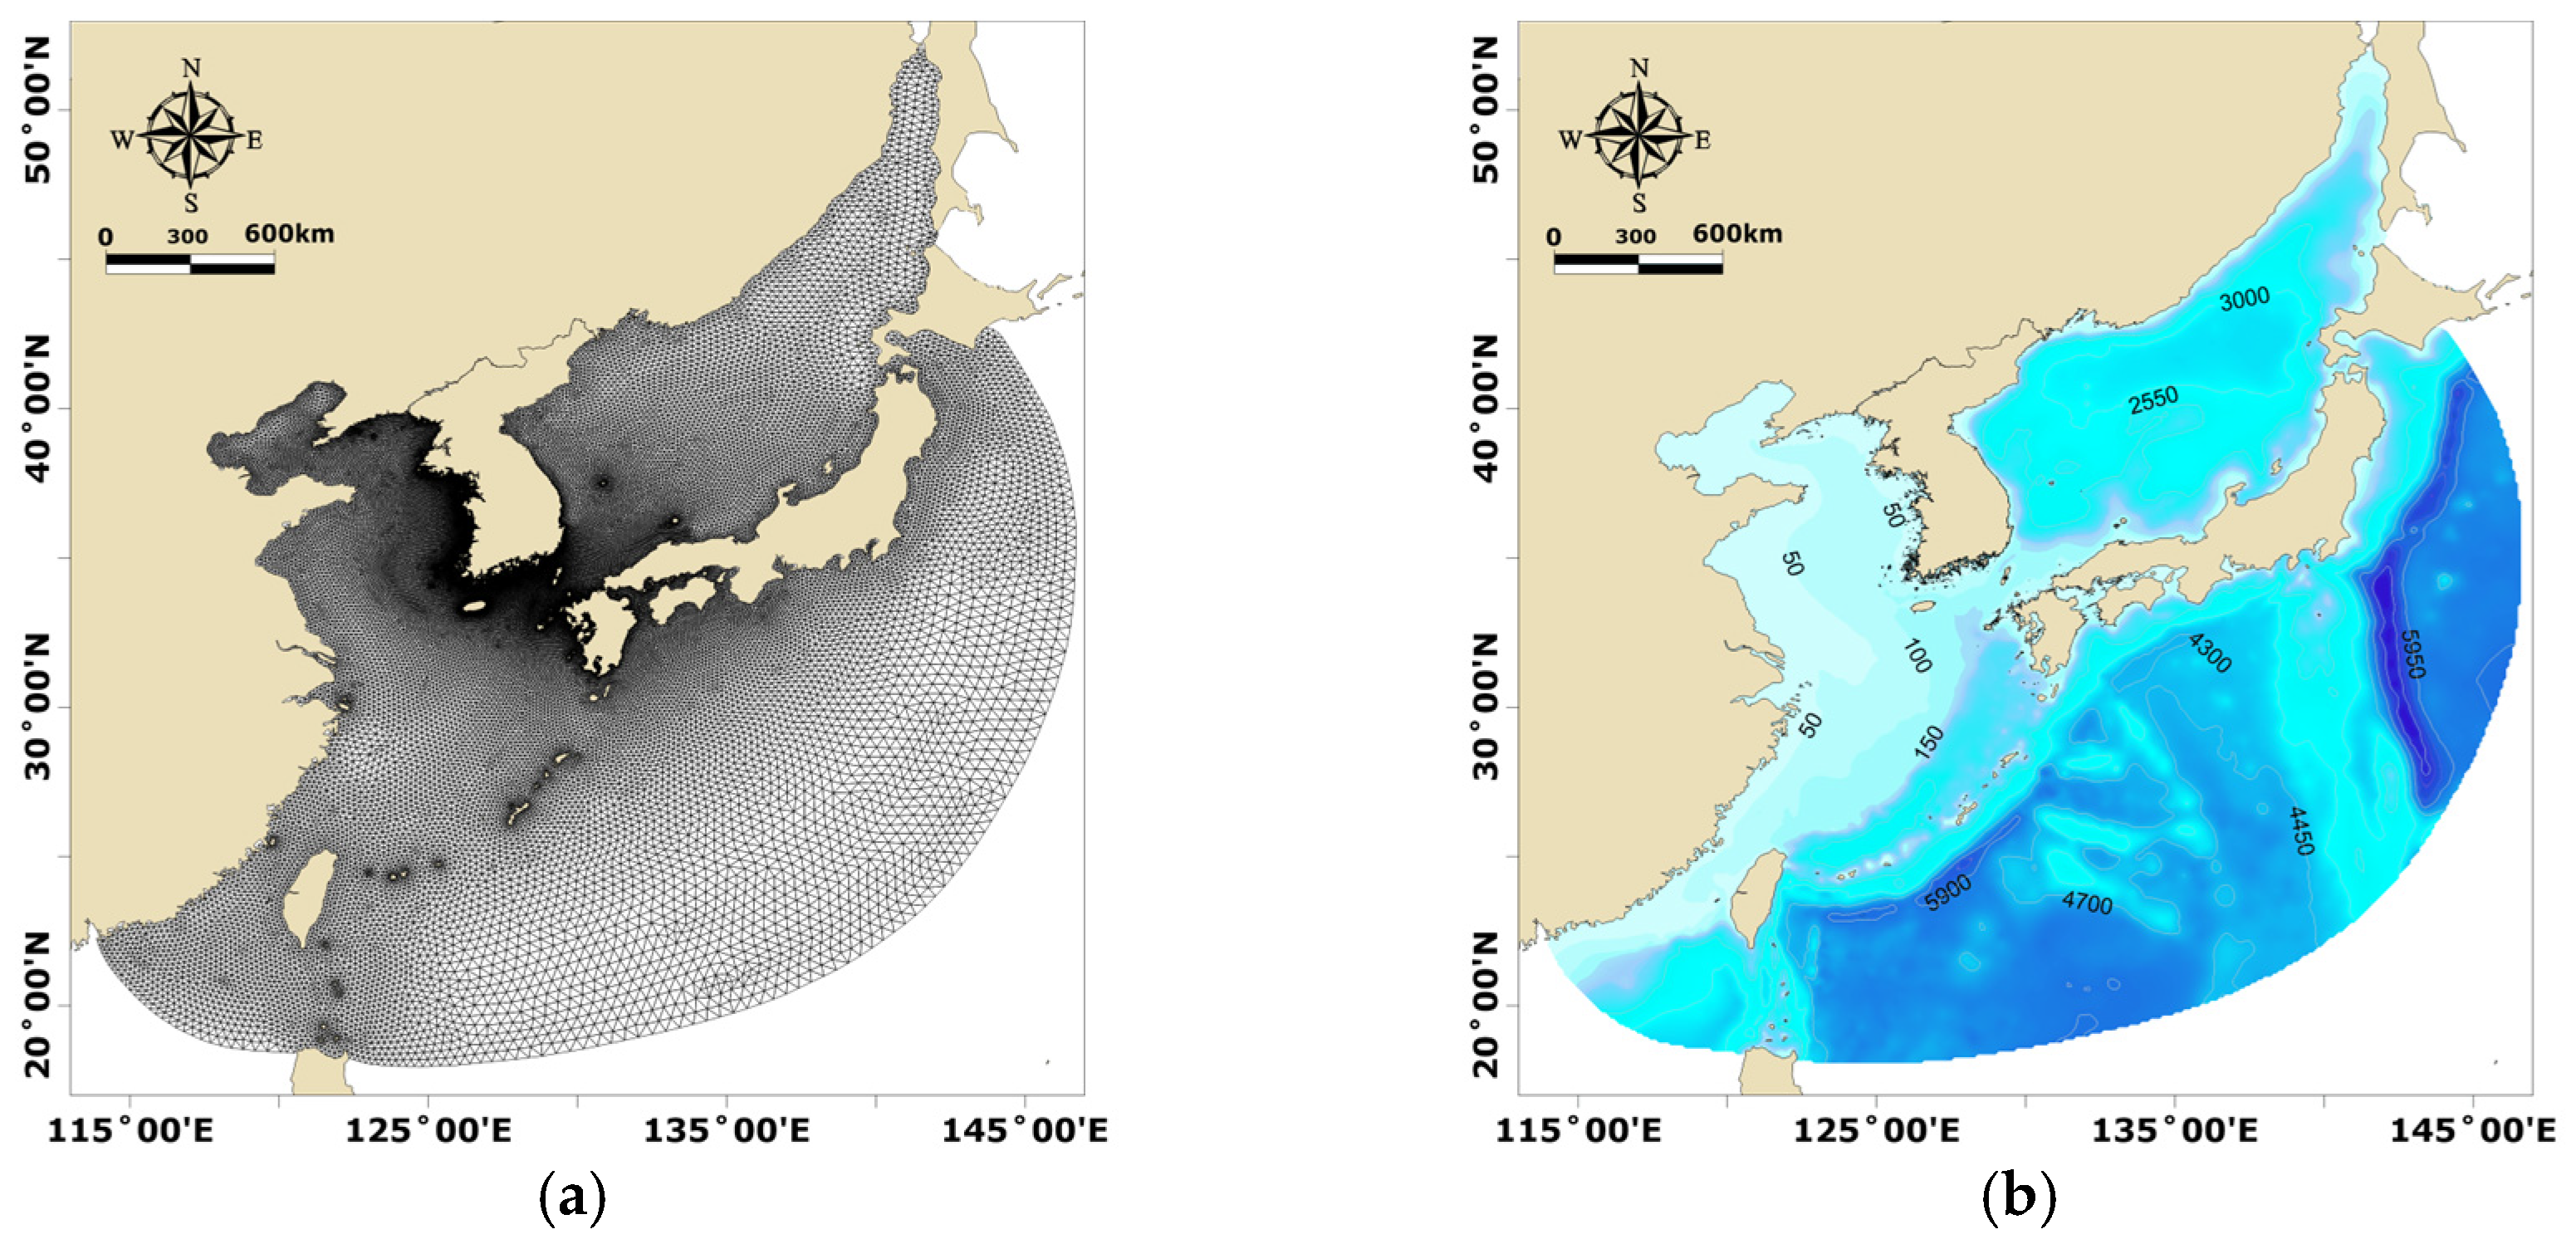
The storm surge model was constructed using the ADCSWAN model. The model area for considering the interaction between tides and waves was set to a sufficiently large area, including the East Sea of Korea, Japan, and the Yellow East China Sea. The computational grid consisted of high-resolution triangular meshes ranging from 20 m to 2 km in size (Figure 5).
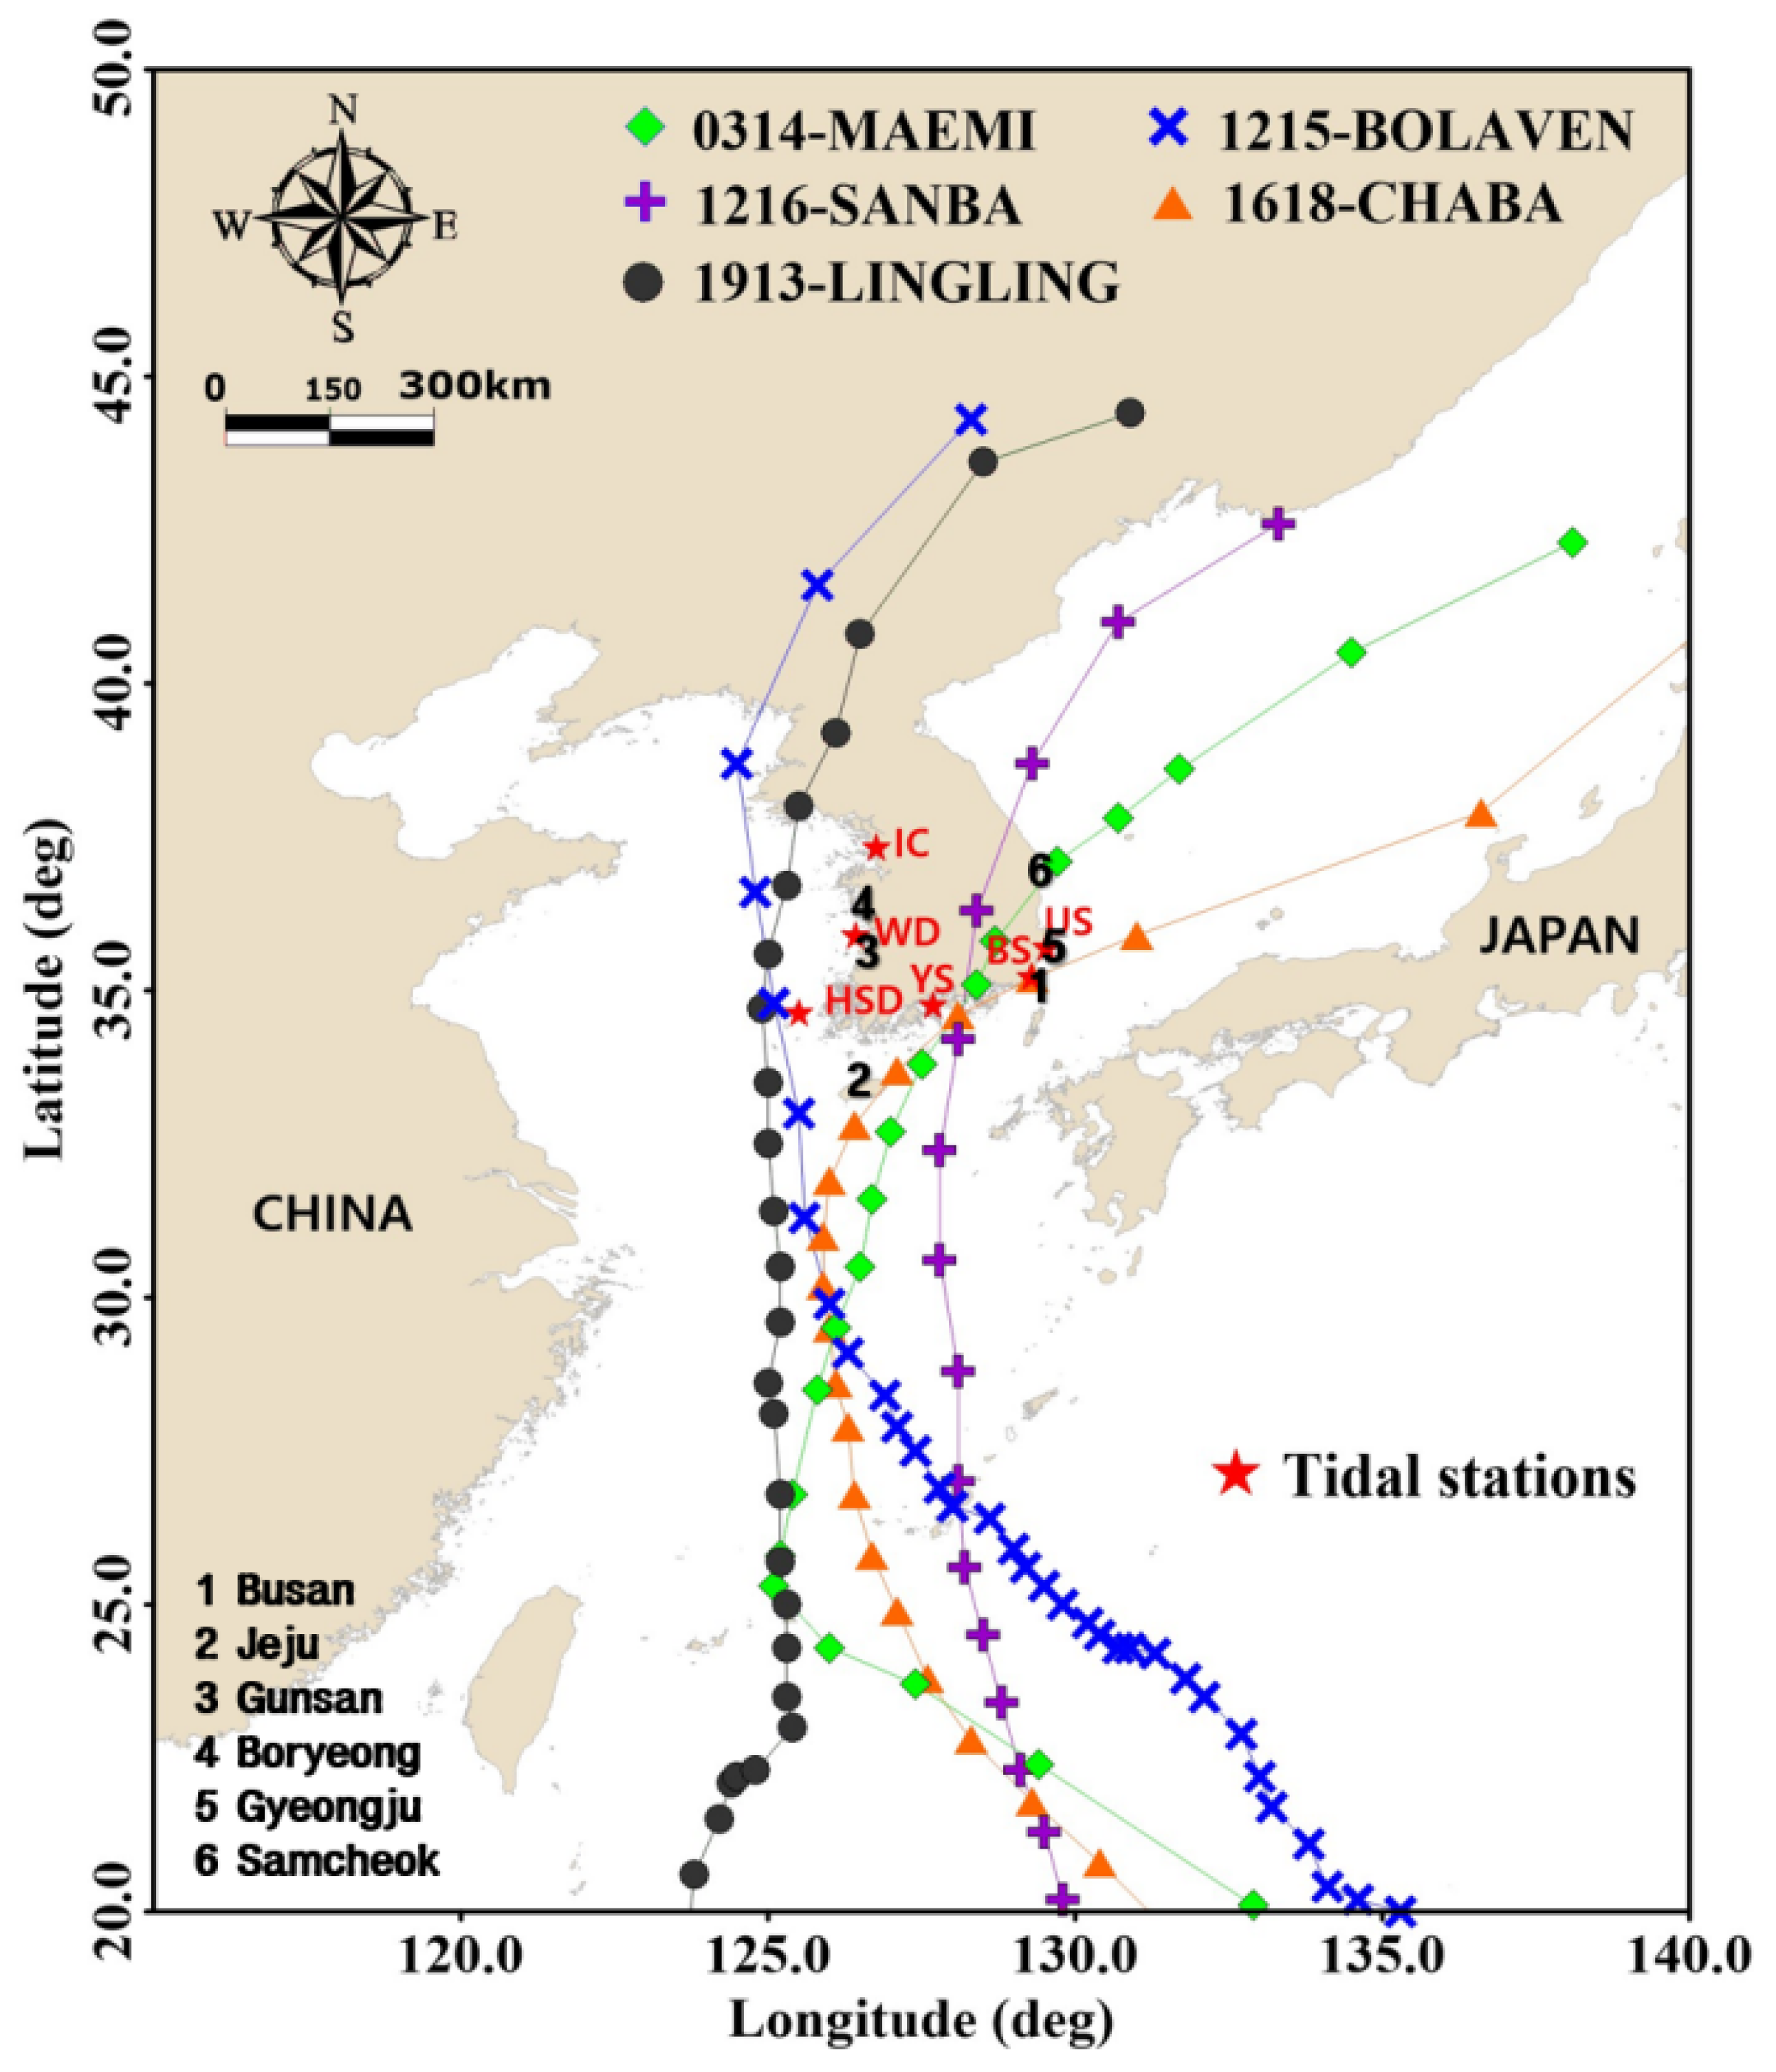
The constructed ADCSWAN model was validated by simulating five typhoons that had previously affected the Korean Peninsula and caused high storm surges (Figure 6). Figure 5 also shows the locations of the tide observation stations used for assessing the appropriateness of the analysis results.
The reproducibility of the storm surge analyzed by the model was evaluated using the Absolute Relative Error (ARE), as shown in Equation (1).
A R E   % = O i C i O i × 100 ,   E r r o r = C i O i
Here, O i represents the observed data from the tide observation stations and C i is the result calculated by ADCSWAN. The comparison of the maximum storm surge heights caused by each typhoon showed that ARE was below 8%, indicating that the storm surge model constructed in this study was deemed appropriate (Table 6).
Meanwhile, the validated storm surge model examined hypothetical typhoons that generate the 100-year return period storm surge heights for each sea area. Multiple hypothetical conditions produced each area’s 100-year return period storm surge heights. In this study, the most conservative scenario, with the highest significant wave height, was selected for use as input data in the FLOW-3D model to estimate wave overtopping and the tide level in coastal areas. Figure 7 and Table 7 show part of the analysis results for the typhoon scenarios in the Marine City area.

3.2. Calculation of the Wave Overtopping Rate and Tide Level

Considering the storm surge height, the wave overtopping rate and tide level were calculated using the FLOW-3D model for each target area. The wave and storm surge input data (boundary condition) for the FLOW-3D model were derived from the ADCSWAN model. Figure 8 shows the case of the FLOW-3D model configured for Marine City (Busan). The overtopping rate was calculated by implementing the 3D shape of the front of Marine City (Busan) and calculating the flow rate of fluid passing through this area as the overtopping rate. The overtopping calculation points in Marine City were 32, arranged at 30 m intervals along the breakwater.
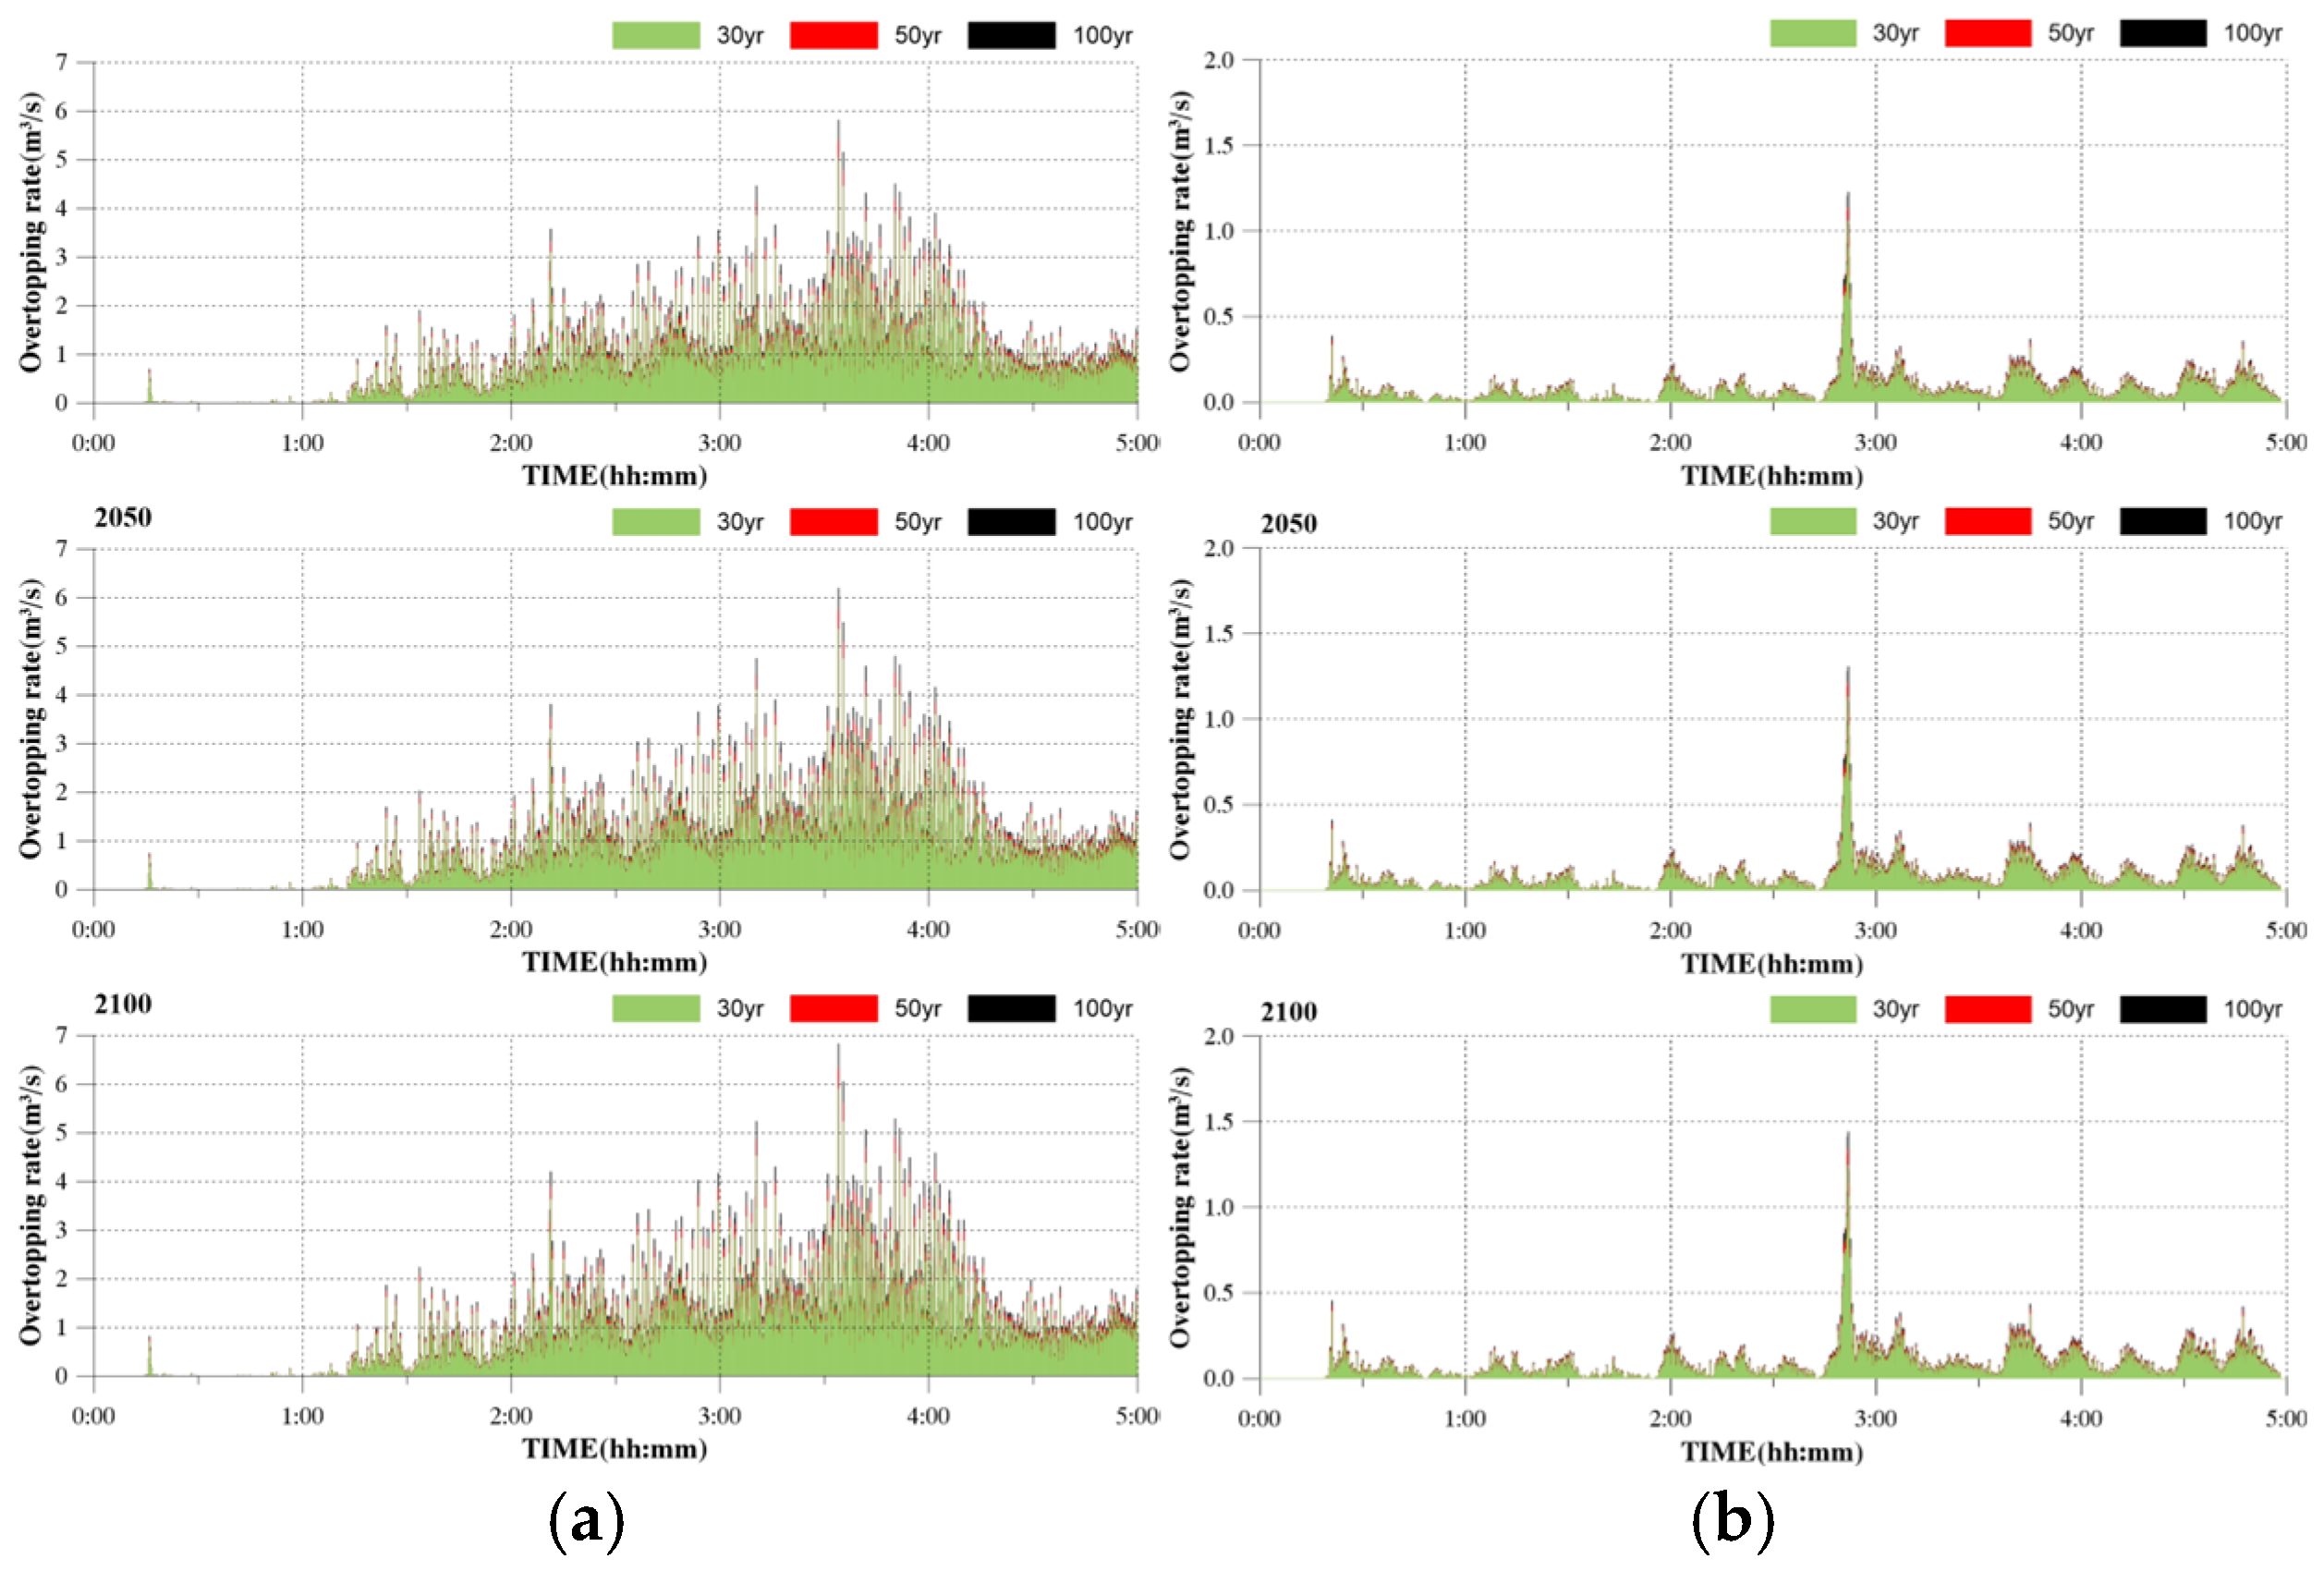
Figure 9 shows the results of calculating the overtopping rates corresponding to the 100-year frequency for the current year, 2050, and 2100 using FLOW-3D for Oedo-dong (Jeju), which has relatively high overtopping, and Ocheon Port (Boryeong), which has less overtopping.

3.3. Inundation Simulation

3.3.1. Rainfall–Runoff and the Inundation Simulation Model by XP-SWMM

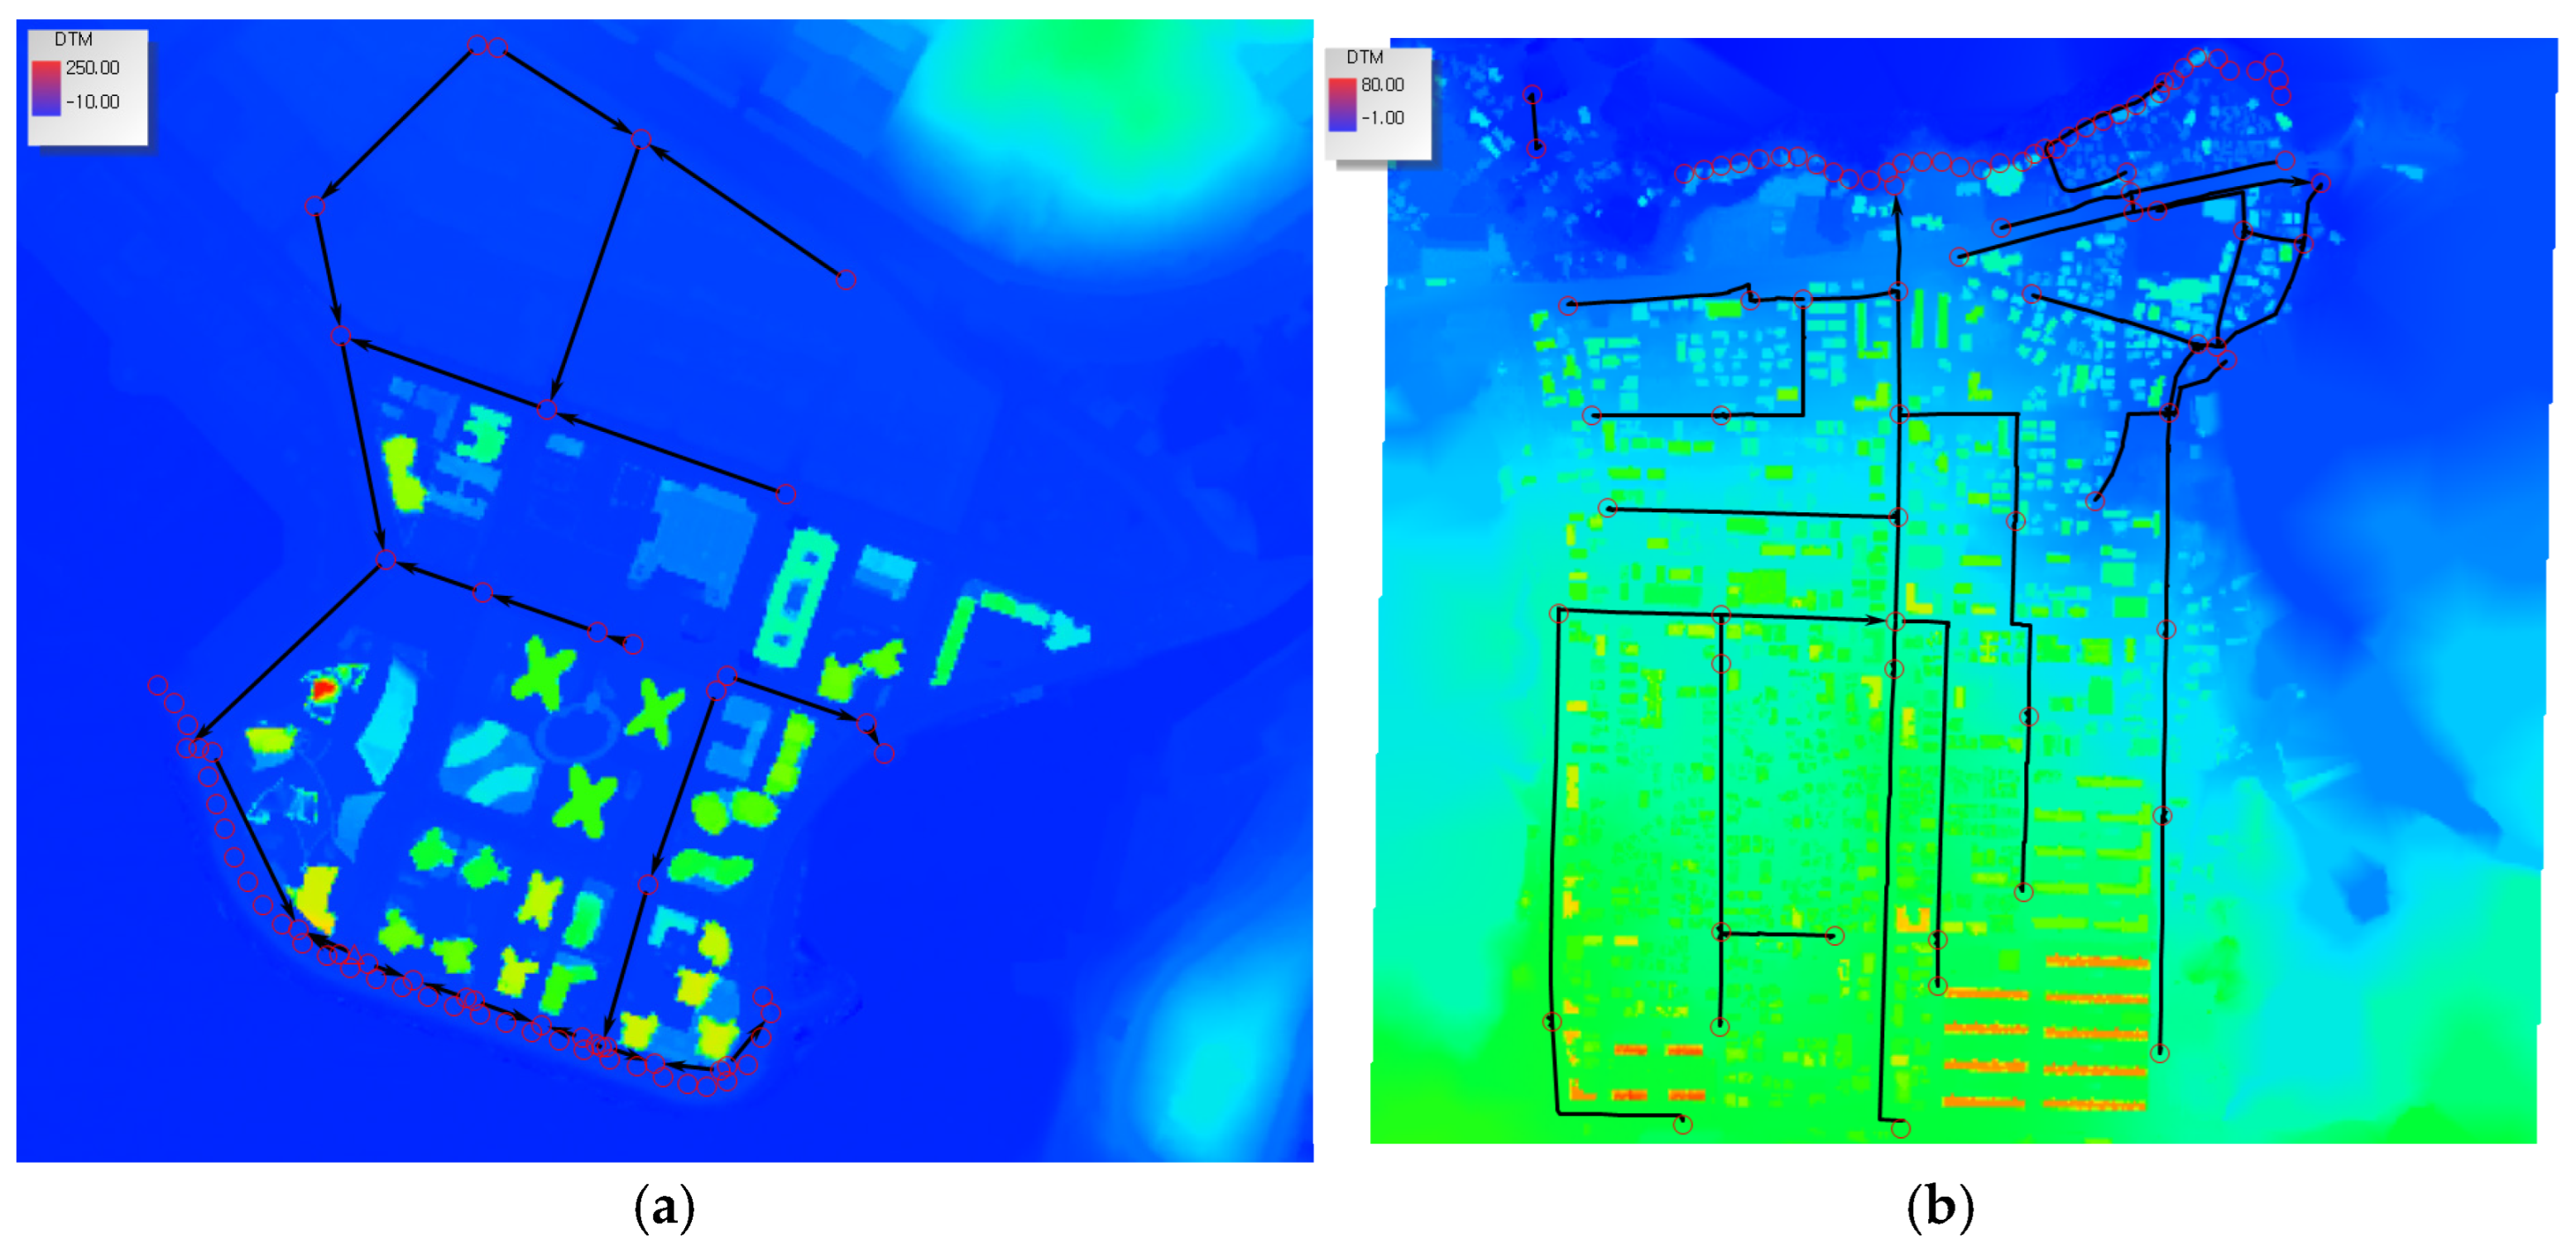
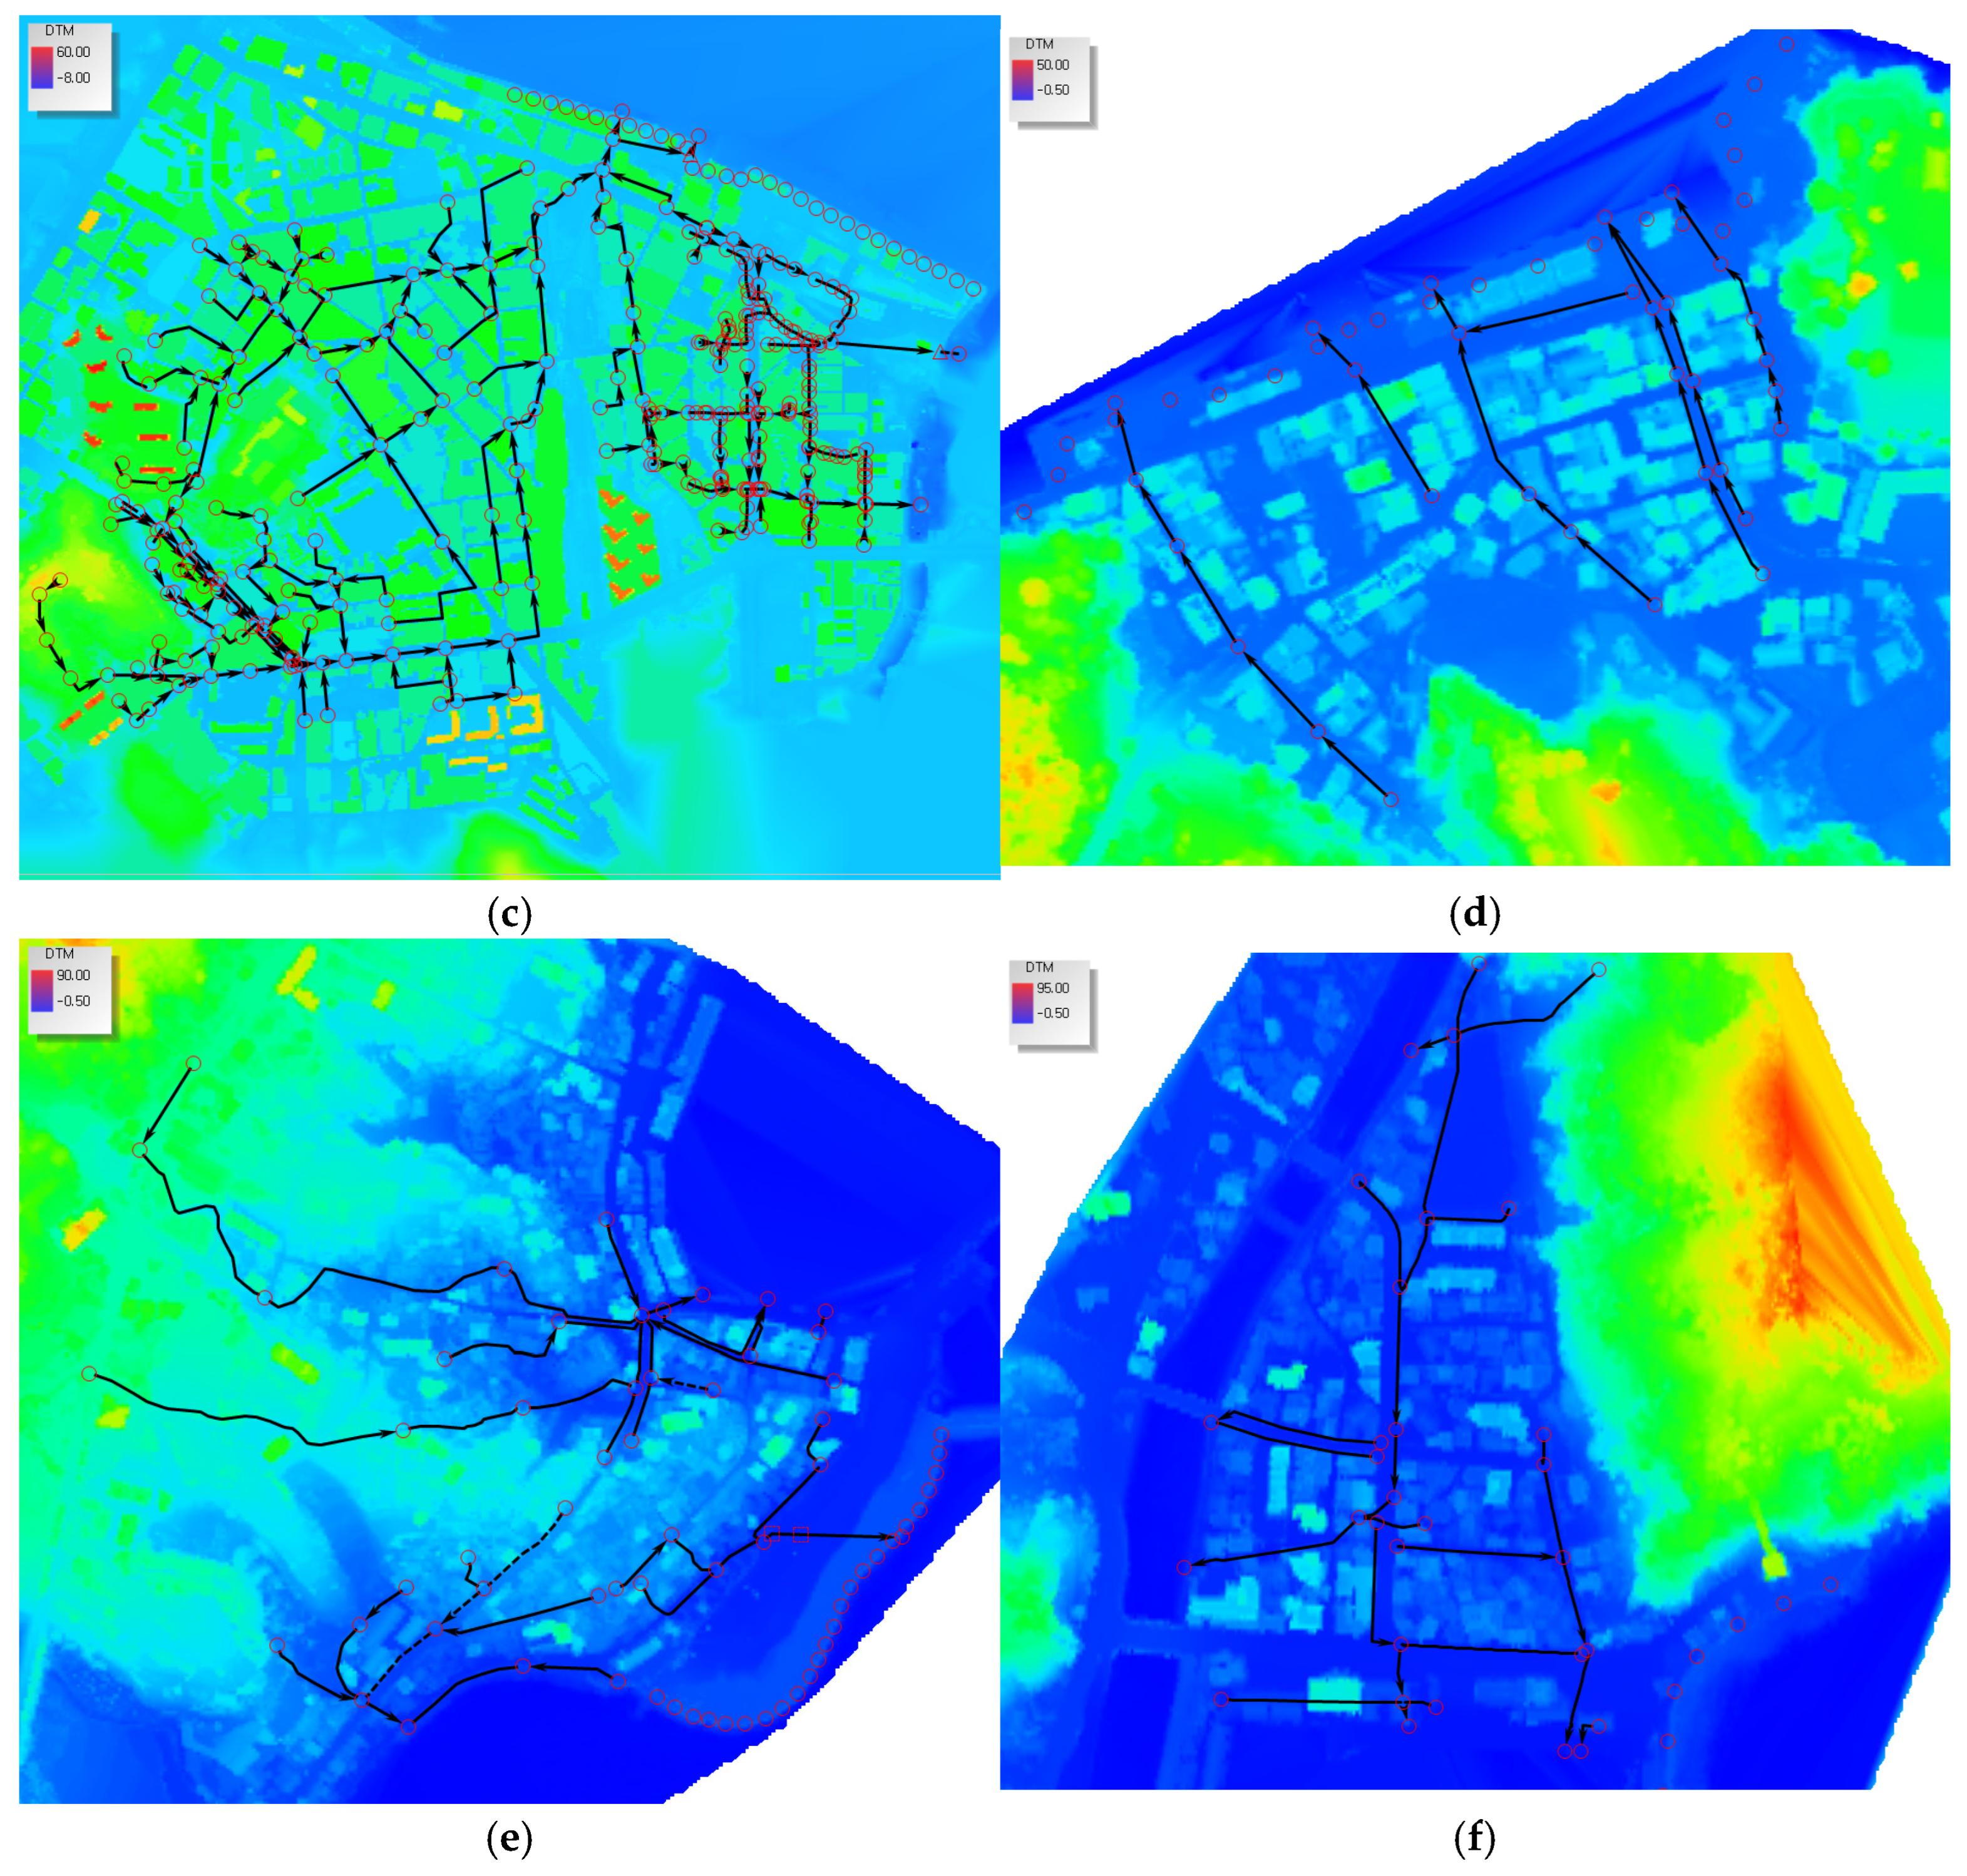
The inundation simulation models for the target areas were constructed using XP-SWMM, as shown in Figure 10. For appropriate flood analysis, the drainage system of the watershed was constituted using numerical data such as digital topographic maps, the urban information system (UIS), and sewage network maps, as well as through field surveys. A digital terrain model (DTM) was developed for two-dimensional flood analysis, and the simulation grids were created.
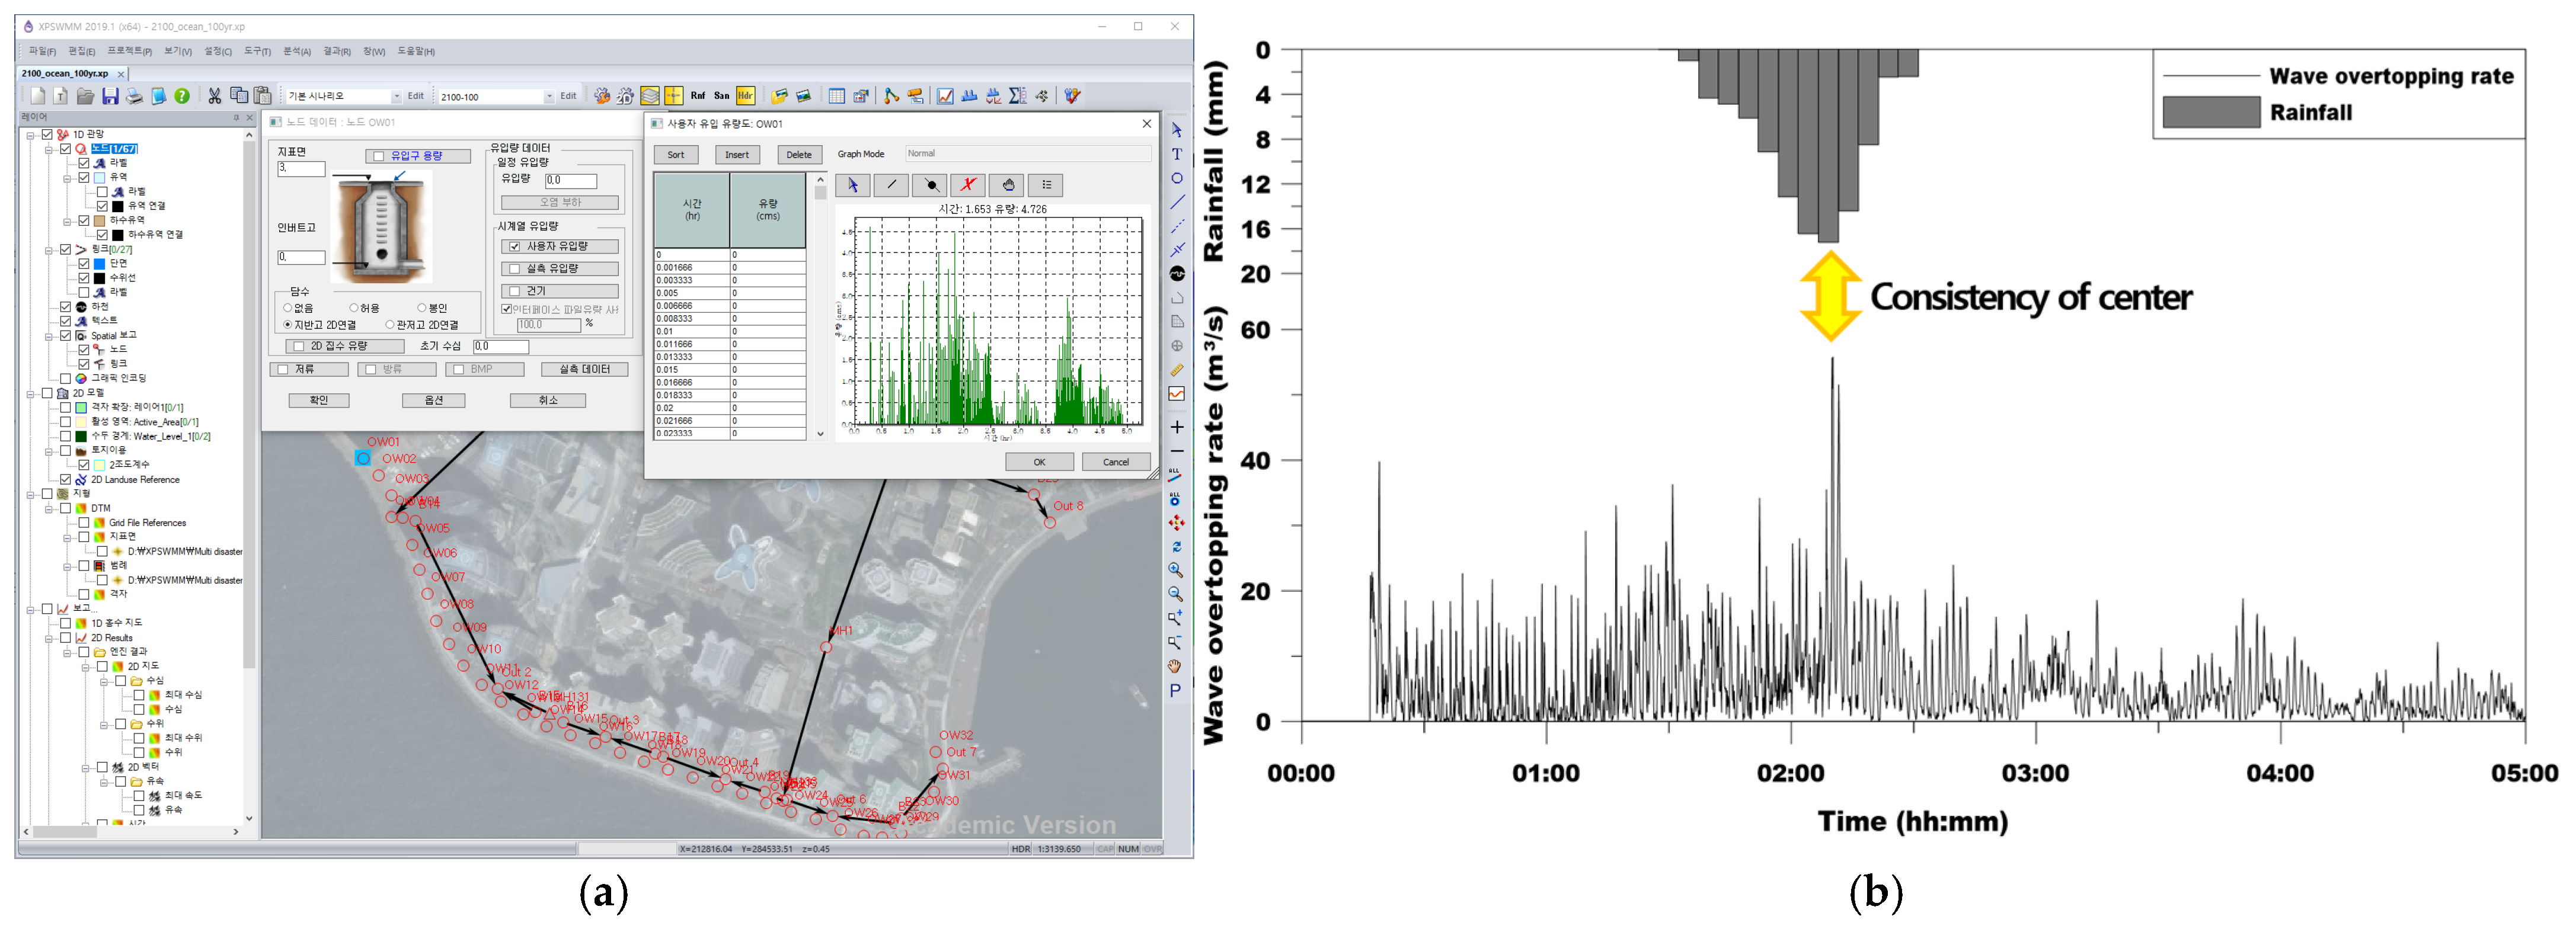
Meanwhile, nodes were established in coastal areas in XP-SWMM to input the wave overtopping rates calculated by the FLOW-3D model (Figure 11a). The locations of the nodes for inputting the overtopping rates in XP-SWMM are the central positions of the grids where the overtopping rates were calculated in the FLOW-3D model. Additionally, the tide series analyzed by the FLOW-3D model were set as boundary conditions at the outflow of XP-SWMM. The centers of the rainfall and the storm surge were set to coincide in time (Figure 11b).

3.3.2. Validation of the Inundation Simulation Model

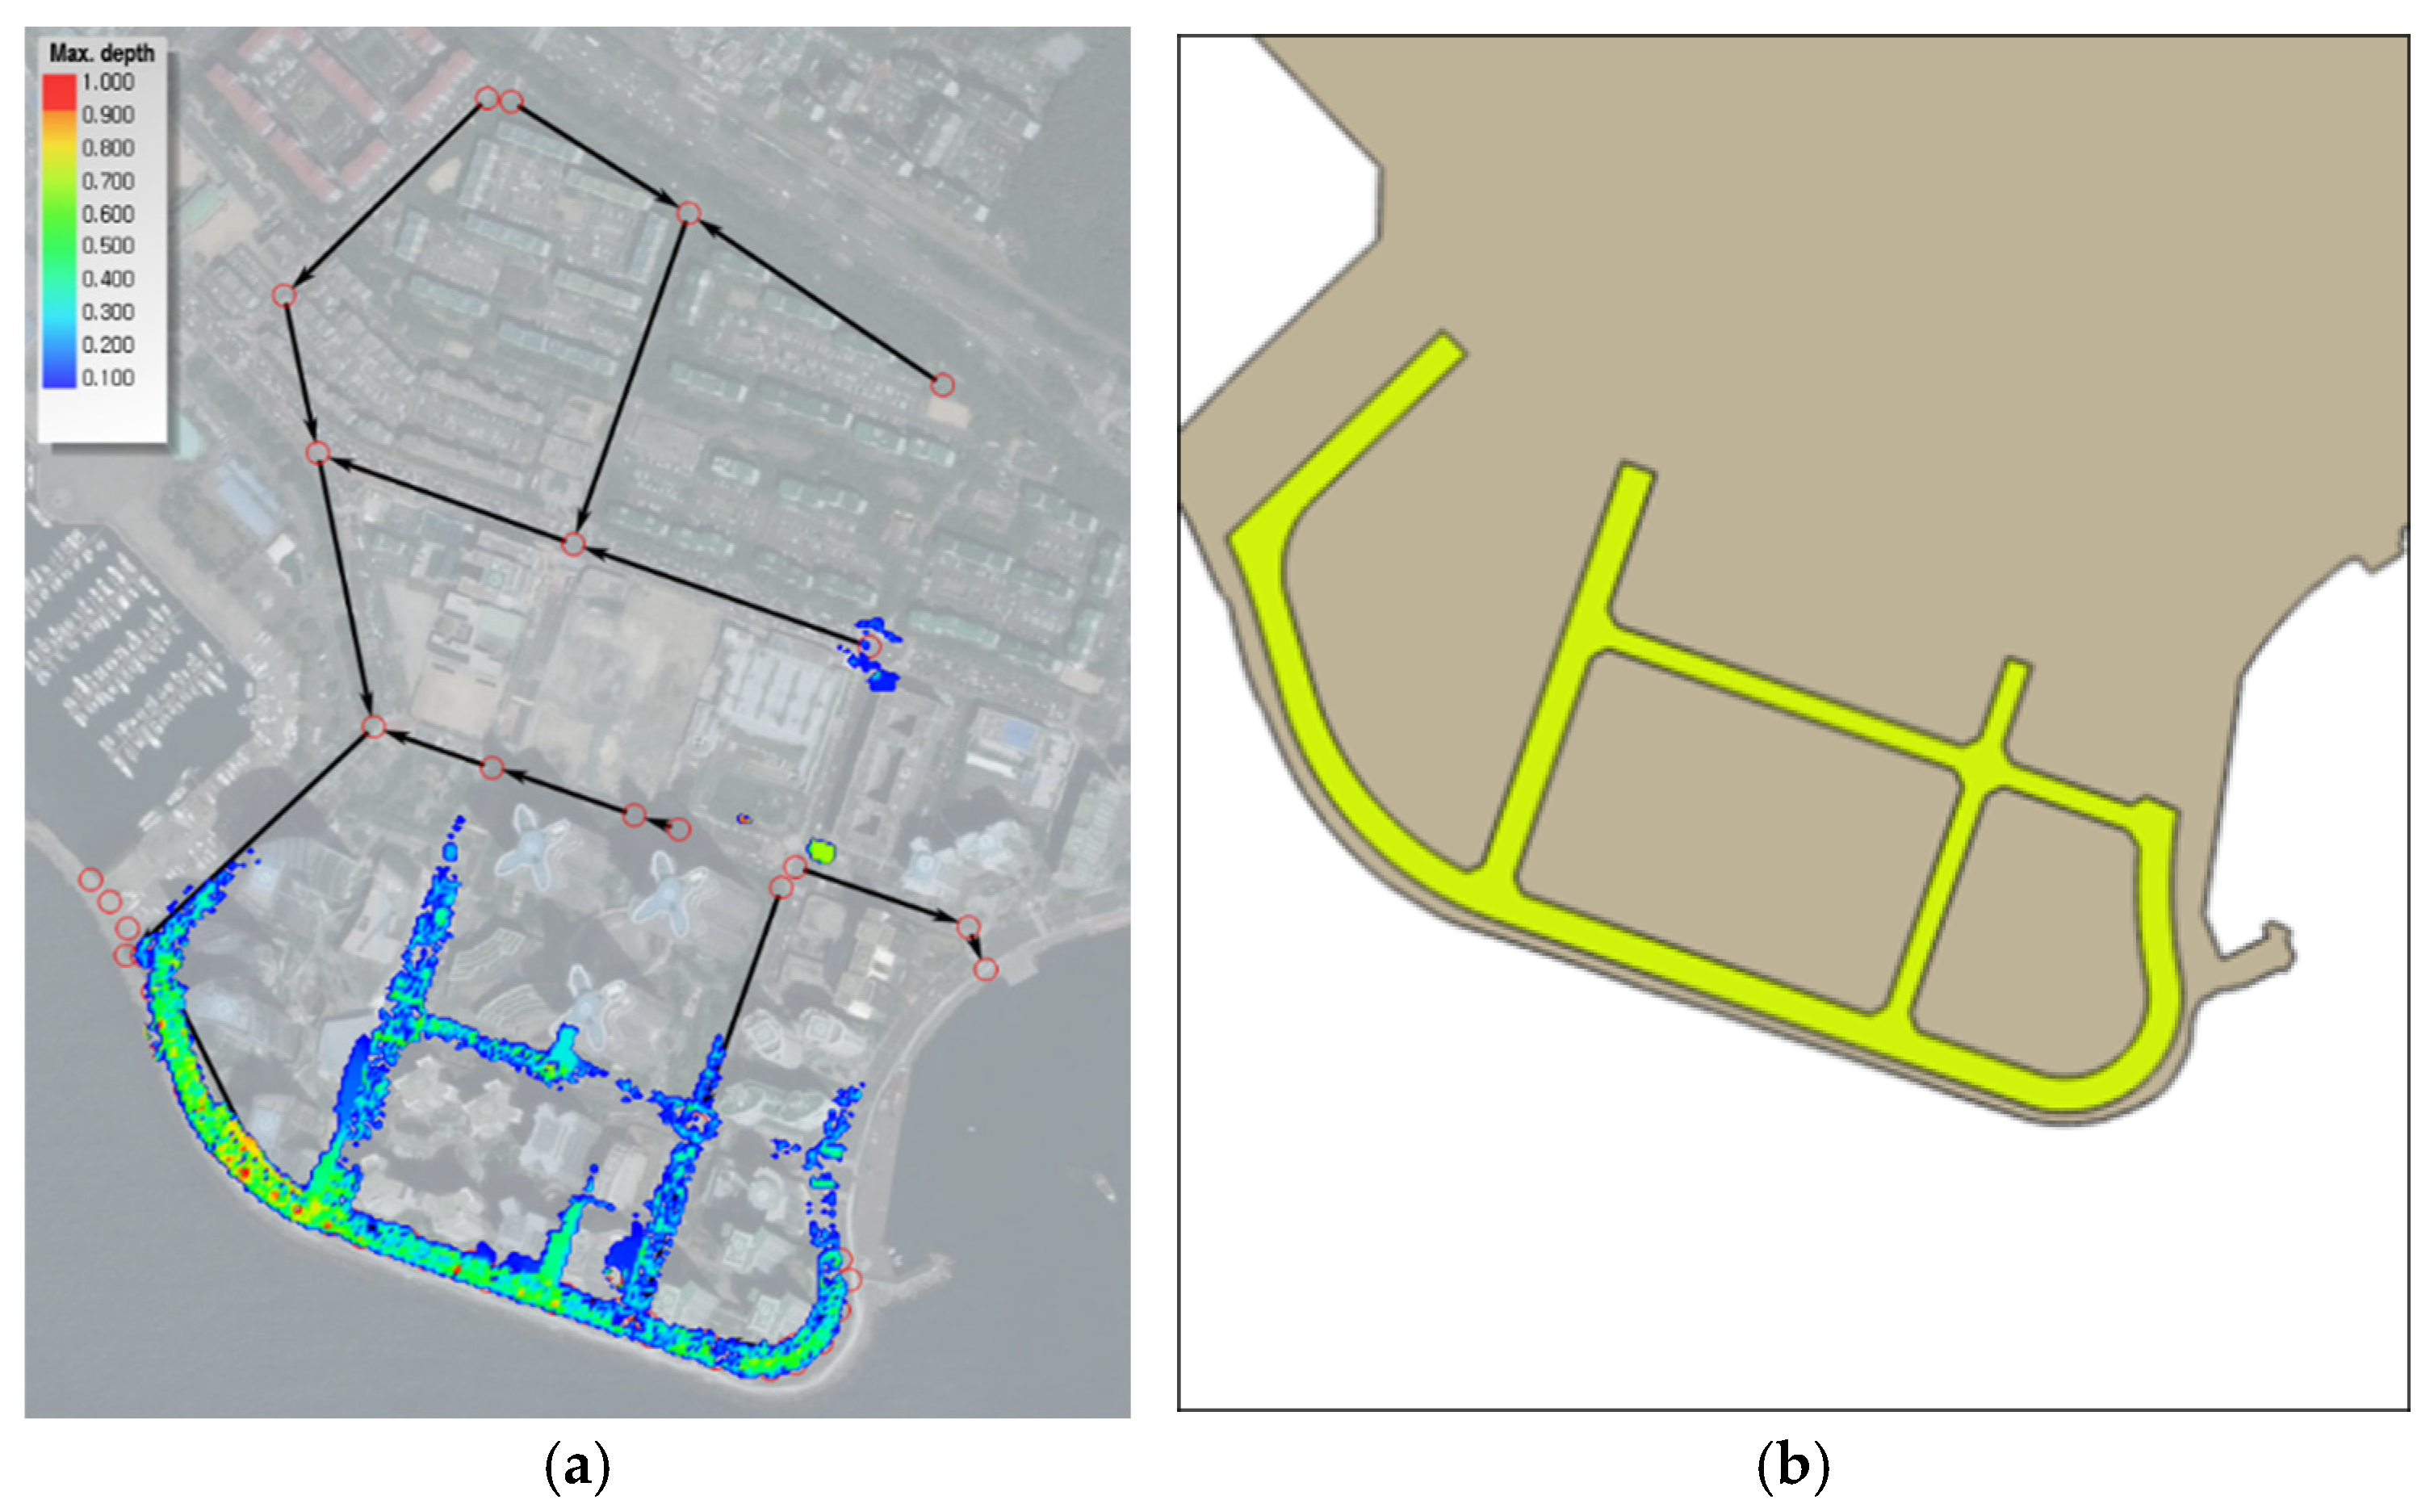
The appropriateness of the inundation simulation model was verified using Marine City (Busan) as the target, where flood traces from Typhoon CHABA (1618) were available. Figure 12a shows the maximum inundation simulated by considering the rainfall during Typhoon CHABA (1618) and the tide, storm surge height, and wave overtopping analyzed using the ADCSWAN and Flow-3D models. Figure 12b presents the official flood trace map provided by South Korea during Typhoon CHABA (1618). The flooding of Marine City (Busan) during Typhoon CHABA (1618), as analyzed by XP-SWMM, was found to replicate the phenomenon well.

3.3.3. Inundation Simulation Results

Figure 13 displays the inundation simulation results for the current year and the years 2050 and 2100 in the target areas, according to climate change. The external conditions used in the inundation simulations were the 100-year-frequency tide and wave overtopping due to storm surges and the 100-year-frequency probabilistic rainfall.
Table 8 shows that the impact of flooding due to climate change varies significantly by area. Notably, the effect of flooding differs even among regions on the same coast. Compared to the present, the inundation area is projected to increase by 2.5% to 45.7% by 2050 in various regions, and the volume of flooding is expected to grow by 5.1% to 89.3%. By 2100, while one area (Gampo Port (Gyeongju)) will see an inundation area increase of 12.2% compared to the present, two regions (Oedo-dong (Jeju), Imwon Port (Samcheok)) will exceed 100%. Moreover, the flooding volume in Jungang-dong (Gunsan) is projected to increase by 321.3% by 2100.
Meanwhile, some areas showed a rapidly increasing impact of climate change over time. In Imwon Port (Samcheok), the flooding volume is set to increase by only 6.8% by 2050 compared to the present, but by 2100, it is projected to grow by 163.9%. Oedodong (Jeju) and Jungang-dong (Gunsan) were also analyzed to experience the more severe impact of climate change by 2100 compared to other areas (Figure 14).

3.4. Discussion

This study analyzed the storm surge heights for six coastal areas using the ADCSWAN model. The reproducibility of the storm surge heights was evaluated using observed tidal data through the Absolute Relative Error (ARE). As a result, an error of less than 8% was obtained, indicating good agreement with actual phenomena. Additionally, the appropriateness of flood simulation due to actual rainfall, tidal levels, storm surge heights, and wave overtopping was validated for the Marine City area. The flood simulation results for Marine City were found to replicate the actual flooding situation closely. However, the absence of past flood investigation data made verification impossible for other coastal areas. Nevertheless, the application case in Marine City demonstrates the validity of the methodology used in this study.
Based on the validated model and methodology, the impact of climate change was examined for six coastal areas in the Republic of Korea. The influencing factors of climate change included increased rainfall, sea-level rise, and the rise in storm surge heights and wave overtopping due to stronger typhoons. As a result, the climate change factors influencing flooding varied by region.
Areas where coastal flooding intensified were mainly those significantly impacted by wave overtopping (regions located along the East and South Seas). Specifically, Oedo-dong (Jeju) and Imwon Port (Samcheok) were analyzed to be significantly affected by wave overtopping due to climate change. For Jungang-dong (Gunsan) and Ocheon Port (Boryeong), located along the West Sea where tides significantly impact, poor inland water disposal due to rising sea levels caused by climate change was found to influence flooding. These four areas were all assessed to have inadequate adaptability to climate change.
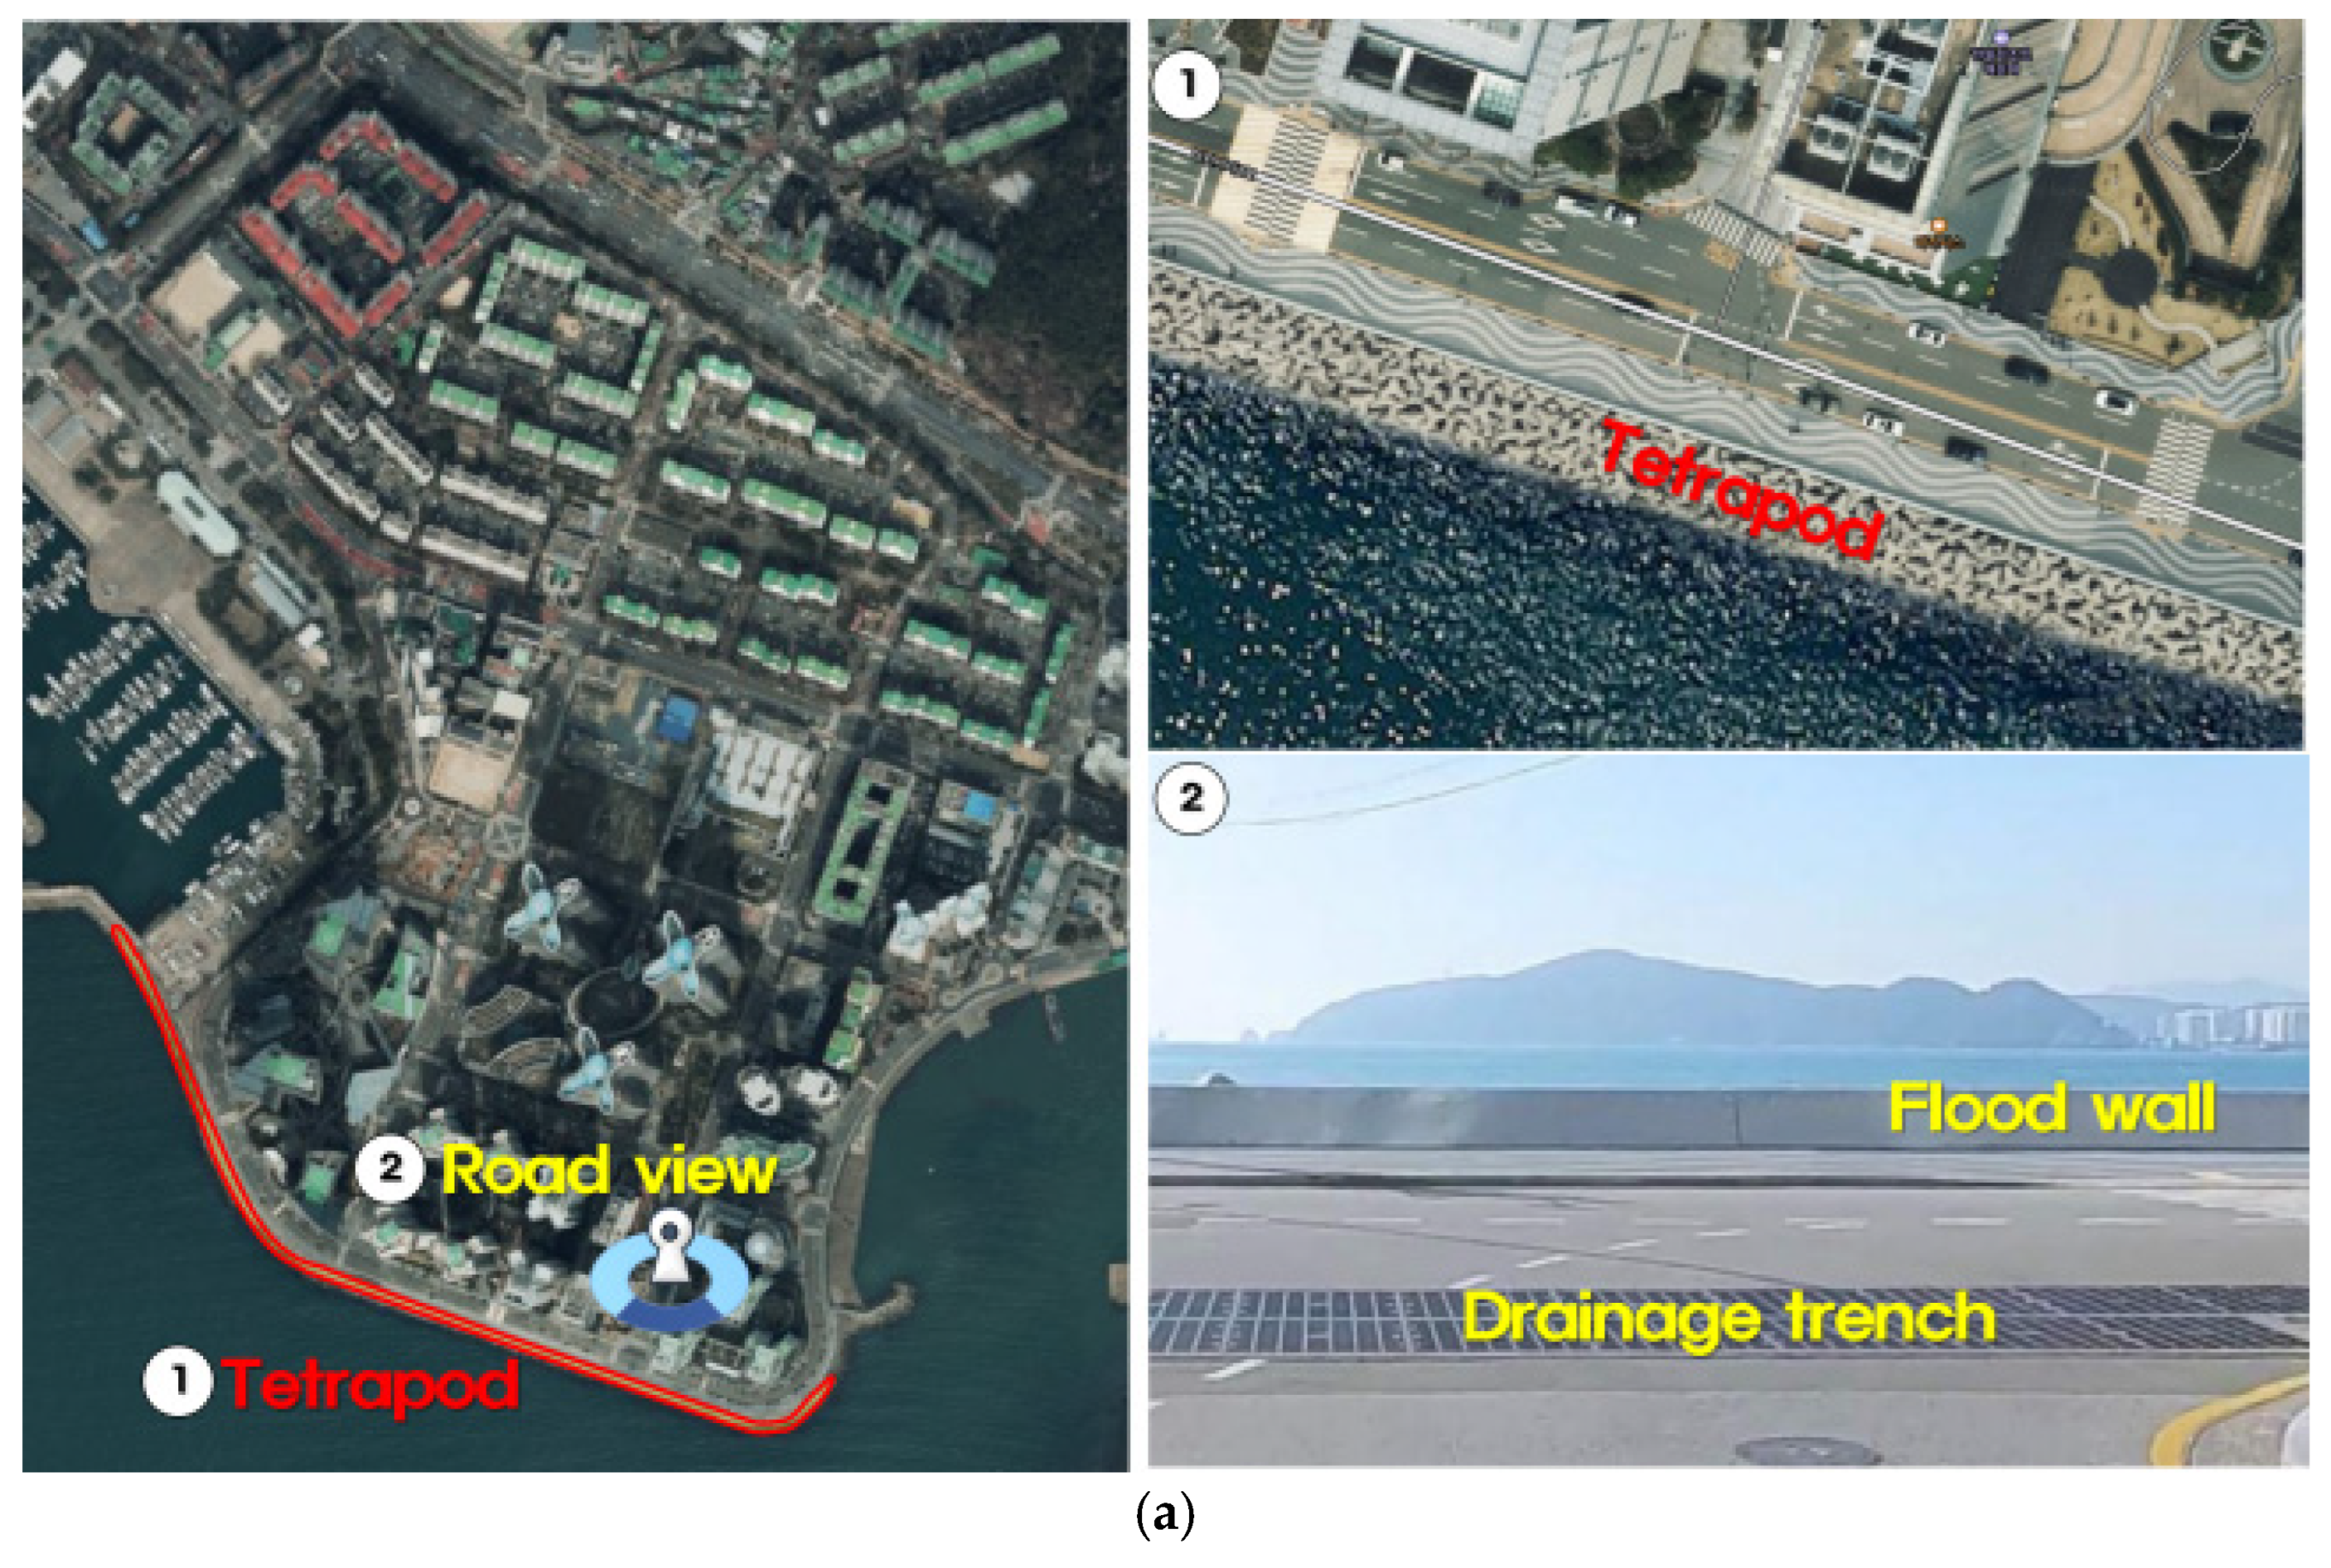
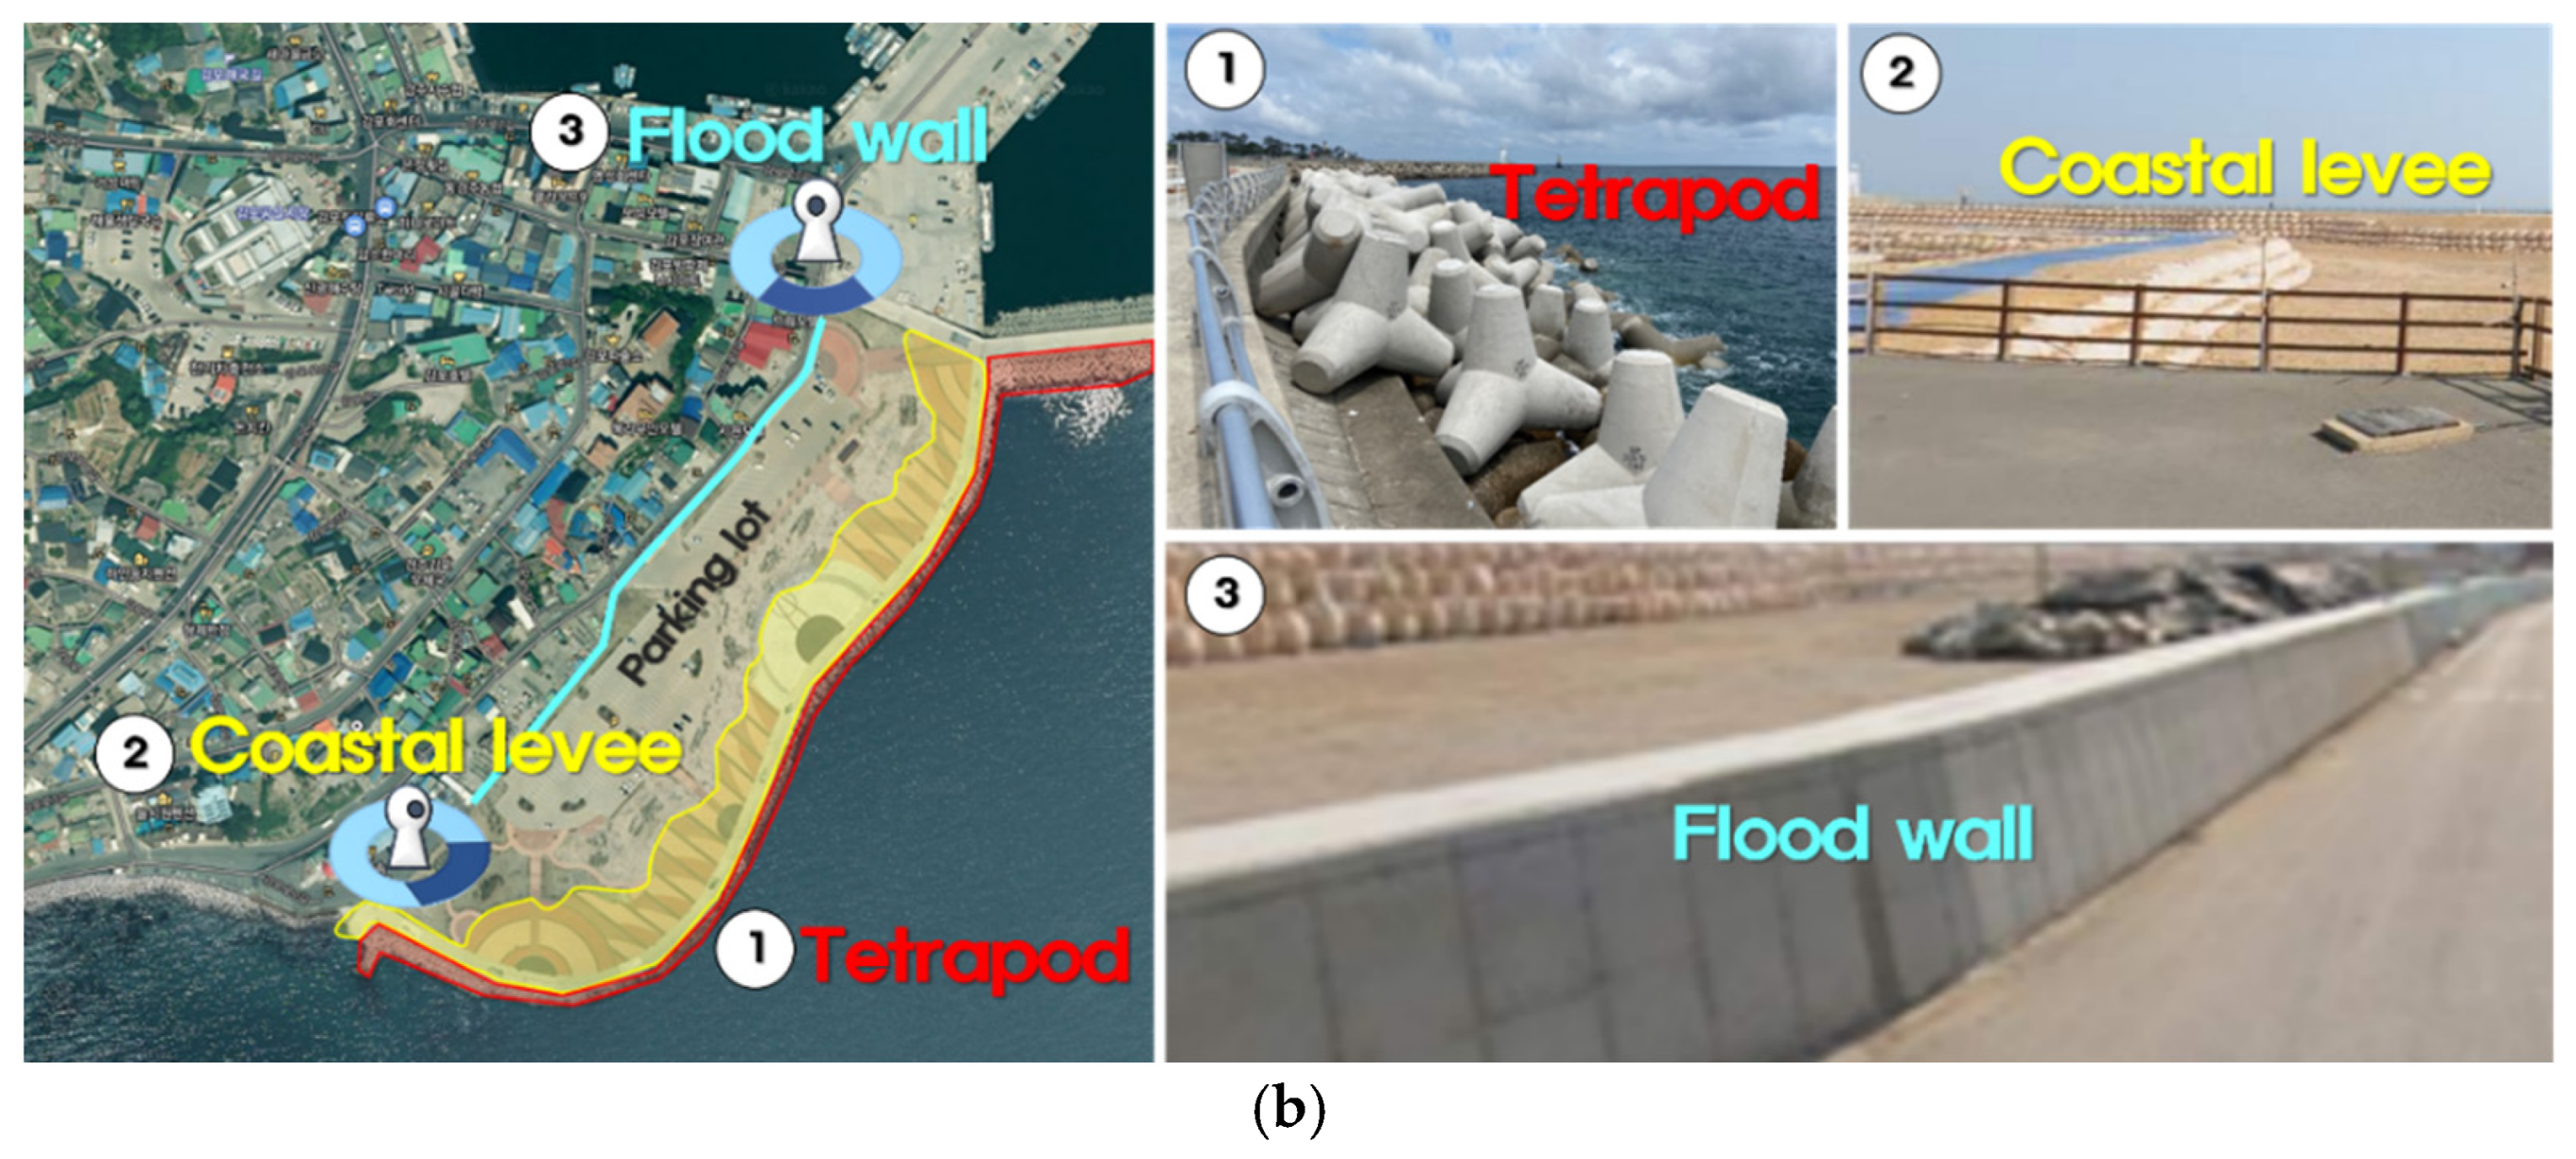
Marine City (Busan) and Gampo Port (Gyeongju), which mainly experience flooding due to wave overtopping, were analyzed to be relatively less affected by climate change. This is a result derived from the extent to which each region is currently prepared for disasters. As shown in Figure 15a, Marine City (Busan) has installed tetrapods along the coastal front to prevent wave overtopping and flood walls. Moreover, transverse drainage trenches were arranged along the roads to expel seawater back to the sea after overtopping. Thus, although the Marine City experiences flood damage due to wave overtopping, it is adaptable to future climate change. Similarly, Gampo Port (Gyeongju) has historically been an area with continual flooding damage due to wave overtopping. The local government has created a buffer zone through marine reclamation and installed tetrapods and coastal levees. Additionally, flood walls were constructed to prevent flooding in residential and commercial districts (Figure 15b). Ultimately, these current efforts contribute to increasing adaptability to future climate change.

4. Conclusions

With climate change, the average sea level is rising, and the intensity of typhoons and rainfall is increasing, raising concerns about flooding damage in coastal areas worldwide. Notably, South Korea, a peninsula surrounded by the sea on three sides, has many cities located in coastal areas, exposing numerous regions to damage due to climate change. This study examined the adaptability to flooding due to climate change in six coastal areas of South Korea and derived implications.
In this study, the inundation analysis due to combined external forces such as rainfall, tide, storm surge, and wave overtopping in the coastal area was conducted using the methodology suggested in the previous study [4]. The methodology is storm surge and wave simulation by ADCSWAN (coupled model of ADCIRC and UnSWAN), wave overtopping estimation by FLOW-3D, and comprehensive inundation analysis, including rainfall–runoff of the watershed by XP-SWMM. For reference, the study [4] showed the appropriateness of reproducing an actual flooding phenomenon in one coastal area. This study used the methodology to examine flooding characteristics due to future climate change for six coastal regions. The impacts of climate change are increased rainfall, sea level rise, and typhoon intensity targeting the years 2050 and 2100. The strengthening of the typhoon induces a high storm surge, which increases the overtopping phenomenon in coastal areas.
ADCSWAN, which analyzes storm surges in the open sea, was validated by simulating five historical typhoons. The inundation simulation model constituted by XP-SWMM, reflecting the tide (including storm surge height) and wave overtopping rates determined by FLOW-3D, was verified using Marine City (Busan) during Typhoon Chaba. The six coastal areas analyzed in this study showed significant variations in the impact of flooding due to climate change. Even areas located on the same coast did not exhibit the same characteristics. These results suggest that the current state of disaster preparedness varies by region. That is, areas that are currently prepared for disasters showed much higher adaptability to climate change compared to those that are not. Furthermore, there were areas where the impact of climate change increased dramatically over time. Such areas were judged to have very low adaptability to climate change.
This study is meaningful as a case study that physically and scientifically examines the adaptability of coastal communities to flooding due to climate change. Climate change is ongoing and foretells the future. This study’s results suggest that future communities’ safety will be determined by how well they prepare for climate change.

Author Contributions

Conceptualization: J.L. and T.K.; Methodology: J.L. and T.K.; Software: T.K.; Validation: J.L.; Formal analysis and Visualization: T.K.; Data curation: T.K.; Writing—original draft preparation: T.K.; Writing—review and editing: J.L.; Project administration: J.L.; Funding acquisition: J.L. All authors have read and agreed to the published version of the manuscript.

Funding

This work was supported by the National Research Foundation of Korea (NRF) grant funded by the Korean government (MSIT) (No. NRF-RS-2023-00259995).

Data Availability Statement

The data used to support the findings of this study are available from the corresponding author upon request.

Conflicts of Interest

The authors declare no conflicts of interest.

References

  1. Bevacqua, E.; Vousdoukas, M.I.; Zappa, G.; Hodges, K.; Shepherd, T.G.; Maraun, D.; Mentaschi, L.; Feyen, L. More meteorological events that drive compound coastal flooding are projected under climate change. Commun. Earth Environ. 2020, 1, 47. [Google Scholar] [CrossRef] [PubMed]
  2. Park, S.J.; Lee, D.K. Prediction of coastal flooding risk under climate change impacts in South Korea using machine learning algorithms. Environ. Res. Lett. 2020, 15, 094052. [Google Scholar] [CrossRef]
  3. Ghanbari, M.; Arabi, M.; Kao, S.C.; Obeysehrea, J.; Sweet, W. Climate change and changes in compound coastal-riverine flooding hazard along the U.S. coasts. Earth’s Future 2021, 9, EF002055. [Google Scholar] [CrossRef]
  4. Lee, S.; Kang, T.; Sun, D.; Park, J.J. Enhancing an analysis method of compound flooding in coastal areas by linking flow simulation models of coasts and watershed. Sustainability 2020, 12, 6572. [Google Scholar] [CrossRef]
  5. Wang, S.; Najafi, M.R.; Cannon, A.J.; Khan, A.A. Uncertaionties in riverine and coastal flood lmpacts under climate change. Water 2021, 13, 1774. [Google Scholar] [CrossRef]
  6. Karim, M.F.; Mimura, N. Impacts of climate change and sea-level rise on cyclonic storm surge floods in Bangladesh. Glob. Environ. Chang. 2008, 18, 490–500. [Google Scholar] [CrossRef]
  7. Hemer, M.A.; Fan, Y.; Mori, N.; Semedo, A.; Wang, X.L. Projected changes in wave climate from a multi-model ensemble. Nat. Clim. Chang. 2013, 3, 471–476. [Google Scholar] [CrossRef]
  8. Kopp, R.E.; Horton, R.M.; Little, C.M.; Mitrovica, J.X.; Oppenheimer, M.; Rasmussen, D.J.; Strauss, B.H.; Tebaldi, C. Probabilistic 21st and 22nd-century sea-level projections at a global network of tide-gauge sites. Earths Future 2014, 2, 383–406. [Google Scholar] [CrossRef]
  9. Walsh, K.J.; McBride, J.L.; Klotzbach, P.J.; Balachandran, S.; Camargo, S.J.; Holland, G.; Knutson, T.R.; Kossin, J.P.; Lee, T.C.; Sobel, A.; et al. Tropical cyclones and climate change. Wiley Interdiscip. Rev. Clim. Chang. 2016, 7, 65–89. [Google Scholar] [CrossRef]
  10. Dinan, T. Projected increases in hurricane damage in the United States: The role of climate change and coastal development. Ecol. Econ. 2017, 138, 186–198. [Google Scholar] [CrossRef]
  11. Marsooli, R.; Lin, N.; Emanuel, K.; Feng, K. Climate change exacerbates hurricane floodhazards along US Atlantic and Gulf Coasts in spatially varying patterns. Nat. Commun. 2019, 10, 3785. [Google Scholar] [CrossRef] [PubMed]
  12. Camelo, J.; Mayo, T.L.; Gutmann, E.D. Projected climate change impacts on hurricane storm surge inundation in the coastal Unites States. Front. Built Environ. 2020, 207, 588049. [Google Scholar]
  13. Ho, M.; Wasko, C.; O’Shea, D.; Nathan, R.; Vogel, E.; Sharma, A. Changes in flood-associated rainfall losses under climate change. J. Hydrol. 2023, 625, 129950. [Google Scholar] [CrossRef]
  14. Guhathakurta, P.; Sreejith, O.P.; Menon, P.A. Impact of climate change on extreme rainfall events and flood risk in India. J. Earth Syst. Sci. 2011, 120, 359–373. [Google Scholar] [CrossRef]
  15. Kapersen, P.S.; Halsnaes, K. Integrated climate change risk assessment: A practical application for urban flooding during extreme precipitation. Clim. Serv. 2017, 6, 55–64. [Google Scholar] [CrossRef]
  16. Nile, B.K.; Hassna, W.H.; Alshama, G.A. Analysis of the effect of climate change on rainfall intensity and expected flooding by using ANN and SWMM programs. ARPN J. Eng. Appl. Sci. 2019, 14, 974–984. Available online: https://www.researchgate.net/publication/332060463_Analysis_of_the_effect_of_climate_change_on_rainfall_intensity_and_expected_flooding_by_using_ANN_and_SWMM_programs (accessed on 12 December 2023).
  17. Agarwal, S.; Kumar, S. Urban flood modeling using SWMM for historical and future extreme rainfall events under climate change scenario. Indian J. Ecol. 2020, 47, 48–53. Available online: https://www.researchgate.net/publication/343905044_Urban_Flood_Modeling_using_SWMM_for_Historical_and_Future_Extreme_Rainfall_Events_under_Climate_Change_Scenario (accessed on 12 December 2023).
  18. Bilskie, M.V.; Hagen, S.C.; Medeiros, S.C.; Passeri, D.L. Dynamics of sea level rise and coastal flooding on a changing landscape. Geophys. Res. Lett. 2014, 41, 927–934. [Google Scholar] [CrossRef]
  19. Vitousek, S.; Barnard, P.L.; Fletcher, C.H.; Frazer, N.; Erikson, L.; Storlazzi, C.D. Doubling of coastal flooding frequency within decades due to sea-level rise. Sci. Rep. 2017, 7, 1399. [Google Scholar] [CrossRef]
  20. Li, X.; Fu, D.; Gammon, J.N.; Gangrade, S.; Kao, S.C.; Chang, P.; Hernandez, M.M.; Voisin, N.; Zhang, Z.; Gao, H. Impacts of climate change on future hurricane-induced rainfall and flooding in a coastal watershed: A case study on Hurricane Harvey. J. Hydrol. 2023, 616, 128774. [Google Scholar] [CrossRef]
  21. Benavente, J.; Del Río, L.; Gracia, F.J.; Martínez-del-Pozo, J.A. Coastal flooding hazard related to storms and coastal evolution in Valdelagrana spit (Cadiz Bay Natural Park, SW Spain). Cont. Shelf Res. 2006, 26, 1061–1076. [Google Scholar] [CrossRef]
  22. Muis, S.; Verlaan, M.; Winsemius, H.C.; Aerts, J.C.; Ward, P.J. A global reanalysis of storm surges and extreme sea levels. Nat. Commun. 2016, 7, 11969. [Google Scholar] [CrossRef] [PubMed]
  23. Lin, N.; Shullman, E. Dealing with hurricane surge flooding in a changing environment: Part I. Risk assessment considering storm climatology change, sea level rise, and coastal development. Stoch. Environ. Res. Risk Assess. 2017, 31, 2379–2400. [Google Scholar] [CrossRef]
  24. Bevacqua, E.; Maraun, D.; Vousdoukas, M.I.; Voukouvalas, E.; Vrac, M.; Mentaschi LWidmann, M. Higher probability of compound flooding from precipitation and storm surge in Europe under anthropogenic climate change. Sci. Adv. 2019, 5, eaaw5531. [Google Scholar] [CrossRef]
  25. Fowler, H.J.; Lenderink, G.; Prein, A.F.; Westra, S.; Allan, R.P.; Ban, N.; Barbero, R.; Berg, P.; Blenkinsop, S.; Do, H.X.; et al. Anthropogenic intensification of short-duration rainfall extremes. Nat. Rev. Earth Environ. 2021, 2, 107–122. [Google Scholar] [CrossRef]
  26. Ministry of the Interior and Safety (MOIS). Criteria for Establishment and Operation of Disaster Prevention Performance Target by Region: Considering Future Climate Change Impacts; Ministry of the Interior and Safety (MOIS): Sejong City, Republic of Korea, 2017. (In Korean)
  27. Ministry of Environment (ME). Standard Guidelines for Flood Volume Estimation; Ministry of Environment (ME): Sejong City, Republic of Korea, 2019. (In Korean)
  28. Ministry of the Interior and Safety (MOIS). Development of the Evaluation Technology for Complex Causes of Inundation Vulnerability and the Response Plans in Coastal Urban Areas for Adaptation to Climate Change; Ministry of the Interior and Safety (MOIS): Sejong City, Republic of Korea, 2018. (In Korean)
  29. IPCC. Climate Change 2013: The Physical Science Basis. Contribution of Working Group I to the Fifth Assessment Report of the Intergovernmental Panel on Climate Change; Stocker, T.F., Qin, D., Plattner, G.K., Tignor, M.M.B., Allen, S.K., Boschung, J., Nauels, A., Xia, Y., Bex, V., Midgley, P.M., et al., Eds.; Cambridge University Press: Cambridge, UK; New York, NY, USA, 2013; 1535p, Available online: https://www.ipcc.ch/report/ar5/wg1/ (accessed on 30 January 2024).
  30. Emanuel, K.A. Downscaling CMIP5 climate models shows increased tropical cyclone activity over the 21st century. Proc. Natl. Acad. Sci. USA 2013, 110, 12219–12224. [Google Scholar] [CrossRef]
  31. Kim, S.; Oh, J.; Suh, K.D.; Mase, H. Estimation of climate change impact on storm surges: Application to Korean Peninsula. Coast. Eng. J. 2017, 59, 1740004-1–1740004-32. [Google Scholar] [CrossRef]
  32. Yang, J.A.; Kim, S.; Mori, N.; Mase, H. Assessment of long-term impact of storm surges around the Korean Peninsula based on a large ensemble of climate projections. Coast. Eng. 2018, 142, 1–8. [Google Scholar] [CrossRef]
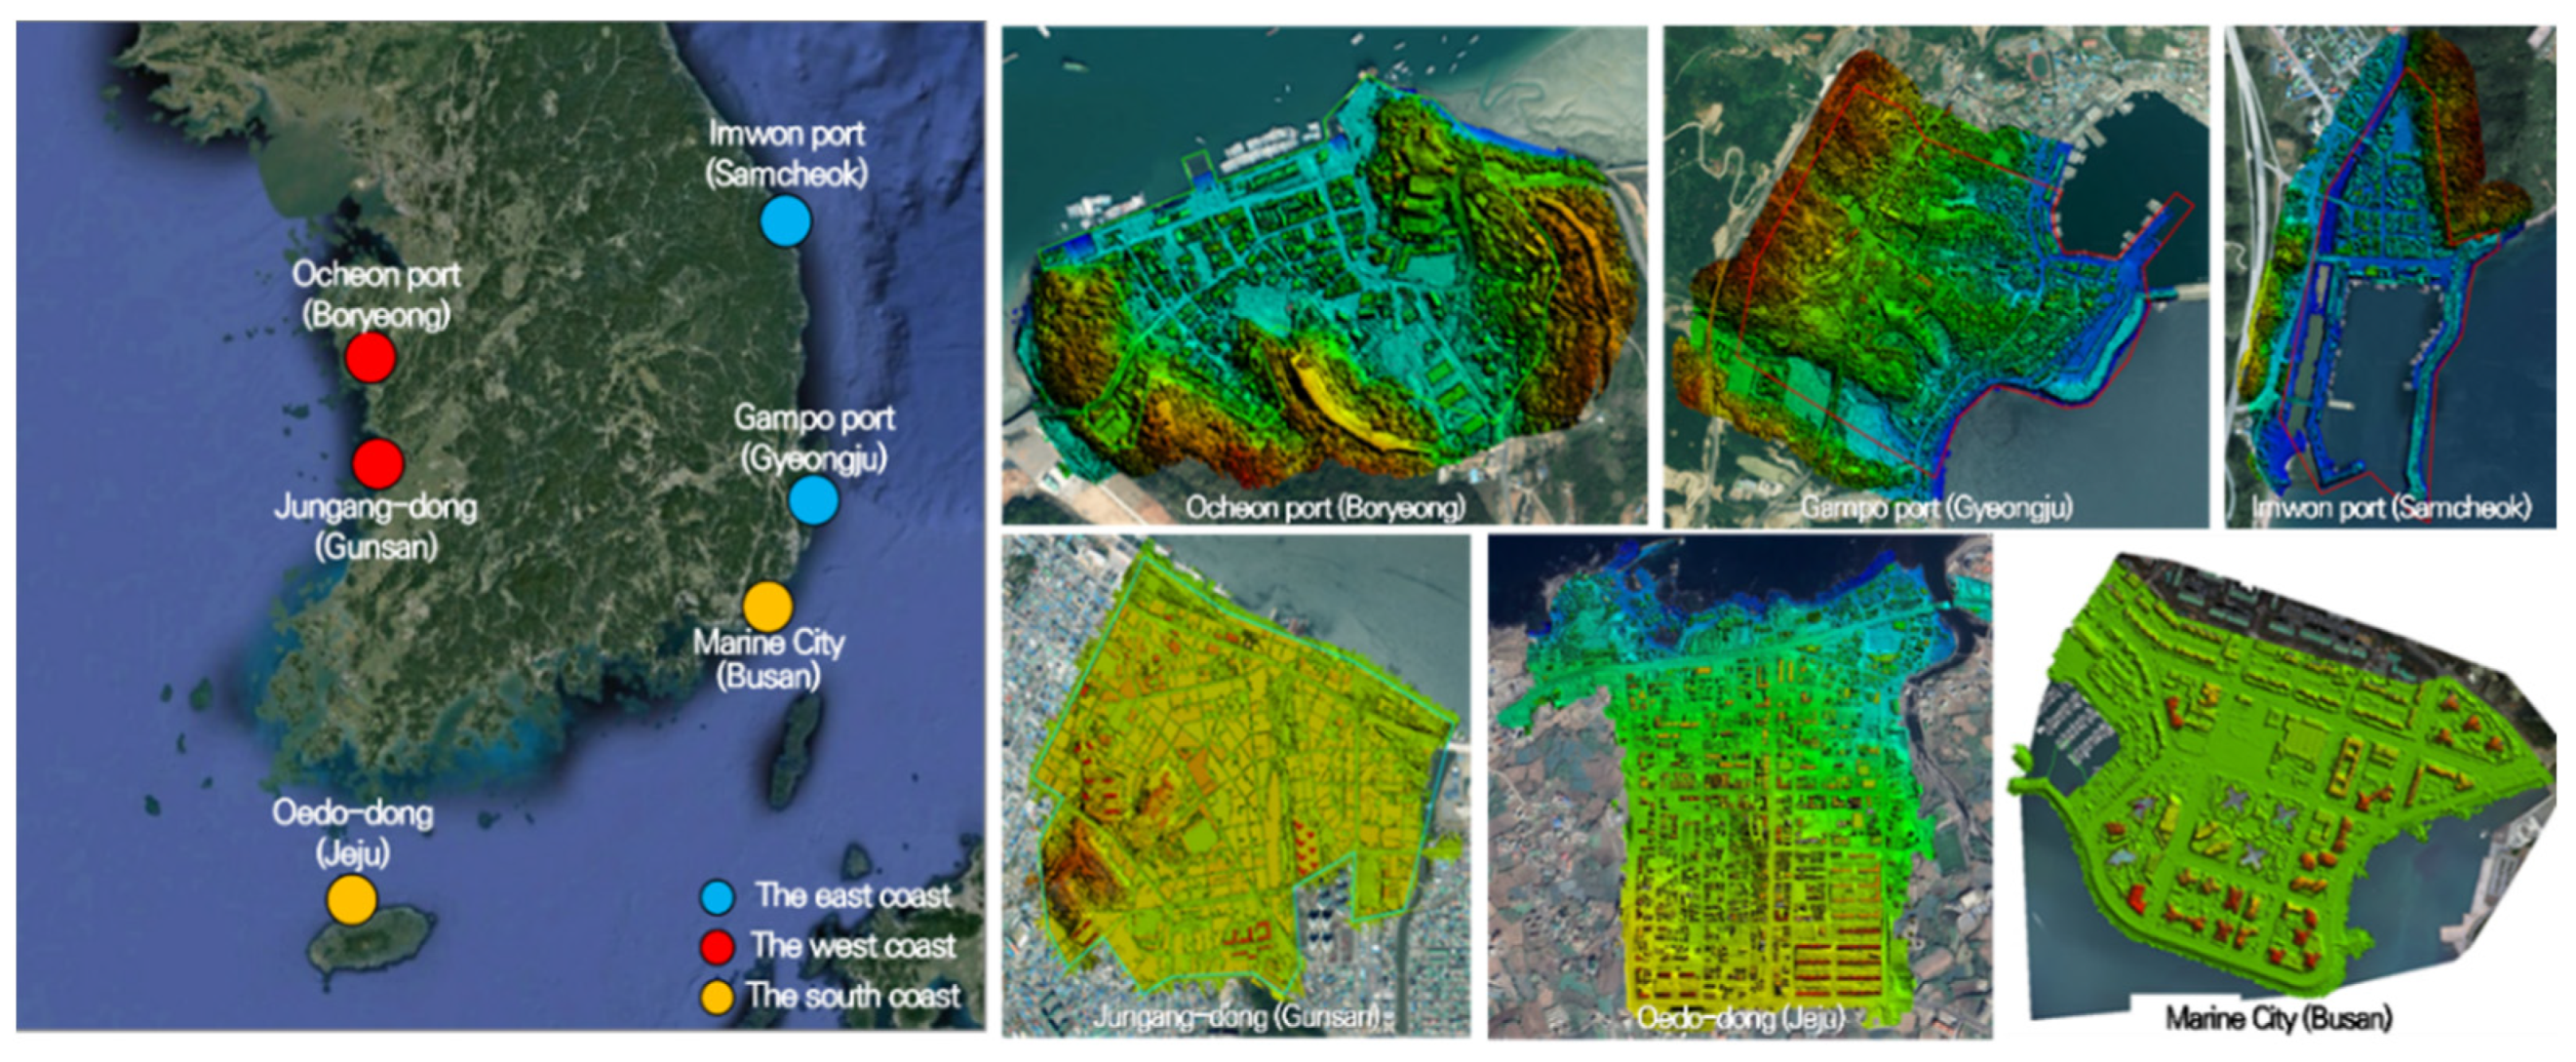
Figure 1. Location of study areas (left) and DSM model (right).
Water 16 02987 g001
Figure 2. Hypothetical typhoon scenarios in the East Coast areas. (a) Gampo Port (Gyeongju); (b) Gampo Port (Gyeongju).
Water 16 02987 g002
Figure 3. Averaged positions and intensities of Korean Peninsula–Approach Typhoons in the present and future climates [31].
Water 16 02987 g003
Figure 4. Models for inundation analysis in coastal areas [4].
Water 16 02987 g004
Figure 5. Mesh and depth map for the storm surge model. (a) Mesh; (b) Depth; (c) Examples of mesh around study areas.
Water 16 02987 g005aWater 16 02987 g005b
Figure 6. Typhoon path and tidal station to validate the storm surge model.
Water 16 02987 g006
Figure 7. Example of the typhoon path selected based on a 100-year frequency tidal wave height (Marine City (Busan)).
Water 16 02987 g007
Figure 8. Simulation boundaries of the FLOW-3D Model for Marine City in Busan. A~C are the input boundaries of wave and storm surge in FLOW-3D.
Water 16 02987 g008
Figure 9. Wave overtopping rate calculated by the FLOW-3D model. (a) Oedo-dong in Jeju; (b) Ocheon Port in Boryeong.
Water 16 02987 g009
Figure 10. Inundation simulation model by XP-SWMM. (a) Marine City (Busan); (b) Oedo-dong (Jeju); (c) Jungang-dong (Gunsan); (d) Ocheon Port (Boryeong); (e) Gampo Port (Gyeongju); (f) Imwon Port (Samcheok).
Water 16 02987 g010aWater 16 02987 g010b
Figure 11. Considering wave overtopping on XP-SWMM. (a) Input of wave overtopping; (b) Rainfall and wave overtopping rate.
Water 16 02987 g011
Figure 12. Validation of the inundation simulation model for Marine City (Busan) during Typhoon Chaba. (a) Simulation result; (b) Inundation trace map.
Water 16 02987 g012
Figure 13. Inundation simulation results (left: present, center: 2050, right: 2100).
Water 16 02987 g013aWater 16 02987 g013b
Figure 14. Variation in the increase in flooding impact due to climate change.
Water 16 02987 g014
Figure 15. Prevention facilities from wave overtopping. (a) Marine City (Busan); (b) Gampo Port (Gyeongju).
Water 16 02987 g015aWater 16 02987 g015b
Table 1. Major information about the study area.
Sea AreaTarget AreasArea
(km2)
Major
Characteristics
Pump FacilityNumber
of Major
Outfalls
The south coastMarine City (Busan)0.53Wave overtopping-8
Oedo-dong (Jeju)1.53Wave overtopping-5
The west coastJungang-dong (Gunsan)0.79Poor interior drainage at high tide level33
Ocheon Port (Boryeong)0.41High tide level-5
The east coastGampo Port (Gyeongju)0.55Wave overtopping-5
Imwon Port (Samcheok)0.20Wave overtopping-6
Table 2. Rate of increase in probability rainfall by area in 2050 and 2100.
Sea AreaTarget AreasRate of Increase in Probability Rainfall (%)
In 2050In 2100
The south coastMarine City (Busan)5.8011.78
Oedo-dong (Jeju)4.049.86
The west coastJungang-dong (Gunsan)6.216.75
Ocheon Port (Boryeong)0.835.09
The east coastGampo Port (Gyeongju)3.356.69
Imwon Port (Samcheok)4.1417.47
Note: Increase rates of future probable rainfall: MOIS (2017) [26].
Table 3. Probability rainfall by target years.
RegionDuration
(hour)
100-yr Return Period Rainfall Amount (mm)Selection
Present20502100
Busan1108.2114.5121.0O
2142.6155.4172.5
Jeju190.394.099.3O
2123.6134.1148.2
Gunsan181.586.587.0
2123.6131.2131.9O
Boryeong1102.7103.6107.9O
2147.8149.0155.3
Gyeongju164.770.478.2
290.298.1108.8O
Samcheok174.881.690.9O
291.3100.1111.9
Note: Present probable rainfall: ME (2019) [27]; Future probable rainfall: Calculated by applying the increase rates from Table 2 to the present probable rain.
Table 4. Current storm surge height and sea level rise by sea area in 2050 and 2100.
Sea AreaTarget AreasCurrent Storm Surge Height
for 100 yr-Return Period (m)
Sea Level Rise (m)
In 2050In 2100
The south coastMarine City (Busan)0.970.2040.848
Oedo-dong (Jeju)0.900.2731.032
The west coastJungang-dong (Gunsan)1.390.2100.864
Ocheon Port (Boryeong)1.58
The east coastGampo Port (Gyeongju)0.770.1950.768
Imwon Port (Samcheok)0.72
Note: Future sea-level rise: MOIS (2018) [28].
Table 5. Hypothetical typhoon scenarios to replicate the 100-year return period storm surge.
Sea AreaCondition
/Case
Movement SpeedInvasion AngleMovement PathCentral PressureMaximum Wind RadiusTidalTotal
Cases
LongitudeLatitude
The south coastCondition30 km/hS~WSW
(interval: 22.5°)
−1.5°~+1.5° based on the area
(interval: 0.25°)
-930~970 hPa
(interval: 10 hPa)
80 km/hApprox. H.H.W.260
Case1413-511
The west coastCondition30 km/hS~SW
(interval: 22.5°)
125.0~127.5°
(interval: 0.5°)
0~1° based on the area
(interval: 0.25°)
950~980 hPa
(interval: 10 hPa)
80 km/hApprox. H.H.W.240
Case1354411
The east coastCondition30 km/h348.75°~33.75°
(interval: 22.5°)
129.0~130.0°
(interval: 0.25°)
−0.25~0.25° based on the area
(interval: 0.25°)
950~980 hPa
(interval: 10 hPa)
80 km/hApprox. H.H.W.300
Case1554411
Table 6. Error of the maximum storm surge height estimated by the storm surge model.
Name of Typhoon
(Number)
Tidal StationObs.
(cm)
Cal.
(cm)
ARE
(%)
MAEMI
(0314)
BS77752.6
YS2282117.5
US59601.7
BOLAVEN
(1215)
IC1511520.7
WD76751.3
HSD84822.4
SANBA
(1216)
BS80791.3
US76751.3
CHABA
(1618)
BS89872.2
YS1171235.1
LINGLING
(1913)
IC1471480.7
WD64606.3
Table 7. Example of the analysis results of tidal wave height by typhoon scenario (Marine City (Busan)).
ScenarioMax. Significant Wave Height (m)Max. Storm Surge Height (m)Direction of Wave (deg.)Central Pressure (hPa)Invasion
Angle (deg.)
Longitude (deg.)Period
(s)
P17.250.94164.2930247.5129.2516.0
P27.200.94163.3940247.5129.5015.6
P37.210.96163.0940225.0129.0015.2
P47.180.96162.7940247.5129.7515.2
P57.110.95159.7940247.5130.0014.3
P66.940.96158.1940222.5129.5013.4
P76.600.94142.1950180.0129.0013.7
Table 8. Prediction of inundation due to climate change.
Sea AreaRegionRate of Increase in Inundation Area (%)Rate of Increase in Total Flooding Volume (%)
In 2050In 2100In 2050In 2100
The south coastMarine City (Busan)9.325.65.525.9
Oedo-dong (Jeju)45.7146.148.9290.5
The west coastJungang-dong (Gunsan)36.784.089.3321.3
Ocheon Port (Boryeong)10.633.826.9129.2
The east coastGampo Port (Gyeongju)2.512.25.117.2
Imwon Port (Samcheok)6.1117.16.8163.9
Disclaimer/Publisher’s Note: The statements, opinions and data contained in all publications are solely those of the individual author(s) and contributor(s) and not of MDPI and/or the editor(s). MDPI and/or the editor(s) disclaim responsibility for any injury to people or property resulting from any ideas, methods, instructions or products referred to in the content.