Abstract
The Longmen Shan fold and thrust belt, situated on the eastern margin of the Qinghai–Tibet Plateau, is prone to disasters like earthquakes and debris flows. Thus, applying rapid assessment methods for emergency water sources in disaster-affected areas is crucial for local populations and ensuring an effective response to disasters. In this study, we employed electrical resistivity tomography (ERT) to investigate groundwater resources in post-disaster regions. By integrating the results from ERT profiles with geological and borehole information, we determined the lithology and depth of aquifers. Additionally, we analyzed groundwater recharge and discharge patterns relative to surface water during various precipitation periods and generated a hydrogeological profile for the region. Borehole information confirmed our inferred lithology and aquifer depth, thereby ensuring a reliable water supply during emergencies. This study demonstrates the feasibility of ERT for rapidly identifying water resources in geologically complex environments, providing a scientific foundation for water resource management in disaster-prone regions.
1. Introduction
The Longmen Shan fault belt formed as a result of crustal deformation caused by the collision and compression between the Indian and Eurasian plates. The intricate geological formations and the buildup of stress along fault lines render this region especially susceptible to seismic events and associated hazards. Ensuring the safety of water in earthquake-affected areas is essential for meeting the basic needs of displaced populations. Previous studies have shown that surface water, such as rivers, exhibits significant contamination both before and after seismic events, while relatively enclosed water sources, like groundwater, experience smaller fluctuations in pollutant concentrations [,]. On the one hand, the destruction of infrastructure caused by earthquakes makes surface water highly vulnerable to pollutant infiltration []. On the other hand, emergency responses for disinfection and pest control often lead to elevated levels of organic pollutants in surface water []. Therefore, it is crucial to carry out efficient, low-cost, and non-invasive surveys of enclosed groundwater sources to ensure a sufficient water supply after earthquake disasters.
Among the geophysical methods, direct current resistivity and electromagnetic induction techniques are particularly suitable for groundwater exploration. The electrical resistivity tomography (ERT) method has been widely employed in groundwater detection. Mainoo et al. (2019) [] applied two-dimensional ERT in the Voltaian Supergroup of Ghana, a region characterized by complex hydrogeological conditions, to investigate groundwater resources. Through the comparison of borehole data with ERT interpretation results, they identified a strong correlation between resistivity boundaries and lithological transitions. As a result, borehole drilling success rates increased from 50% to 80% with the guidance of ERT survey findings. Bahkaly et al. (2015) [] employed the Wenner and Schlumberger arrays to obtain two-dimensional resistivity images, dividing the subsurface into distinct lithological layers, including dry gravel, aquifers, and bedrock, based on electrical tomography. From this, they inferred and mapped the extent of the water bodies. Park et al. (2014) [] evaluated the effectiveness of various array configurations for detecting subsurface cavities through numerical simulations and field tests. Hasan et al. (2019) [] employed a 5 m Schlumberger array to delineate aquifer sands and gravel layers, with the ERT results showing a strong correlation with hydrogeological data, demonstrating the effectiveness of non-invasive geophysical methods for freshwater resource detection. In recent years, the application of ERT in groundwater exploration has become increasingly widespread [,,]. In the realm of electromagnetic induction methods, transient electromagnetic (TEM) and nuclear magnetic resonance (NMR) techniques are also widely utilized for groundwater exploration [,,]. Taking advantage of the generally flat terrain in the Aarhus region, Auken et al. (2003) [] employed ground-based TEM methods to conduct a groundwater survey in the urban area of Aarhus, Denmark. Their findings offered valuable hydrogeophysical insights for optimizing groundwater utilization in the Aarhus region. Walsh et al. (2013) [] utilized a smaller, more cost-effective NMR logging system for groundwater investigations, enabling direct measurement of the water content in natural formations. However, applying ground-based transient electromagnetic methods in complex geological environments, such as disaster-stricken areas, poses significant challenges. Although effective, aerial transient electromagnetic surveys have high data acquisition costs, making them impractical for low-cost groundwater exploration in disaster zones []. Moreover, the complex and variable geological conditions in disaster areas can hinder the accuracy of NMR data, particularly in high-noise environments []. In contrast, ERT equipment provides several advantages, such as portability, ease of operation, rapid data acquisition, and straightforward data processing and interpretation. As a result, the required findings can be obtained rapidly []. Thus, ERT shows considerable potential for emergency groundwater exploration in post-disaster scenarios.
In this study, we first present the principles of the ERT method and its potential for groundwater exploration. Then, we provide an overview of the geological conditions in the study area, situated along the Longmen Shan fault belt. ERT surveys and on-site hydrogeological investigations were conducted in the post-disaster study area. By integrating resistivity profiles with geological, hydrological, and borehole data, we identified the lithology and depth of the underground aquifers, enabling the rapid identification of optimal well locations to ensure an emergency water supply for residents during disaster situations. This study serves as a reference for the rapid groundwater detection and well construction in earthquake-affected areas.
2. Geological Context of the Study Area
The study area is situated in Huangjiaba Village, Beichuan County, Mianyang City, Sichuan Province, southwestern China (as shown in Figure 1a). It is positioned within the Longmen Shan fold-thrust belt along the eastern edge of the Qinghai–Tibet Plateau. The main exposed strata consist of the Cambrian Jiangjiagou Formation, Modao Formation, Silurian Xintan Group, Luoreping Group, as well as the Devonian and Permian formations. The lithologies comprise Cambrian sandstone and siltstone, Silurian sandy shale interbedded with sandstone, Permian carbonaceous shale and limestone, and Devonian alternating layers of limestone and sandstone (as shown in Figure 1b).
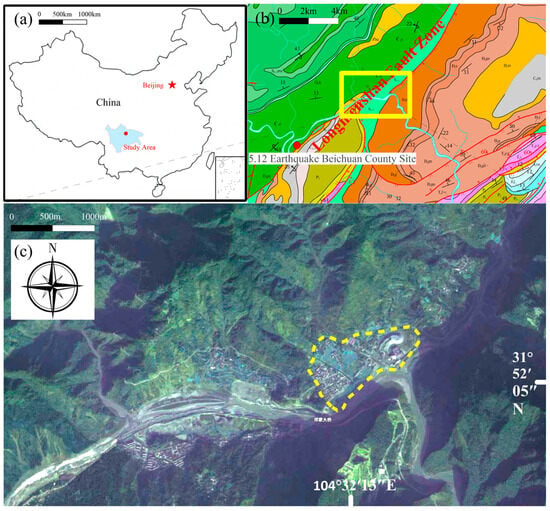
Figure 1.
Location and geological overview of the study area. (a) Location of the study area; (b) geological overview, yellow rectangle indicates the range of Figure 1c; (c) Image of the survey area, yellow dashed line is the extent of Huangjiaba village.
Beichuan Qiang Autonomous County was among the areas most severely impacted by the catastrophic ‘5.12’ Wenchuan earthquake in 2008 [,,]. Historically, this region has been highly susceptible to frequent geological hazards, including landslides and debris flows, classifying it as a high-risk area for multiple disaster types [,]. The primary fault in the study area is the Yingxiu–Beichuan fault, the central fault of the Longmen Shan fault system (as shown in Figure 2). This fault divides Precambrian metamorphic complexes and Silurian–Devonian strata on one side, which are thrust over Upper Paleozoic–Triassic strata on the other. This thrusting and overthrusting have caused significant stress accumulation along the contact zones, rendering the region particularly susceptible to earthquakes and other geological hazards [,]. The northern segment of the Longmen Shan overthrust zone forms a narrow, northeast–southwest trending belt that extends across Beichuan, Jiangyou, and Guangyuan. The area is distinguished by well-developed faults that form narrow, elongated zones, primarily composed of brittle carbonates and clastic rocks. These faults are predominantly compressive, high-angle reverse faults arranged in an imbricate pattern, with dips typically exceeding 50° and oriented northwestward. Structural fractures in the study area are relatively well developed, with fracture densities typically ranging from 0.5% to 10%, and locally reaching 10% to 20% or higher []. Longitudinal tension fractures are often well developed in the cores of folds, with their development diminishing or weakening from top to bottom. These fractures are intermittently layered, facilitating groundwater migration.
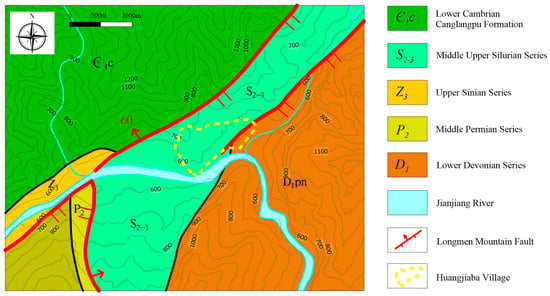
Figure 2.
Geological map of study area.
Huangjiaba Village is situated in the northwestern part of the Sichuan Basin (as shown in Figure 1c), at the intersection of mountainous terrain and river valleys, on the alluvial fan formed by the confluence of the Qingnigou and Jianjiang Rivers. The village sits at an elevation of approximately 680 m, surrounded by mountain peaks exceeding 1500 m, forming a narrow rift valley that serves as a typical water catchment area. The region has a mild climate with abundant rainfall, averaging 800–1200 mm annually. The area is characterized by well-developed valleys and a dense river network, with significant erosion processes that play a crucial role in groundwater movement and storage.
Generally, the groundwater recharge, flow, and discharge patterns in the Huangjiaba region are closely related to the seasons. During the spring and summer rainy seasons, when precipitation is abundant, a portion of the rainfall contributes to surface runoff and infiltration, recharging the groundwater, while another portion flows through infiltration and runoff into the study area, eventually discharging through rivers. In the autumn and winter dry seasons, when precipitation is minimal, groundwater levels decrease due to plant absorption and transpiration, and recharge occurs mainly through upstream groundwater flow and river infiltration.
3. Materials and Methods
3.1. ERT Principle and Its Relation to Groundwater
The ERT method is an array-based exploration technique that exploits the conductivity differences between rocks and minerals. By observing and analyzing the distribution patterns and characteristics of an artificially induced electric field in the subsurface, it infers and interprets the structure of geological bodies to address geological problems []. ERT delivers higher data acquisition efficiency, more comprehensive information, and a more simplified interpretation than traditional resistivity methods. The apparent resistivity is calculated using the following formula:
In this formula, K represents the geometric factor of the array. The ERT method utilizes various electrode configurations, including Wenner, Dipole–Dipole, and Schlumberger arrays, each with distinct geometric arrangements and corresponding geometric factors []. The selection of an array depends on factors such as the target, required resolution, and signal-to-noise ratio. The Wenner array was chosen for this study due to its high signal-to-noise ratio, strong interference resistance, and superior lateral and vertical resolution [].
Resistivity typically reflects the physical properties of subsurface materials, with rock resistivity varying based on changes in temperature, pressure, and water content [,]. Table 1 shows the resistivity values of common rocks and natural water under standard temperature and pressure conditions [,,,,,,]. As water content increases, rock resistivity decreases, and higher ion concentrations in the water further lower the resistivity [,]. In summary, the resistivity of geological formations is influenced by several factors, including lithology, porosity, pore connectivity, salinity, and water saturation. Generally, aquifers are characterized by higher porosity and water saturation, resulting in relatively low resistivity. In contrast, confining layers have denser lithology, lower porosity, and poorer connectivity, leading to relatively high resistivity. Therefore, based on the geological information for the study area, the low-resistivity zones in the shallow subsurface can be interpreted as saturated sandstone aquifers. The distribution characteristics of these low-resistivity areas, combined with geological data, suggest that they likely represent permeable, water-bearing sandstone or fractured aquifers. In contrast, adjacent high-resistivity zones correspond to impermeable sandy shale formations.

Table 1.
Resistivity range of major rock types and natural water (Ω·m).
3.2. Basic Principle of ERT Inversion
Forward modeling in ERT involves simulating the distribution characteristics of a semi-infinite potential field under a steady current source, enabling the numerical analysis of subsurface electrical anomalies []. It is performed using the finite element method for direct current, where the subsurface is discretized into a finite element grid through meshing of the underground space []. Each subdivided element is assumed to have linearly distributed, isotropic resistivity or conductivity. The potential at the corner points of each element is calculated using Poisson’s differential equation for 2D direct current resistivity, with appropriate boundary conditions ensuring a unique forward solution [,].
In the field of steady-state point source direct current resistivity inversion algorithms, Sasaki (2006) [] introduced a smoothness-constrained least squares inversion method, which laid the foundation for ERT inversion calculations. Building on Sasaki’s study, Dahlin et al. (1998) [] developed a quasi-Newton optimization algorithm for nonlinear least squares inversion, significantly enhancing computational efficiency by several orders of magnitude. In this paper, the resistivity inversion is formulated using a least squares objective function, with a conjugate gradient optimization algorithm employed for the iterative solution. The least squares inversion objective function is as follows:
where is the least squares inversion objective function; represents the observed data, i.e., the apparent resistivity; represents the simulated data during the inversion process; is the data weighting matrix; is the roughness operator applied to the model; is the resistivity model of the subdivided underground elements; represents the reference or prior model; and is the regularization parameter.
During the data acquisition, we selected the appropriate array type and electrode spacing based on site-specific environmental interference and topographical conditions. In areas with significant topographic variation, a 10 m electrode spacing was used, while a 5 m spacing was applied where the survey line length was constrained. This approach minimized the impact of terrain factors on data collection while maximizing detection resolution. We used a TRK positioning system to measure the coordinates and elevations of each electrode to facilitate terrain-based data inversion.
EarthImager2D software (Version:2.4.0) was employed for data processing. We began by removing anomalous data points from the apparent resistivity profile. Then, we selected appropriate parameters for model discretization, forward modeling methods, and objective function optimization. Through iterative optimization, we obtained a well-fitted resistivity inversion profile. Based on the electrical resistivity differences in the ERT inversion profile, we delineated different lithologies, which we further verified and adjusted using geological and borehole data. This process enabled more accurate inference and interpretation of the lithological boundary distribution.
4. Results and Discussion
4.1. Survey Results
The groundwater levels in Huangjiaba fluctuate, being higher during the rainy season and lower during the dry season. Therefore, when selecting the optimal water extraction location, it is necessary to consider several factors, including ensuring access to water even during the low groundwater levels of the dry season, protecting the extraction facilities from flood damage during the rainy season, and ensuring proximity to residential areas for ease of access.
The profiles were used to map subsurface undulations, locate aquiferous layers, determine the depth of the water table in Huangjiaba Village, and identify optimal water storage zones. These profiles were oriented southwest to northeast (as shown in Figure 3), with profiles “a” and “c” each measuring 500 m in length, and profile “b” measuring 760 m.
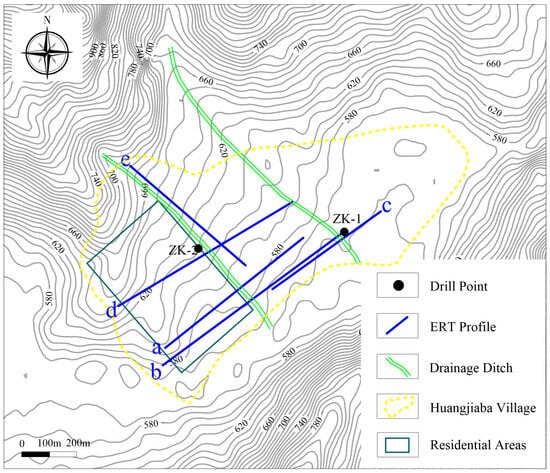
Figure 3.
Topographic map of Huangjiaba Village and layout of geological survey.
Figure 4 illustrates the resistivity profiles named “a”, “b”, and “c”. As shown in Figure 4a, the shallow water table in the 0–200 m section of profile “a” has an increased moisture content due to the capillary siphoning effect of sandy clay, resulting in lower resistivity. At the 200–500 m section, where the water table is deeper, the surface sandy clay exhibits higher resistivity. The underlying sandstone acts as the main aquifer, with depths ranging from 20 to 40 m, generally shallower on the left and deeper on the right. The underlying sandy shale layer is relatively intact and impermeable, providing a favorable water storage space within the sandstone layer.
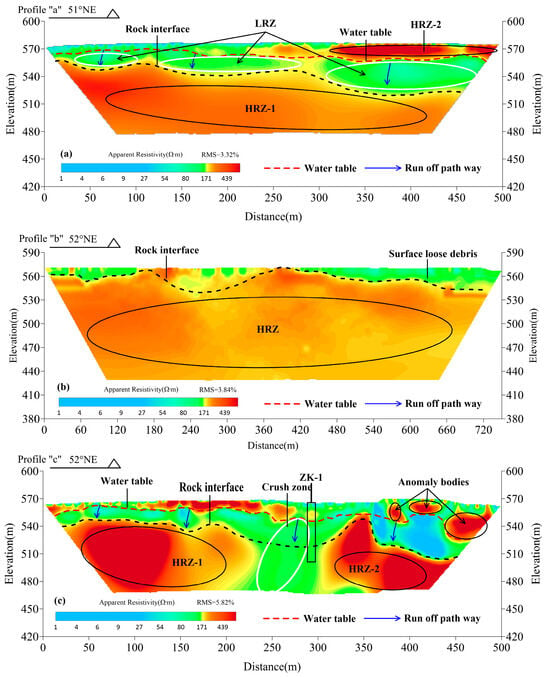
Figure 4.
ERT profiles named “a”, line “b”, line “c”. HRZ: high-resistivity zone; LRZ: low-resistivity zone. (a) Inversion result of profile “a” (b) Inversion result of profile “b” (c) Inversion result of profile “c”.
In Figure 4b, the profile “b” shows a surface layer of highly weathered sandstone, with sandy shale at the bottom. The interface between the sandstone and sandy shale exhibits a similar undulating pattern to that observed on profile “a”, with both interfaces located at an approximate elevation of 560 m. This suggests that the strata between profiles “a” and “b” are relatively flat, without significant undulations.
As shown in Figure 4c, the starting point of profile “c” is positioned at the 500 m mark of profile “b”, and the resistivity inversion results in the overlapping sections of the two lines align closely. The lithology and stratification on profile “c” are consistent with those observed on profile “a”. According to borehole ZK-1 (as shown in Figure 5), the surface layer at ZK-1 consists of 14 m of sandy clay, with groundwater encountered at 17 m. The sandstone layer extends from 14 to 28 m, and the sandy shale layer from 28 to 60 m. We used core samples and water-bearing depths from boreholes to identify the lithology of aquifers and confining layers in the study area. By incorporating borehole information into the corresponding ERT profiles, we found that the aquifer lithology consists of sandstone, while the confining layer is composed of sandy shale. The resistivity of sandstone was observed to be lower than that of sandy shale. Based on the borehole information, the interpretation of the profiles indicates a surface layer of unevenly thick sandy clay, followed by a sandstone layer with a bottom interface at an elevation of 540 m, underlain by sandy shale, which contains a developed fracture zone.
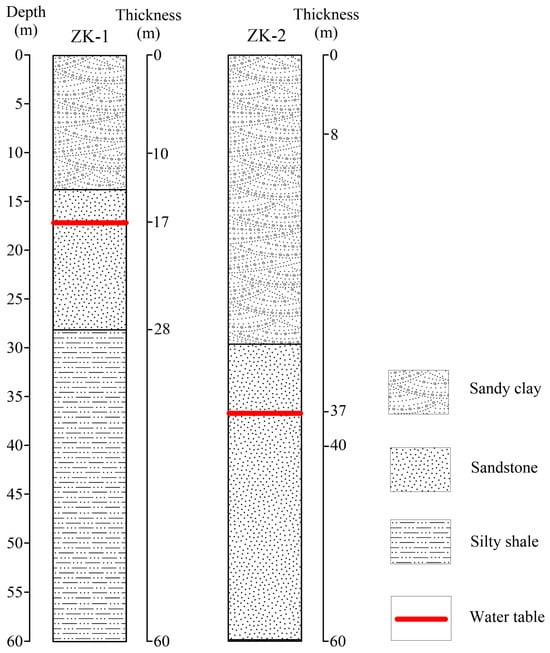
Figure 5.
Drill hole column diagram.
To better meet the water needs of Huangjiaba Village residents and based on the information from the three previous profiles and borehole ZK1, we established two additional survey profiles, “d” and “e”, in the higher-elevation residential area on the upper slope (as shown in Figure 3). These profiles are oriented perpendicular to each other. Based on this resistivity contrast, we were able to delineate the lithological boundaries of the sandstone and sandy shale on other survey lines. This information allowed us to infer the vertical extension of the aquifer’s top and bottom boundaries across the profiles and provided a reference for determining the optimal location for villagers to obtain water.
As shown in Figure 6a, the inversion results of profile “d” reveal three distinct electrical layers. The 0–400 m section consists of loose deposits with relatively low resistivity. The high-resistivity anomaly HRZ-1 corresponds to sandy clay with a low moisture content, exhibiting resistivity typically greater than 500 Ω·m, and aligns with the high-resistivity surface layer observed in profiles “a”, “b”, and “c”. The low-resistivity anomalies LRZ-1 and LRZ-2 represent sandstone, and these two anomalies are interconnected, extending the middle low-resistivity sandstone layer identified in profiles “a”, “b”, and “c” toward the higher elevations. The high-resistivity anomaly HRZ-2 at the bottom corresponds to a sandy shale confining layer, which exhibits an undulating pattern in profile “d”.
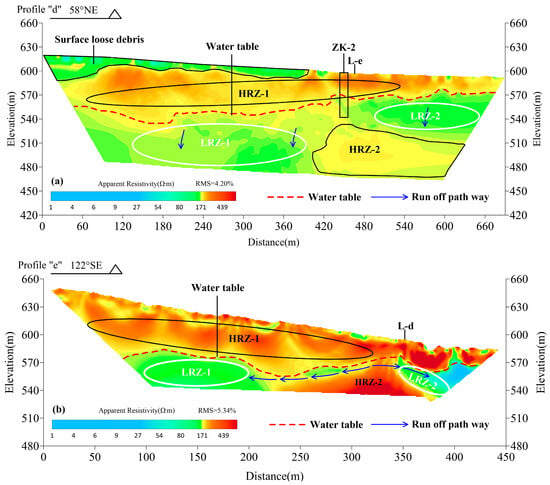
Figure 6.
ERT profiles named “d”, line “e”. HRZ: high-resistivity zone; LRZ: low-resistivity zone; L-d: line “d”, L-e: line “e”. (a) Inversion result of profile “d” (b) Inversion result of profile “e”.
As shown in Figure 6b, profile “e” intersects with profile “d” at the 350 m mark and is oriented from higher to lower elevations. The three-layer lithological structures inferred from profiles “d” and “e” showing strong agreement in aquifer depth and undulating surface patterns. As a result, further elaboration is unnecessary.
Based on the inversion results of profiles “d” and “e” and considering the optimal water extraction location for the villagers, we drilled well ZK-2 at the 450 m mark on profile “d”. The borehole revealed 0–30 m of sandy clay, followed by 30–60 m of sandstone, with water encountered at 37 m. The well yielded 60 cubic meters per day, and the sandstone layer provided natural filtration, resulting in good water quality. This supply was sufficient to meet the emergency water needs of the entire village.
In summary, we initially based our analysis on the inversion results of profiles “a”, “b”, and “c”, integrating hydrogeological information and river water levels, and drilled well ZK-1 at the selected location to verify our predictions. However, since the location of ZK-1 was adjacent to a drainage channel, extreme weather events could potentially cause the water level in the channel to rise and damage the well’s pumping equipment. Additionally, ZK-1 was relatively far from the residential area, making it less convenient for daily water use by the villagers. To address these concerns, we established two additional profiles, “d” and “e”, with “d” oriented southwest–northeast and “e” oriented northwest–southeast, measuring 450 m and 690 m in length, respectively. By synthesizing the interpretations from all five profiles, we inferred the lithology and depth of the aquifers as well as the groundwater recharge and migration patterns, and we identified the optimal water storage location. Ultimately, we verified our findings by drilling well ZK-2 at a location most convenient for the villagers, which confirmed our predictions.
4.2. Geological Interpretation
We divided the shallow subsurface of the study area into three electrical layers based on the inversion results of profiles “a”, “b”, and “c”. The surface layer consists of sandy clay, which becomes progressively thinner from the mountain top to the foothills. This layer is relatively loose, facilitating rainfall infiltration during precipitation events. The resistivity of sandy clay with a low moisture content is typically high, usually greater than 500 Ω·m. The middle layer is composed of sandstone with well-developed porosity, serving as the main aquifer in the study area. It reveals a low resistivity ranging from 0 to 200 Ω·m. The bottom layer consists of dense sandy shale, which is impermeable and forms an effective confining layer with a higher resistivity.
By integrating the interpretation results from profiles “d” and “e”, we inferred a northeast–southwest-oriented geological cross-section (as shown in Figure 7). Due to the thrusting and overthrusting of tectonic plates in the study area, a series of thrust structures have formed, causing the rock layers to bend and deform, resulting in the formation of anticlines and synclines. The rock within the core of the anticlines is more fractured, with well-developed fissures, which facilitates groundwater movement. In contrast, the syncline areas form favorable water storage zones. During the wet season, rainwater infiltrates the surface and recharges the aquifer, subsequently discharging as runoff into rivers. During the dry season, the river water infiltrates back into the aquifer, replenishing the groundwater storage.
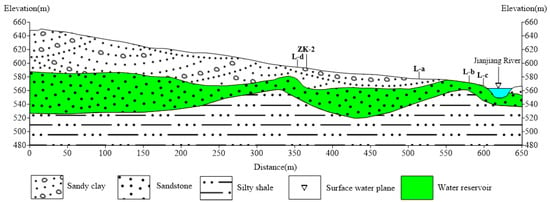
Figure 7.
Geological section inference interpretation map of profile “e”.
In the event of a disaster that disrupts surface water flow or contaminates surface water sources, groundwater serves as a critical backup supply. Groundwater is naturally filtered by rock formations, making it less susceptible to pollution. By integrating ERT profiles with borehole and geological data, we can infer the lithology, depth, and undulating boundaries of aquifers and confining layers. This information, combined with an understanding of groundwater recharge, flow, and discharge patterns, allows us to identify optimal well locations, thereby rapidly addressing water needs in emergency situations.
El-Raouf et al. (2021) [] integrated the multichannel analysis of surface waves with ERT to evaluate the groundwater conditions and geological strata characteristics in the vicinity of the Longmen Shan fault zone. The research primarily focused on the stability and potential reactivation of landslides. The study demonstrated that combining geophysical methods enables the effective characterization of landslide dynamics and groundwater infiltration behaviors.
Meng et al. (2020) [] employed a combination of seismic reflection techniques, ERT, and drilling to detect the concealed active faults in the Pingwu region, situated at the northern terminus of the Longmen Shan fault zone. Their study confirmed the existence of the Pingwu–Qingchuan fault in the urban region of Pingwu, supplying essential data for earthquake mitigation and urban planning efforts.
In contrast to the studies by Meng and El-Raouf, which mainly concentrated on fault characteristics such as dip, strike, and other structural information or used two geophysical techniques to identify the landslide surface and its dynamic behavior, our research leveraged the practical advantages of ERT to focus on the lithology, depth, and undulating characteristics of shallow aquifers, as well as the groundwater recharge, flow, and discharge patterns in mountainous or disaster-prone regions. This approach enabled us to pinpoint optimal water extraction sites, providing a case study for rapid water exploration in disaster-affected areas.
5. Conclusions
The Longmen Shan fault zone is a narrow, elongated thrust structure characterized by a series of imbricated high-angle reverse faults. The complex geological structure and accumulated unstable stress along the contact zones make the region prone to frequent disasters, such as earthquakes. Ensuring a reliable water supply for the affected population is of critical importance. The key issue discussed in this paper is how to rapidly detect groundwater in disaster-stricken areas.
In this work, we focused on the unique geological conditions of the Huangjiaba area near the Longmen Shan fault zone and selected ERT as a rapid and convenient geophysical method for post-disaster water exploration. Based on an understanding of the geological characteristics of the study area, we set up three survey lines and drilled a borehole on one of the lines, determining the approximate water level and the depth of the top and bottom of the aquifer. Using these results, we then deployed two intersecting lines perpendicular to the initial survey line to determine the undulating shape of the aquifer and the groundwater recharge–flow–discharge pattern in the study area.
In summary, we applied the ERT method for groundwater exploration. By integrating multiple ERT profiles with geological and borehole data, we interpreted the resistivity variations to infer the lithology of the strata and the undulating boundaries. This allowed us to identify the aquifers and confining layers and to determine the optimal groundwater extraction point.
This study demonstrates the feasibility of rapidly detecting groundwater using ERT combined with geological and borehole data. It successfully achieved the objective of quickly locating water sources in disaster-affected areas, providing a case study for emergency groundwater exploration in future disaster scenarios.
Author Contributions
Conceptualization, P.L.; methodology, S.L., S.H. and P.L.; software, C.C.; formal analysis and investigation, S.H., Y.X., P.L. and T.H.; data curation, C.C. and S.L.; writing—original draft preparation, P.L.; writing—review and editing, S.H.; supervision, S.L. and S.H. All authors have read and agreed to the published version of the manuscript.
Funding
This research was funded by The National Key Research and Development Program of China (2020YFC1512401) and the Technology Innovation Guidance Program of Jiangxi Province (2022KSG01003).
Data Availability Statement
The raw data supporting the conclusions of this article will be made available by the authors on request.
Conflicts of Interest
Author Tao Hong was employed by the company China Energy Engineering Group Guangdong Electric Power Design Institute Co., Ltd. The remaining authors declare that this research was conducted in the absence of any commercial or financial relationships that could be construed as a potential conflict of interest.
References
- Jafarpour, K.; Leangkim, K.; Anuar, A.N.; Yuzir, A.M.; Ros, F.C.; Said, N.F.; Asanuma, J. Impact of earthquake on river water quality based on combination of satellite data and groundwater analysis. Watershed Ecol. Environ. 2024, 6, 114–124. [Google Scholar] [CrossRef]
- Yang, Y.; Li, L.; Zhan, F.B.; Zhuang, Y.H. Probabilistic Analysis of Earthquake-Led Water Contamination: A Case of Sichuan, China. Pure Appl. Geophys. 2016, 173, 1859–1879. [Google Scholar] [CrossRef]
- Pant, B.R.; Thapa, K.; Koju, R. Post-earthquake drinking water quality in the Kathmandu valley: A pilot study. Al Ameen J. Med. Sci. 2016, 9, 130–133. [Google Scholar]
- Ruan, F.M.; Zhu, S.Y.; Chang, W.J.; Zhang, Q.; Cao, G.W. Investigation on organism pollution of various water resources after devastating earthquake in Yingxin Town of Wenchuan County. Acad. J. Second. Mil. Med. Univ. 2008, 12, 737–740. [Google Scholar]
- Mainoo, P.A.; Manu, E.; Yidana, S.M.; Agyekum, W.A.; Stigter, T.; Duah, A.A.; Preko, K. Application of 2D-Electrical resistivity tomography in delineating groundwater potential zones: Case study from the voltaian super group of Ghana. J. Afr. Earth Sci. 2019, 160, 103618. [Google Scholar] [CrossRef]
- Bahkaly, I.M.; El-Waheidi, M.M.; Jallouli, C.; Batayneh, A.T. Assessment of shallow aquifer salinity in the Aqaba Coastal plain using ERT method: A case study of Maqnah region, northwestern Saudi Arabia. Environ. Earth Sci. 2015, 74, 2105–2114. [Google Scholar] [CrossRef]
- Park, M.K.; Park, S.; Yi, M.J.; Kim, C.; Son, J.S.; Kim, J.H.; Abraham, A.A. Application of electrical resistivity tomography (ERT) technique to detect underground cavities in a karst area of South Korea. Environ. Earth Sci. 2014, 71, 2797–2806. [Google Scholar] [CrossRef]
- Hasan, M.; Shang, Y.; Akhter, G.; Jin, W. Application of VES and ERT for delineation of fresh-saline interface in alluvial aquifers of Lower Bari Doab, Pakistan. J. Appl. Geophys. 2019, 164, 200–213. [Google Scholar] [CrossRef]
- Mensah, V.; Boateng, C.; Gidigasu, S.; Wemegah, D.; Aryee, J.; Osei, M.; Toure, H.; Gilbert, J.; Afful, S.K. Groundwater Exploration Methods in West Africa: A Review. Earth arXiv. 2024. [Google Scholar] [CrossRef]
- Saoanunt, N.; Yungsukkasam, N. Electrical resistivity tomography (ERT) exploration data in drought prone areas case study: Buriram Province, Thailand. J. Water Land Dev. 2024, 61, 79–85. [Google Scholar] [CrossRef]
- Nouradine, H.; Schamper, C.; Valdes, D.; Moussa, I.; Ramel, D.; Plagnes, V. Integrating geological, hydrogeological and geophysical data to identify groundwater resources in granitic basement areas (Guéra Massif, Chad). Hydrogeol. J. 2024, 32, 759–784. [Google Scholar] [CrossRef]
- Orozco, A.F.; Aigner, L.; Montes-Avila, I.; Moser, C.; Cerca-Ruiz, F.; Giácoman-Vallejos, G.; Cardona-Benavides, A. Application of Transient Electromagnetic to Understand Infiltration in Farmlands in Karst Areas of Yucatan, Mexico; EGU: Wien, Austria, 2024. [Google Scholar]
- Morozov, D.; McLaughlin, C.; Grunewald, E.D.; Irons, T.; Walsh, D.O. Gradient-based surface nuclear magnetic resonance for groundwater investigation. Geophysics. 2024, 89, J19–J32. [Google Scholar] [CrossRef]
- Zhu, Z.; Shan, Z.; Pang, Y.; Wang, W.; Chen, M.; Li, G.; Sun, H.; Revil, A. The transient electromagnetic (TEM) method reveals the role of tectonic faults in seawater intrusion at Zhoushan islands (Hangzhou Bay, China). Eng. Geol. 2024, 330, 107425. [Google Scholar] [CrossRef]
- Auken, E.; Jørgensen, F.; Sørensen, K.I. Large-scale TEM investigation for groundwater. Explor. Geophys. 2003, 34, 188–194. [Google Scholar] [CrossRef]
- Walsh, D.; Turner, P.; Grunewald, E.; Zhang, H.; Butler, J.J.; Reboulet, E., Jr.; Fitzpatrick, A. A small-diameter NMR logging tool for groundwater investigations. Ground Water. 2013, 51, 914–926. [Google Scholar] [CrossRef]
- Allen, D. Groundwater applications of towed TEM in diverse geology at farm scale. ASEG Ext. Abstr. 2019, 1, 1–4. [Google Scholar] [CrossRef]
- Larsen, J.J.; Liu, L.; Grombacher, D.; Osterman, G.; Auken, E. Apsu—A new compact surface nuclear magnetic resonance system for groundwater investigation. Geophysics 2020, 85, JM1–JM11. [Google Scholar] [CrossRef]
- Sharifi, M.; Young, B. Electrical Resistance Tomography (ERT) applications to Chemical Engineering. Chem. Eng. Res. Des. 2013, 91, 1625–1645. [Google Scholar] [CrossRef]
- Cui, P.; Chen, X.-Q.; Zhu, Y.-Y.; Su, F.-H.; Wei, F.-Q.; Han, Y.-S.; Zhuang, J.-Q. The Wenchuan Earthquake (May 12, 2008), Sichuan Province, China, and resulting geohazards. Nat. Hazards. 2009, 56, 19–36. [Google Scholar] [CrossRef]
- Huang, R.; Li, W. Post-earthquake landsliding and long-term impacts in the Wenchuan earthquake area, China. Eng. Geol. 2014, 182, 111–120. [Google Scholar] [CrossRef]
- Zhang, L.M.; Zhang, S.; Huang, R.Q. Multi-hazard scenarios and consequences in Beichuan, China: The first five years after the 2008 Wenchuan earthquake. Eng. Geol. 2014, 180, 4–20. [Google Scholar] [CrossRef]
- Lei, J.; Zhao, D. Structural heterogeneity of the Longmenshan fault zone and the mechanism of the 2008 Wenchuan earthquake (Ms 8.0). Geochem. Geophys. Geosystems. 2009, 10, 10. [Google Scholar] [CrossRef]
- Lei, J.S.; Zhao, D.P.; Su, J.R.; Zhang, G.W.; Li, F. Fine Seismic Structure Under the Longmenshan Fault Zone and the Mechanism of the Large Wenchuan Earthquake. Chin. J. Geophys. 2013, 52, 112–119. [Google Scholar] [CrossRef]
- Liang, M.; Ran, Y.; Wang, H.; Li, Y.; Gao, S. A Possible Tectonic Response Between the Qingchuan Faultand the Beichuan-Yingxiu Fault of the Longmen Shan Fault Zone? Evidence from Geologic Observations by Paleoseismic Trenching and Radiocarbon Dating. Tectonics 2018, 37, 4086–4096. [Google Scholar] [CrossRef]
- Ran, Y.; Chen, W.; Xu, X.; Chen, L.; Wang, H.; Li, Y. Late Quaternary paleoseismic behavior and rupture segmentation of the Yingxiu-Beichuan fault along the Longmen Shan fault zone, China. Tectonics 2014, 33, 2218–2232. [Google Scholar] [CrossRef]
- Xiao, D.; Zhongquan, L.; Dian, L.; Yiling, H.; Wei, L.; Jianing, L.; Henglin, L. Analysis on multi period activity and evolution of Yingxiu-Beichuan fault in Longmenshan area. Ore Energy Resour. Geol. 2023, 15, 100021. [Google Scholar] [CrossRef]
- Daily, W.; Ramirez, A.; Binley, A.; LaBrecque, D. Electrical resistance tomography—Theory and practice. In Near-Surface Geophysics; SEG: Houston, TX, USA, 2005. [Google Scholar]
- Martorana, R.; Capizzi, P.; D’Alessandro, A.; Luzio, D. Comparison of different sets of array configurations for multichannel 2D ERT acquisition. J. Appl. Geophys. 2017, 137, 34–48. [Google Scholar] [CrossRef]
- Loke, M.H.; Barker, R.D. Rapid least-squares inversion of apparent resistivity pseudosections by a quasi-Newton method. Geophys. Prospect. 1996, 44, 131–152. [Google Scholar] [CrossRef]
- Brace, W.; Orange, A.; Madden, T. The effect of pressure on the electrical resistivity of water-saturated crystalline rocks. J. Geophys. Res. 1965, 70, 5669–5678. [Google Scholar] [CrossRef]
- Llera, F.J.; Sato, M.; Nakatsuka, K.; Yokoyama, H. Temperature dependence of the electrical resistivity of water-saturated rocks. Geophysics 1990, 55, 576–585. [Google Scholar] [CrossRef]
- Telford, W.M.; Geldart, L.P.; Sheriff, R.E. Applied Geophysics, 2nd ed.; Cambridge University Press: Cambridge, UK, 1990. [Google Scholar]
- Parasnis, D.S. Principles of Applied Geophysics, Chapman and Hall; Springer: Berlin/Heidelberg, Germany, 1979. [Google Scholar]
- Keller, G.V.; Frischknecht, F.C. Electrical Methods in Geophysical Prospecting; Pergamon Press: Oxford, UK, 1966. [Google Scholar]
- Archie, G.E. The electrical resistivity log as an aid in determining some reservoir characteristics. Trans. AIME 1942, 146, 54–62. [Google Scholar] [CrossRef]
- Dobrin, M.B. Introduction to Geophysical Prospecting, 4th ed.; McGraw-Hill: New York, NY, USA, 1996. [Google Scholar]
- Keller, G.V. Geophysical Prospecting for Groundwater; Pergamon Press: Oxford, UK, 1970. [Google Scholar]
- Reynolds, J.M. An Introduction to Applied and Environmental Geophysics; Wiley: Hoboken, NJ, USA, 1997. [Google Scholar]
- Datsios, Z.; Mikropoulos, P.; Karakousis, I. Laboratory characterization and modeling of DC electrical resistivity of sandy soil with variable water resistivity and content. IEEE Trans. Dielectr. Electr. Insul. 2017, 24, 3063–3072. [Google Scholar] [CrossRef]
- Park, S.; Shin, S.; Lee, D.; Kim, C.; Son, J. Relationship between electrical resistivity and physical properties of rocks. In Proceedings of the Near Surface Geoscience 2016—First Conference on Geophysics for MIneral Exploration and Mining, Barcelona, Spain, 4–8 September 2016. [Google Scholar]
- Udosen, N.I.; George, N.J. A finite integration forward solver and a domain search reconstruction solver for electrical resistivity tomography (ERT). Model. Earth Syst. Environ. 2018, 4, 1–12. [Google Scholar] [CrossRef]
- Cai, Y.; Liu, Z.; Dong, Z.; Liu, B.; Pang, Y.; Liu, J. Forward Modeling Analysis of Cross-hole Resistivity Tomography (ERT) Using Unstructured Grids. J. Phys. Conf. Ser. 2023, 2651, 012056. [Google Scholar] [CrossRef]
- Rücker, C.; Günther, T. The simulation of finite ERT electrodes using the complete electrode model. Geophysics. 2011, 76, F227–F238. [Google Scholar] [CrossRef]
- Hojat, A.; Loke, M.; Karimi-Nasab, S.; Ranjbar, H.; Zanzi, L. Two-dimensional ERT simulations to compare different electrode configurations in detecting qanats. In Proceedings of the 3rd Asia Pacific Meeting on Near Surface Geoscience & Engineering, Chiang Mai, Thailand, 2–5 November 2020. [Google Scholar]
- Sasaki, Y. Resolution of Resistivity Tomography Inferred from Numerical Simulation1. Geophys. Prospect. 2006, 40, 453–463. [Google Scholar] [CrossRef]
- Dahlin, T.; Loke, M.H. Resolution of 2D Wenner resistivity imaging as assessed by numerical modelling. J. Appl. Geophys. 1998, 38, 237–249. [Google Scholar] [CrossRef]
- El-Raouf, A.A.; Iqbal, I.; Meister, J.; Abdelrahman, K.; Alzahrani, H.; Badran, O.M. Earthflow reactivation assessment by multichannel analysis of surface waves and electrical resistivity tomography: A case study. Open Geosci. 2021, 13, 1328–1344. [Google Scholar] [CrossRef]
- Meng, F.; Zhang, G.; Qi, Y.; Zhou, Y.; Zhao, X.; Ge, K. Application of combined electrical resistivity tomography and seismic reflection method to explore hidden active faults in Pingwu, Sichuan, China. Open Geosci. 2020, 12, 174–189. [Google Scholar] [CrossRef]
Disclaimer/Publisher’s Note: The statements, opinions and data contained in all publications are solely those of the individual author(s) and contributor(s) and not of MDPI and/or the editor(s). MDPI and/or the editor(s) disclaim responsibility for any injury to people or property resulting from any ideas, methods, instructions or products referred to in the content. |
© 2024 by the authors. Licensee MDPI, Basel, Switzerland. This article is an open access article distributed under the terms and conditions of the Creative Commons Attribution (CC BY) license (https://creativecommons.org/licenses/by/4.0/).