Article

Multi-Approaches for Flash Flooding Hazard Assessment of Rabigh Area, Makkah Province, Saudi Arabia: Insights from Geospatial Analysis

Department of Civil Engineering, College of Engineering, King Saud University, P.O. Box 800, Riyadh 11421, Saudi Arabia
*
Author to whom correspondence should be addressed.
Water 2024, 16(20), 2962; https://doi.org/10.3390/w16202962
Submission received: 19 September 2024 / Revised: 14 October 2024 / Accepted: 15 October 2024 / Published: 17 October 2024
(This article belongs to the Special Issue Risks of Hydrometeorological Extremes)

Abstract

:
Flash flood hazard assessment is a critical component of disaster risk management, particularly in regions vulnerable to extreme rainfall and climatic events. This study focuses on evaluating the flash flood susceptibility of the Rabigh area, located along the Red Sea coast in Makkah province, Saudi Arabia. Using advanced GIS tools and a spatial multi-criteria analysis approach, the research integrates a variety of datasets, including remotely sensed satellite data, the SRTM Digital Elevation Model (DEM), and topographic indices. The main goal was to produce detailed flood susceptibility maps based on the morphometric characteristics of the region’s drainage basins. These basins were delineated and assessed for their flood vulnerability using three distinct modeling techniques, each highlighting different aspects of flood behavior. The results show that the northern basin (Dulaidila) and the central basins (Rabigh, Algud, and Al Nuaibeaa) exhibit the highest flood risk, with significant susceptibility also observed in the southern basins (Ofoq and Saabar). Other basins in the region display moderate susceptibility levels. A key aspect of this analysis was the overlay of the integrated flood susceptibility map with the Topographic Position Index (TPI), a crucial topographic indicator, which helped refine the understanding of flood-prone areas by linking basin morphometry with in-situ topographic features. This study’s comprehensive approach offers valuable insights that can be applied to other coastal regions where hydrological and climatic data are scarce, contributing to more effective flood risk mitigation and strategic planning.

1. Introduction

Natural hazards, such as seismic, landslide, and hydrological events, can lead to significant consequences, including increased mortality rates, extensive property damage, and disruptions to socioeconomic systems. These phenomena pose substantial risks that warrant careful study and management to mitigate their impacts. Interestingly, significant natural and economic resources can be found in coastal areas, but in many parts of the world, these resources are not being exploited to their full potential or are being used inefficiently for sustainable progress. Particularly, Saudi Arabia has started to pay more attention to the development of sustainable coastal regions. The NEOM city mega project is a famous example of the development strategies of the Saudi Kingdom. Additionally, humans have shared a deep romantic connection with coastal areas since the earliest days of civilization [1]. The frequency, severity, and effects of flash flood occurrences are increasing in coastal locations [1,2]. Several significant factors affect the intensity of coastal flooding, such as climate change, the growth of urban areas, the location of assets and infrastructure close to shorelines, and developing urbanization [3,4,5]. Flash flooding-related hazards are major global roadblocks to strategic development objectives, resulting in countless fatalities and enormous losses [6,7,8,9]. Floods could have a substantial financial impact on mitigation efforts due to their disruptive nature, which can affect the numerous facets of human lives. Nearly two-thirds of deaths from natural hazards are attributable to flash flood hazards. The author of refs. [10,11] discussed that flash floods cause damage to around 75 million people worldwide and kill over 20,000 people annually. Data collated in the last ten years have shown that their effects have increased from 76% in the 1960s to 83% at the present [10,11,12]. The authors of Ref. [1] stated that most flash floods are caused by convective or frontal storms coupled with intense, protracted rain. Moreover, he wrote about several interrelated factors, such as the characteristics of rainfall, water loss via evaporation and infiltration, the structure of drainage networks, the order and features of drainage systems, landscape relief, geomorphology, drainage system behavior, climatic changes, and both environmental and human activities, which affect intense flash floods [4].
An examination of the landscapes and their drainage systems along strategic regions provides significant insights into coastal regions’ development and present-day flash flood hazards and behaviors. Several studies in the fields and labs have been discussed to investigate the evolution of drainage systems over specific bounded basins. Additionally, applying and analyzing the effective geomorphological methods to assign the different characteristics of the drainage network across a variety of arid zones are major significant tasks all over the world [1,13,14,15]. Several manual and analog techniques were applied to the remotely sensed data and drainage system basin to analyze the most effective and indicative morphometric parameters providing ideal hydrological and geomorphological models. Consequently, the results derived from these models aid in assigning, calculating, and assessing the links between the basin’s morphometric features, the possibility of flash flood risks, and the impacts of them on the environment [1,6,8]. Flash flood hazards are predominantly and effectively assessed through drainage characterization [16,17,18,19,20]. Given the critical role that morphometric analysis plays in understanding fluvial systems, numerous studies conducted worldwide have employed traditional geomorphological techniques to establish and analyze the drainage networks within different basins [1,14,21,22,23]. The distinction between regions of high and low flash flood risks can be inferred and assessed through the detailed and quantitative studies of morphometric parameters including total basin area (A), total basin perimeter (P), entire basin length (Lb), average elevation (H), stream orders (So), total stream number (Ns), stream length (Ls), bifurcation ratio (Rb), form factor (F), stream frequency (Fs), infiltration number (If), drainage density (Dd), texture ratio (Rt), basin relief (Rb), ruggedness number (Rn), and mean elevation ratio (Rl). This is extremely significant since the morphometric variables for each basin may precisely depict the distribution of runoff, the peak of floods, the estimates of erosion, the yields of sediments, and the repercussions of flash floods [8,24,25]. Globally, several studies have been published showing how remote sensing and GIS techniques can be used to identify, map, and mitigate the possible hazards associated with flash floods, particularly in arid areas [1,8,26]. GIS is a fundamental tool that may be used with great accuracy and efficiency to assess, regulate, and integrate the variables that contribute to flash flood hazards [1,27,28]. The western coastal side of the Red Sea of Saudi Arabia, comprising the research area, is widely recognized for being prone to flooding and for experiencing frequent flash flooding that frequently results in major infrastructure damage, community displacement, and occasionally fatalities [22,29,30,31,32,33,34,35,36]. In the current study, the morphometric properties of the Rabigh region basins and their drainage network were assigned and analyzed using multiapproach analysis. The integration approach analysis applied in this study was conducted through processing the remotely sensed data using different GIS tools to define and assess the flash flood hazard. One of the most important tools for planning development in mountainous areas is the more precise flash flood threat map produced by the integrated technique. The authors of the present paper suggest that the combination of multiple effective and proven methods may be an advanced approach to enhancing and improving the results of the analysis and ensuring their accuracy. It could additionally fill any scientific gap that may have occurred in previous studies and investigate a new threat model for flash floods that integrates a multi-factor approach. Therefore, what has been applied in this work could be beneficial to investigate any arid mountainous environment. Investigating a unique flash flood risk model that incorporates a multi-factor approach is the main goal of the current work.
The main objectives of this paper are to: (a) investigate, evaluate, and model, the flash flood risk possibility of the study region utilizing the remotely sensed data and GIS technology; (b) examine the drainage system, the hydrographic basins’ morphometric characteristics, and their hydrological importance; (c) introduce a new model of applying three different effective methods for flash flooding hazard assessment which could be applied to investigate similar regions; (d) provide a new model by analyzing the flash flood data using a significant number of morphometric indices; and (e) investigate anomalies to present a new scheme for assessing flash flooding hazards. The prior goals have all been to improve our understanding of morphological behaviors when flash flooding signals are present.

2. Study Area

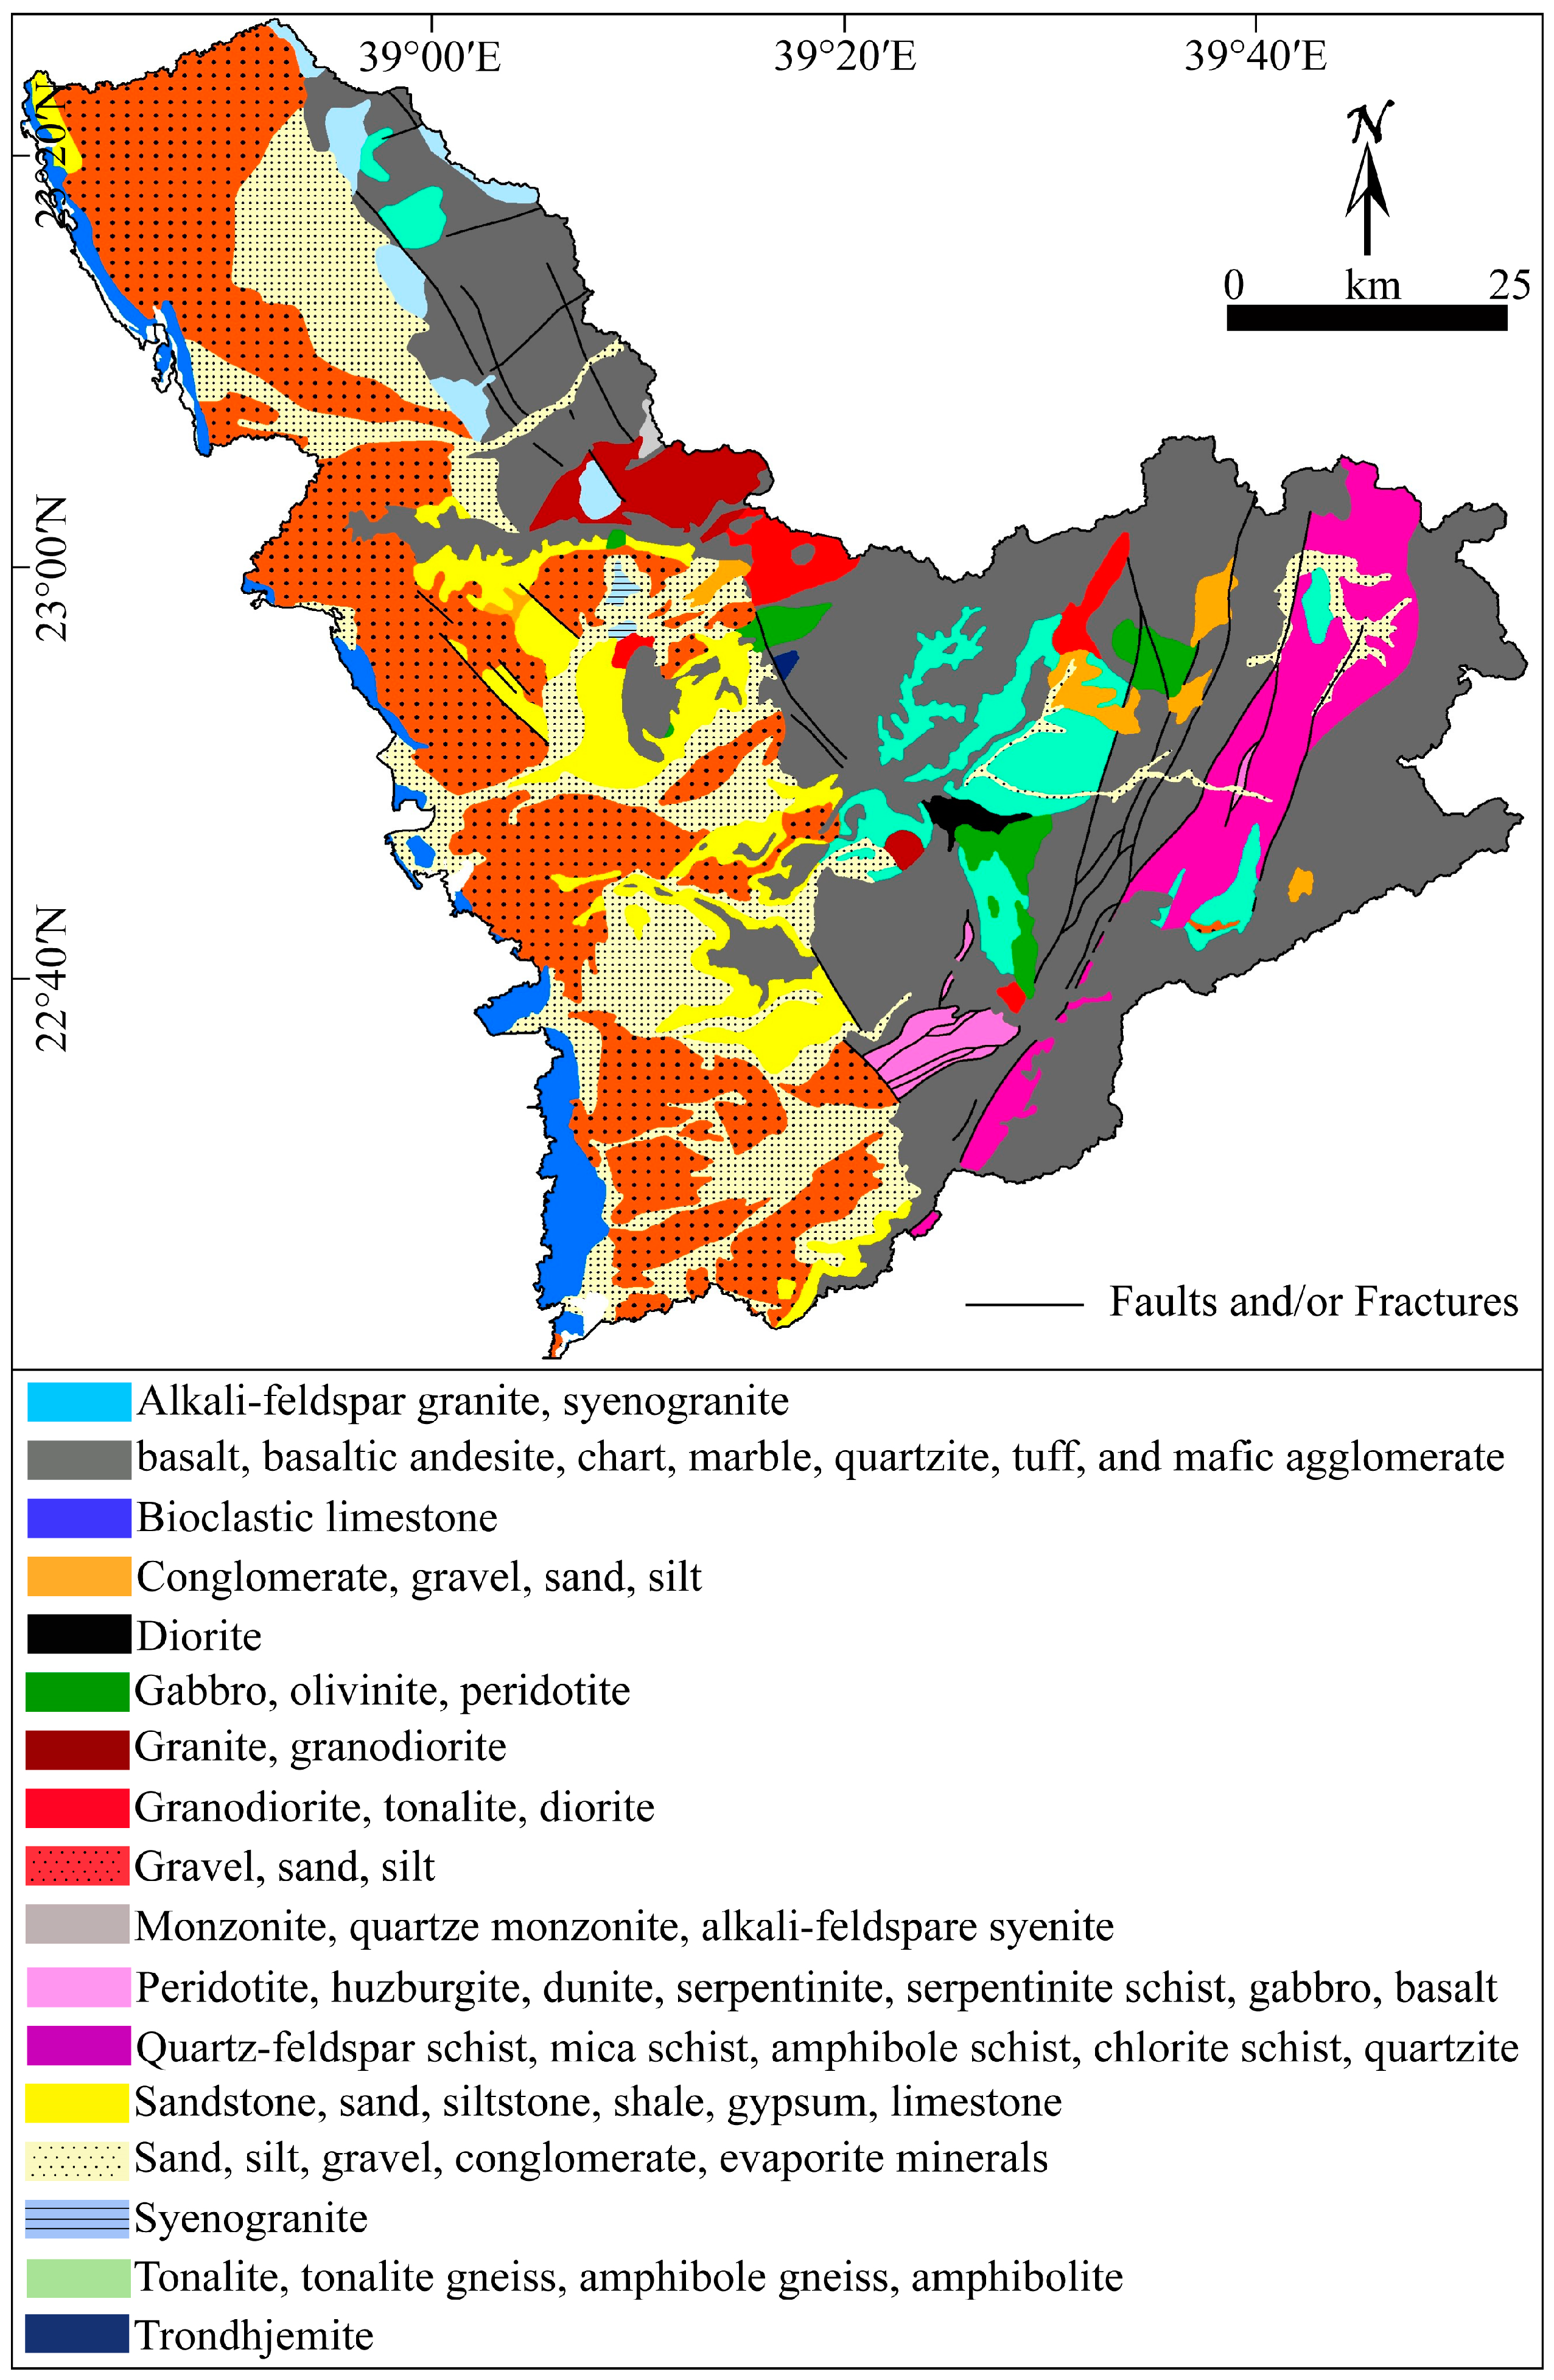
The Rabigh region is in Saudi Arabia, north of Jeddah City, on the eastern shore of the Red Sea (Figure 1). This area includes Rabigh City, the province of Makkah’s main commercial and industrial hub, which is home to numerous industrial enterprises and facilities (such as steel, petrochemical, electricity lines, and cement). Furthermore, it is situated between the urban areas of Jeddah and the industrial clusters of Tabuk province to the north. Consequently, the construction of large-scale projects requiring extensive infrastructure and additional environmental studies is attractive to the Saudi government and planners. The research region is located inside Makkah province’s borders, located at latitudes 22°45′ N and 23° N along the eastern Red Sea coastal plain (Figure 1a,b). Rabigh region occupies over 23 km2 and is located far north of Jeddah City, at 209.21 km away (Figure 1). Geologically, the study area coastal plain is occupied by quaternary deposits of bioclastic limestone, which have an average width of around 30 km (Figure 2). Numerous rock units, such as alkali feldspar, basalt, chert, gabbro, granodiorite, gravel, sandstone, diorite, amphibolite, syenogranite, sand, etc., make up the geological framework of the investigated region. About 40% of the study region is made up of the unit, which is mostly in the eastern portion and contains basalt, basaltic andesite, chert, marble, quartzite, tuff, and mafic agglomerate. This unit was fractured by two primary sets of faults and/or fractures that presented NE-SW and NW-SE tendencies. Along the entire western strip of the study zone, there is a distribution of gravel with a sand and silt unit (Figure 2).
In the current study, Figure 2 states that there were some structural interactions noted between the various lithological units. For instance, a NW-SE faulting and/or fracturing trend comes into contact with sandstone, silt, siltstone, shale, gypsum, and limestone units from one side with gravel, sand, and silt units from the other side (Figure 2). The same trending contact was noted at the southern boundary of the study zone between the following units: (1) the basaltic main unit and the sandstone, silt, shale, gypsum, and limestone unit; and (2) the peridotite, harzburgite, dunite, serpentinite, gabbro, and basalt units and the gravel, sand, and silt unit. See Figure 2 for further information regarding the research area geological framework.
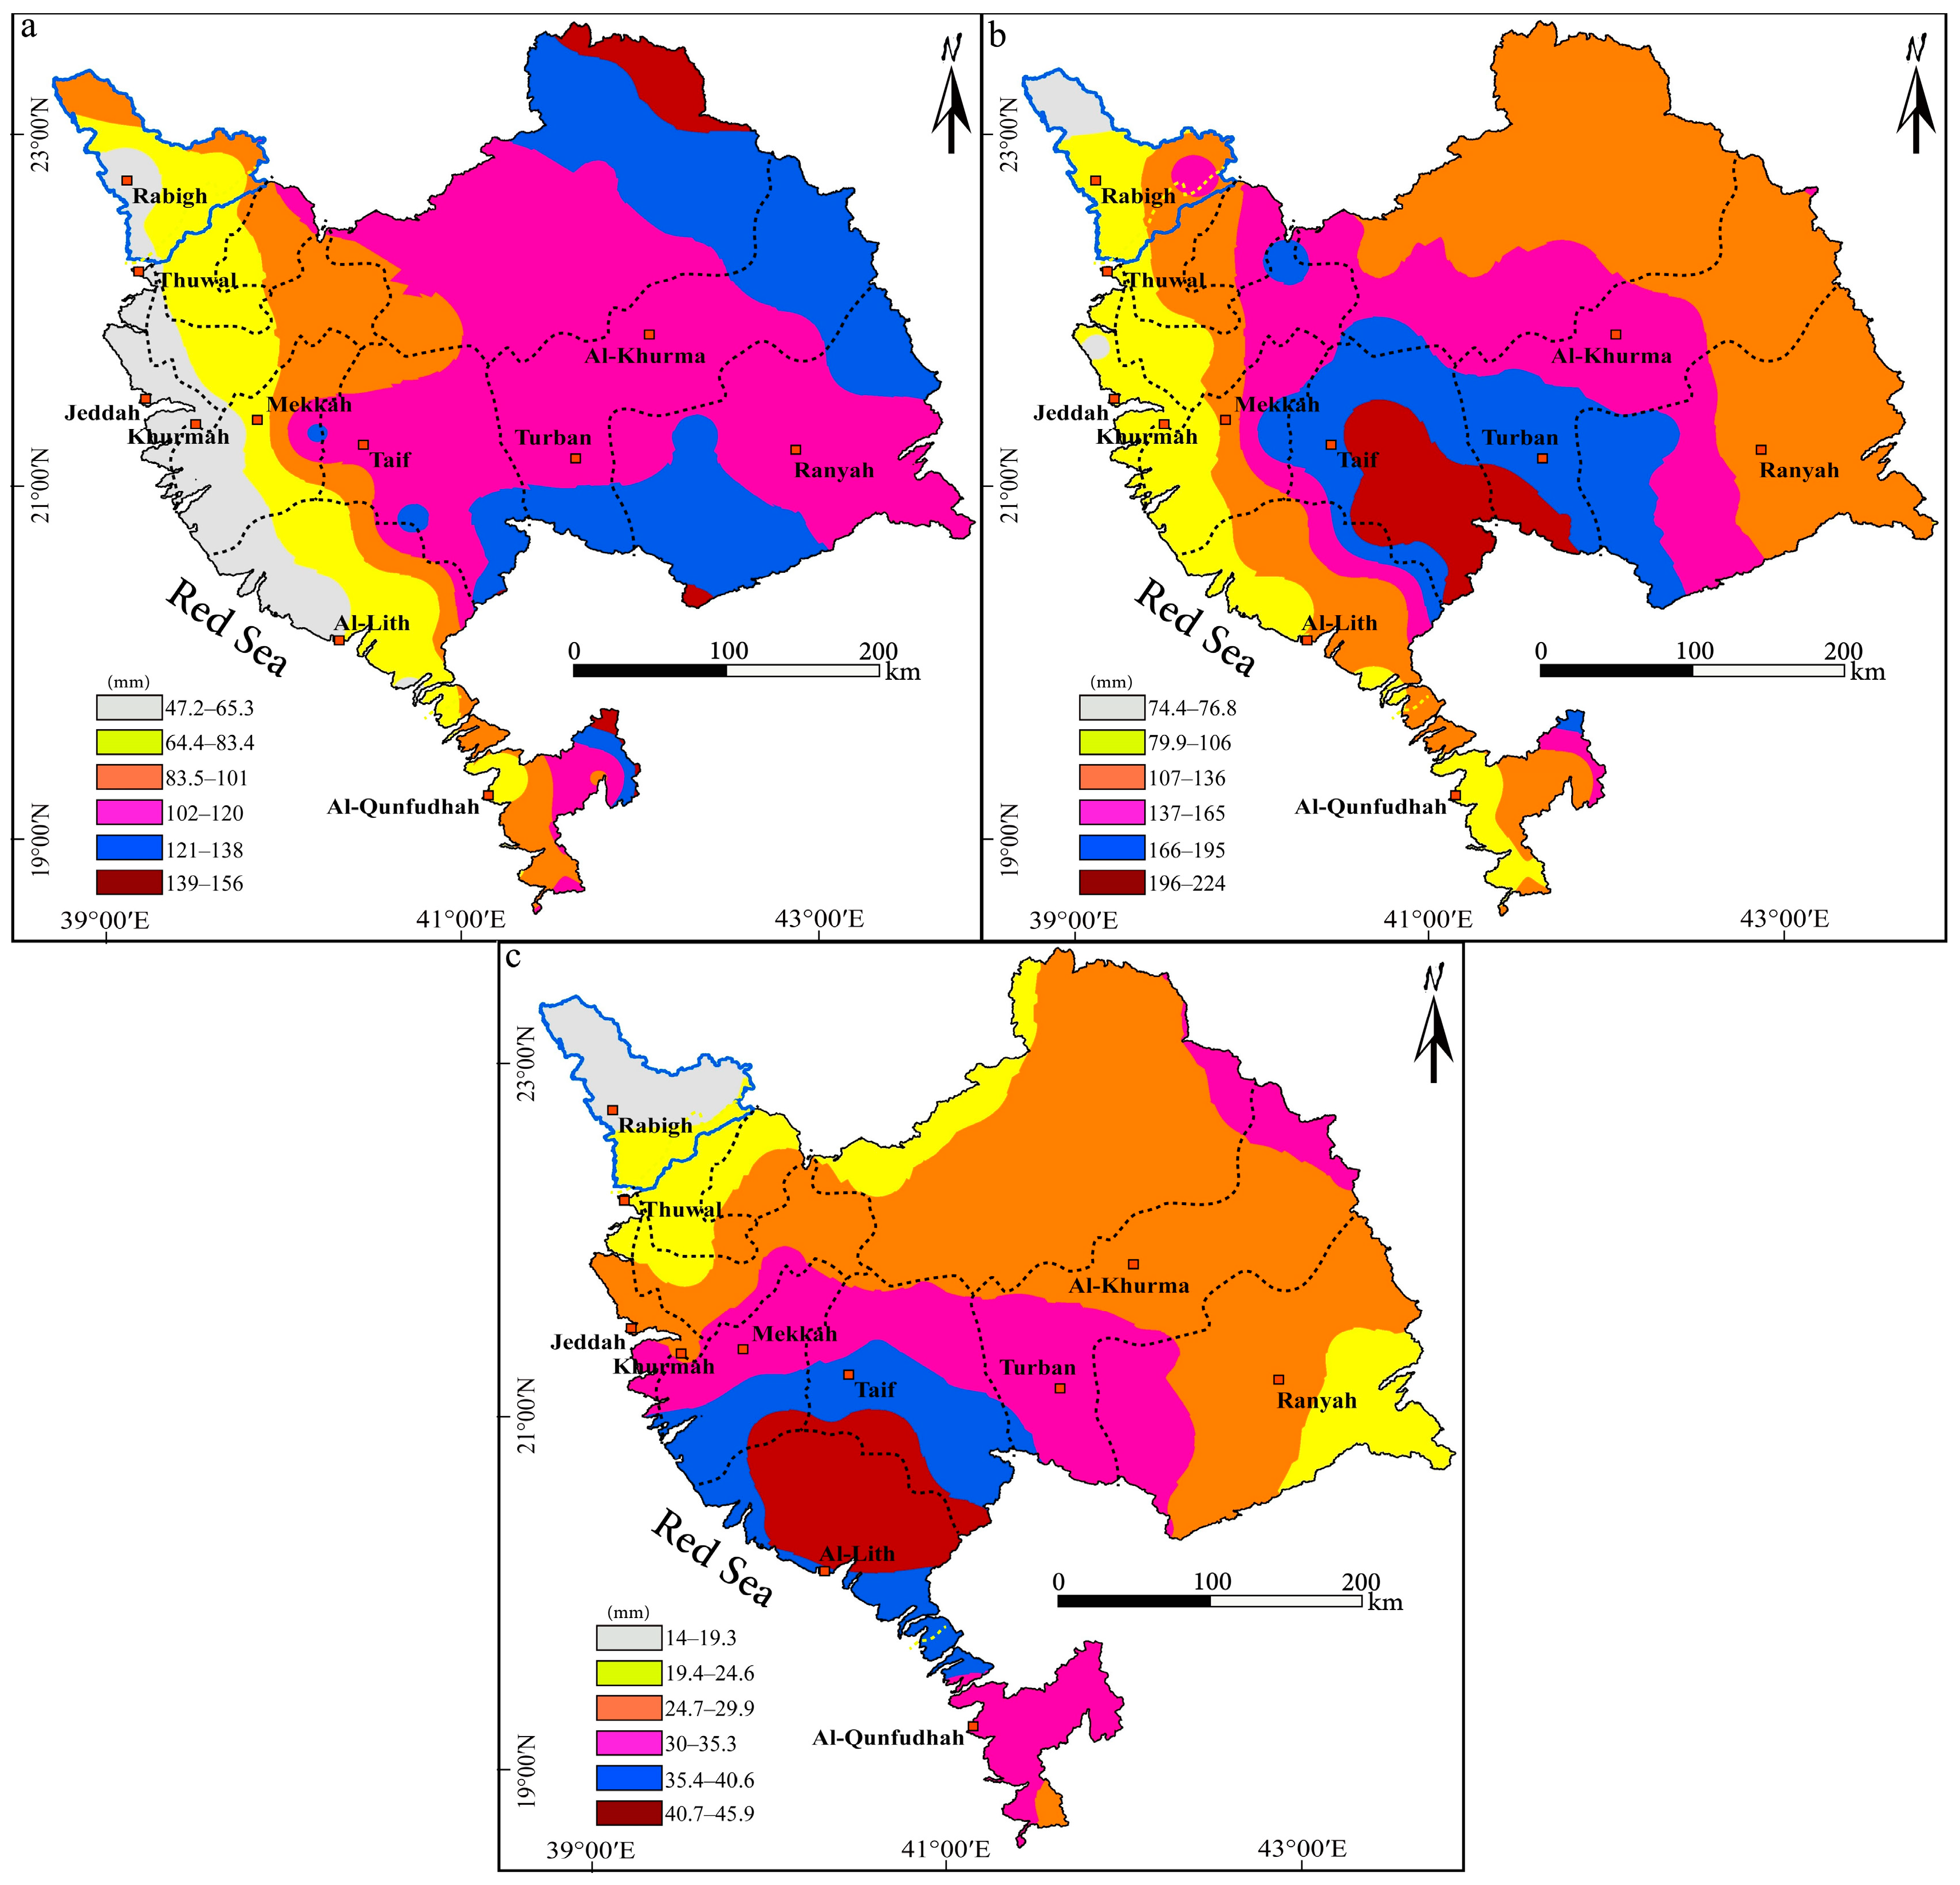
The hot, dry summers and warm, dry winters of Mekkah province are like those of coastal desert regions [37]. The maximum temperature recorded in the summer is 44 °C, while the lowest observed temperature is 17.5 °C. Figure 3 displays the province of Mekkah’s average annual rainfall. The data displayed in these maps of Figure 3 were obtained from https://crudata.uea.ac.uk/cru/data/hrg/ (accessed on 20 April 2024) and span the years 2001 through 2023. The highest and lowest mean yearly rainfall quantities that were measured during these times were 156 and 47.2 mm, 224 and 74.4 mm, and 45.9 and 14 mm for the years 2001–2010; 2011–2020; and 2021–2023, respectively (Figure 3a–c). For the study of the Rabigh area, the previous year zones provide mean annual rainfall between 47.2 and 101 mm; 74.4 and 165 mm; and 14 and 24.6 mm, respectively.
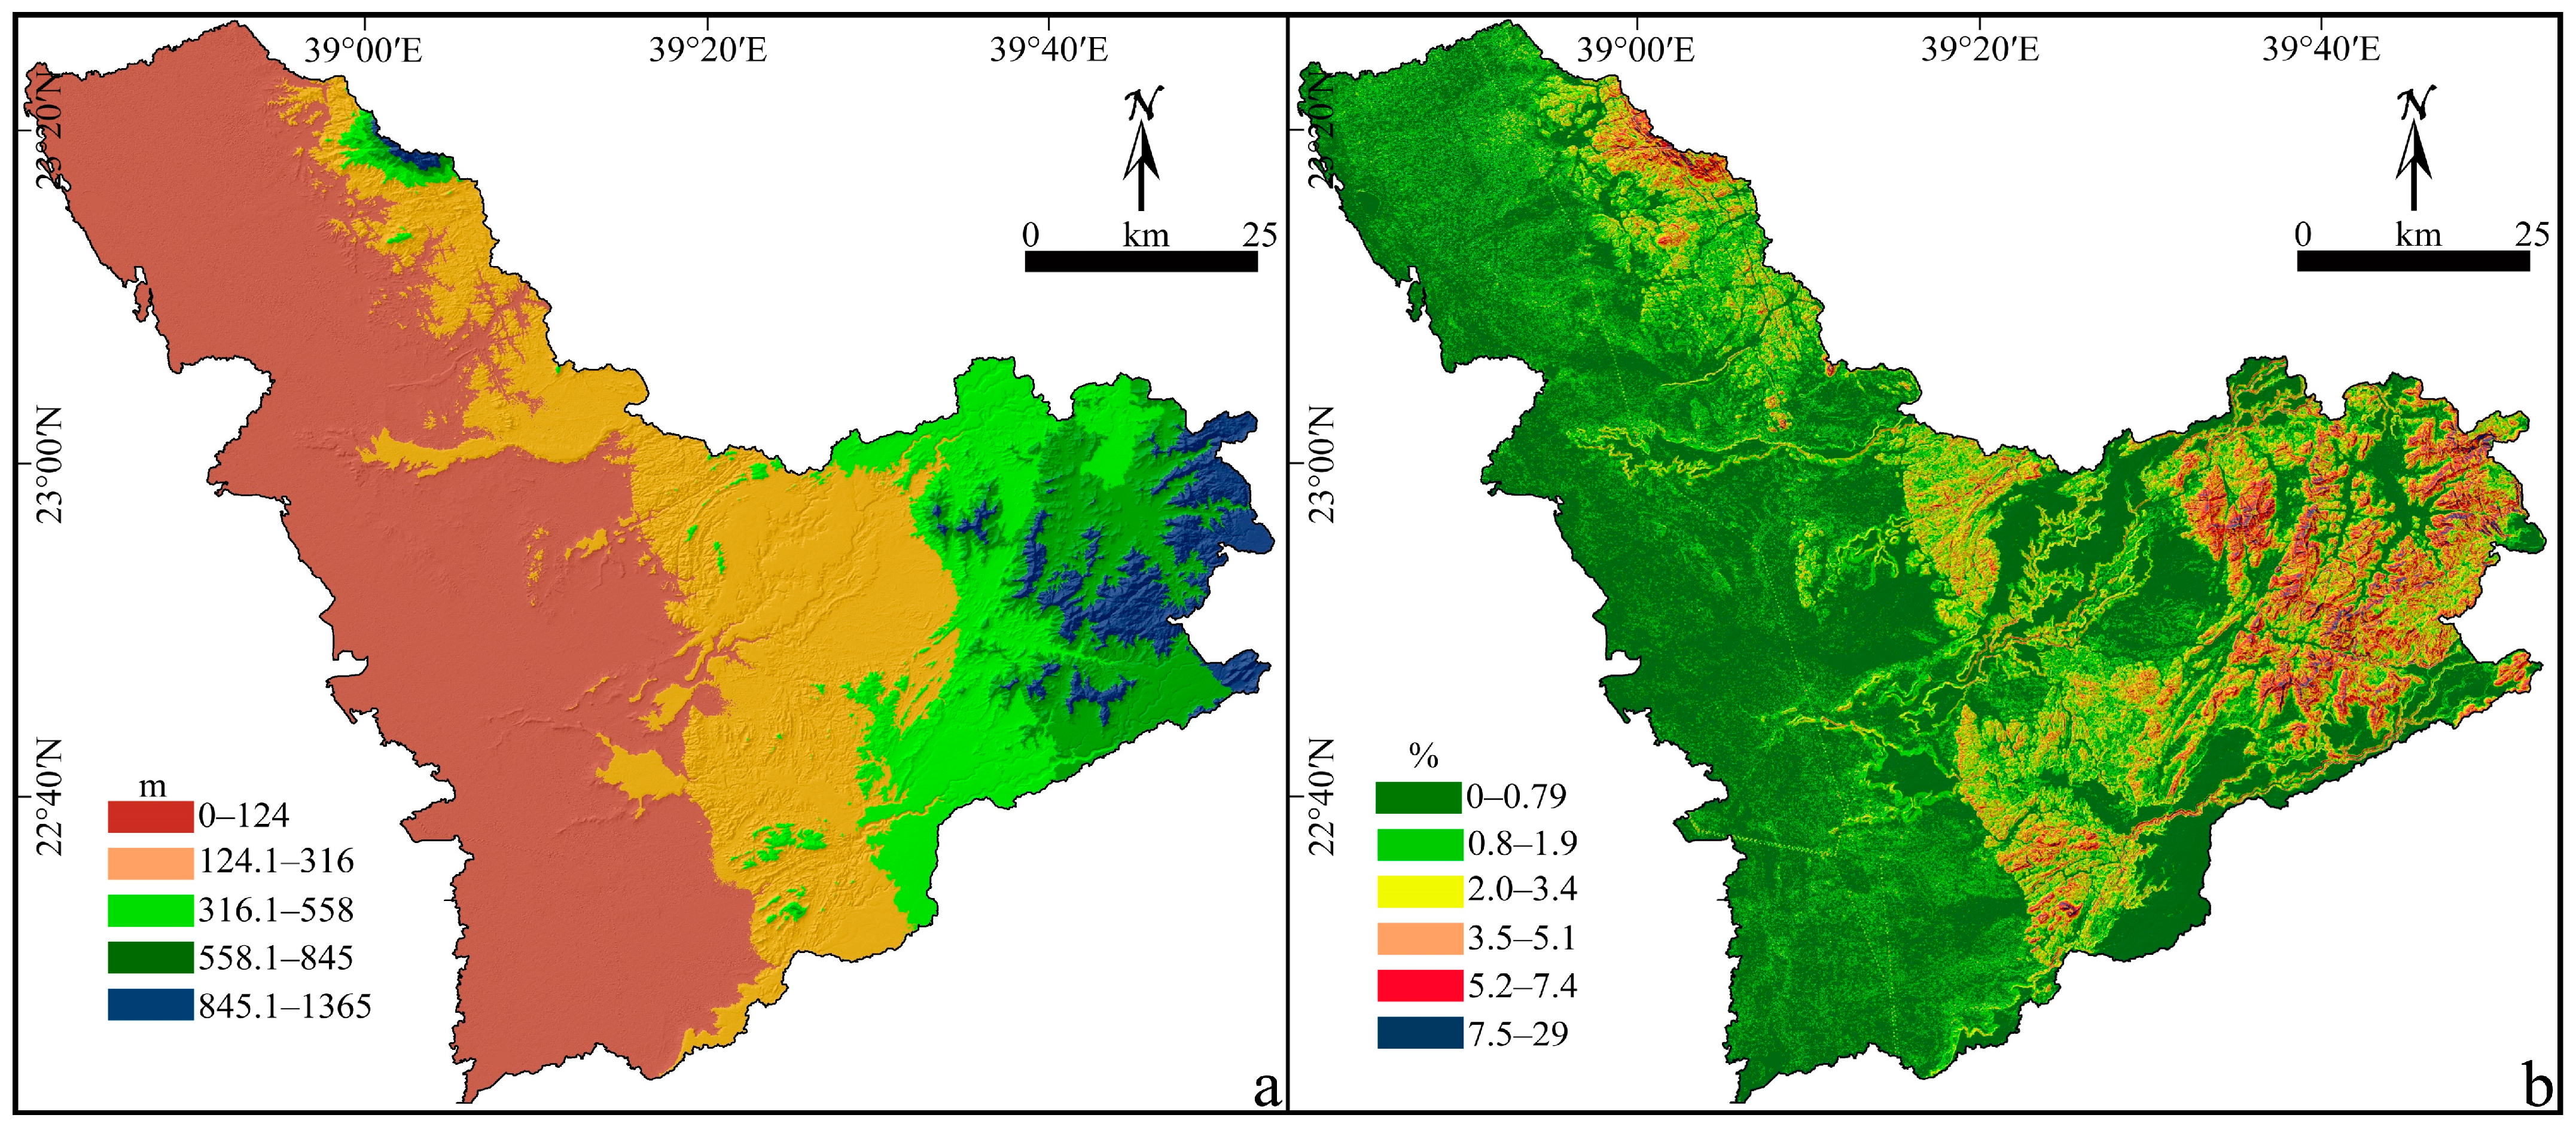
Due to its morphological features, the topography of the research area fluctuates, as indicated by the area’s relief signatures, which are characterized by rapid changes. The area exhibits lateral differentiation in elevations from east to west. The elevations range from 0 along the coastal line to 1365 m at the westernmost boundary of the study area (Figure 4a). The slope framework yields percentage values ranging from 0 to 29, with the western, southern, and northwestern regions exhibiting the highest levels, respectively (Figure 4b).

3. Materials and Methods

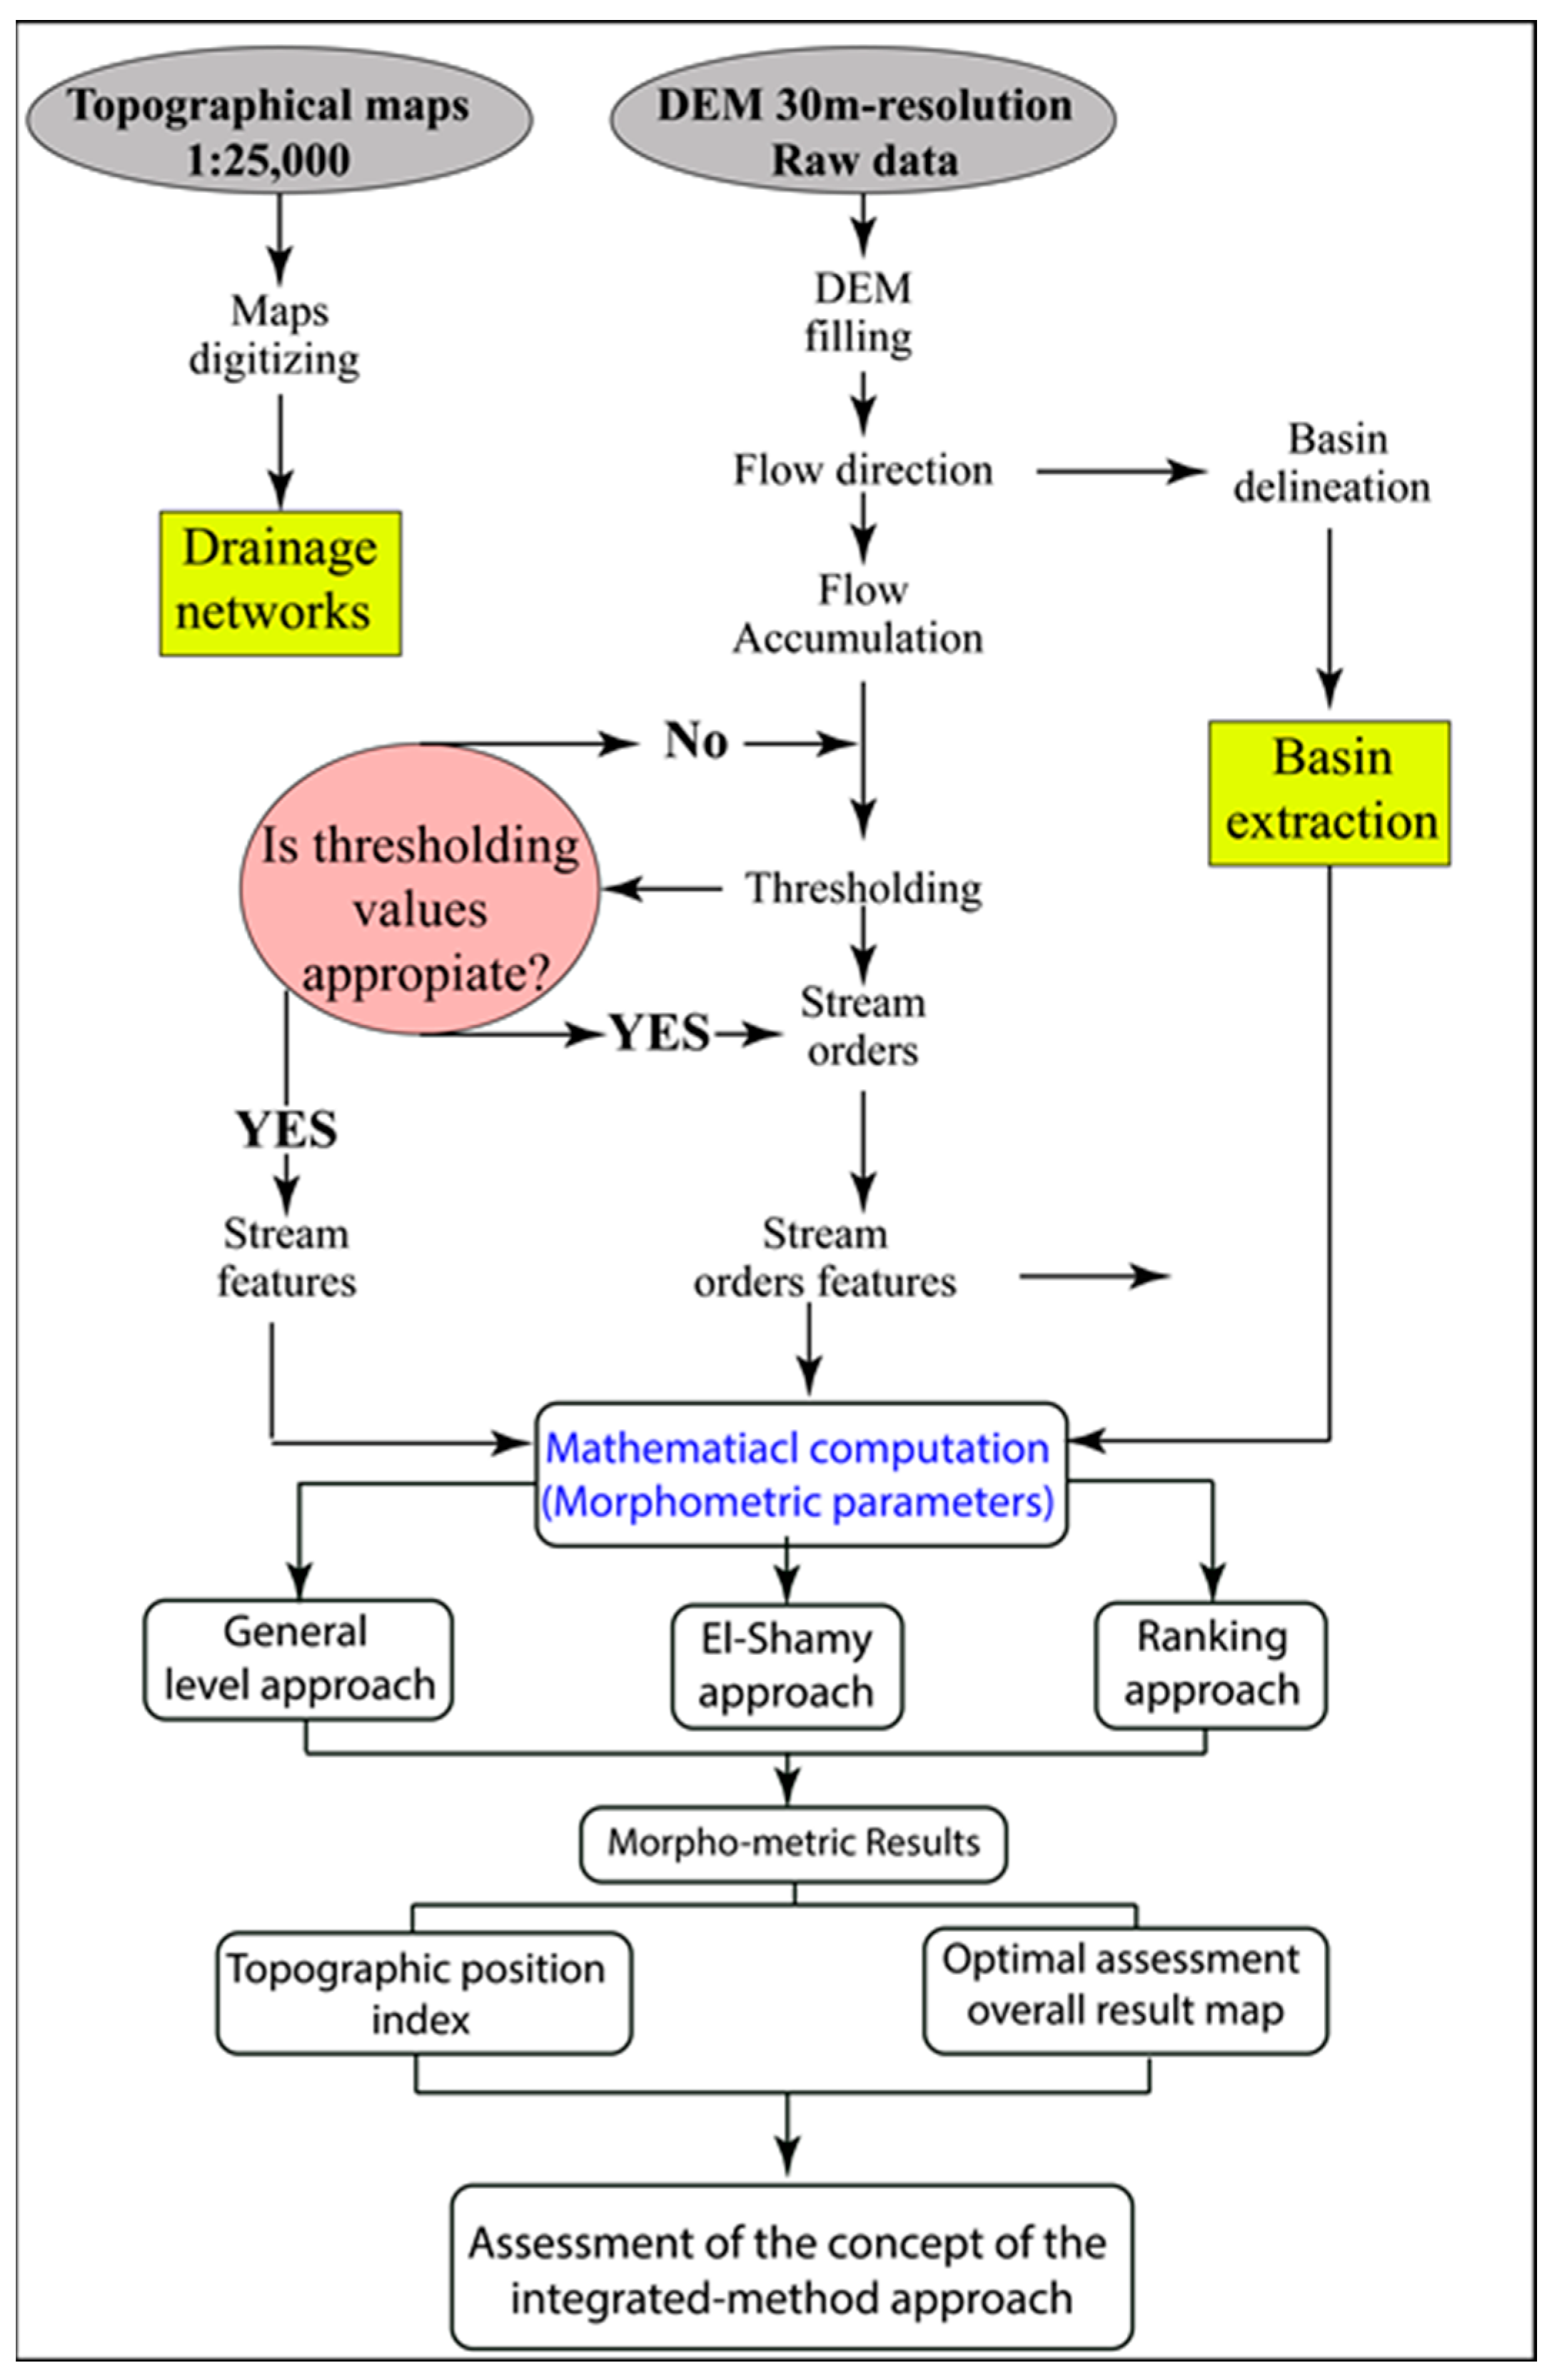
In the current study, several vector and raster data were gathered and processed. Data from the 30 m resolution Shuttle Radar Topographic Mission (SRTM) DEM were obtained from the Earth Explorer website (https://earthexplorer.usgs.gov/, accessed on 22 July 2024). Additionally, three distinct topographical sheets (maps) from the Saudi Geological Survey (https://ngdp.sgs.gov.sa/ngp/, accessed on 13 May 2024), covering the study area with codes GM-049C, GM-087C, and GM-084C, were also obtained. The topographic sheets had a scale of 1:25,000 but were devoid of several contours. Furthermore, stream networks were lacking and terminated in multiple places. The three topographic maps were obtained, converted into the TIFF format, and then individually georeferenced. During digitization, the legends on the toposheets acquired using this method may have caused matching errors. This issue was fixed by digitizing four unique polygon shapefiles that precisely matched the toposheet bounds. The georeferenced toposheets were then combined using ArcGIS’s 10.4 mosaic tool to create a single composite toposheet that encompassed the whole research region. The mosaiced toposheets have now been digitized to allow access to the stream networks inside the basins. Several different ArcGIS tools were run on the SRTM data to conduct relief analysis and define the topographical, geomorphological, and geological features of the study region. Therefore, relief analyses of the study region’s elevations, aspect, and slope were carried out to identify the basins influencing the studied region’s infrastructure efficiency, particularly in the ten basins. They were delineated from 1–10 as follows (basin1, Dulaidila); (basin 2, Ri Harshah); (basin 3, Rabigh); (basin 4, Algud); (basin 5, Al Nuaibeaa); (basin 6, Haqqaq); (basin 7, Hajar); (basin 8, Al Jehfa); (basin 9, Ofoq); and (basin 10, Saabar) (Figure 5). Delineating the basins and defining the stream systems using the developed Arc GIS tools are the core of this study to investigate, assess, and control flash flood events [1,8,38] (Figure 6).
Ranking and classifying the parts according to the flash flood severity in the investigated region due to the analysis of the morphometric parameters can be completed in the following steps.
  • First, use ArcGIS to delineate the area into basins, which will make it easier to identify and define locations with varying levels of flash flood severity.
  • Define the morphometric parameters for each single basin, as illustrated in Figure 6, to evaluate each basin’s vulnerability to flash floods. For morphometric analysis, four elements were taken into consideration: fundamental (basic geometries), aerial, relief, and linear characteristics. Table 1 lists the morphometric parameters and their formulae.
  • Apply the morphometric results to the three different methods (general level approach, El-Shamy approach, and ranging approach).
  • Assign a model for each approach.
  • Combine these three models and produce one overall map.
  • Define the basins for flash flood risk assessment based on the overall map in addition to an effective topographic index.

3.1. Flash Flooding Approaches

3.1.1. Morphometric Analysis

In similar research, it has long been known that the quantitative values of the morphometric indices can be used to investigate the basic indicators of flood hazard risks and comprehend the origin and makeup of the drainage systems of basins [10,13,47]. Numerous researchers have tested the role of applying morphometric characteristics to drainage basin systems. It aids in comprehending the characteristics, frequency, and severity of flood events due to the important influence that morphometric features have on the diverse hydrological consequences of the basins [8,43,47]. Several approaches were applied successfully, depending on the results derived from the morphometric analysis. Each method was effective enough to investigate the flash flood risks in different locations. For example, the authors of ref. [48] used the El-Shamy approach to establish a useful classification system for the major wadis along Egypt’s southeast Red Sea coast based on hydrology and morphology. Additionally, they offered a model that might represent the possibility for flash floods and groundwater aquifers. The author of ref. [49] aimed to understand the Wadi Asyuti basins’ geometric and geological features based on an examination of the morphometric parameters utilizing data from remote sensing and GIS techniques. The authors of ref. [50] applied the weighted approach and information to classify the mountainous area of Wanli District in China into four levels of probability and proneness of geological hazards. Additionally, more than one approach were combined using geospatial techniques to investigate flash flood behaviors as well. The concept of an integrated technique’s approach is the key topic covered in the processing part. The current study used a quantitative comparison analysis between the watershed level, El-Shamy, and ranking approaches to determine the compatibility levels of the outcomes using three distinct quantitative methodologies. The last stage of processing sought to combine the flood susceptibility map’s final integrated methodologies with a useful surface flow-affecting morphological indicator. The goal of this combination procedure was to assign the relative flood risk signals of the various basins and precisely categorize the various locations within the study basins that exhibit higher degrees of flash flood vulnerability. The core of this process is the adjustment of the data to the raster format using a similar projection (geographic coordinate systems; WGS 1984, in addition to projected coordinate systems; UTM 37 N zone).

3.1.2. General Level Approach

Using the first method in this study, we examined and analyzed the results obtained from fundamental geometries and morphometric indices to improve our knowledge about the variations in the relative flood risks caused by the various basin classes. For a significant examination, the computed values of the selected indices for each basin were then classified as flood susceptibilities of low, moderate, and high on an adjusted common level scale of 1–3. The strategy of this classification is explained as follows: (1) extract the morphometric results for every single basin, (2) arrange them in ascending order, (3) divide the numbers into three categories such that each category includes the numbers that are closest to each other and there is a wide range between the three categories, and (4) assign each category a level of the flash flood risks levels. Concerning the scale of range obtained from the index of each morphometric parameter (plus or minus the relation to the level of magnitude of the flash floods), each index of every basin has a new average value specified for it.

3.1.3. El-Shamy Approach

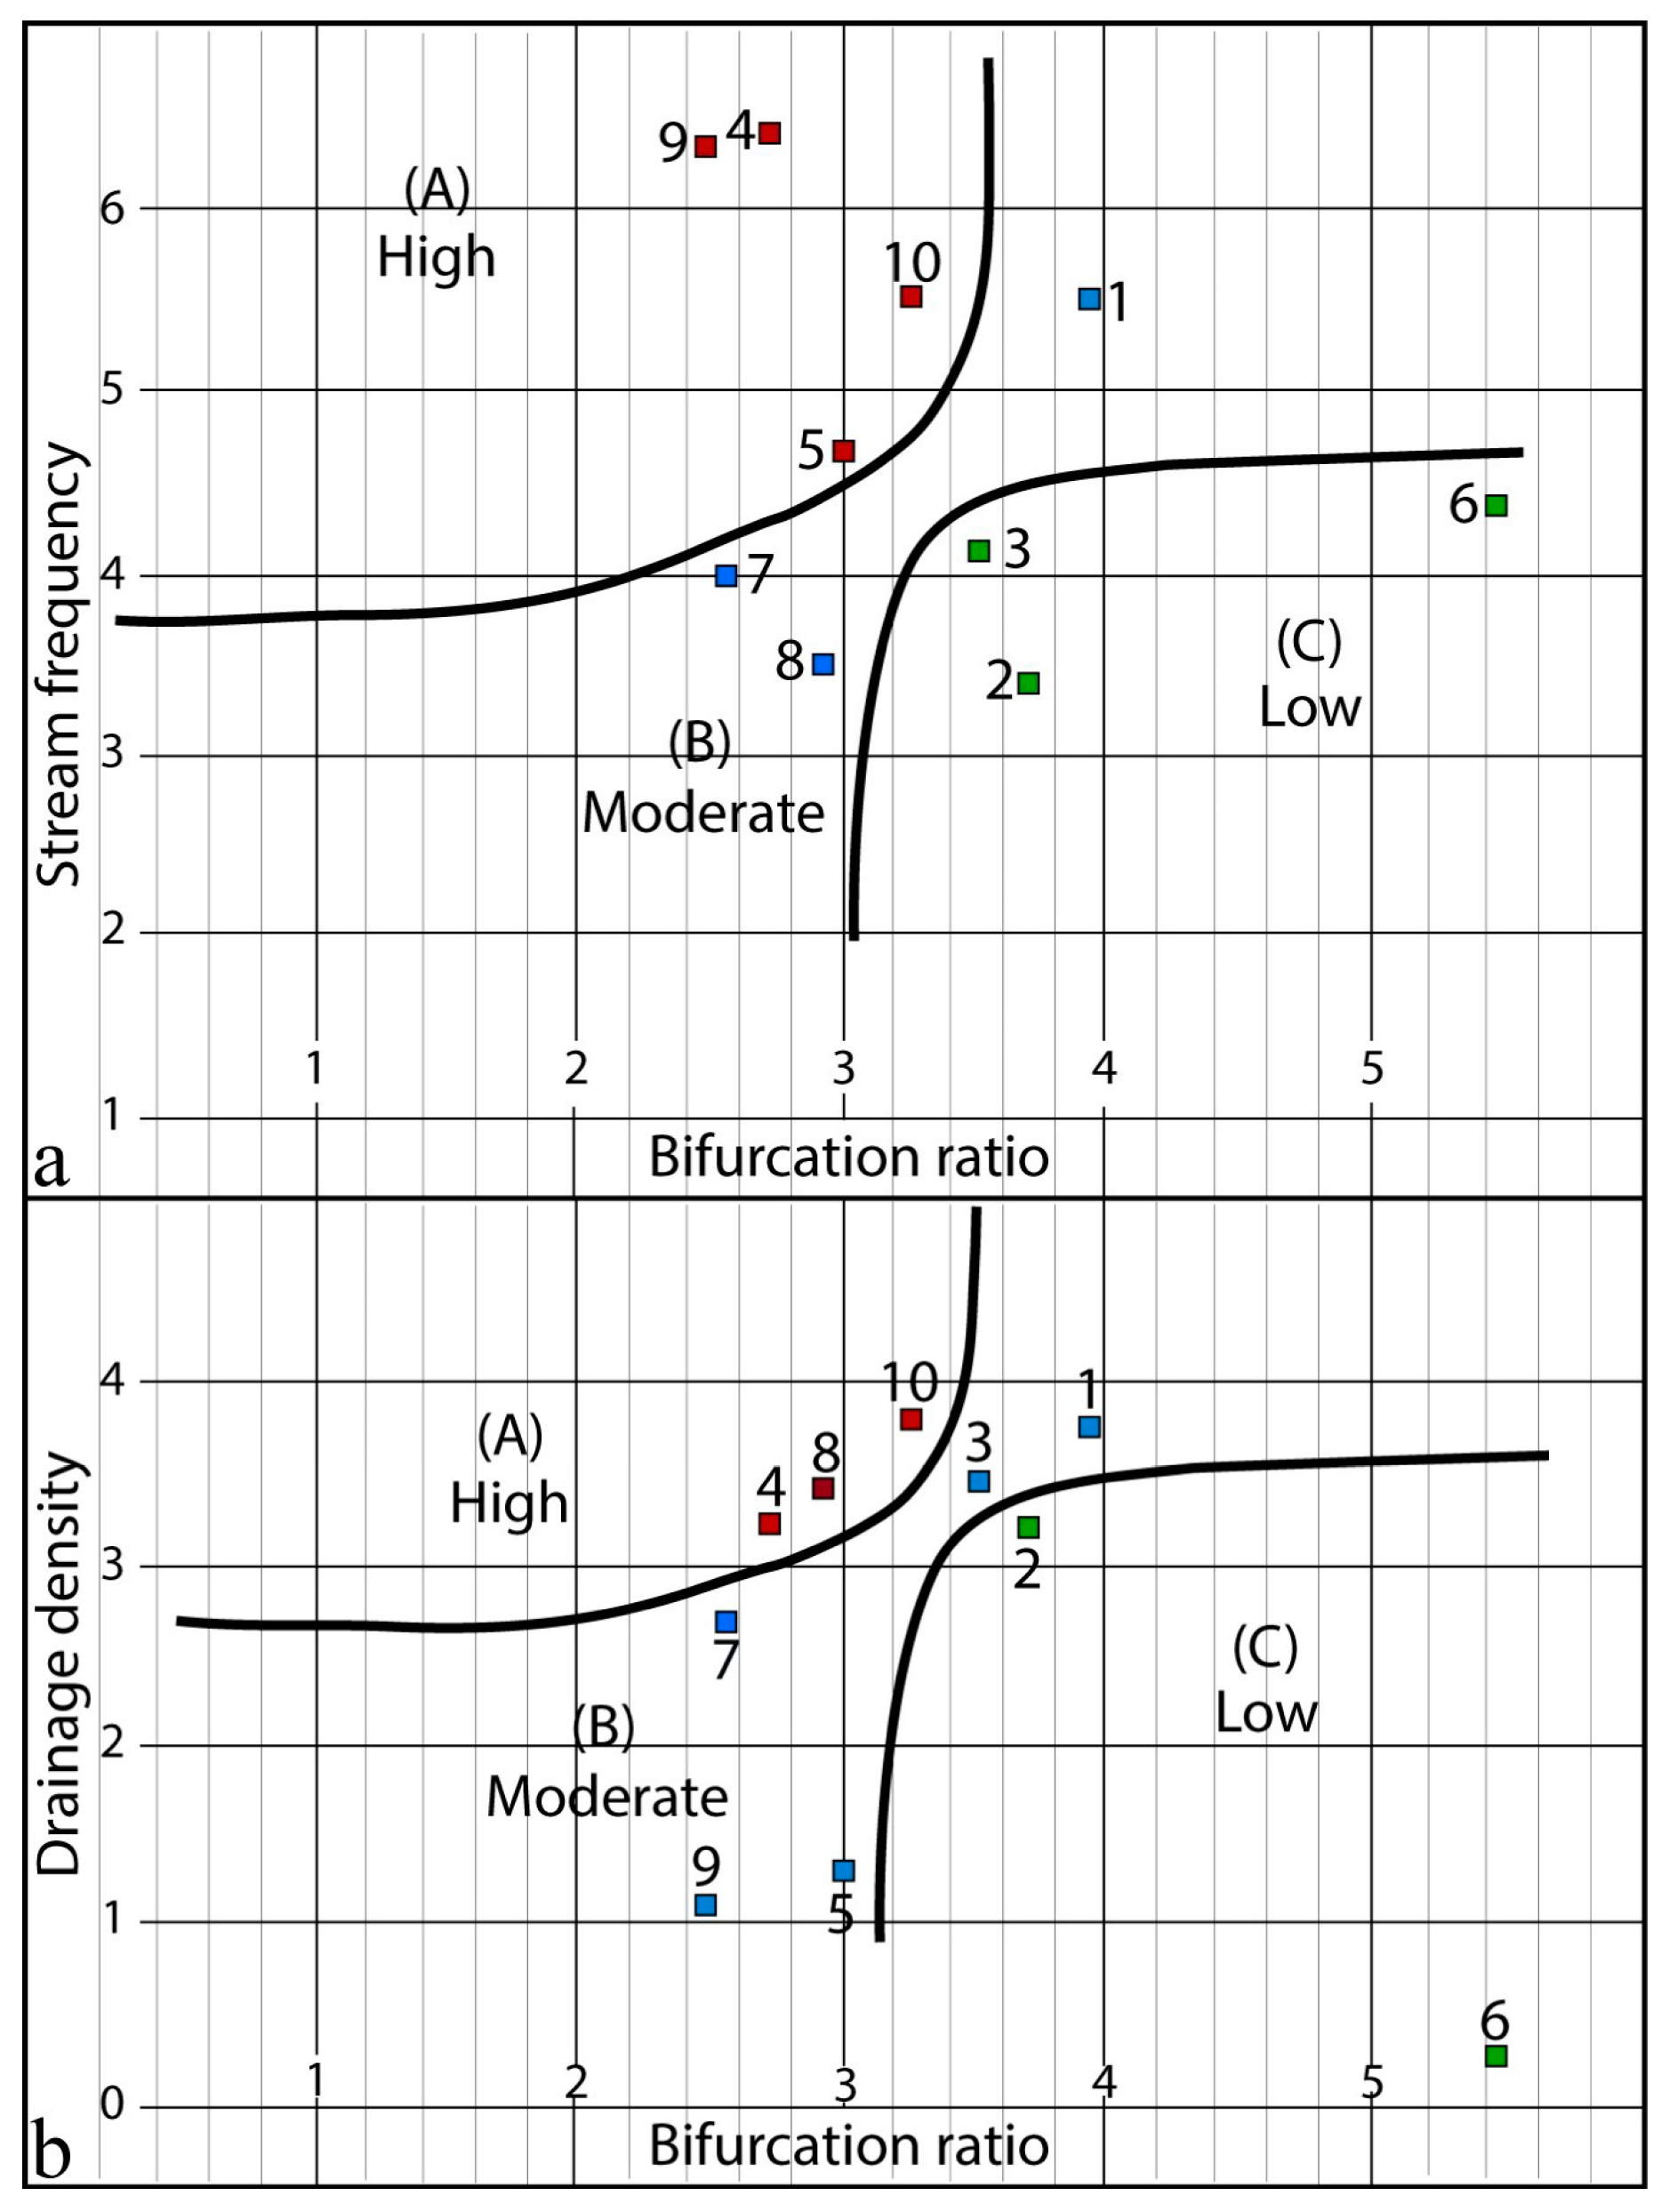
The scientific idea behind this approach is to use three effective morphometric indices including drainage density parameter, stream frequency parameter, and bifurcation ratio parameter. These three key indices offer three different classes of flood risk degrees (low class, moderate class, and high class). In this approach, the method established by the author of ref. [48] is used to assess the Rabigh area landscape flood hazard levels. This technique provides us with two diagrams to accurately gauge how risky each of the various landscapes is. It defines the relationships for each planned basin between the drainage density and stream frequency indices on one side and the bifurcation ratio index on the other side. Each diagram/chart displays three different zones: starting with zone 1, (A) covers basins with high groundwater recharge conditions and low flash flood vulnerability; in zone 2, (B) shows zones with high flash flood risks and low groundwater recharge signs; and in zone 3, (C) shows the intermediate groundwater recharge and flood protection levels. The zones of the El-Shamy approach are defined and modeled by the author of ref. [51]. In the present study, zone A in the F and Rb diagram was assigned values (F > 4 and Rb < 4), zone C was observed for values (F < 5 and Rb > 3), and zone B is recorded by values plotted between these two zones. Similarly, zones of the Dd against the Rb diagram are plotted in the same manner. A figure will be presented in the results and discussion section to clarify this explanation.

3.1.4. Ranked Approach

With reference to this approach, the authors of ref. [52] identified and created a useful technique for evaluating the flood risks of landscape basins [8]. The key analysis of the approach used is the six-level scaling of flood hazards. The study landscape levels are modified to correspond to all computed morphometrics for every basin. Levels 1, 2, 3, 4, 5, and 6 represent the current flood levels, which correspond to very low class, low class, moderate class, high class, very high class, and extreme class flood risks, respectively [8,52]. The ranked technique requires the development of a geometric connection by the author of ref. [53] to determine the real risk levels for a basin. Regarding the suggested indices that are provided, respectively, an inversely and a directly proportionate relationship, the following geometric relations were set.
Flood risk class = [4 × (X − Xm.) ÷ (Xx. − Xm.)] + 1
Flood risk class = [4 × (X − Xx.) ÷ (Xm. − Xx.)] + 1
where the parameters Xx. and Xm. are the maximum and minimum values of the proposed parameter through the proposed basins, and X indicates the values of the morphometric index for each individual basin. To give a uniform approach for the approaches employed in this study, the flash flood evaluation scale was reset and adjusted into three risk categories, giving number 1 (low level), number 2 (moderate level), and number 3 (high level). Therefore, the computations of this method were applied as direct and inverse, respectively, using the following modified geometric proportional relationship.
Flood risk class = [2 × (X − Xm.) ÷ Xx. − Xm.)] + 1
Flood risk class = [2 × (X − Xx.) ÷ Xm. − Xx.)] + 1

4. Results and Discussion

4.1. Analysis of the Morphometric Parameters

The basic morphometric indices were examined and extracted in this study. The calculated results of the morphometric parameter analysis, average computed values, topographic location analysis, and flood vulnerability levels are examined and described in the following sub-headings. The calculated values of the basins’ geometric parameters, such as their length, average elevation, perimeter, and total area, reveal that the Haqqaq basin has the largest area, while the Saabar basin has the highest extracted perimeter values. Additionally, the extracted geometries demonstrate that, for the Saabar basin, the southern side of the study landscape recorded the greatest basin length. In the current study, the Al Jehfa and Ri Harshah basins were found to have the lowest values for area and perimeter, measuring 142.93 km2 and 95.06 km, respectively. The Algud basin had the lowest recorded value for basin length of 19.89 km. Table 2 tabulates the geometries for each individual basin.

4.1.1. Stream Number (Ns)

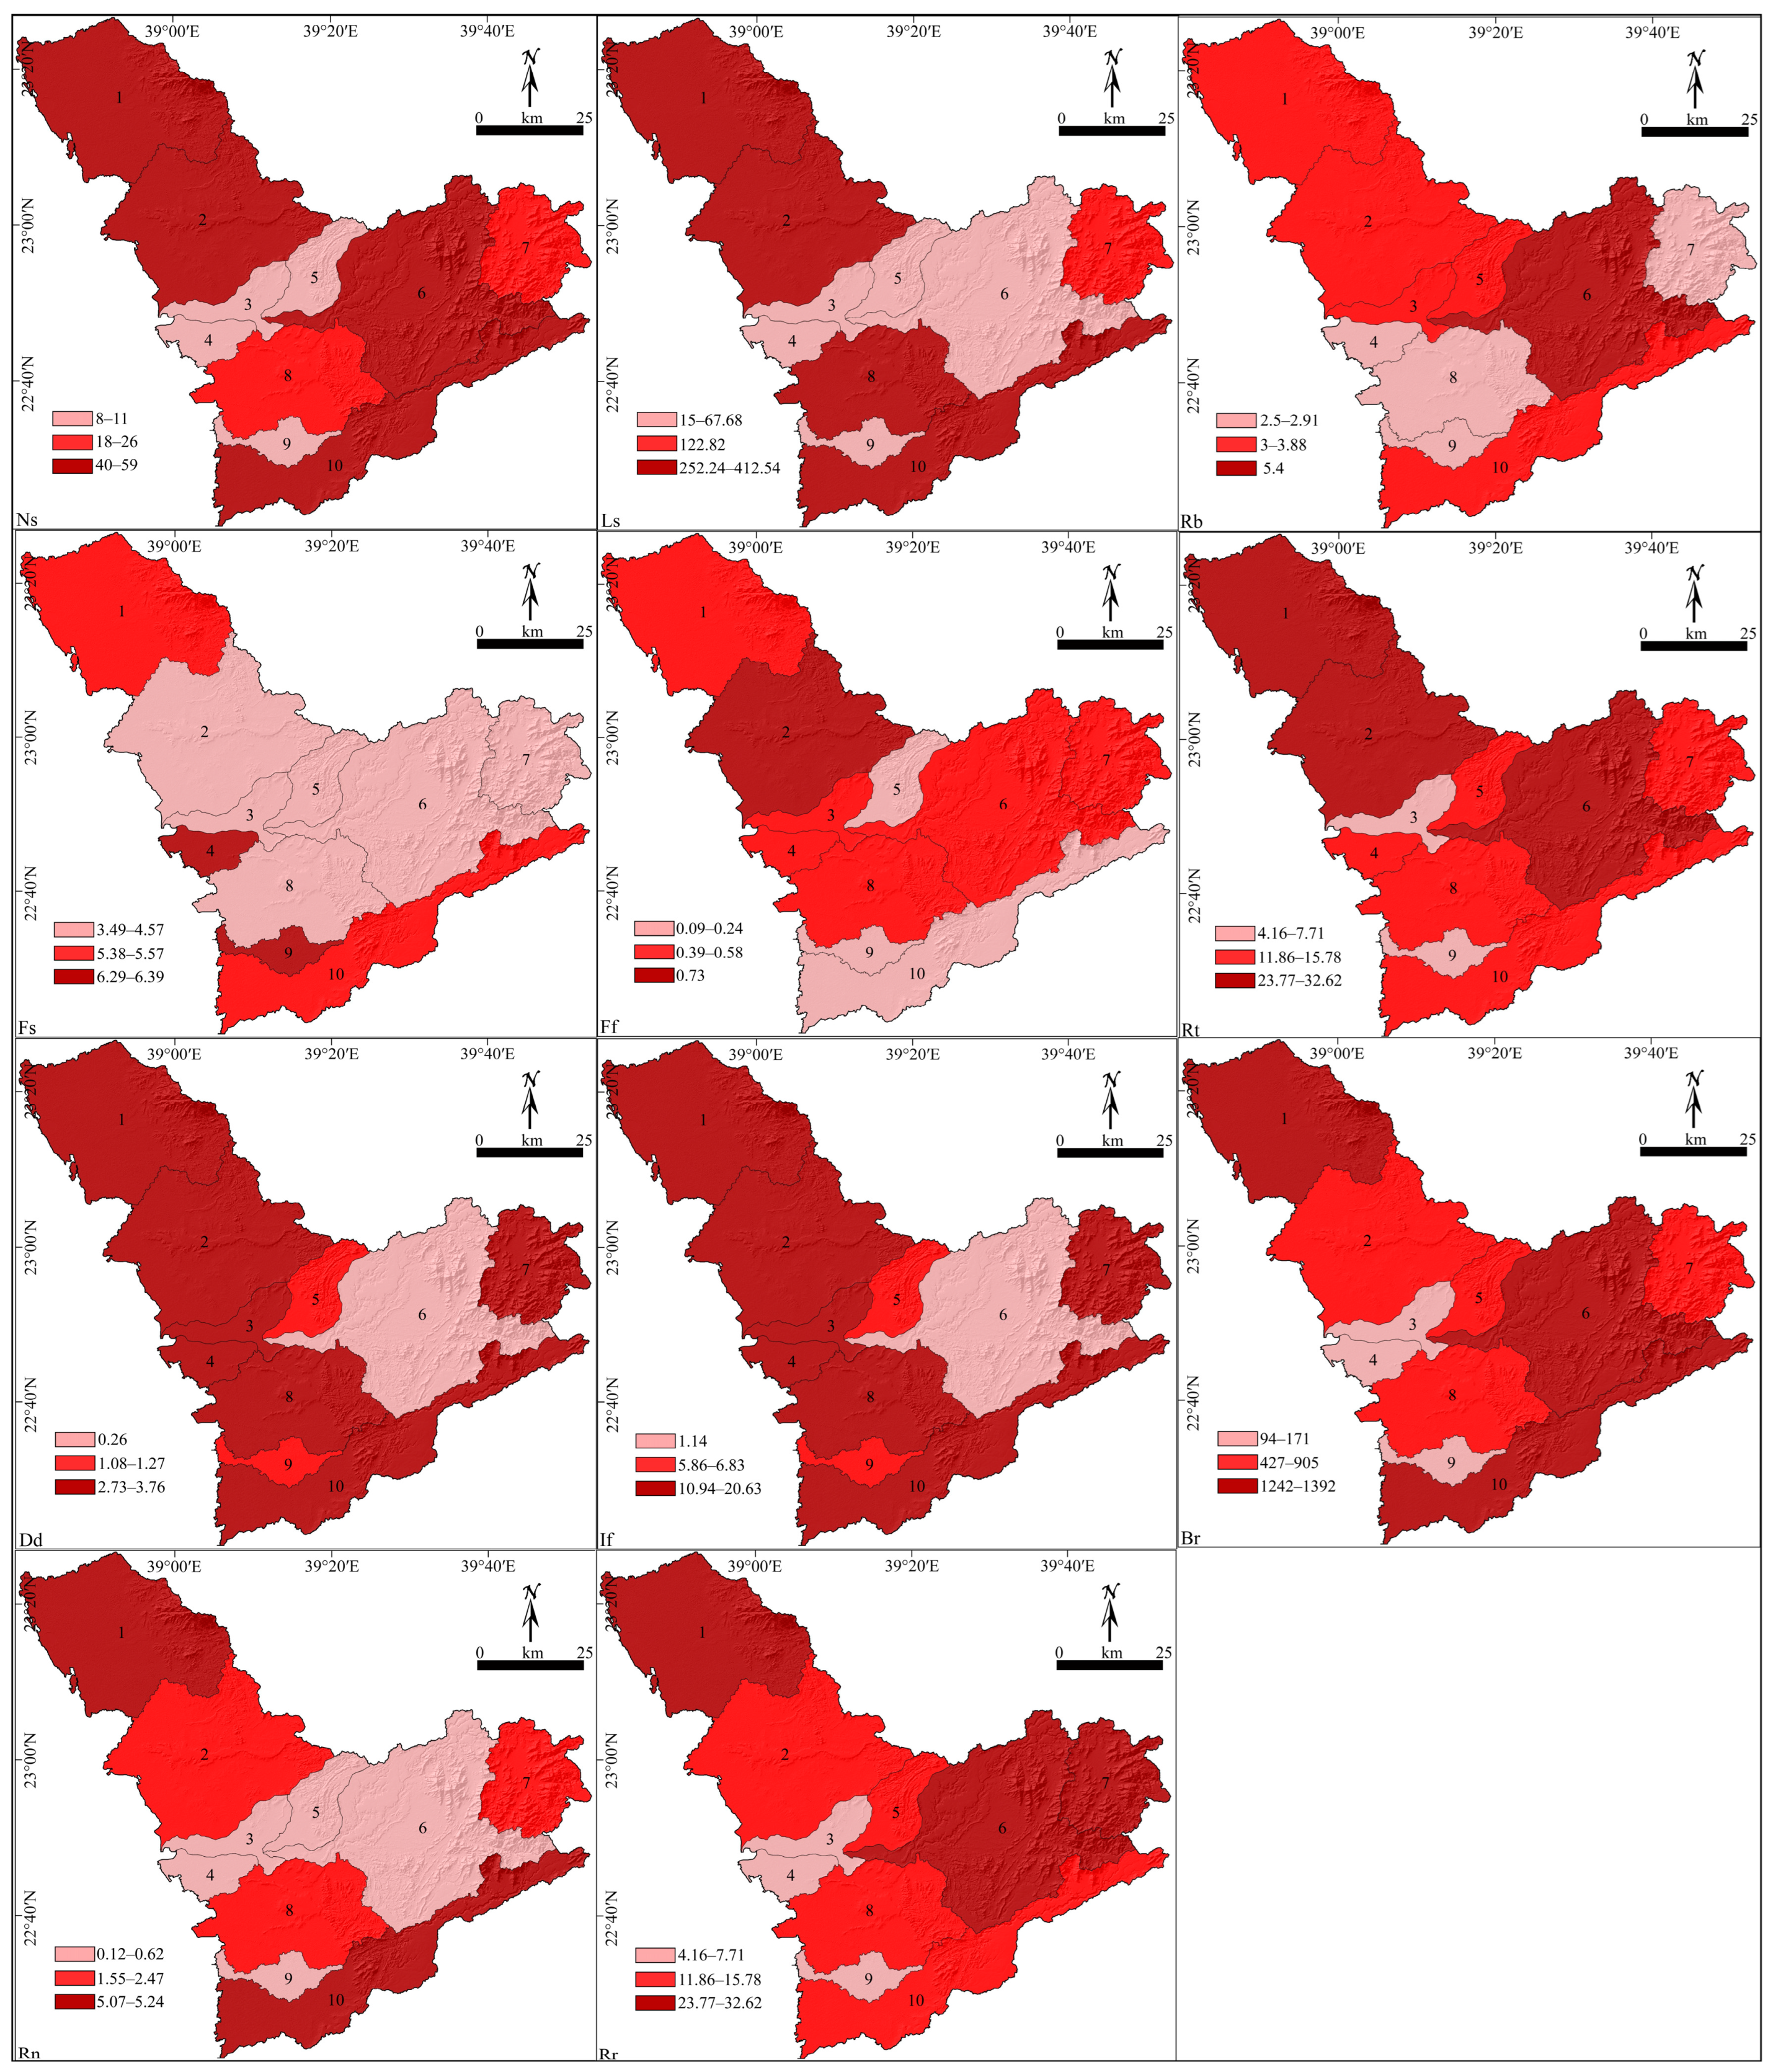
Generally, during periods of intense rainfall, basins with a large number of streams present suitable circumstances for higher runoff conditions and high peak flows [24,40]. Drainage basin 1 reflected the highest value according to the value of the stream number; however, drainage basin 3 had the lowest values, meaning that its runoff capacity is the least (Table 3).

4.1.2. Stream Order (Os)

The stream order (Os) index is one of the most important hydro-geomorphology indices for identifying and assessing the size of watershed water channels. It is used to examine the rivers and streams in a hierarchical sequence. According to the current study, the Dulaidila, Ri Harshah, Haqqaq, Al Jehfa, and Saabar basins were classified as fourth-order basins, whereas the Rabigh, Algud, Al Nuaibeaa, Hajar, and Ofoq basins reached the highest stream order possible (third order) (Table 3). High stream orders are generally indicative of the presence of intense streams and rivers in basins supplied by multiple small rivers and streams, providing a significant potential for flow velocities and water discharge, based on the relief features that have been analyzed [8,47].

4.1.3. Stream Length (Ls)

Known as a dimensional indicator, the stream length (Ls) index illustrates the average size of the water network and its impact on basin surfaces [13]. It is calculated by taking the entire length of rivers and streams in the sequence and dividing it by the total number of segment lengths. The combined length of the streams in all basins was calculated as 1695.58 km. In this study, stream length values ranged from 15.50 to 412.54 km for basins 9 and 1, respectively representing the lowest and highest values of the stream length parameter (Table 4; Figure 7). The stream length parameter is one of the most effective metrics for assessing surface runoff behaviors. Long streams indicate a small amount of infiltration and a high amount of runoff water [13].

4.1.4. Bifurcation Ratio (Rb)

The bifurcation ratio (Rb) parameter is one of the best metrics for defining ramification [41,54]. It is assigned by dividing the ratio of recorded channels of a certain order (Nu) by the number of channels in the next higher order (Nu + 1). In relation to this investigation, basin 6 had the greatest bifurcation ratio value, which was 5.4 (Table 4). Consequently, the Hajar basin recorded the lowest Rb value of 2.5 (Table 4). Frequently, the bifurcation ratio is highest for hilly landscapes and lowest for flat drainage basins, according to the authors’ discussion in refs. [8,13,47]. As a result, strong runoff conditions were present in most of the study areas, which means that there may not be a lag time before floods occur during periods of heavy rainfall.

4.1.5. Stream Frequency (Fs)

In this study, the extracted stream frequency parameter value of each basin was 48.61. The Algud basin had the greatest value of the Fs index (6.39), while the lowest Fs value of 3.49 was recorded for the Al Jehfa basin, which is located next to the Algud basin along the Red Sea coast (Table 4; Figure 7). Because of the high-relief features, dispersed vegetation cover, impermeable soil, and rock surfaces, the Fs index, which is widely used in flood studies, demonstrates that high values often reflect a significant volume of runoff transmission [33,41,55].

4.1.6. Form Factor (Ff)

The parameter of form factor (Ff) is widely used to test and measure the flow intensity of a basin (e.g., Ref. [56]). Based on the results of this parameter, part of the middle region of the terrain had the greatest value for the Ri Harshah basin of 0.73 (Table 4). For the Saabar basin, the lowest Ff value was computed as 0.09 in the southern part of the study area (Table 4; Figure 7). Based on this parameter, the authors of Refs. [47,57] suggested that high values indicate high discharge volumes during brief events, whereas low values indicate low discharge volumes.

4.1.7. Drainage Texture (Rt)

The drainage texture ratio (Rt) parameter is generally influenced by terrain, vegetation, rainfall, slope, rock, and soil types. According to this valuable index, vegetation-covered soft formations connected to flat topographic surfaces provide a fine texture, while hard rock reliefs (consolidated formations) usually produce a coarse texture [8,58]. The values of the Rt index for the Dulaidila through Saabar basins ranged from 0.08 to 0.25, respectively. Therefore, the results of the Rt in the study area imply that all the basins provide values of less than 1 presenting coarse texture conditions and low maximum discharge generation reaction (Table 4; Figure 7).

4.1.8. Drainage Density (Dd)

The authors of refs. [8,13] initially recognized and used the drainage density (Dd) index to characterize the drainage basin features. Dd was first defined and described by the authors of references [59,60] as the proportion of a stream’s total length to the basin’s total area. Dd is defined additionally by the authors of ref. [47] as the entire length of all examined orders divided by the area of the basin under study. The Dulaidila basin had the highest drainage density in the current study of 3.76 (Table 4), suggesting that this basin is probably providing the most runoff volume. The Haqqaq basin had the lowest value of the Dd parameter of 0.26 (see Figure 7 for the positions of the study basins).

4.1.9. Infiltration Number (If)

Recent morpho-hydrological studies have made extensive use of the infiltration number (If) index to better understand the infiltration characteristics of different water bodies [8,42]. The greatest value of If was found in this work to be 20.63 for the Algud basin, which creates an ideal environment for the high runoff volume and a high rate of infiltration. The Haqqaq basin showed comparatively low infiltration characteristics, resulting in the lowest infiltration ratio of 1.14 (Table 4).

4.1.10. Basin Relief (Br)

The basin relief (Br) parameter facilitates the comprehension of a studied basin’s total denudation, runoff volume, and landform alteration. According to the observation analysis produced from this parameter, the Dulaidila, Saabar, and Haqqaq basins had the maximum values of the Br index, which were 1365, 1344, and 1242, respectively (Table 4). The values extracted from this parameter are very useful and effective in estimating the probability of flooding incidents. A high degree of flood probability is frequently indicated by high levels, while low numbers indicate a minimal chance of any flash flooding.

4.1.11. Ruggedness Number (Nr)

The roughness number describes the length and steepness of the slope, which defines the extent of instability in the ground [61,62]. The Nr parameter values range from 0.12 for the Ofoq basin to 5.24 for the Dulaidila basin (Table 4). The higher Nr values are generally associated with high levels of flash flood risks, long, steep slopes, significant levels of erosion, and rapid peak flow signals [41]. For the Dulaidila and Saabar basins, the greater roughness values were 5.24 and 5.07, respectively (for basin positions, refer to Figure 5). The topography of the studied water bodies is uneven, making them susceptible to soil corrosion and possessing intricate structural features. Topographically, ref. [63] divided landscapes into three different categories based on Rn values: flat reliefs, undulating reliefs (1: Nr: 2), and badland reliefs (Rn > 2) [47].

4.1.12. Elevation-Relief Ratio (Rr)

One of the common relief aspect factors that show a basin’s topographic features is the Rr index [47]. The results of the Rr parameter varied between 4.16 (lowest) for the Ofoq basin and 32.62 (highest) for the Hajar basin, according to the investigation of these basins (Table 4). The relief ratio indicator helped to compare the relative relief in the examined basins, regardless of changes in topographical scale [62]. Therefore, higher Rr values signify a greater likelihood of flood events, an unexpected peak discharge, and low lag time values [41].

4.2. Accuracy Assessment and Methodological Considerations

In assessing the accuracy of the flash flood hazard models, quantifying the exact precision poses challenges, particularly in environments with limited ground-truth data or historical flood records. While conventional accuracy metrics, such as validation using related methods, were constrained in this study due to the absence of extensive flood records, the multiapproach geospatial analysis which we applied incorporating morphometric characteristics, rainfall data, and hydrological modeling offers a comprehensive, qualitative evaluation of flood-prone areas. Furthermore, sensitivity analyses were conducted to ensure the robustness of our methods. Future studies with enhanced data availability could provide more quantitative validation. Despite these limitations, the combination of multiple data sources and methodological triangulation enhances the reliability of the hazard assessment.

4.3. Evaluation of Flash Flooding Hazards Using a General Level Approach

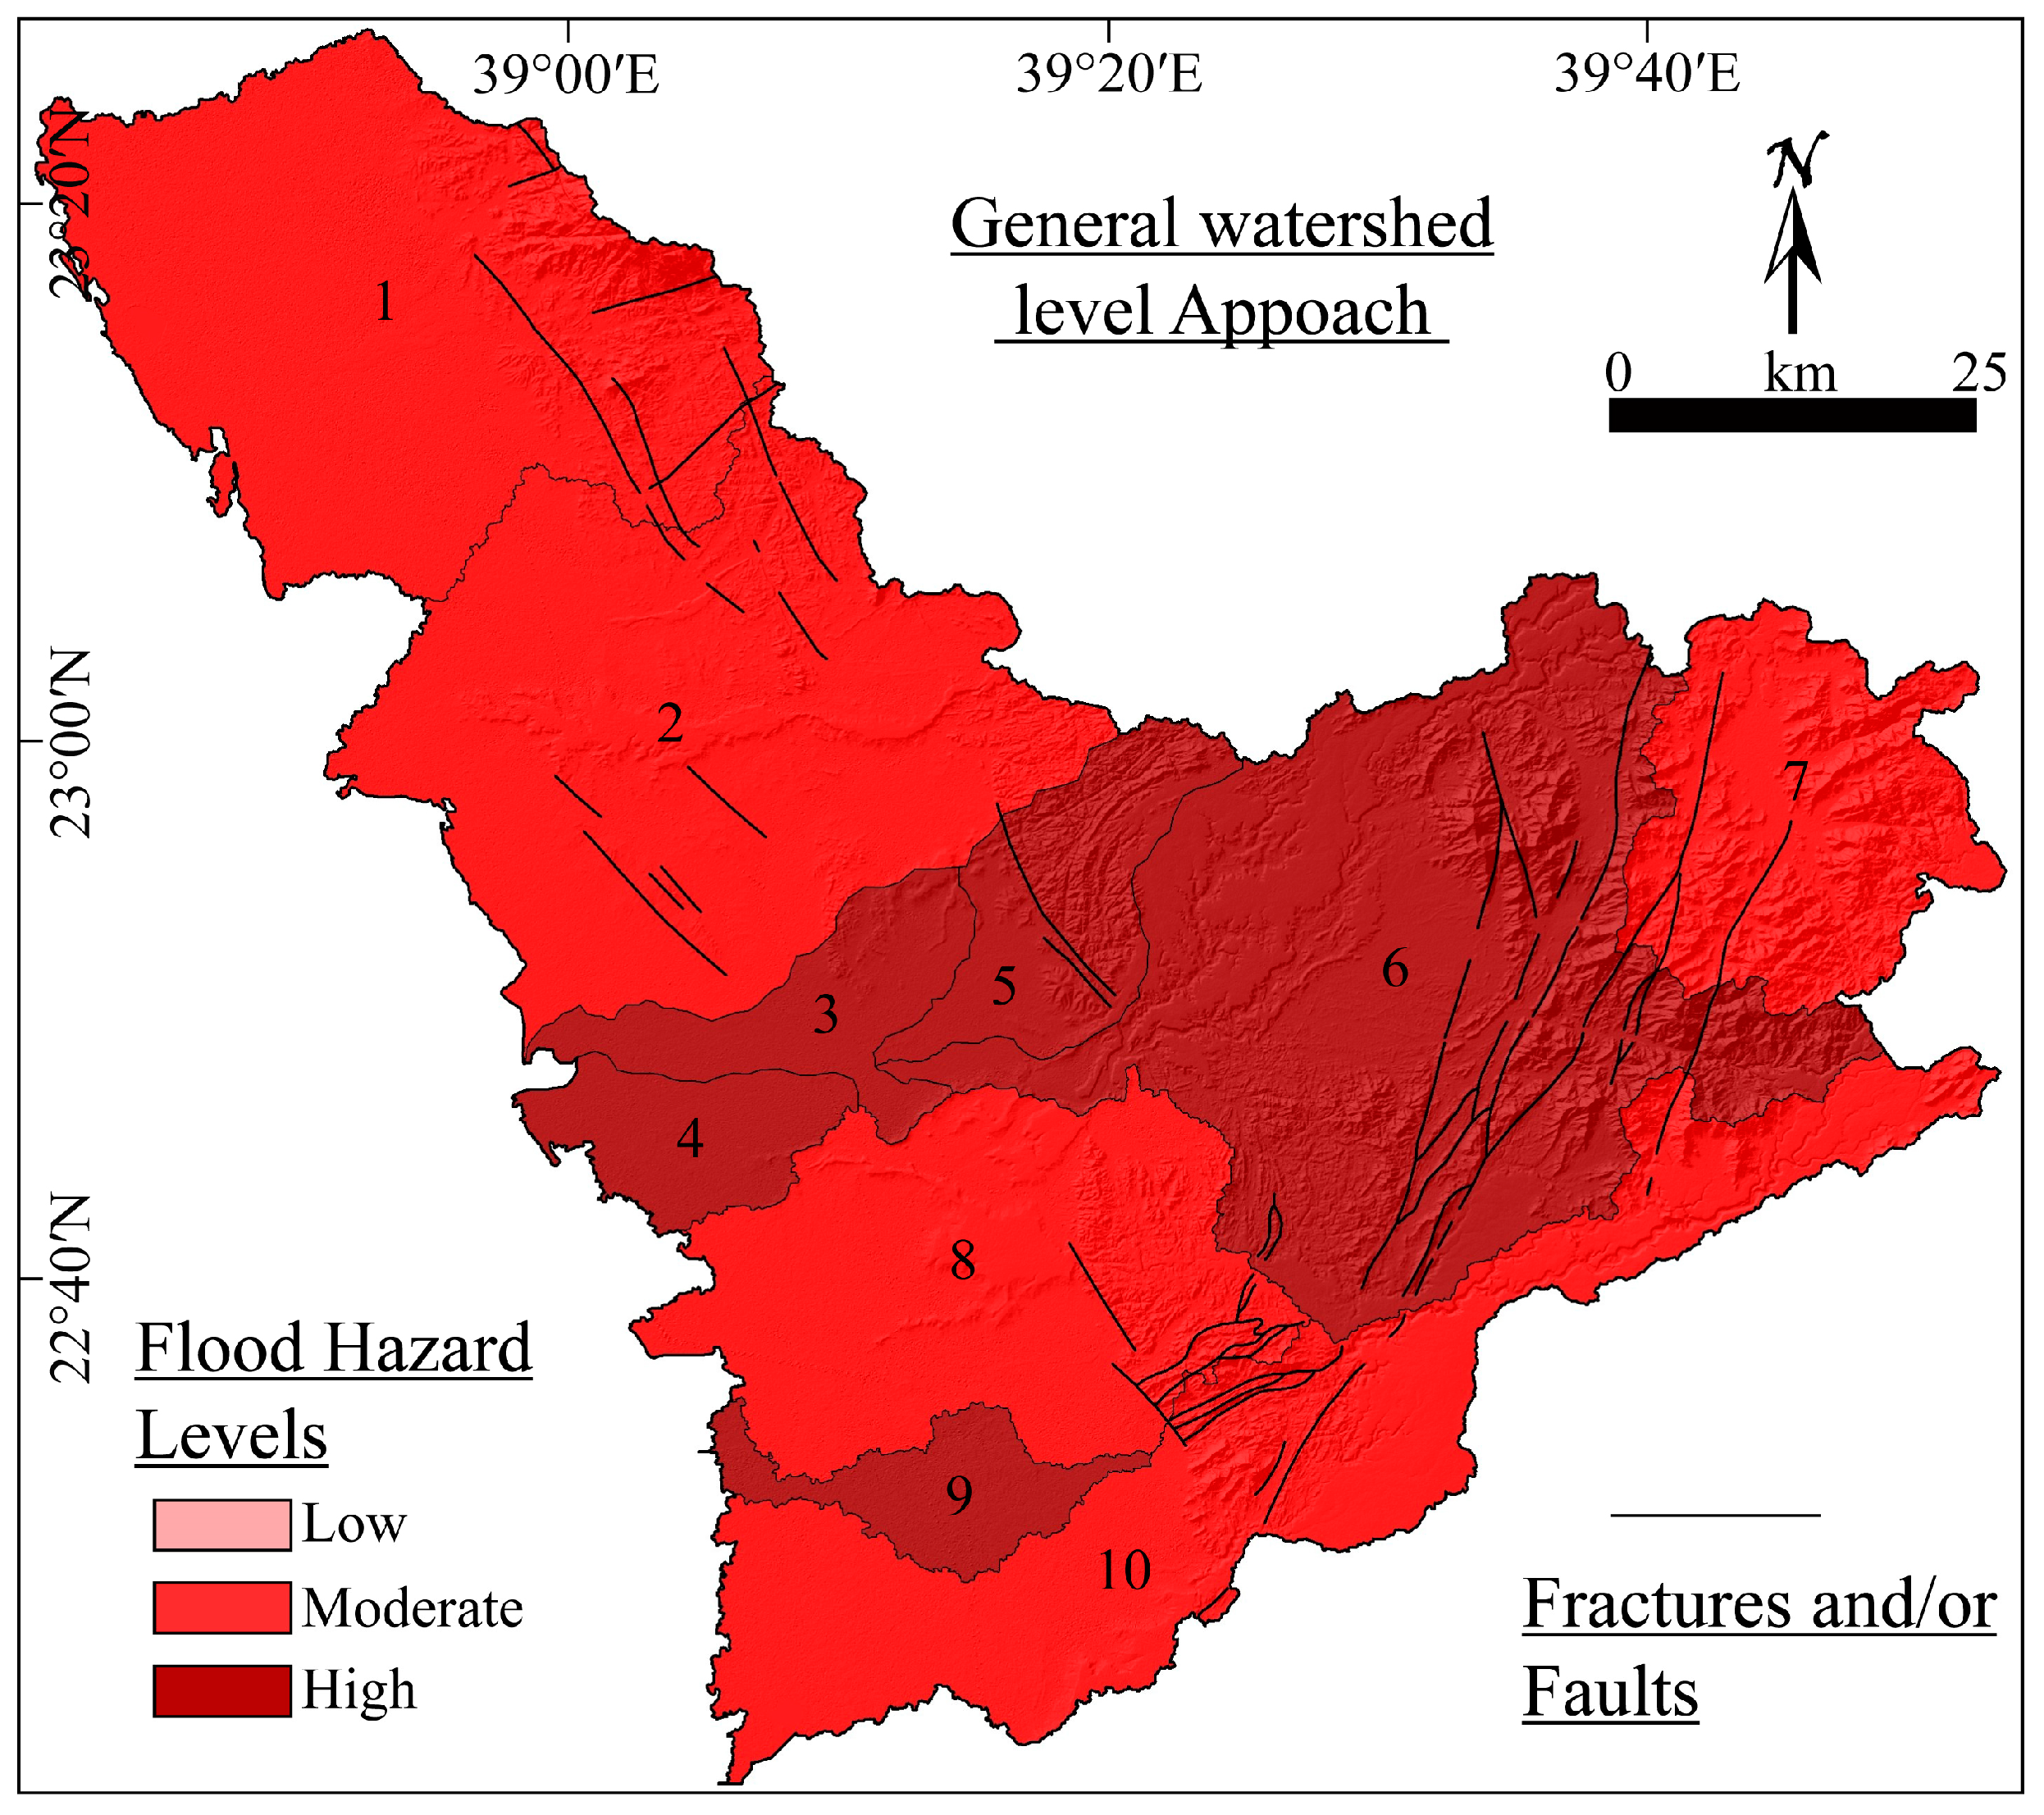
Although the generic level technique has been employed to evaluate several flood risks in various studies [25,48,61], it has specifically been used to examine the flash risk signatures in the Rabigh region. This analysis shows that the Rabigh, Algud, Al Nuaibeaa, Haqqaq, and Ofoq basins reflect the highest discharge volume conditions and, in comparison to the other basins, are more vulnerable to severe flash floods. This is due to the distinct cumulative results determined by applying this specific method. These proposed basins occupy about 2075.21 km2 with 194.14 km2 for the Rabigh basin, 156.49 km2 for basin 4, 240.18 km2 for basin 5, 1341.47 km2 for basin 6, and 142.93 km2 for basin Ofoq, covering around 32.43% of the total area (Figure 8). These basins have been observed to have a significant degree of flash flooding susceptibility. The Dulaidila, Ri Harshah, Hajar, Al Jehfa, and Saabar basins which constitute 4322.2 km2 (67.56%) of the total study area were defined as moderately susceptible basins for flash flooding (Figure 8). The analysis of this technique in the study area does not provide any low-level signals of the flash flooding susceptibility (Figure 8). The outcomes of this approach suggest that basins with a high level of flooding susceptibility which occupy a significant part of the lower half of the study area, are more deformed by intense fractures and/or faults than the other basins. In conclusion and according to this method, the Rabigh area is mostly exposed to moderate flash flooding susceptibility (Figure 8).

4.4. Evaluation of Flash Flooding Hazards Using the El-Shamy Approach

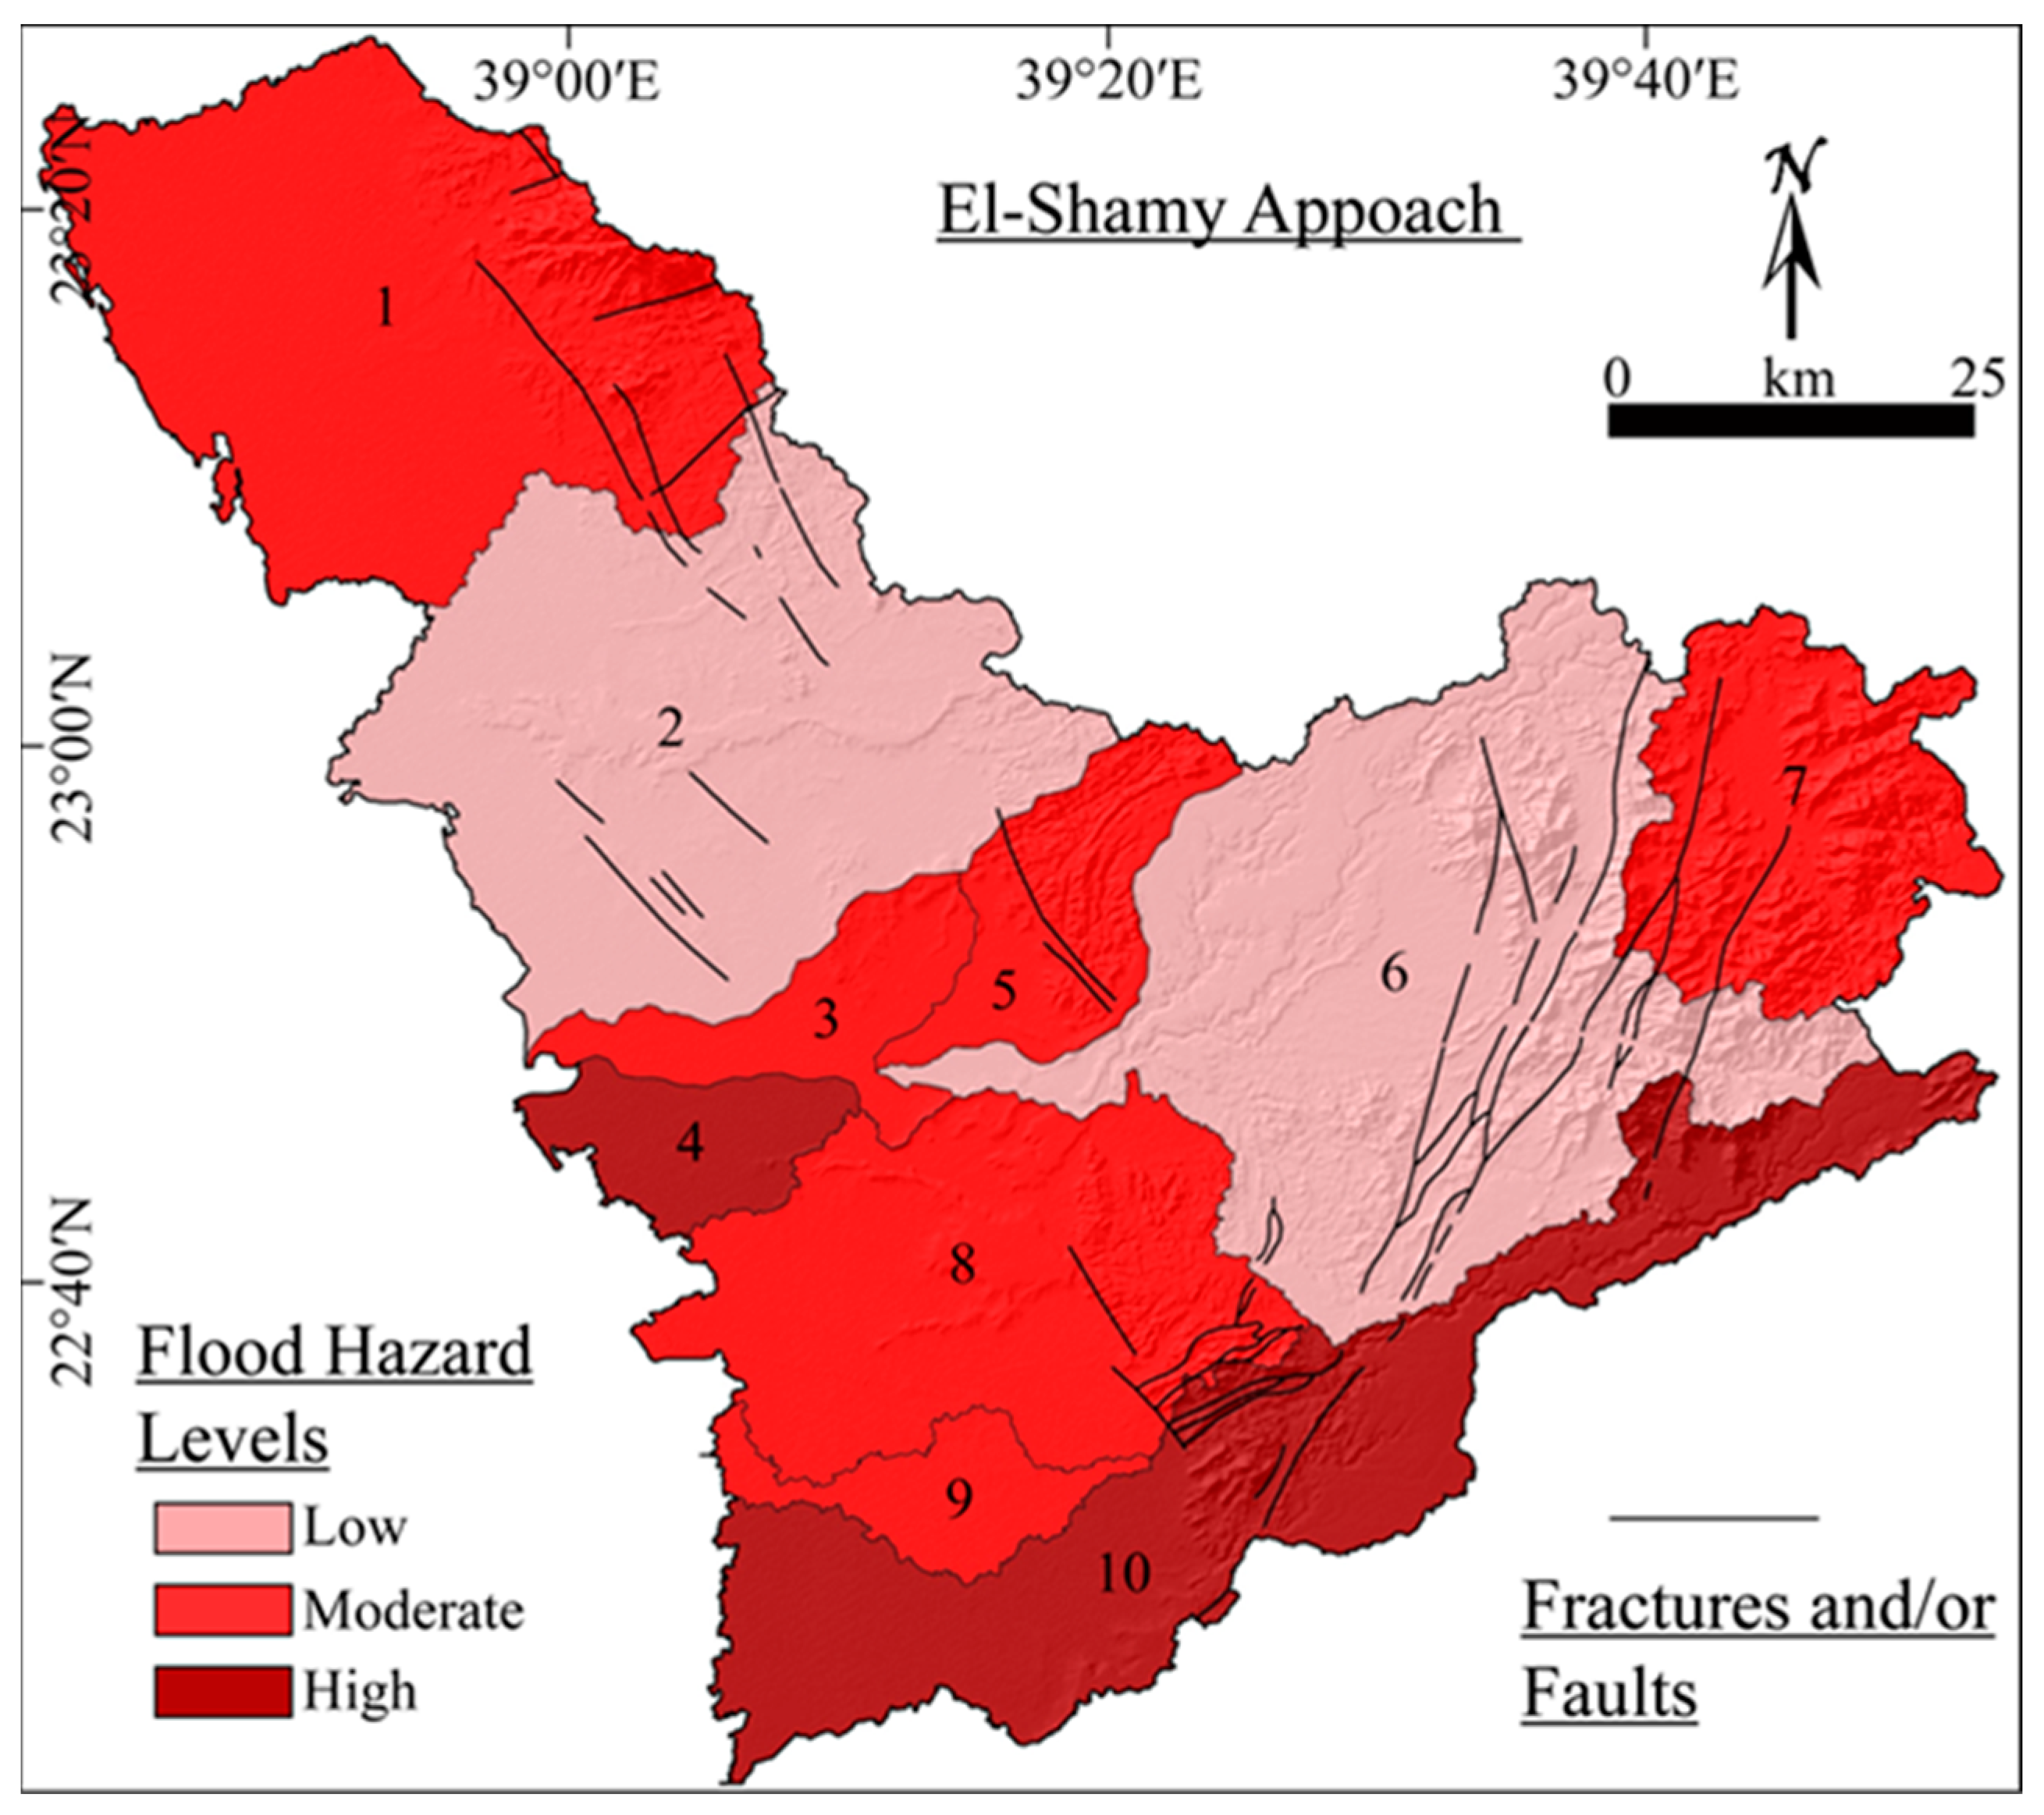
The authors of ref. [48] used this technique for the first time to determine the relationship between the likelihood of flash floods and the recent replenishment of aquifers in arid areas. Due to the nature of this approach, two distinct charts show the bifurcation ratio results against the values of the stream frequency and drainage density, respectively [8]. Three types of flash flood hazard levels were identified from these two quantitative graphs: high class (class A), moderate class (class B), and low class (class C). The bifurcation ratio’s relationship to the stream frequency chart is demonstrated by the fact that class A has four basins including the Algud, Al Nuaibeaa, Ofoq, and Sabaar basins (Figure 9). The Hajar and Al Jehfa basins were plotted on this chart with a moderate level of flood susceptibility (class B) (Figure 9). Finally, class C is represented in this chart by the Ri Harshah, Rabigh, and Haqqaq basins (Figure 9). The second chart under the El-Shamy approach, which illustrates the Rb versus drainage density, indicates that the Algud, Al Jehfa, and Sabaar basins have the highest flooding level (class A), while class B (moderate level) is defined by the Dulaidila, Rabigh, and Hajar basins (Figure 9). The lowest level of flooding (class C) is plotted in the same chart for the Ri Harshah and Haqqaq basins (Figure 9). The combined charts resulted in a new hazard level map showing that the Algud and Saabar basins have significant flooding hazards, accounting for 16.10% of the study landscape (Figure 10). The Ri Harshah and Haqqaq basins covered the low-level hazard over an area of roughly 39.11%, whereas the Dulaidila, Rabigh, Al Nuaibeaa, Hajar, Al Jehfa, and Ofoq basins covered the moderate levels with an area of 44.87% (Figure 10). The outcomes extracted from this study imply that most of the basins of the Rabigh region are characterized by a high level of flooding susceptibility, which is observed in several locations in the Rabigh region including the north, east, and south (Figure 10).

4.5. Evaluation of Flash Flooding Hazards Using the Ranked Approach

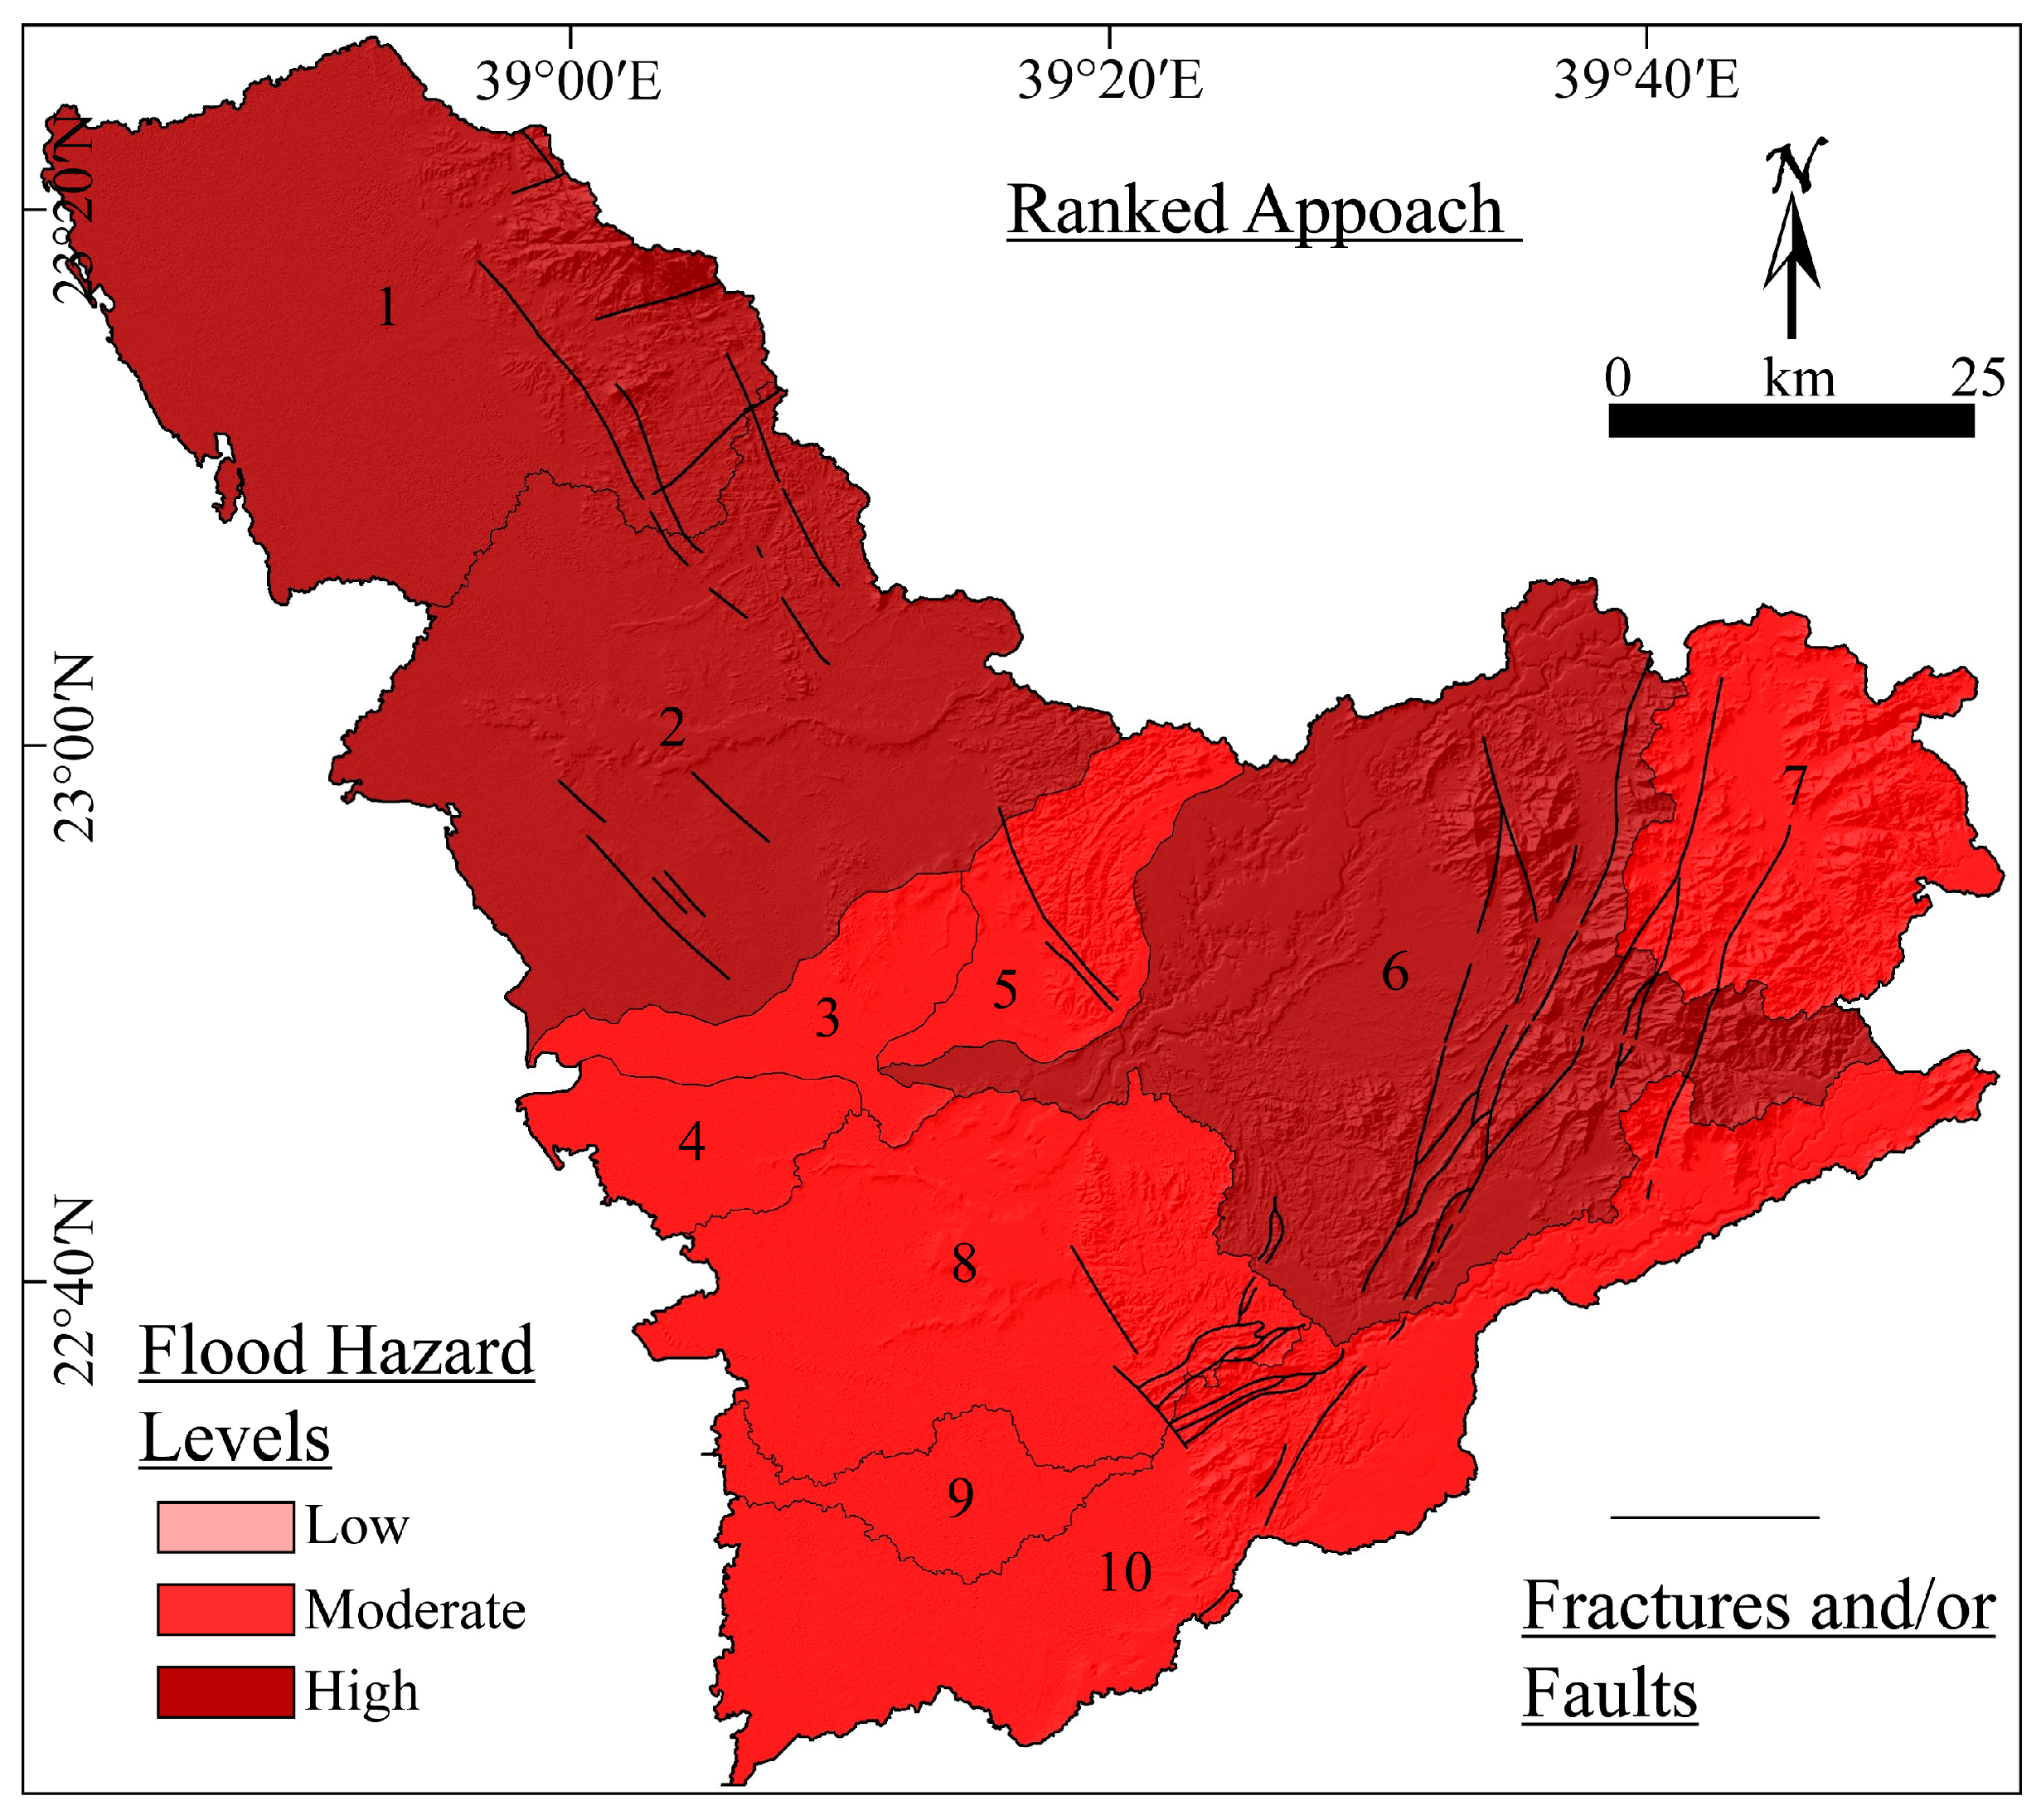
One of the most used methods for assessing flash floods and identifying flood potentialities is the ranking method [8]. This linear method equation was initially employed by the author of ref. [53] as a cutting-edge way of data analysis and statistics in natural disasters. He estimated the levels of flood risk using this linear equation as a scale. The scale utilized in this study for ranking methods allowed for the identification of three classes: class 3 denotes the low class, class 2 denotes the moderate class, and class 1 denotes the highest flood risk signals. Based on the results obtained from this technique, three basins including the Dulaidila, Ri Harshah, and Haqqaq basins have a high-level of flooding. The area which is covered by the high flood signals is around 2597.72 km2 equating to 56.23% (Table 5; Figure 11). The analysis of this method revealed that the upper half of the study area is mainly characterized by basins with high-level flooding hazards. Additionally, and due to this method, only one basin in the lower half of the study was observed to have 1341.47 km2 of high flash flooding susceptibility. It has also been noted that this area is highly deformed and characterized by intense sets of fractures (Figure 11). Most of the research region’s lower half is covered by moderate flash flooding signal circumstances. These moderate levels are covered by the Rabigh, Algud, Al Nuaibeaa, Hajar, Al Jehfa, Ofoq, and Saabar basins (Figure 11), occupying 2799.69 km2 equating to 43.76%. Due to the results of this method, there were no basins identified that belong to the minimal risk level of flash floods (Table 5; Figure 11).

4.6. Overall Assessment Utilizing Combination Approaches

Overall, the comparison of the results of the ranked method, El-Shamy method plotting, and general watershed method outputs shows that the ranked method and general watershed methods define only two flood hazards (moderate and high), whereas the evaluation based on the El-Shamy approach provides three levels of flash flood hazards (Figure 12a,b). While most basins show varying levels of flooding risk and a moderate level for the other approaches, the Hajar and Al Jehfa basins showed a similar rank of flood threats due to all the applicable techniques as a moderate to high flash flood degree. Only the Ri Harshah basin presents the three flooding hazards levels of low, moderate, and high which were extracted from the general watershed levels, El-Shamy, and ranked approaches, respectively (Figure 12a). According to the percentage analysis, moderate levels of flooding hazards seem greater under the general watershed level approach by 67.56%, followed by 44.87% and 43.76%, respectively, which were extracted via the El-Shamy and ranked approaches, respectively (Figure 12a). Finally, by integrating the three techniques, an extensive map was produced (Figure 12b). In this paper, the overall assessment model reveals various levels of flash flood susceptibility. According to the current analysis, there is a 42.24% (2702.846 km2) high degree of flood susceptibility and 57.76% (3694.57) moderate level (Figure 12b). There are obvious variations between the three approaches in assigning the high, moderate, and low flooding hazard levels (Figure 12b).

4.7. Assessment of the Topographic Position Index (TPI)

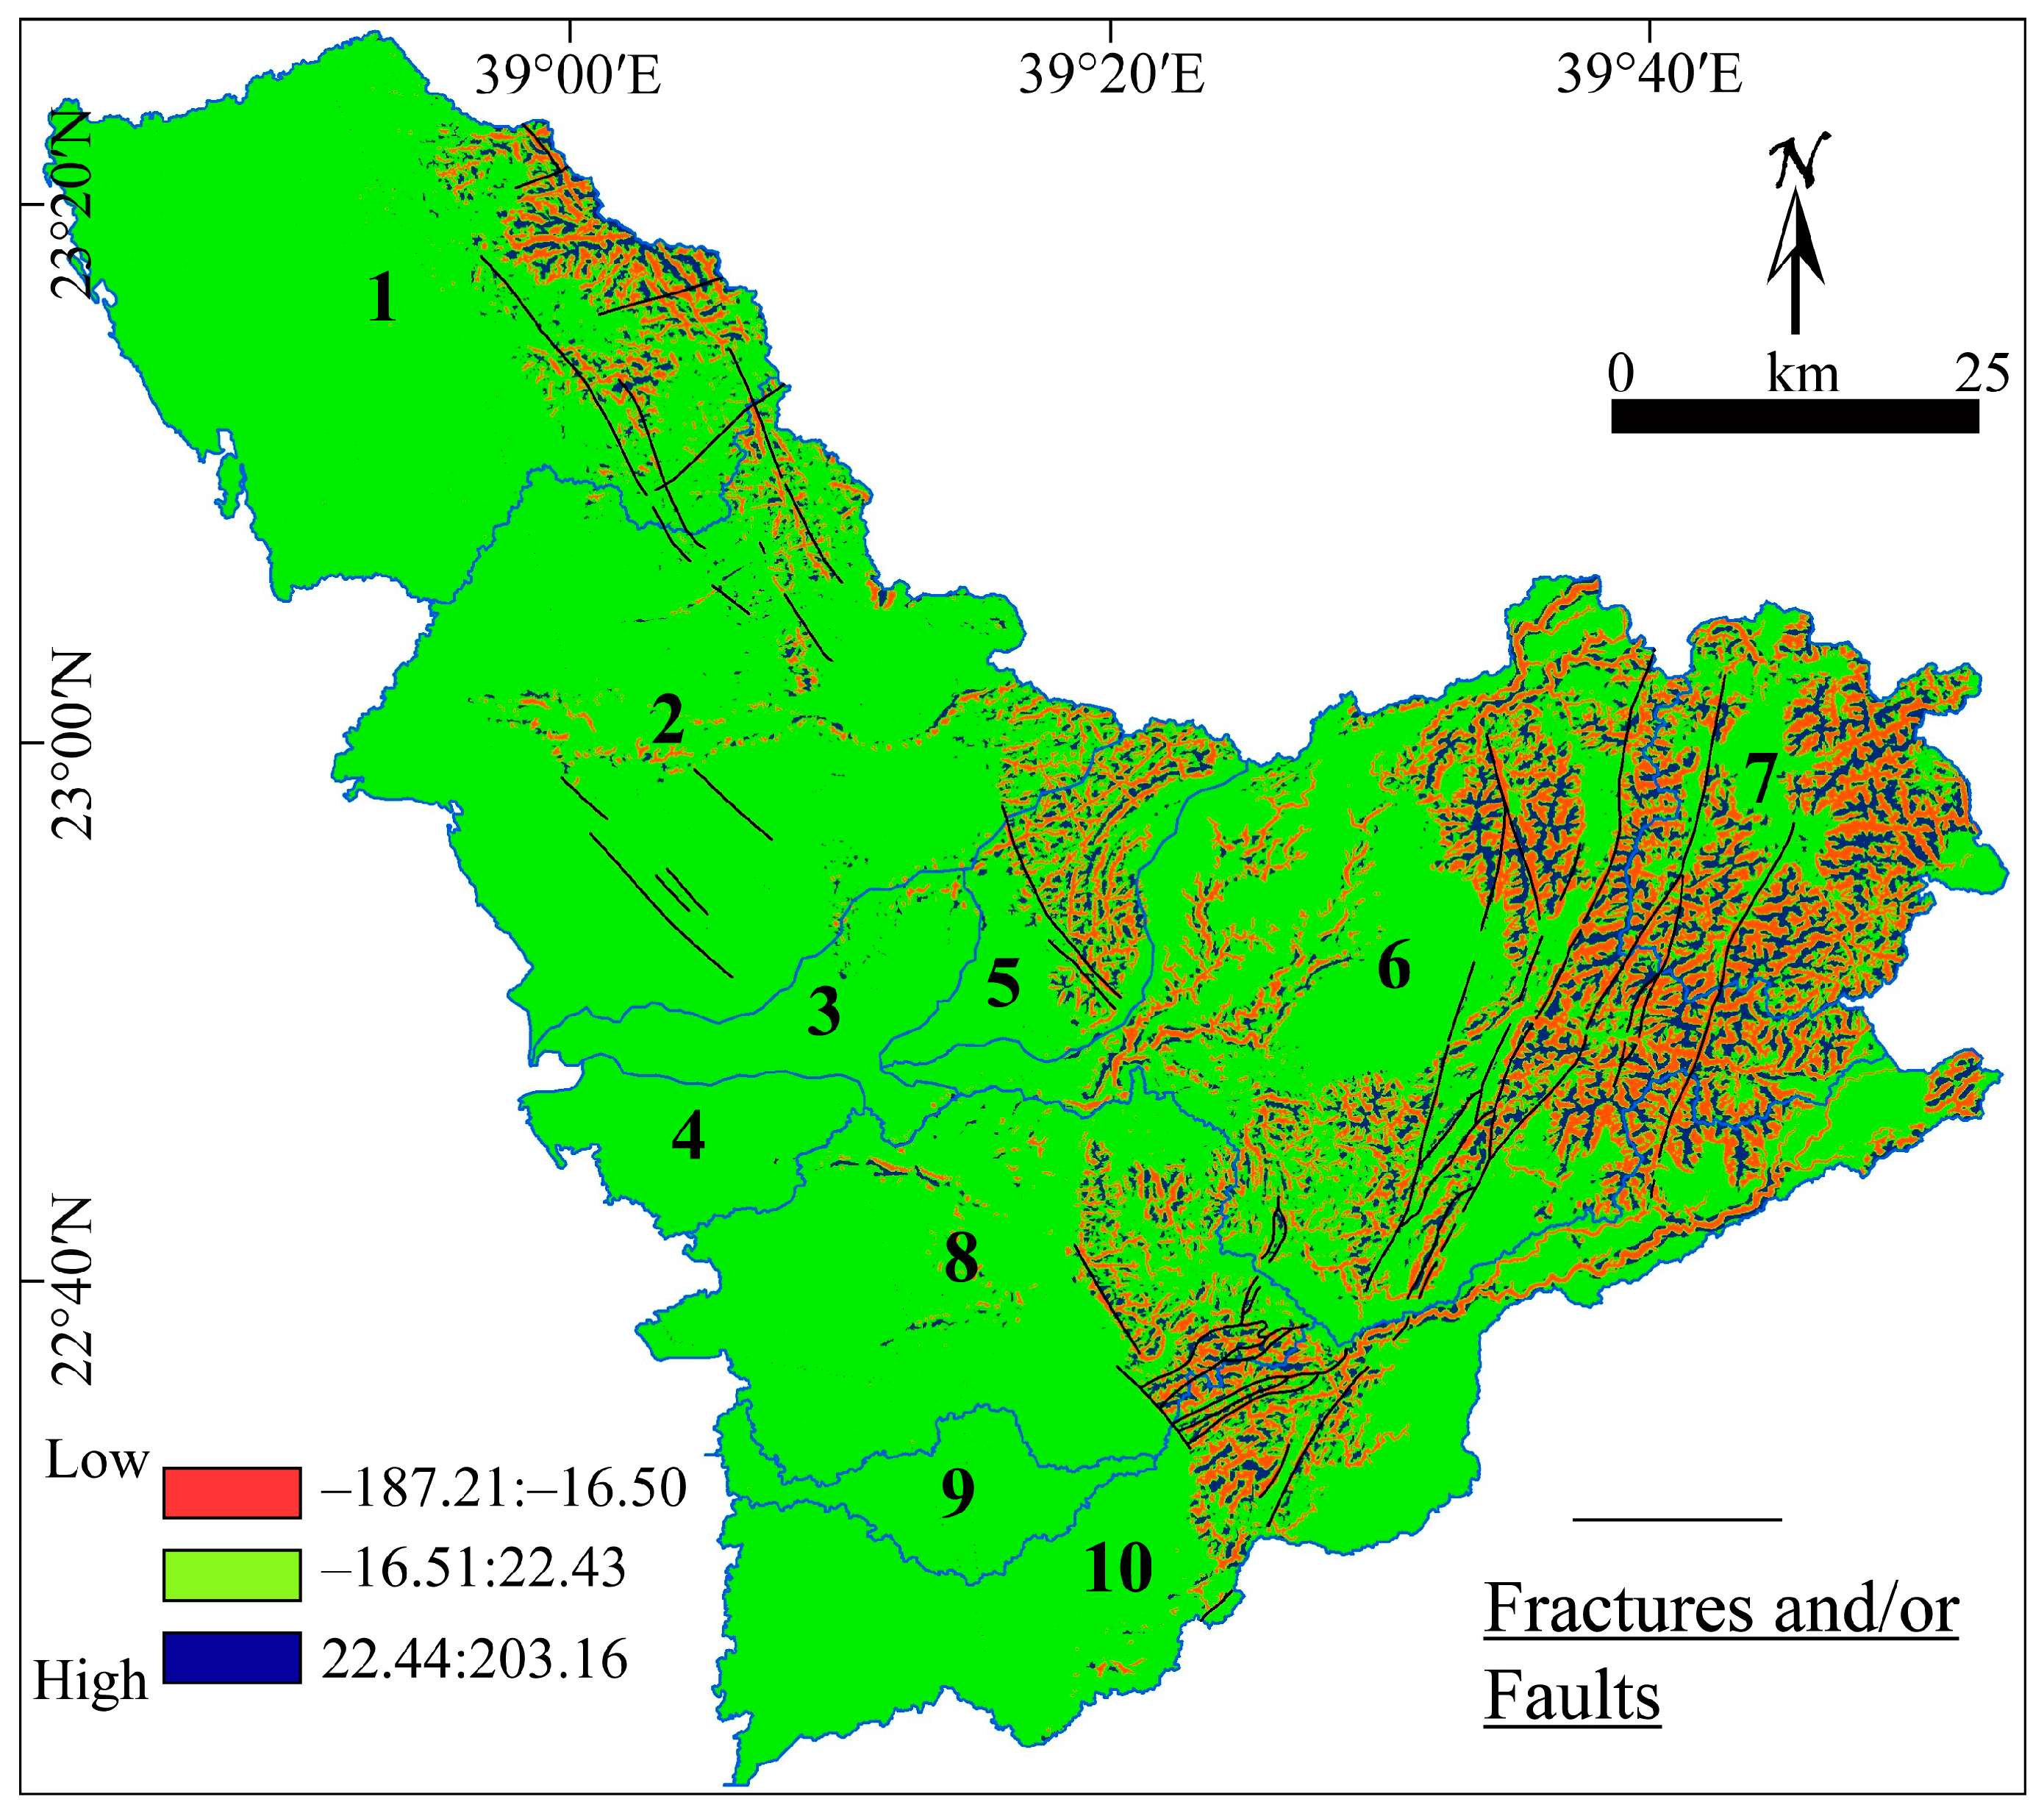
Slope position and landform types can be found in landscapes using the Topographic Position Index (TPI), a straightforward and dependable method [8,47]. It explains a cell’s elevation as well as the typical elevation of the cells around it [46]. With the use of TPI values, several types of slopes, valleys, and topographic ridges can be distinguished [64,65,66]. The TPI processing in the present work represents three distinct waterlogging likelihood levels, ranging from −178.21 to 203.16 (Figure 13). The regions characterized by low-relief topography are not likely to experience topographic flooding; instead, the steep relief’s sides typically provide the minimal probable conditions. The topographic position index is a highly helpful metric for classifying topographic landscape areas and characterizing the topographically driven physical equilibrium of the basin water in addition to providing drainage [67]. Positive TPI values in the current study provide a larger centric zone than its typical neighbors, while negative values suggest lower values than its surroundings (Figure 13). Typically, topographic slope identification and automated landscape classifications are accomplished via the TPI [8,68]. Therefore, in this study, we used the TPI to identify several topographic features, such as high-topographic plateaus, depressions, and flat areas. As a result, we presume that the TPI is effective and prevailing. This very effective key implies that the researched basins’ fiction is fully saturated [47,69]. It is also possible to determine the topographic structure of the water system, gain additional knowledge about drainage systems, and create a unique run-off behavior figure by utilizing this index [69].

4.8. Assessment of the Flash Flood Risk Susceptibility

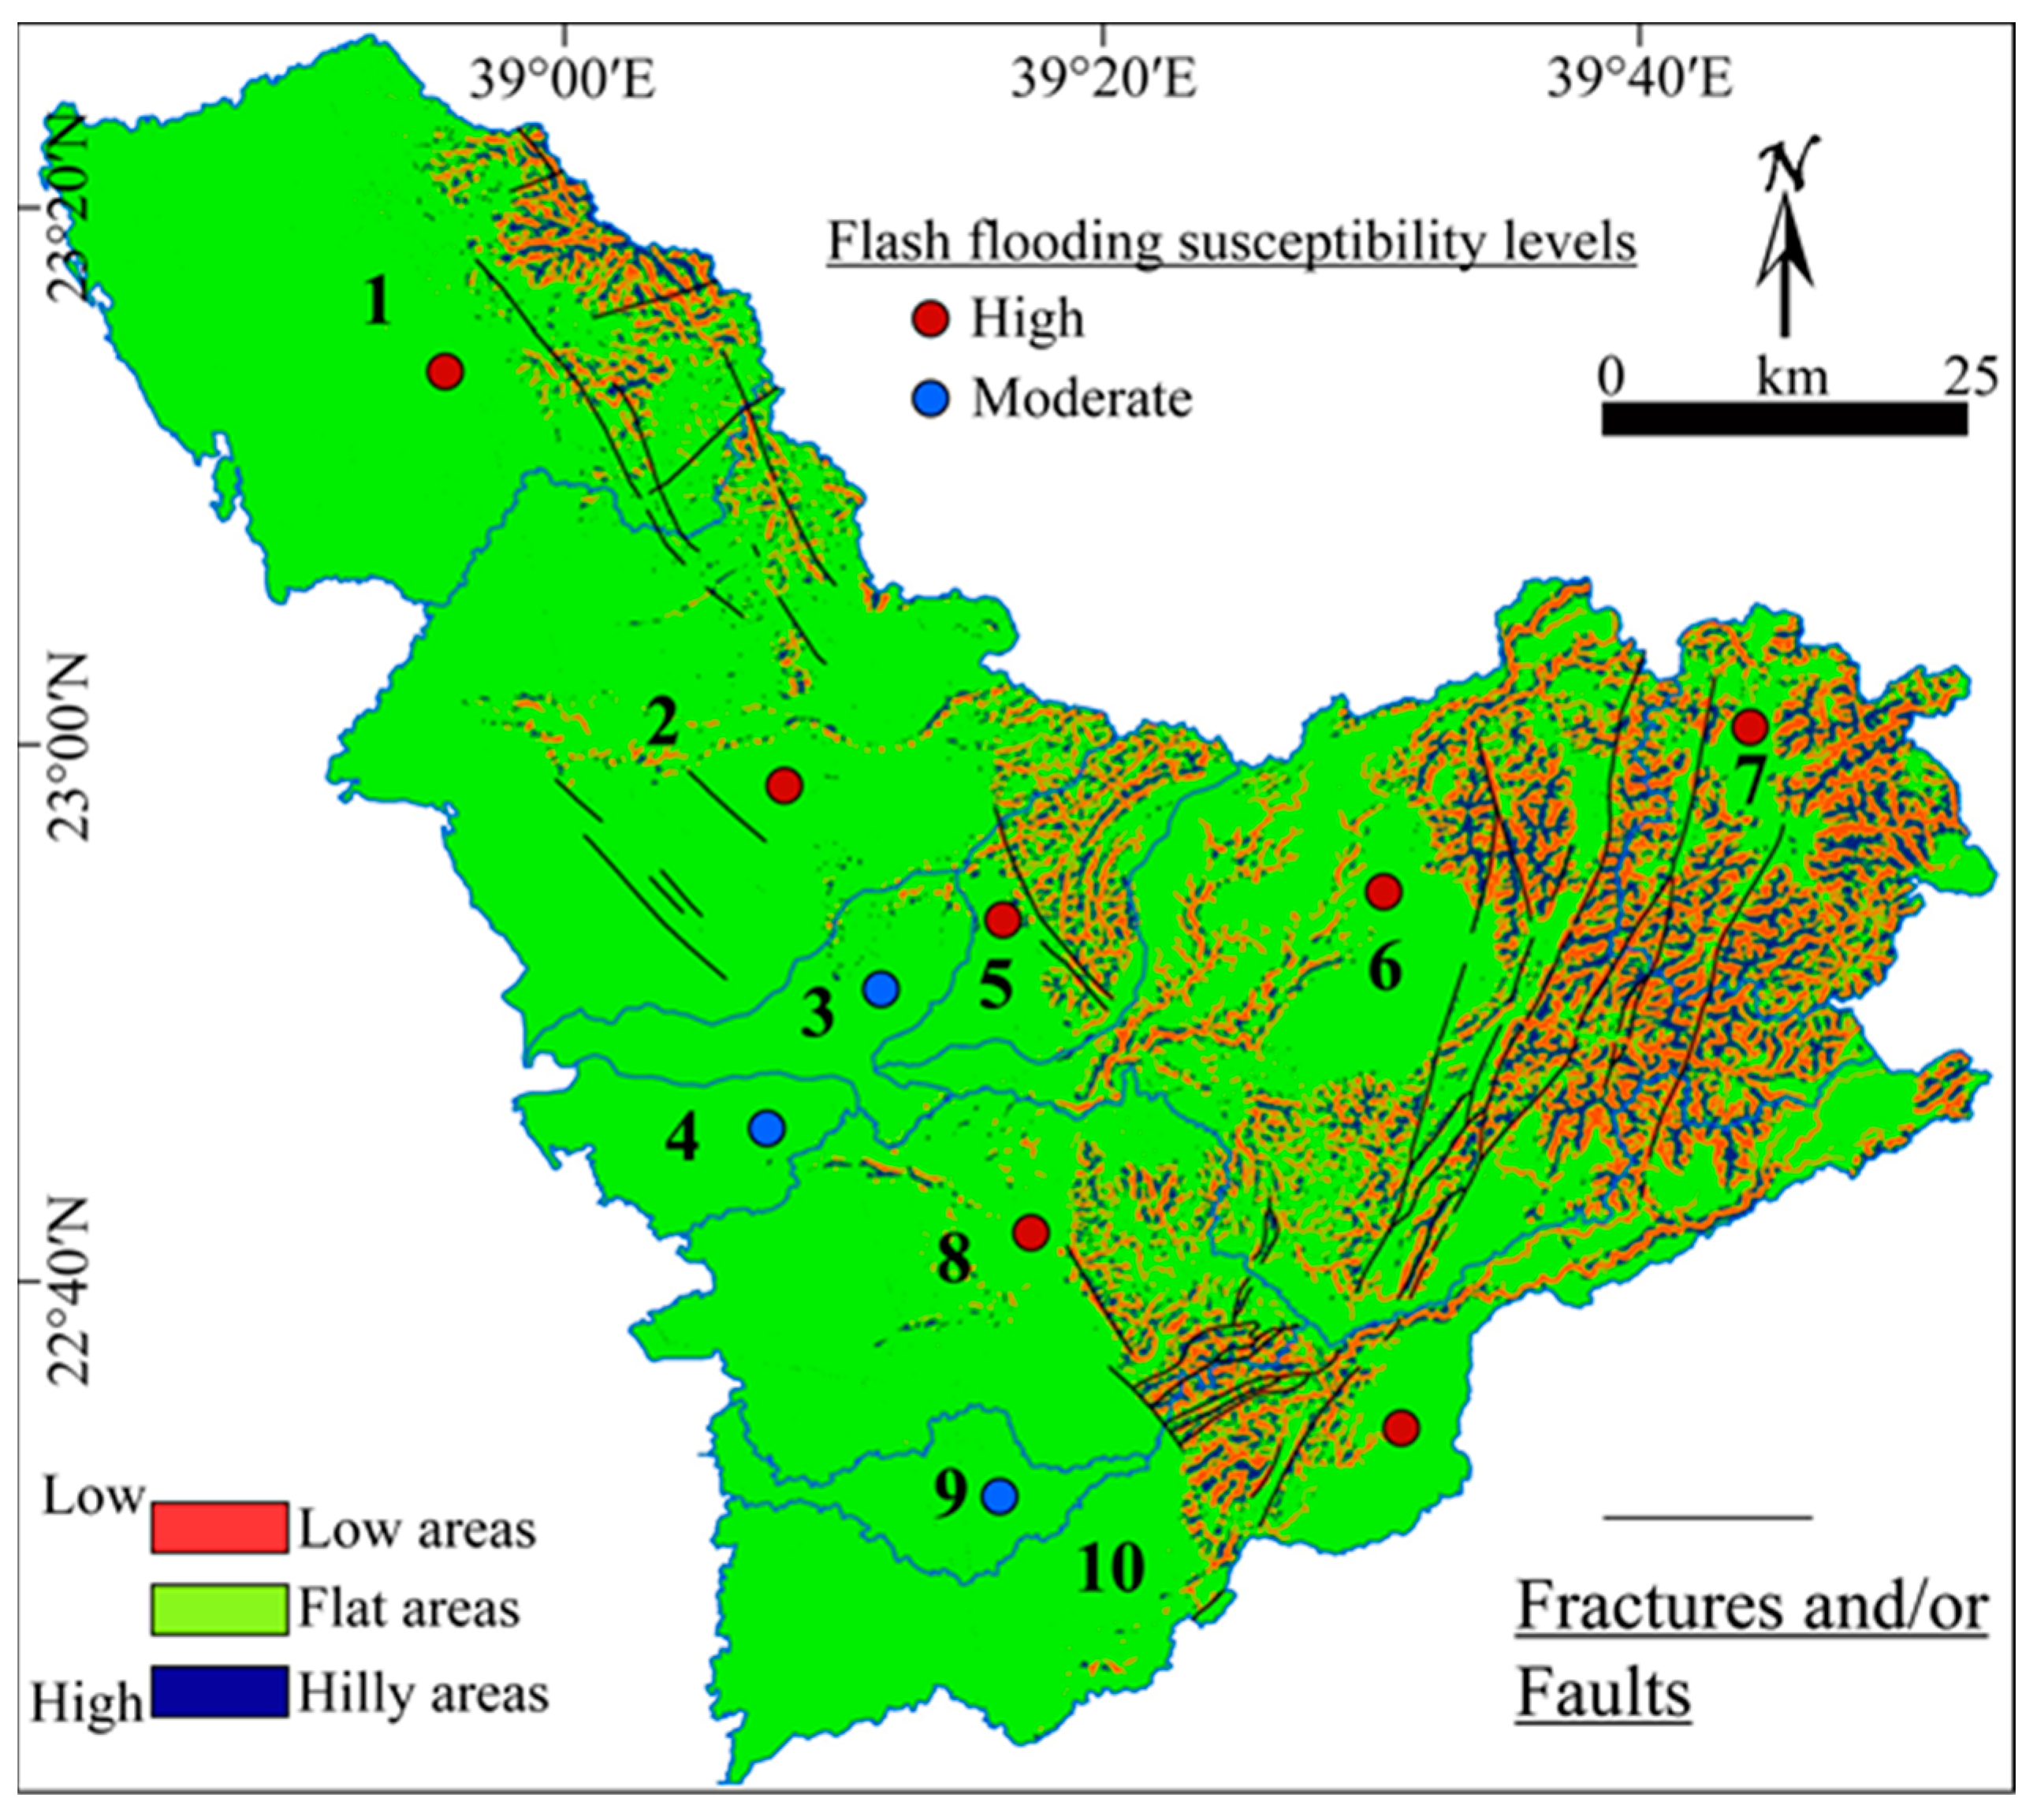
The dynamic behaviors of sudden environmental events like flash floods have, in general, never been completely predictable or prevented. It is imperative that we deepen our knowledge of historical events and improve our methods and processes to build comprehensive models that can reliably forecast future flood events and mitigate the harmful effects of flash floods. Thus, to assign flood susceptibility utilizing the modern methods, new strategies are needed. Three separate yet effective methods were combined to accomplish the objectives and divide the study region into multiple areas vulnerable to flash floods. While each method was successfully tested to examine the different characteristics of various flash flood risks [48,70], in this study, we present here an integrated strategy to assign critical insights into potential flood risks and suggested regionally effective behaviors. The results indicate that the Dulaidila, Rabigh, Algud, Al Nuaibeaa, Ofoq, and Saabar basins provide excellent circumstances to produce discharge and are highly vulnerable to the risk of flash flooding because of the different cumulative values gathered utilizing the modified approaches. These basins cover areas of 1095.59 km2, 194.14 km2, 156.49 km2, 240.18 km2, 142.93 km2, and 873.51 km2 that all occupy about 42.24% of the total Rabigh landscape area (Figure 14). Based on the morphometric indices as studied using the three cumulative techniques, the Ri’ Harshah, Haqqaq, Hajar, and Al Jehfa basins, which cover 1160.66 km2, 1341.47 km2, 449.35 km2, and 873.51 km2, respectively, are indicated to have moderate flash flood risk susceptibility. They together make up 57.76% of the entire study area (Figure 14). Examining the three approaches that have been used in this study, only two basins exhibited similar degrees of flood susceptibility (Hajar and Al Jehfa basins). The overall analysis, using the three modified methodologies for all the basins, shows that in this study, there was not a single basin that was recorded as having a low level of flooding susceptibility. Additionally, using the three modified approaches, the total study for the Ri Harshah basin illustrates the three distinct flood susceptibility levels. A low level as was indicated by the El-Shamy approach, a moderate level was identified by the general watershed approach, and a high level was assigned by the ranked approach (Figure 14). The basins’ level of susceptibility final map (Figure 14) in situ can be merged with one of the most helpful and indicative topographic index (TPI) results by processing the weighted overlay phase in the ArcGIS 10.4 program. This provides us with a good chance to accurately determine each part’s (30 m × 30 m pixel) susceptibility to flash flooding in all the watersheds that have been studied. Regarding the impacts of structural lineaments, the final produced map displays deformed parts over the Al Nuaibeaa, Haqqaq, Hajar, Al Jehfa, and Saabar basins, which are characterized by high flood risk susceptibility levels, while fewer fractures are present over the Dulaidila and Ri Harshah basins, which are characterized by both moderate and high flood risk susceptibility levels (Figure 14). The (fractures and/or faults) in the Rabigh region as shown in Figure 2, were mapped as they existed over most of the Rabigh area. It seems that some basins including the Rabigh, Algud, and Ofoq basins were not affected by any structural lineaments. Generally, flash floods are more likely to happen in low-density fractured zones because areas with lower-density fracture are less likely to see water infiltration than in subterranean areas [1,8]. In the present study, lineaments were few and showed low densities particularly in areas with moderate to high degrees of flash flood risks. Interestingly, this conclusion concurs with the final overall map of the present study (Dulaidila, Haqqaq, Hajar, and Saabar basins) (Figure 13 and Figure 14). The mission of validation is to demonstrate that the model accurately captures the system behavior and is an accurate depiction of the actual system, meeting the objectives of the analysis. To achieve this goal, some recent examples will be discussed to test the validity and accuracy of our models. The authors of ref. [1] studied the Rabigh region along the coastal zone of the Red Sea in Egypt using remotely sensed information and geospatial techniques. This study produced a map indicating the spatial distribution of the flash flood susceptibility of Ras Ghareb basins. The map, which was produced in this study, indicated that Ras Ghareb is dominated by moderate to high signals of flash flood risks. The authors of the present study suggest that Ras Ghareb provides environmental conditions like the Rabigh area as they are both situated along the Red Sea coast. Interestingly, the final flash flood map of the Rabigh region is dominated by moderate to high flash flood signals (Figure 13 and Figure 14). Another example comes from studying the flash flood risks of the Wadi al Lith (Red Sea coastal zone, Saudi Arabia) [52]. Both Wadi Al Lith and the Rabigh region are located in the same province (Makkah province). Flash flood risks were assessed in Wadi Al Lith based on various hydrology and geomorphology features in addition to the GIS techniques. The conclusion that has been written in this work states that the Wadi Al Lith area is also dominated by moderate to high flash flood risks.

5. Conclusions and Recommendations

This study provided an in-depth assessment of the flash flood risks in the Rabigh region, Saudi Arabia, using geospatial analysis combined with a multi-criteria approach. Ten major basins were analyzed, including significant ones like Dulaidila, Rabigh, and Al Nuaibeaa. The evaluation was based on morphometric parameters through distinctive techniques such as the general level approach, the El-Shamy method, and the ranking approach, which together revealed the areas most vulnerable to flash floods. The analysis identified several basins, especially Dulaidila, Rabigh, Algud, and Al Nuaibeaa in the central region, along with Ofoq and Saabar in the southern region, as highly susceptible to flash flooding. These basins exhibited high discharge capacities, increasing their vulnerability to flooding events. The study also highlighted the usefulness of the Topographic Position Index (TPI) in effectively tracking and mapping the flood susceptibility across all the studied basins. Despite these findings, the study acknowledges limitations, particularly related to the vertical accuracy of the SRTM dataset (RMSE of 8.28 m and 30 m resolution). Additionally, factors such as lithology, land use, and hydraulic characteristics were not fully integrated, which could have influenced the flood risk predictions. Nonetheless, the research offers valuable insights into flood hazards and provides a methodological framework that can be applied to other regions with similar geological and hydrological characteristics.
To improve flood risk management and preparedness, we recommend the regular updating of climate datasets and the implementation of advanced monitoring techniques. Early warning systems should be established by setting up monitoring stations in key areas to facilitate rapid responses to impending flood risks. Lastly, improving public awareness and risk communication is essential to mitigate the impacts of flooding and ensure a safer, more resilient environment.

Author Contributions

Conceptualization, B.B. and A.A.; methodology, B.B.; software, B.B. and A.A.; validation, B.B.; formal analysis, B.B. and A.A.; investigation, B.B. and A.A.; resources, A.A.; data curation, B.B.; writing—original draft preparation, A.A.; writing—review and editing, A.A.; visualization, B.B. and A.A.; supervision, B.B. and A.A.; project administration, B.B. and A.A.; funding acquisition, B.B. and A.A. All authors have read and agreed to the published version of the manuscript.

Funding

This research was supported by the Researchers Supporting Project, Grant number (RSP2024R296), King Saud University, Riyadh, Saudi Arabia.

Data Availability Statement

These data were derived from the following resources available in the public domain: (https://earthexplorer.usgs.gov/, accessed on 22 July 2024) and (https://ngdp.sgs.gov.sa/ngp/, accessed on 13 May 2024).

Conflicts of Interest

The authors declare no conflicts of interest.

References

  1. Arnous, M.O.; El-Rayes, A.E.; El-Nady, H.; Helmy, A.M. Flash flooding hazard assessment, modeling, and management in the coastal zone of Ras Ghareb City, Gulf of Suez, Egypt. J. Coast. Conserv. 2022, 26, 77. [Google Scholar] [CrossRef]
  2. Manzoor, Z.; Ehsan, M.; Khan, M.B.; Manzoor, A.; Akhter, M.M.; Sohail, M.T.; Hussain, A.; Shafi, A.; Abu-Alam, T.; Abioui, M. Floods and flood management and its socio-economic impact on Pakistan: A review of the empirical literature. Front. Environ. Sci. 2022, 10, 1021862. [Google Scholar] [CrossRef]
  3. Dhiman, R.; VishnuRadhan, R.; Eldho, T.I.; Inamdar, A. Flood risk and adaptation in Indian coastal cities: Recent scenarios. Appl. Water Sci. 2019, 9, 5. [Google Scholar] [CrossRef]
  4. Arnous, M.O.; Omar, A.E. Hydrometeorological hazards assessment of some basins in Southwestern Sinai area, Egypt. J. Coast. Conserv. 2018, 22, 721–743. [Google Scholar] [CrossRef]
  5. Dube, K.; Nhamo, G.; Chikodzi, D. Flooding trends and their impacts on coastal communities of Western Cape Province, South Africa. GeoJournal 2022, 87, 453–468. [Google Scholar] [CrossRef]
  6. Cotti, D.; Harb, M.; Hadri, A.; Aboufirass, M.; Chaham, K.R.; Libertino, A.; Campo, L.; Trasforini, E.; Krätzschmar, E.; Bellert, F.; et al. An Integrated Multi-Risk Assessment for Floods and Drought in the Marrakech-Safi Region (Morocco). Front. Water 2022, 4, 886648. [Google Scholar] [CrossRef]
  7. Şen, Z.; Khiyami, H.A.; Al-Harthy, S.G.; Al-Ammawi, F.A.; Al-Balkhi, A.B.; Al-Zahrani, M.I.; Al-Hawsawy, H.M. Flash flood inundation map preparation for wadis in arid regions. Arab. J. Geosci. 2013, 6, 3563–3572. [Google Scholar] [CrossRef]
  8. Khalifa, A.; Bashir, B.; Alsalman, A.; Naik, S.P.; Nappi, R. Remotely Sensed Data, Morpho-Metric Analysis, and Integrated Method Approach for Flood Risk Assessment: Case Study of Wadi Al-Arish Landscape, Sinai, Egypt. Water 2023, 15, 1797. [Google Scholar] [CrossRef]
  9. Antzoulatos, G.; Kouloglou, I.-O.; Bakratsas, M.; Moumtzidou, A.; Gialampoukidis, I.; Karakostas, A.; Lombardo, F.; Fiorin, R.; Norbiato, D.; Ferri, M.; et al. Flood Hazard and Risk Mapping by Applying an Explainable Machine Learning Framework Using Satellite Imagery and GIS Data. Sustainability 2022, 14, 3251. [Google Scholar] [CrossRef]
  10. Khalifa, A.; Bashir, B.; Alsalman, A.; Bachir, H. Morphometric-Hydro Characterization of the Coastal Line between El-Qussier and Marsa-Alam, Egypt: Preliminary Flood Risk Signatures. Appl. Sci. 2022, 12, 6264. [Google Scholar] [CrossRef]
  11. Smith, K.; Fearnley, C.J.; Dixon, D.; Bird, D.K.; Kelman, I. Environmental Hazards: Assessing Risk and Reducing Disaster, 7th ed.; Taylor & Francis: London, UK, 2023. [Google Scholar] [CrossRef]
  12. United Nations. GNDAR, Global Natural Disaster Assessment Report 2020. In UN Annual Report; United Nations: New York, NY, USA, 2021. [Google Scholar]
  13. Horton, R.E. Erosional development of streams and their drainage basins; Hydrophysical approach to quantitative morphology. Bull. Geol. Soc. Am. 1945, 56, 275–370. [Google Scholar] [CrossRef]
  14. Strahler, A.N. Quantitative geomorphology of drainage basins is channel networks. In Handbook of Applied Hydrology; Chow, V., Ed.; McGraw Hill Book Company: New York, NY, USA, 1964; pp. 439–476. [Google Scholar]
  15. Sherwood, J.M. Estimation of Flood Volumes and Simulation of Flood Hydrographs for Ungaged Small Rural Streams in Ohio; U.S. Geological Survey: Reston, VA, USA, 1993. [Google Scholar]
  16. Bathrellos, G.D.; Karymbalis, E.; Skilodimou, H.D.; Gaki-Papanastassiou, K.; Baltas, E.A. Urban flood hazard assessment in the basin of Athens Metropolitan city, Greece. Environ. Earth Sci. 2016, 75, 319. [Google Scholar] [CrossRef]
  17. Liang, W.; Yongli, C.; Hongquan, C.; Daler, D.; Jingmin, Z.; Juan, Y. Flood disaster in Taihu Basin, China: Causal chain and policy option analyses. Environ. Earth Sci. 2011, 63, 1119–1124. [Google Scholar] [CrossRef]
  18. Sohail, M.T.; Hussan, A.; Ehsan, M.; Al-Ansari, N.; Akhter, M.M.; Manzoor, Z.; Elbeltagi, A. Groundwater budgeting of Nari and Gaj formations and groundwater mapping of Karachi, Pakistan. Appl. Water Sci. 2022, 12, 267. [Google Scholar] [CrossRef]
  19. Ahmad, N.; Khan, S.; Ehsan, M.; Rehman, F.U.; Al-Shuhail, A. Estimating the Total Volume of Running Water Bodies Using Geographic Information System (GIS): A Case Study of Peshawar Basin (Pakistan). Sustainability 2022, 14, 3754. [Google Scholar] [CrossRef]
  20. Vincent, L.T.; Eaton, B.C.; Leenman, A.S.; Jakob, M. Secondary Geomorphic Processes and Their Influence on Alluvial Fan Morphology, Channel Behavior and Flood Hazards. J. Geophys. Res. Earth Surf. 2022, 127, e2021JF006371. [Google Scholar] [CrossRef]
  21. Li, Z.; Zhang, Y.; Wang, J.; Ge, W.; Li, W.; Song, H.; Guo, X.; Wang, T.; Jiao, Y. Impact evaluation of geomorphic changes caused by extreme floods on inundation area considering geomorphic variations and land use types. Sci. Total Environ. 2021, 754, 142424. [Google Scholar] [CrossRef]
  22. Dawod, G.M.; Mirza, M.N.; Al-Ghamdi, K.A. GIS-Based Spatial Mapping of Flash Flood Hazard in Makkah City, Saudi Arabia. J. Geogr. Inf. Syst. 2011, 3, 225–231. [Google Scholar] [CrossRef]
  23. Khalifa, A. Application of Remote sensing techniques in discrimination of rock units and preliminary assessment of tectonic activity using ASTER and ALOSE-PALSAR data at Gabal Delihimmi, Central Eastern Desert, Egypt. Egypt J. Geol. 2023, 67, 287–298. [Google Scholar] [CrossRef]
  24. Bhatt, S.; Ahmed, S.A. Morphometric analysis to determine floods in the Upper Krishna basin using Cartosat DEM. Geocarto Int. 2014, 29, 878–894. [Google Scholar] [CrossRef]
  25. Wilford, D.J.; Sakals, M.E.; Innes, J.L.; Sidle, R.C.; Bergerud, W.A. Recognition of debris flow, debris flood and flood hazard through watershed morphometrics. Landslides 2004, 1, 61–66. [Google Scholar] [CrossRef]
  26. Arnous, M.O.; Green, D.R. GIS and remote sensing as tools for conducting geo-hazards risk assessment along Gulf of Aqaba coastal zone, Egypt. J. Coast. Conserv. 2011, 15, 457–475. [Google Scholar] [CrossRef]
  27. Farhan, Y.; Anaba, O.; Salim, A. Morphometric Analysis and Flash Floods Assessment for Drainage Basins of the Ras En Naqb Area, South Jordan Using GIS. J. Geosci. Environ. Prot. 2016, 4, 9–33. [Google Scholar] [CrossRef]
  28. Hasnaoui, Y.; Tachi, S.E.; Bouguerra, H.; Benmamar, S.; Gilja, G.; Szczepanek, R.; Navarro-Pedreño, J.; Yaseen, Z.M. Enhanced machine learning models development for flash flood mapping using geospatial data. Euro Mediterr. J. Environ. Integr. 2024, 9, 1087–1107. [Google Scholar] [CrossRef]
  29. Alarifi, S.S.; Abdelkareem, M.; Abdalla, F.; Alotaibi, M. Flash Flood Hazard Mapping Using Remote Sensing and GIS Techniques in Southwestern Saudi Arabia. Sustainability 2022, 14, 14145. [Google Scholar] [CrossRef]
  30. Azeez, O.; Elfeki, A.; Kamis, A.S.; Chaabani, A. Dam break analysis and flood disaster simulation in arid urban environment: The Um Al-Khair dam case study, Jeddah, Saudi Arabia. Nat. Hazards 2020, 100, 995–1011. [Google Scholar] [CrossRef]
  31. Shah, S.M.H.; Mustaffa, Z.; Teo, F.Y.; Imam, M.A.H.; Yusof, K.W.; Al-Qadami, E.H.H. A review of the flood hazard and risk management in the South Asian Region, particularly Pakistan. Sci. Afr. 2020, 10, e00651. [Google Scholar] [CrossRef]
  32. Tariq, M.A.U.R.; van de Giesen, N. Floods and flood management in Pakistan. Phys. Chem. Earth Parts A/B/C 2012, 47–48, 11–20. [Google Scholar] [CrossRef]
  33. Ahmad, F.; Kazmi, S.F.; Pervez, T. Human response to hydro-meteorological disasters: A case study of the 2010 flash floods in Pakistan. J. Geogr. Reg. Plan. 2011, 4, 518. [Google Scholar]
  34. Lepesteur, M.; Wegner, A.; Moore, S.A.; McComb, A. Importance of public information and perception for managing recreational activities in the Peel-Harvey estuary, Western Australia. J. Environ. Manag. 2008, 87, 389–395. [Google Scholar] [CrossRef]
  35. Jamshed, A.; Birkmann, J.; McMillan, J.M.; Rana, I.A.; Feldmeyer, D.; Sauter, H. How do rural-urban linkages change after an extreme flood event? Empirical evidence from rural communities in Pakistan. Sci. Total Environ. 2021, 750, 141462. [Google Scholar] [CrossRef]
  36. Ullah, F.; Saqib, S.E.; Ahmad, M.M.; Fadlallah, M.A. Flood risk perception and its determinants among rural households in two communities in Khyber Pakhtunkhwa, Pakistan. Nat. Hazards 2020, 104, 225–247. [Google Scholar] [CrossRef]
  37. Niyazi, B.; Khan, A.A.; Masoud, M.; Elfeki, A.; Basahi, J.; Zaidi, S. Morphological-hydrological relationships and the geomorphological instantaneous unit hydrograph of Makkah Al-Mukarramah watersheds. Arab. J. Geosci. 2021, 14, 751. [Google Scholar] [CrossRef]
  38. Maidment, D.R. Arc Hydro: GIS for Water Resources; ESRI, Inc.: Redlands, CA, USA, 2002. [Google Scholar]
  39. Schumm, S.A. Evolution of drainage systems and slopes in badlands at Perth Amboy, New Jersey. Geol. Soc. Am. Bull. 1956, 67, 597–646. [Google Scholar] [CrossRef]
  40. Strahler, A.N. Hypsometric (area-altitude) analysis of erosional topography. Geol. Soc. Am. Bull. 1952, 63, 1117–1142. [Google Scholar] [CrossRef]
  41. Patton, P.C.; Baker, V.R. Morphometry and floods in small drainage basins subject to diverse hydrogeomorphic controls. Water Resour. Res. 1976, 12, 941–952. [Google Scholar] [CrossRef]
  42. Smith, K.G. Standards for grading texture of erosional topography. Am. J. Sci. 1950, 248, 655–668. [Google Scholar] [CrossRef]
  43. Khalifa, A.; Bashir, B.; Alsalman, A.; Öğretmen, N. Morpho-tectonic assessment of the abu-dabbab area, eastern desert, egypt: Insights from remote sensing and geospatial analysis. ISPRS Int. J. Geoinf. 2021, 10, 784. [Google Scholar] [CrossRef]
  44. Hadley, R.F.; Schumm, S.A. Sediment sources and drainage basin characteristics in upper Cheyenne River basin. Water Supply 1961, 1531, 198. [Google Scholar]
  45. Melton, F.A. Aerial Photographs and Structural Geomorphology. J. Geol. 1959, 67, 351–370. [Google Scholar] [CrossRef]
  46. Weiss, A. Topographic Position and Landforms Analysis, Poster Presentation. In Proceedings of the ESRI User Conference, San Diego, CA, USA, 9–13 July 2001; Volume 64. [Google Scholar]
  47. Alam, A.; Ahmed, B.; Sammonds, P. Flash flood susceptibility assessment using the parameters of drainage basin morphometry in SE Bangladesh. Quat. Int. 2021, 575–576, 295–307. [Google Scholar] [CrossRef]
  48. Abdalla, F.; El Shamy, I.; Bamousa, A.O.; Mansour, A.; Mohamed, A.; Tahoon, M. Flash Floods and Groundwater Recharge Potentials in Arid Land Alluvial Basins, Southern Red Sea Coast, Egypt. Int. J. Geosci. 2014, 5, 971–982. [Google Scholar] [CrossRef]
  49. Abdelkareem, M. Targeting flash flood potential areas using remotely sensed data and GIS techniques. Nat. Hazards 2017, 85, 19–37. [Google Scholar] [CrossRef]
  50. Tan, Q.; Huang, Y.; Hu, J.; Zhou, P.; Hu, J. Application of artificial neural network model based on GIS in geological hazard zoning. Neural Comput. Appl. 2021, 33, 591–602. [Google Scholar] [CrossRef]
  51. Shamy, E. Recent recharge and flash flooding opportunities in the Eastern Desert, Egypt. Ann. Geol. Surv. Egypt 1992, 18, 323–334. [Google Scholar]
  52. Bajabaa, S.; Masoud, M.; Al-Amri, N. Flash flood hazard mapping based on quantitative hydrology, geomorphology and GIS techniques (case study of Wadi Al Lith, Saudi Arabia). Arab. J. Geosci. 2014, 7, 2469–2481. [Google Scholar] [CrossRef]
  53. Davis, J.C. Statistics and Data Analysis in Geology, 3rd ed.; Vascular; John Wiley & Sons, Inc.: Hoboken, NJ, USA, 2002. [Google Scholar]
  54. Mesa, L.M. Morphometric analysis of a subtropical Andean basin (Tucumán, Argentina). Environ. Geol. 2006, 50, 1235–1242. [Google Scholar] [CrossRef]
  55. Reddy, G.P.O.; Maji, A.K.; Gajbhiye, K.S. Drainage morphometry and its influence on landform characteristics in a basaltic terrain, Central India—A remote sensing and GIS approach. Int. J. Appl. Earth Obs. Geoinf. 2004, 6, 1–16. [Google Scholar] [CrossRef]
  56. Tukura, N.G.; Akalu, M.M.; Hussein, M.; Befekadu, A. Morphometric analysis and sub-watershed prioritization of Welmal watershed, Ganale-Dawa River Basin, Ethiopia: Implications for sediment erosion. J. Sediment. Environ. 2021, 6, 121–130. [Google Scholar] [CrossRef]
  57. Gregory, K.J.; Walling, D.E. Drainage Basin Form and Process: A Geomorphological Approach; Edward Arnold: London, UK, 1973. [Google Scholar] [CrossRef]
  58. Hajam, R.A.; Hamid, A.; Bhat, S. Application of Morphometric Analysis for Geo-Hydrological Studies Using Geo-Spatial Technology—A Case Study of Vishav Drainage Basin. Hydrol. Current Res. 2013, 4, 157. [Google Scholar] [CrossRef]
  59. Azor, A.; Keller, E.A.; Yeats, R.S. Geomorphic indicators of active fold growth: South Mountain—Oak Ridge anticline, Ventura basin, southern California. Bull. Geol. Soc. Am. 2002, 114, 745–753. [Google Scholar] [CrossRef]
  60. Pérez-Peña, J.V.; Azor, A.; Azañón, J.M.; Keller, E.A. Active tectonics in the Sierra Nevada (Betic Cordillera, SE Spain): Insights from geomorphic indexes and drainage pattern analysis. Geomorphology 2010, 119, 74–87. [Google Scholar] [CrossRef]
  61. Kabite, G.; Gessesse, B. Hydro-geomorphological characterization of Dhidhessa River Basin, Ethiopia. Int. Soil Water Conserv. Res. 2018, 6, 175–183. [Google Scholar] [CrossRef]
  62. Hare, P.W.; Gardner, T.W. Geomorphic Indicators of Vertical Neotectonism along Converging Plate Margins, Nicoya Peninsula Costa Rica. In Tectonic Geomorphology. Proceedings of the 15th Annual Binghamton Geomorphology Symposium; Allen and Unwin: Boston, MA, USA, 1985; Volume 4, pp. 123–134. [Google Scholar]
  63. Adnan, M.S.G.; Dewan, A.; Zannat, K.E.; Abdullah, A.Y.M. The use of watershed geomorphic data in flash flood susceptibility zoning: A case study of the Karnaphuli and Sangu River basins of Bangladesh. Nat. Hazards 2019, 99, 425–448. [Google Scholar] [CrossRef]
  64. Pawluszek, K.; Borkowski, A. Impact of DEM-derived factors and analytical hierarchy process on landslide susceptibility mapping in the region of Rożnów Lake, Poland. Nat. Hazards 2017, 86, 919–952. [Google Scholar] [CrossRef]
  65. Jebur, M.N.; Pradhan, B.; Tehrany, M.S. Optimization of landslide conditioning factors using very high-resolution airborne laser scanning (LiDAR) data at catchment scale. Remote Sens. Environ. 2014, 152, 150–165. [Google Scholar] [CrossRef]
  66. Pourghasemi, H.R.; Moradi, H.R.; Aghda, S.M.F.; Gokceoglu, C.; Pradhan, B. GIS-based landslide susceptibility mapping with probabilistic likelihood ratio and spatial multi-criteria evaluation models (North of Tehran, Iran). Arab. J. Geosci. 2014, 7, 1857–1878. [Google Scholar] [CrossRef]
  67. Görüm, T. Tectonic, topographic and rock-type influences on large landslides at the northern margin of the Anatolian Plateau. Landslides 2019, 16, 333–346. [Google Scholar] [CrossRef]
  68. De Reu, J.; Bourgeois, J.; Bats, M.; Zwertvaegher, A.; Gelorini, V.; De Smedt, P.; Chu, W.; Antrop, M.; De Maeyer, P.; Finke, P.; et al. Application of the topographic position index to heterogeneous landscapes. Geomorphology 2013, 186, 39–49. [Google Scholar] [CrossRef]
  69. Woods, R.A.; Sivapalan, M. A connection between topographically driven runoff generation and channel network structure. Water Resour. Res. 1997, 33, 2939–2950. [Google Scholar] [CrossRef]
  70. Bashir, B.; Alsalman, A. Morpho-Hydrological Analysis and Preliminary Flash Flood Hazard Mapping of Neom City, Northwestern Saudi Arabia, Using Geospatial Techniques. Sustainability 2024, 16, 23. [Google Scholar] [CrossRef]
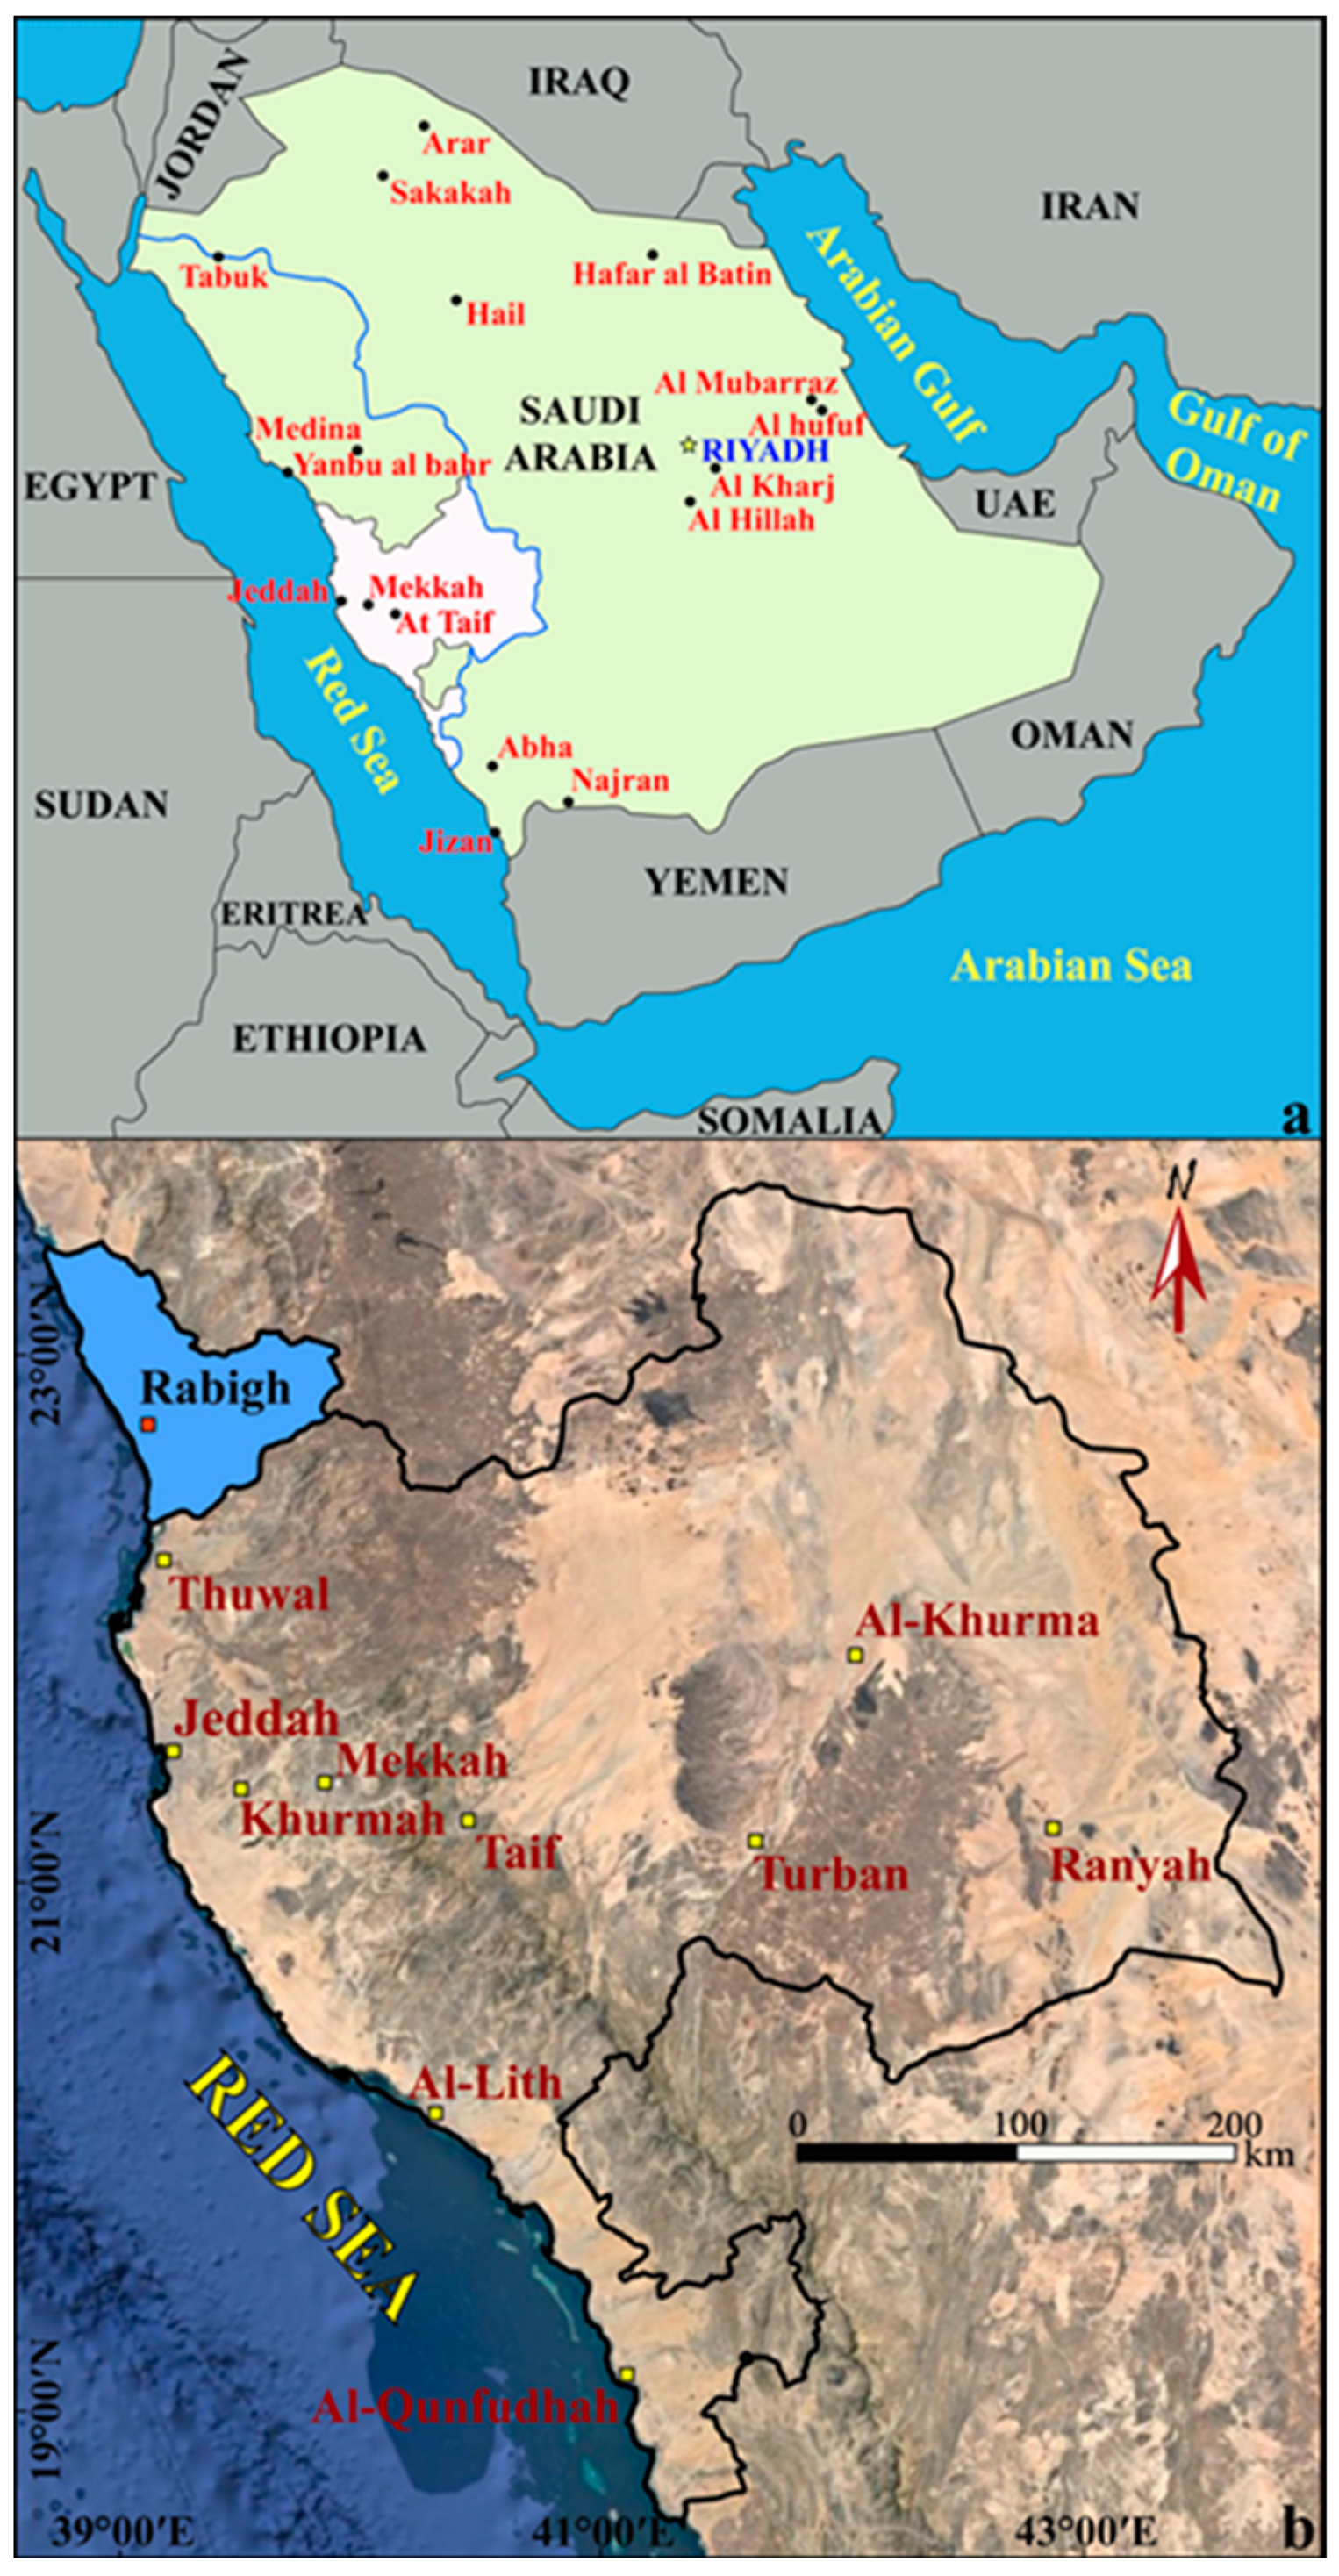
Figure 1. (a) Saudi Arabia Kingdom and the coastal regions around it; (b) map showing the province of Makkah with the zone of Rabigh area in the north.
Water 16 02962 g001
Figure 2. Lithological map of the Rabigh region along the coastal Red Sea zone.
Water 16 02962 g002
Figure 3. Precipitation maps of the Makkah province including the study Rabigh area: (a) rainfall amount for the years 2001–2010; (b) rainfall amount for the years 2011–2020; and (c) rainfall amount for the years 2021–2023. The Rabigh study area is marked by a hollow blue polygon in the most northwestern part.
Water 16 02962 g003
Figure 4. (a) Shaded relief and (b) slope maps of the study zone.
Water 16 02962 g004
Figure 5. Rabigh area basins from 1 to 10 and their stream systems.
Water 16 02962 g005
Figure 6. Methodology flowchart providing applied processing.
Water 16 02962 g006
Figure 7. Maps of morphometric analysis for every morphometric single index. All abbreviations illustrated in these maps were defined in Table 1; numbers indicate the studied basins shown in Figure 5.
Water 16 02962 g007
Figure 8. Levels of flash flooding risk in the research area due to the general watershed approach; numbers indicate basins which are illustrated in Figure 5. It is obvious that the low level of the flood hazard is missing in this map.
Water 16 02962 g008
Figure 9. The results of El-Shamy approach for estimating flood hazards are as follows: (a) depicts the connection between both bifurcation ratio and stream frequency parameters, and (b) shows the association of both bifurcation ratio and drainage density parameters; numbers indicate the studied basins shown in Figure 5.
Water 16 02962 g009
Figure 10. Levels of flash flooding in the research area due to the El-Shamy approach. The numbers indicate the basins shown in Figure 5.
Water 16 02962 g010
Figure 11. Levels of flash flooding in the research area due to the ranked approach; numbers indicate the basins which are illustrated in Figure 5. It is obvious that the low level of the flood hazard is missing in this map.
Water 16 02962 g011
Figure 12. (a) A comparison between the results extracted from the three applied approaches and (b) flooding hazard levels distribution using the combination of the suggested approaches.
Water 16 02962 g012
Figure 13. A topographic map of the Rabigh terrain that displays different reliefs produced by the TPI.
Water 16 02962 g013
Figure 14. Rabigh landscape final flash flood hazard assessment; numbers indicate the studied basins shown in Figure 5.
Water 16 02962 g014
Table 1. Morphometric and topographic parameters tested in the current paper.
IndicesDescriptionReferences
Basin Area in km2 (A)Area from the drainage division to the basin outpoint point[39]
Basin perimeter in km (P)Basin boundary’s whole length.[10,39]
Basin length in km (Lb)The longest stretch of the basin, as measured along the main river that flows through it[39]
Stream number (Ns)Ns = N1 + N2 + N3 + N4 + Nn[40]
Stream length (Ls) in kmLs = L1 + L2 + L3 + L4 + Ln[40]
Stream order (Os)Hierarchical rank[24]
Bifurcation ratio (Rb)Rb = Ns/Ns + 1, as Ns + 1 indicates the number value of the streams in any given order as well as the value of the number for the next higher order.[8]
Stream frequency (Fs)Fs = Ns/A[13]
Form factor (Ff)Ff = A/Lb2[41]
Drainage texture ratio (Rt)Rt = Ns/P[42]
Drainage density (Dd)Dd = Ls/A[43]
Infiltration number (If)If = Fs/Dd[6]
Basin relief (Br) in mBr = Hx. − Hm., where Hx. and Hm. denote the planned basin’s highest and lowest elevations, respectively. [44]
Ruggedness number (Rn)Rn = Dd × (Br/1000), where Br is the basin relief and Dd represents the drainage density.[45]
Elevation-relief ratio (Rr) Rr = Br/Lb[39]
Topographic Position Index (TPI) TPI = M 0 n = 0 n M n / n , where n is the total number of surrounding points included in the evaluation, The model point under the evaluation’s elevation is M0, and the grid’s elevation is Mn.[46]
Table 2. Fundamental geometric characteristics of the suggested basins.
BasinsArea in km2 (A)Perimeter in km (P)Basin Length in km (Lb)Mx. Elevation in mMn. Elevation in m
Dulaidila1095.59227.7649.3013650
Ri Harshah1160.66216.3339.764560
Rabigh194.1495.0622.161610
Algud156.4977.7419.89780
AlNuaibeaa240.1883.8031.4051525
Haqqaq1341.47270.3752.23126725
Hajar449.35131.1927.741326421
Al Jehfa743.09183.2738.335840
Ofoq142.93109.0328.541040
Saabar873.51330.9494.213440
Table 3. Stream characteristics of the study basins.
Stream CharacteristicsBasins
DulaidilaRi HarshahRabighAlgudAl NuaibeaaHaqqaqHajarAl JehfaOfoqSaabar
Stream numbers
Order 14438678431419630
Order 21211122103427
Order 32211141212
Order 411---1-1-1
Stream total orders59528911581826940
Stream length412.54381.9667.6850.5330.7435.41122.82252.2415.50326.16
Table 4. Values of the morphometric indices of the 10 studied basins.
BasinsNsLsRbFsFfRtDdIfBrRnRr
Dulaidila59412.543.885.380.450.253.7620.2713655.2428.23
Ri Harshah52381.963.654.480.730.243.2914.744561.5511.86
Rabigh867.683.54.120.390.083.4814.361610.597.71
Algud950.532.756.390.390.123.2220.63870.304.72
AlNuaibea’a1130.7434.570.240.131.275.864900.6215.60
Haqqaq5835.415.44.320.490.210.261.1412420.3223.77
Hajar18122.822.5540.580.132.7310.949052.4732.62
Al Jehfa26252.242.913.490.500.143.3911.875842.0515.78
Ofoq915.502.56.290.170.081.086.831040.124.16
Saabar40326.163.265.570.090.123.7317.0913445.0714.41
Table 5. Flash Flooding hazard evaluation due to the ranking approach.
BasinsNsLsRbFsFfRtDdIfBrRnRrAverage Ranked Levels
Dulaidila331.951.692.12312.963.132.692.61
Ri Harshah2.722.841.792.3132.881.262.391.532.441.542.261
Rabigh11.261.682.561.9311.162.351.32.181.241.672
Algud1.031.171.1711.931.471.3031.42.921.031.622
AlNuaibea’a1.111.071.342.251.461.582.421.481.612.801.801.722
Haqqaq2.961.1032.422.252.52312.762.922.372.391
Hajar1.391.541.032.642.531.581.5822.242.0831.962
Al Jehfa1.702.191.2832.281.701.212.101.882.241.811.992
Ofoq1.03111.061.2512.531.581.19311.422
Saabar2.252.561.521.5611.471.012.632.961.061.721.842
Disclaimer/Publisher’s Note: The statements, opinions and data contained in all publications are solely those of the individual author(s) and contributor(s) and not of MDPI and/or the editor(s). MDPI and/or the editor(s) disclaim responsibility for any injury to people or property resulting from any ideas, methods, instructions or products referred to in the content.