Article

Assessment of Ecological Hazards in the Inaouen Wadi and Its Tributaries Using the Presence of Potentially Toxic Elements in Its Sediments

1
Laboratory of Plant, Animal and Agro-Industry Production Laboratory, Faculty of Sciences, Ibn Tofail University, Kenitra 14000, Morocco
2
Centre de l’Oriental des Sciences et Technologies de l’Eau et de l’Environnement (COSTEE), Université Mohammed Premier, Oujda 60000, Morocco
3
Polyvalent Team in Research and Development, Polydisciplinary Faculty, Sultan Moulay Slimane University, Beni Mellal 23000, Morocco
4
Laboratory of Functional Ecology and Environmental Engineering Faculty of Sciences and Technology, Sidi Mohamed Ben Abdellah University, Fez P.O. Box 1796, Morocco
5
High Institute of Nursing Professions and Health Techniques, Fez, Morocco
6
Department of Biology, College of Science, Princess Nourah bint Abdulrahman University, P.O. Box 84428, Riyadh 11761, Saudi Arabia
7
Laboratoire d’Amélioration des Productions Agricoles, Biotechnologie et Environnement (LAPABE), Faculté des Sciences, Université Mohammed Premier, Oujda 60000, Morocco
8
Department of Pharmacognosy, College of Pharmacy, King Saud University, P.O. Box 2457, Riyadh 11451, Saudi Arabia
*
Authors to whom correspondence should be addressed.
Water 2024, 16(20), 2936; https://doi.org/10.3390/w16202936
Submission received: 6 September 2024 / Revised: 11 October 2024 / Accepted: 12 October 2024 / Published: 15 October 2024
(This article belongs to the Special Issue Water Quality Assessment of River Basins)

Abstract

:
Inaouen wadi is the second largest tributary of the Sebou river, one of Morocco’s major rivers, which holds significant economic and social importance. Unfortunately, this watercourse is severely impacted by pollution from various human activities, particularly industrial sources. However, available data on the presence of potentially toxic elements (PTEs) that could harm human health in this region remain limited. PTEs pose major environmental risks due to their toxicity, persistence, and bioaccumulation. This study aimed to assess the concentrations of PTEs in the sediments of Inaouen wadi and its main tributaries based on sediment samples collected from 12 locations in 2019. The concentrations of Cd, Pb, Cr, Ag, Al, Cu, Fe, and Zn were measured using inductively coupled plasma atomic emission spectroscopy (ICP–AES), and sediment contamination levels were evaluated using multiple indices: the enrichment factor (EF), the geo-accumulation index (Igeo), the potential ecological hazard index (RI), and the modified ecological risk index (MRI). The results indicate that concentrations of Pb, Cd, Cr, Cu, Fe, and Zn are significantly influenced by urban discharges, particularly at sites S1, S3, and S5 near the cities of Taza and Oued-Amlil. The maximum values recorded were 7.01 g/kg for Pb, 0.9 g/kg for Cd, 0.1 g/kg for Cr, 19.9 g/kg for Fe and 1.9 g/kg for Zn. The enrichment factor (EF) revealed anthropogenic sources of Fe and Pb, confirming the human origin of these elements. The geo-accumulation index (Igeo) showed that the areas around stations S1, S3, and S5 are highly contaminated by Pb, Cd, and Fe, a finding also supported by the MRI. The study identified potential ecological risks at stations S1, S3, and S5, highlighting the urgent need for improved pollution management practices to mitigate environmental risks.

1. Introduction

The contamination of water, soil, and sediment by potentially toxic metals (PTMs) has become a serious environmental concern in many developing countries, including Morocco [1,2,3]. Human activities, such as agriculture, mining, industry, artisanal work, and the production of domestic waste, have impacted the quality of aquatic environments [4]. The severity of these effects increases when effluents are released into the environment without pretreatment. Aquatic ecosystems, particularly rivers and oceans, are the primary recipients of toxic metals, and even slight changes in environmental conditions can disrupt their normal functioning. The presence of heavy metals in rivers poses a threat to biodiversity and human health due to heavy metals’ toxicity, persistence, and ability to accumulate in the food chain [5,6,7,8,9].
Sediment is a vital component of river systems, formed through the transport and deposition of materials by watercourses [10]. It plays a crucial role in river and lake ecosystems. During various physicochemical processes, suspended solids and ions present in the water are adsorbed and accumulate in riverbed sediment [11]. However, when external conditions change, heavy metals can be released into the water, increasing the potential ecological risks to aquatic systems and human health [12].
Due to their persistence, toxicity, and ability to bioaccumulate in food webs, contaminant inputs, particularly those of potentially toxic elements (PTEs), can affect aquatic species directly and have indirect effects on the health of humans [5,7,8,9]. An effective method for evaluating the presence of PTEs in rivers that originate from both natural and human activities is to analyze the sediment on the riverbed [13,14,15]. The reason for this is because sediment possesses a significant ability to retain PTEs and functions as a reservoir for contaminants [16,17].
The geochemical cycling of elements, such as manganese oxides, iron, clays, carbonates, organic matter, and residual fractions, is predominantly controlled by sediment components [18]. Nonetheless, the behavior of PTEs in sediment is contingent upon many biogeochemical processes [19]. In fact, under certain physicochemical circumstances, such as differences in pH, dissolved oxygen, or redox potential, these substances may be released into the dissolved phase and become more easily absorbed by living organisms [20,21]. Moreover, semi-arid basins, which experience extended periods of drought and get little rainfall, are especially vulnerable to pollution by PTEs [22,23], as is the case for the Inaouene wadi. Thus, the purpose of this investigation is, firstly, to study the concentrations of PTEs in sediments of the Inaouene wadi and its tributaries. Secondly, we will determine the degree of contamination in the sediments studied, the potential sources of contamination, and the hazards of adverse effects on the aquatic environment through the calculation of indices and enrichment factors. Finally, we will perform a statistical analysis of the obtained data using principal component analysis (PCA) to identify associations between the PTEs and sampling stations [24].

2. Materials and Methods

2.1. Study Area

To obtain a more accurate sample of the watercourses, we chose eleven specific locations along the Inaouene wadi. Out of these, six locations (S1, S2, S5, S7, S9, and S10) represented the primary tributaries of the Inaouene wadi. The remaining five locations (S3, S4, S6, S8, and S11) were situated on the bed of the wadi. Additionally, the twelfth location (S12) corresponds to the Idriss the first dam (Idriss I dam), also known as Barrage Idriss I, as depicted in Figure 1. The sampling sites (Figure 1) were selected to include a diverse range of activities in the research region, including wastewater discharge and household, industrial, and agricultural activities, as shown in Appendix A. The stations were chosen based on their accessibility and their ability to highlight the key features of the wadi and its tributaries.

2.2. Sampling and Pre-Processing of Samples

The sediment samples were collected in 2019, with careful attention given to precisely determining the time of sampling. Surface sediment samples, taken from the top 0 to 5 cm deep, were collected following the methodologies described in studies conducted by Branchu et al., and Lionard and Coquery in 2013 [25,26]. A modified Ekman dredge was used to sample sediment at the 12 stations along the main course of the Inaouene Wadi, taking into account variations observed after the confluence with the tributaries (Figure 1). These samples were collected underwater from the riverbanks and were carefully stored in polyethylene bottles to ensure their integrity. In the field, the samples from each site were thoroughly mixed to ensure a homogeneity that was representative of the local conditions. Each set of samples was sealed, labeled, and transported in coolers maintained at a constant temperature of 4 °C to preserve their physicochemical characteristics. Once in the laboratory, the sediments were air-dried to remove residual moisture without affecting their chemical composition. The dried material was then divided into four equal parts and carefully ground using an agate mortar to avoid external contamination. The parts were subsequently sieved into three distinct granulometric fractions: fine particles (diameter ≤ 63 µm), medium-sized particles (63–200 µm), and coarse particles (200–2000 µm). This granulometric separation enabled the study of variations in heavy metal concentrations across different grain sizes, thus providing detailed information on the distribution of pollutants within the sediment.

2.3. Physicochemical Treatments and Analyses

The main physicochemical analyses of the samples were focused on characterizing concentrations of Cadmium (Cd), Lead (Pb), Chromium (Cr), Silver (Ag), Aluminum (Al), Copper (Cu), Iron (Fe), and Zinc (Zn) and the geochemical processes that affect their dynamics. Concentrations of the elements were measured using the inductively coupled plasma atomic emission spectroscopy method (ICP–AES) [27].
The sediment digestion process was performed according to the method outlined by da Silva et al. in 2014 [28]. Subsequently, metals were assessed using ICP–AES in a laboratory at the Innovation Campus of the Mohammed Ben Abdallah University in Fez. This instrument operated in simultaneous mode. The experimental conditions were as follows: power: 1.3 kW; plasma gas flow: 15 L/min; auxiliary gas flow rate: 1.5 L/min; nebulization pressure: 200 kPa; stabilization time: 20 s; reading time per replicate: 5 s; pump speed: 15 rpm; and end flush time: 30 s. The standard solution employed was Merck’s premium Certipur®, available in both single- and multi-element forms (1000 mg/L). The Certipur® standards are traceable to NIST SRM.

2.4. Quality Indexes

2.4.1. The Enrichment Factor (EF) and Geo-Accumulation Index (Igeo)

The enrichment factor (EF) is a calculation method introduced in the early 1970s to investigate the source of metallic elements in the atmosphere [29]. It has since been applied to sediment analysis [30]. This tool helps to assess the extent of enrichment of each element in the examined soils and sediments and to determine whether this enrichment is natural or the result of human activities. Aluminum, considered an inert and immobile detrital element, is used as a reference in the EF formula (Equation (1)) for calculation purposes [30,31].
E F = C n / X n s a m p l e C r / X r r e f e n c e
In the formula, Cn and Cr represent the concentrations of the specific element in the soil under study and in the reference local geochemical background (LGB), respectively, while Xn and Xr represent the concentrations of aluminum (the occurring element’s concentration in the Earth’s crust, also known as Clarke values) in the soil under study and in the LBG, respectively.
The geo-accumulation index (Igeo) was determined to assess the anthropogenic nature of sediment contamination by PTEs and to determine the difference in concentrations between elements found in the sediments and the mean concentrations that naturally exist in the continental plate [25,32] (Equation (2)).
I g e o = l o g C n 1.5 X B n
where Cn represents the concentration of the PTE in the sediment and Bn represents the average value of the PTE in the upper continental plate [33]. Igeo has a categorization system consisting of seven levels. A value of Igeo less than or equal to zero indicates that the contamination level is at level 0 and the sample is basically uncontaminated. A value of 0 < Igeo < 1 represents level 1 and indicates that the sample is in an uncontaminated to moderately contaminated condition. A value of 1 < Igeo < 2 corresponds to level 2 and indicates that the sample is in a moderately contaminated condition. A value of 2 <Igeo< 3 represents level 3 and indicates that the sample is in a condition of moderate to heavy contamination. A value of 3 < Igeo < 4 corresponds to level 4 and indicates that the sample is in a heavily contaminated condition. A value of 4 < Igeo < 5 represents level 5 and indicates that the sample is in a condition of heavy to extreme contamination. An Igeo value greater than 5 corresponds to level 6 and indicates that the sample is in an extremely contaminated condition.

2.4.2. Ecological Hazard Factor (Eh), Potential Ecological Hazard Index (RI) and Modified Potential Ecological Risk Index (MRI)

As described by Solomon et al. (2000) [34], the ecological hazard assessment index, also called the potential ecological risk index (RI), was performed by determining the ecological hazard factor (Eh), using Equation (3), according to the method established by Hakanson (1980) [31] to estimate the hypothetical effect of PTEs in sediments on organisms in the aquatic ecosystem.
E h = T r × C f
where “Tr” is a coefficient that indicates a specific toxicity index for each PTE, and Cf is the contamination coefficient calculated by dividing Cd (the present concentration of heavy metals in sediments) by Cr (the pre-industrial record of heavy metal concentrations in sediments).
The potential ecological hazard index (RI) was calculated by the sum of the Eh evaluated at every single site using Equation (4).
R I = E h
The composition of local bedrock was used as a reference.
The classification of Eh is as follows: an Eh < 40 indicates a low potential for ecological hazard; 40 < Eh < 80 indicates a moderate potential for ecological hazard; 80 < Eh < 160 indicates a considerable potential for ecological hazard; an Eh between 160 and 320 indicates a high potential for ecological hazard; and an Eh value above 320 indicates a very high potential for ecological hazard. The ecological hazard potential index (RI) is categorized into the following ranges: an RI value of 150 is categorized as a minor ecological danger, a value between 150 and 300 is considered a moderate ecological hazard, a value between 300 and 600 is defined as a large ecological hazard, and a value equal to or more than 600 is considered a very high ecological risk.
Modified potential ecological risk index.
The potential for heavy metal contamination is determined by both the overall concentration of heavy metals and their specific chemical forms. A study on the correlation between the speciation of heavy metals and their bioavailability has shown that the speciation of heavy metals may significantly impact their bioavailability. However, up until now, risk assessment models have not considered the chemical speciation of heavy metals, focusing only on their overall concentrations [35].
The formulae to calculate the MRI are as follows [34]:
Ĉ d = C d × Ω
where Ω = A∂ + B
Ĉ f = Ĉ d / C r
Ê h = T r × Ĉ f
M R I = Ê h
where Ĉf, Ĉd, Êh, and MRI are the modified forms of Cf, Cd, Eh, and RI, respectively; Ω is the modified index of heavy metal concentration; A is the percentage of Metal in carbonate and exchangeable fractions presented in the Table 1; B is the value of 1-A; is the toxic index corresponding to different ratios of exchangeable and carbonate fractions. The value listed in Table 2 was obtained according to Zhu et al. (2012) [35].

2.5. Statistical Methods

The statistical data analysis was conducted through the following steps using SPSS (V21) and R Studio software (Version 2023.3.0.386). Initially, we carried out a normality test through the Shapiro–Wilk test at a 5% significance to prove the homogeneity of variances. The results were standardized by applying Z-score normalization; this step was crucial because it centered the variables around zero, which could help reveal similarities based on patterns rather than absolute values. This is important because HAC, the test applied afterwards, relies on the distance between observations to perform clustering, thus offering insights into the similarities and differences between variables and facilitating the reduction of results into clusters [35]. Subsequently, principal component analysis (PCA) was undertaken for all samples. PCA was selected as a powerful analytical tool in this research article due to its ability to uncover latent patterns within complex datasets. By reducing the dimensionality of integrated water chemistry variables, PCA facilitated the identification of dominant chemical sources, the detection outliers, and the visualization of relationships among variables.

3. Results

3.1. Sediment Grain Size

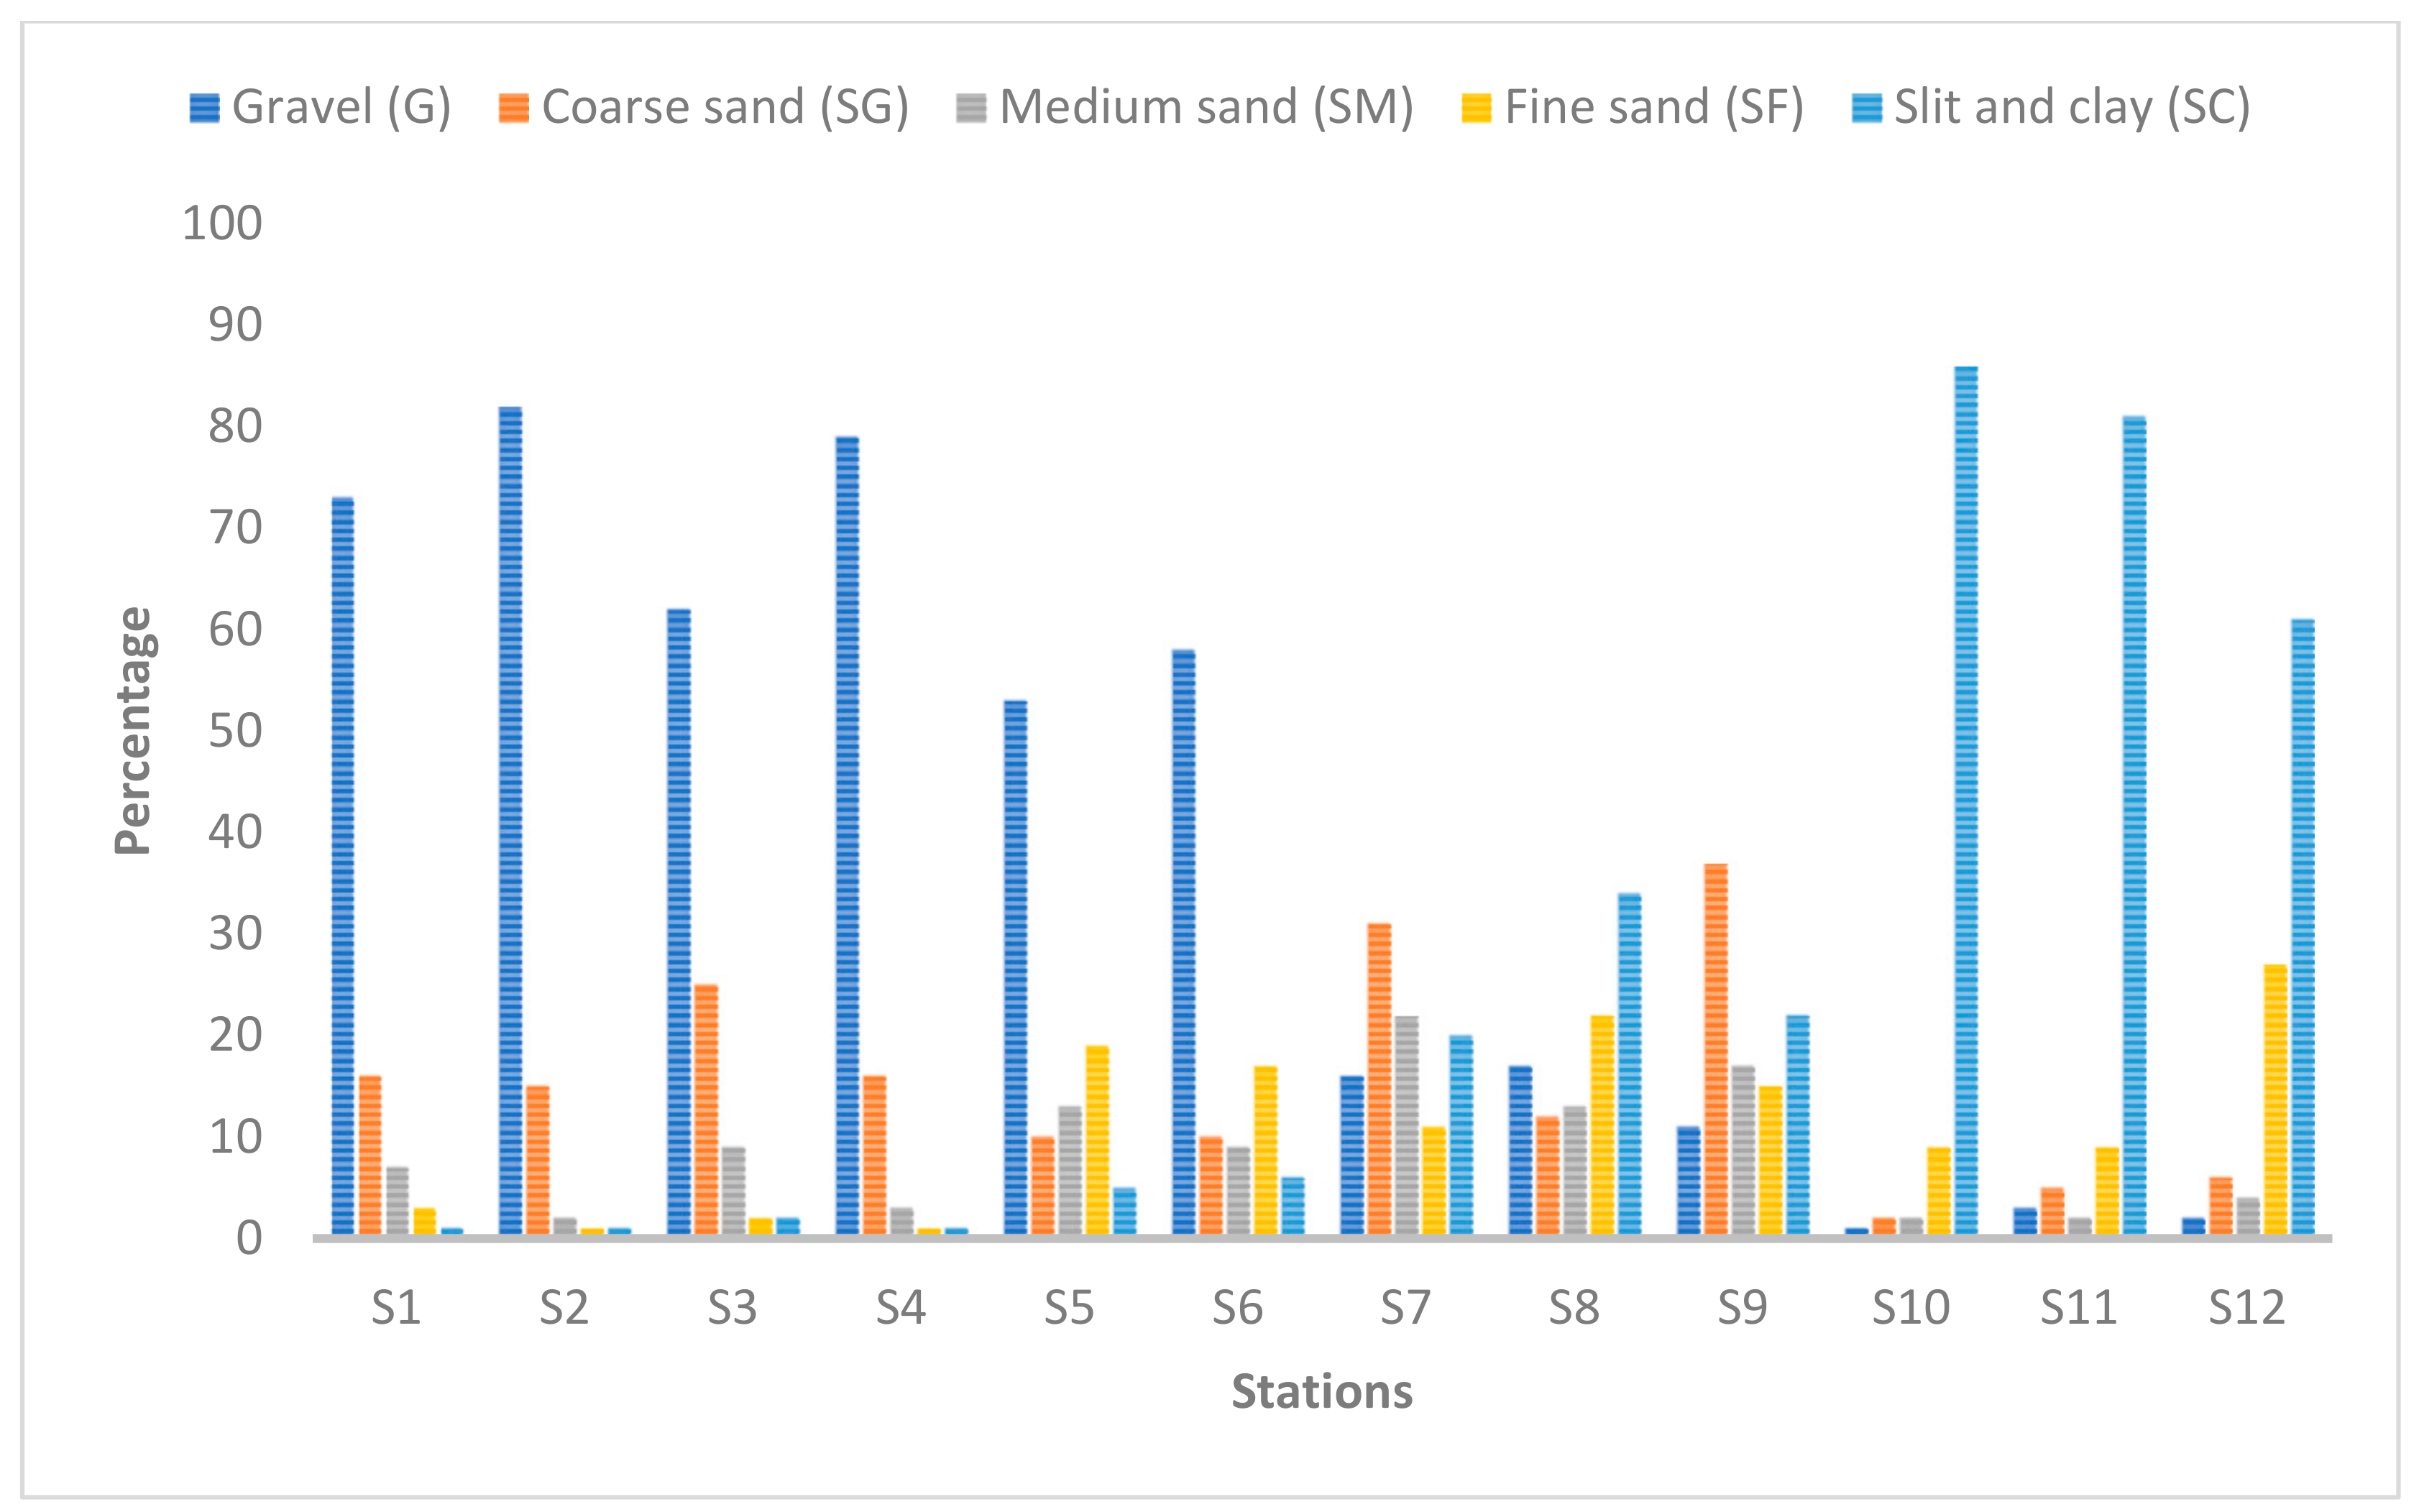
Granulometry allowed us to determine the distribution of sedimentary particles along the Inaouene wadi. Sedimentary particle categories were classified according to their size, provided the relative proportions of these categories as a percentage of the total sediment mass, and subsequently, were used to deduce the texture of the soil studied (Figure 2).
Particle sizes in the sediment varied among locations (Figure 2) such that sediments at each location could be assigned to classes. Gravels were the most dominant at the upstream level of the Inaouene (S1, S2, S3, S4, S5 and S6). However, near the Idriss I dam, at locations S10, S11, and S12, fine elements appeared to dominate, with proportions up to 86%. Similarly, clay and silt dominated at site S8 with 34%. Conversely, at sites S7 and S9, coarse sand had the greatest percentages of 31% and 37%, respectively.
The geology of the Inaouene watershed [36] is characterized by limestone and the dolomitic outcrops of the northern Middle Atlas as well as the carbonate terrains of the pre-rific zone, where eroding agents (wind, rain, frost) tear off fine particles or whole fragments of carbonate rocks. Then, these elements are moved towards the lowest point of the Inaouene wadi.

3.2. Trace Elements in Sediments

Concentrations (g/kg) were determined in the sediment samples. Except for Cu, which remained at the same concentration, a value below 0.011 g/kg, at all the stations studied, the concentrations of all the other PTEs changed from one station to another. For instance, the Al concentration oscillated between 0.05 and 2.08 g/kg (Figure 3).
Based on these results, it can be concluded that, overall, the sediment in the Inaouene wadi contains relatively high concentrations of the elements studied. Concentrations of PTEs in the main stem of the Inaouene wadi (S3, S4, S6, S8 and S11), Larbaa wadi (S1), and Amlil wadi (S5) were greater than those found in sediments at Lahdar wadi (S2), Zirg wadi (S7), Bouhlou wadi (S9), and Matmata wadi (S10). Also, the stations where the concentrations are very great are those close to urban agglomerations; these concentrations decrease progressively from upstream to downstream.
This decrease in the Inaouene wadi and its main tributaries could be linked to the distance from the point of discharge of treated water (S1) or from the points of discharge of gray water from riparian sources. At the same time, this evolution is triggered by several phenomena, including the adsorption, desorption, suspension, and absorption of these trace elements [37,38].
These phenomena are influenced by several factors, such as the pH of the water, the content of organic matter in the sediment and the suspended matter in the water [39,40]. An alkaline pH in water favors the adsorption of metals on colloids and sediments [41]. Alternatively, the slight decrease in water pH observed downstream in this river (with values ranging from 8.02 at the upstream stations to a minimum of 7.23 at the downstream stations) could reduce the adsorption of several metallic elements, which would then be carried through the water in this environment [42].
The assimilation and concentration of metals by aquatic plants and macrophytes, which are widely known to occur [43,44], could also contribute to a decrease in concentrations of trace metals in sediments due to the absorption of metals directly from the water column or from the pore water of sediments.
Concentrations of PTEs obtained in the sediment samples of the present study were compared with those of other rivers in Morocco (Table 3).

3.3. Statistical Analysis

Results of the hierarchical analysis suggest two main groups of sediments according to concentrations of PTEs (Figure 4). The number of clusters was chosen according to the minimum number of clusters that explain most of the variation in PTE concentrations in the sediment samples. Thus, group 1 is composed of soil samples from the upstream region of the Inaouene wadi (S1, S3, S4, S5 and S6), which is characterized by the presence of a great pollution load due to domestic and industrial discharge (mainly at its margins), agricultural discharge from the city of Taza for S1 and S3, and discharge with larger concentrations of Fe, Pb and Zn in the Amlil wadi for S5. Group 2 includes samples from the downstream region of the Inaouene wadi and its left bank tributaries (S7, S8, S9, S10, S11 and S12). This is mainly due to the low levels of PTEs in the water of these stations, which are characterized by good water quality [45]. It is noteworthy that S2, which is located upstream of the Inaouene wadi, also belongs to group 2 since this station is characterized by a lesser concentration of PTEs according to Figure 3.
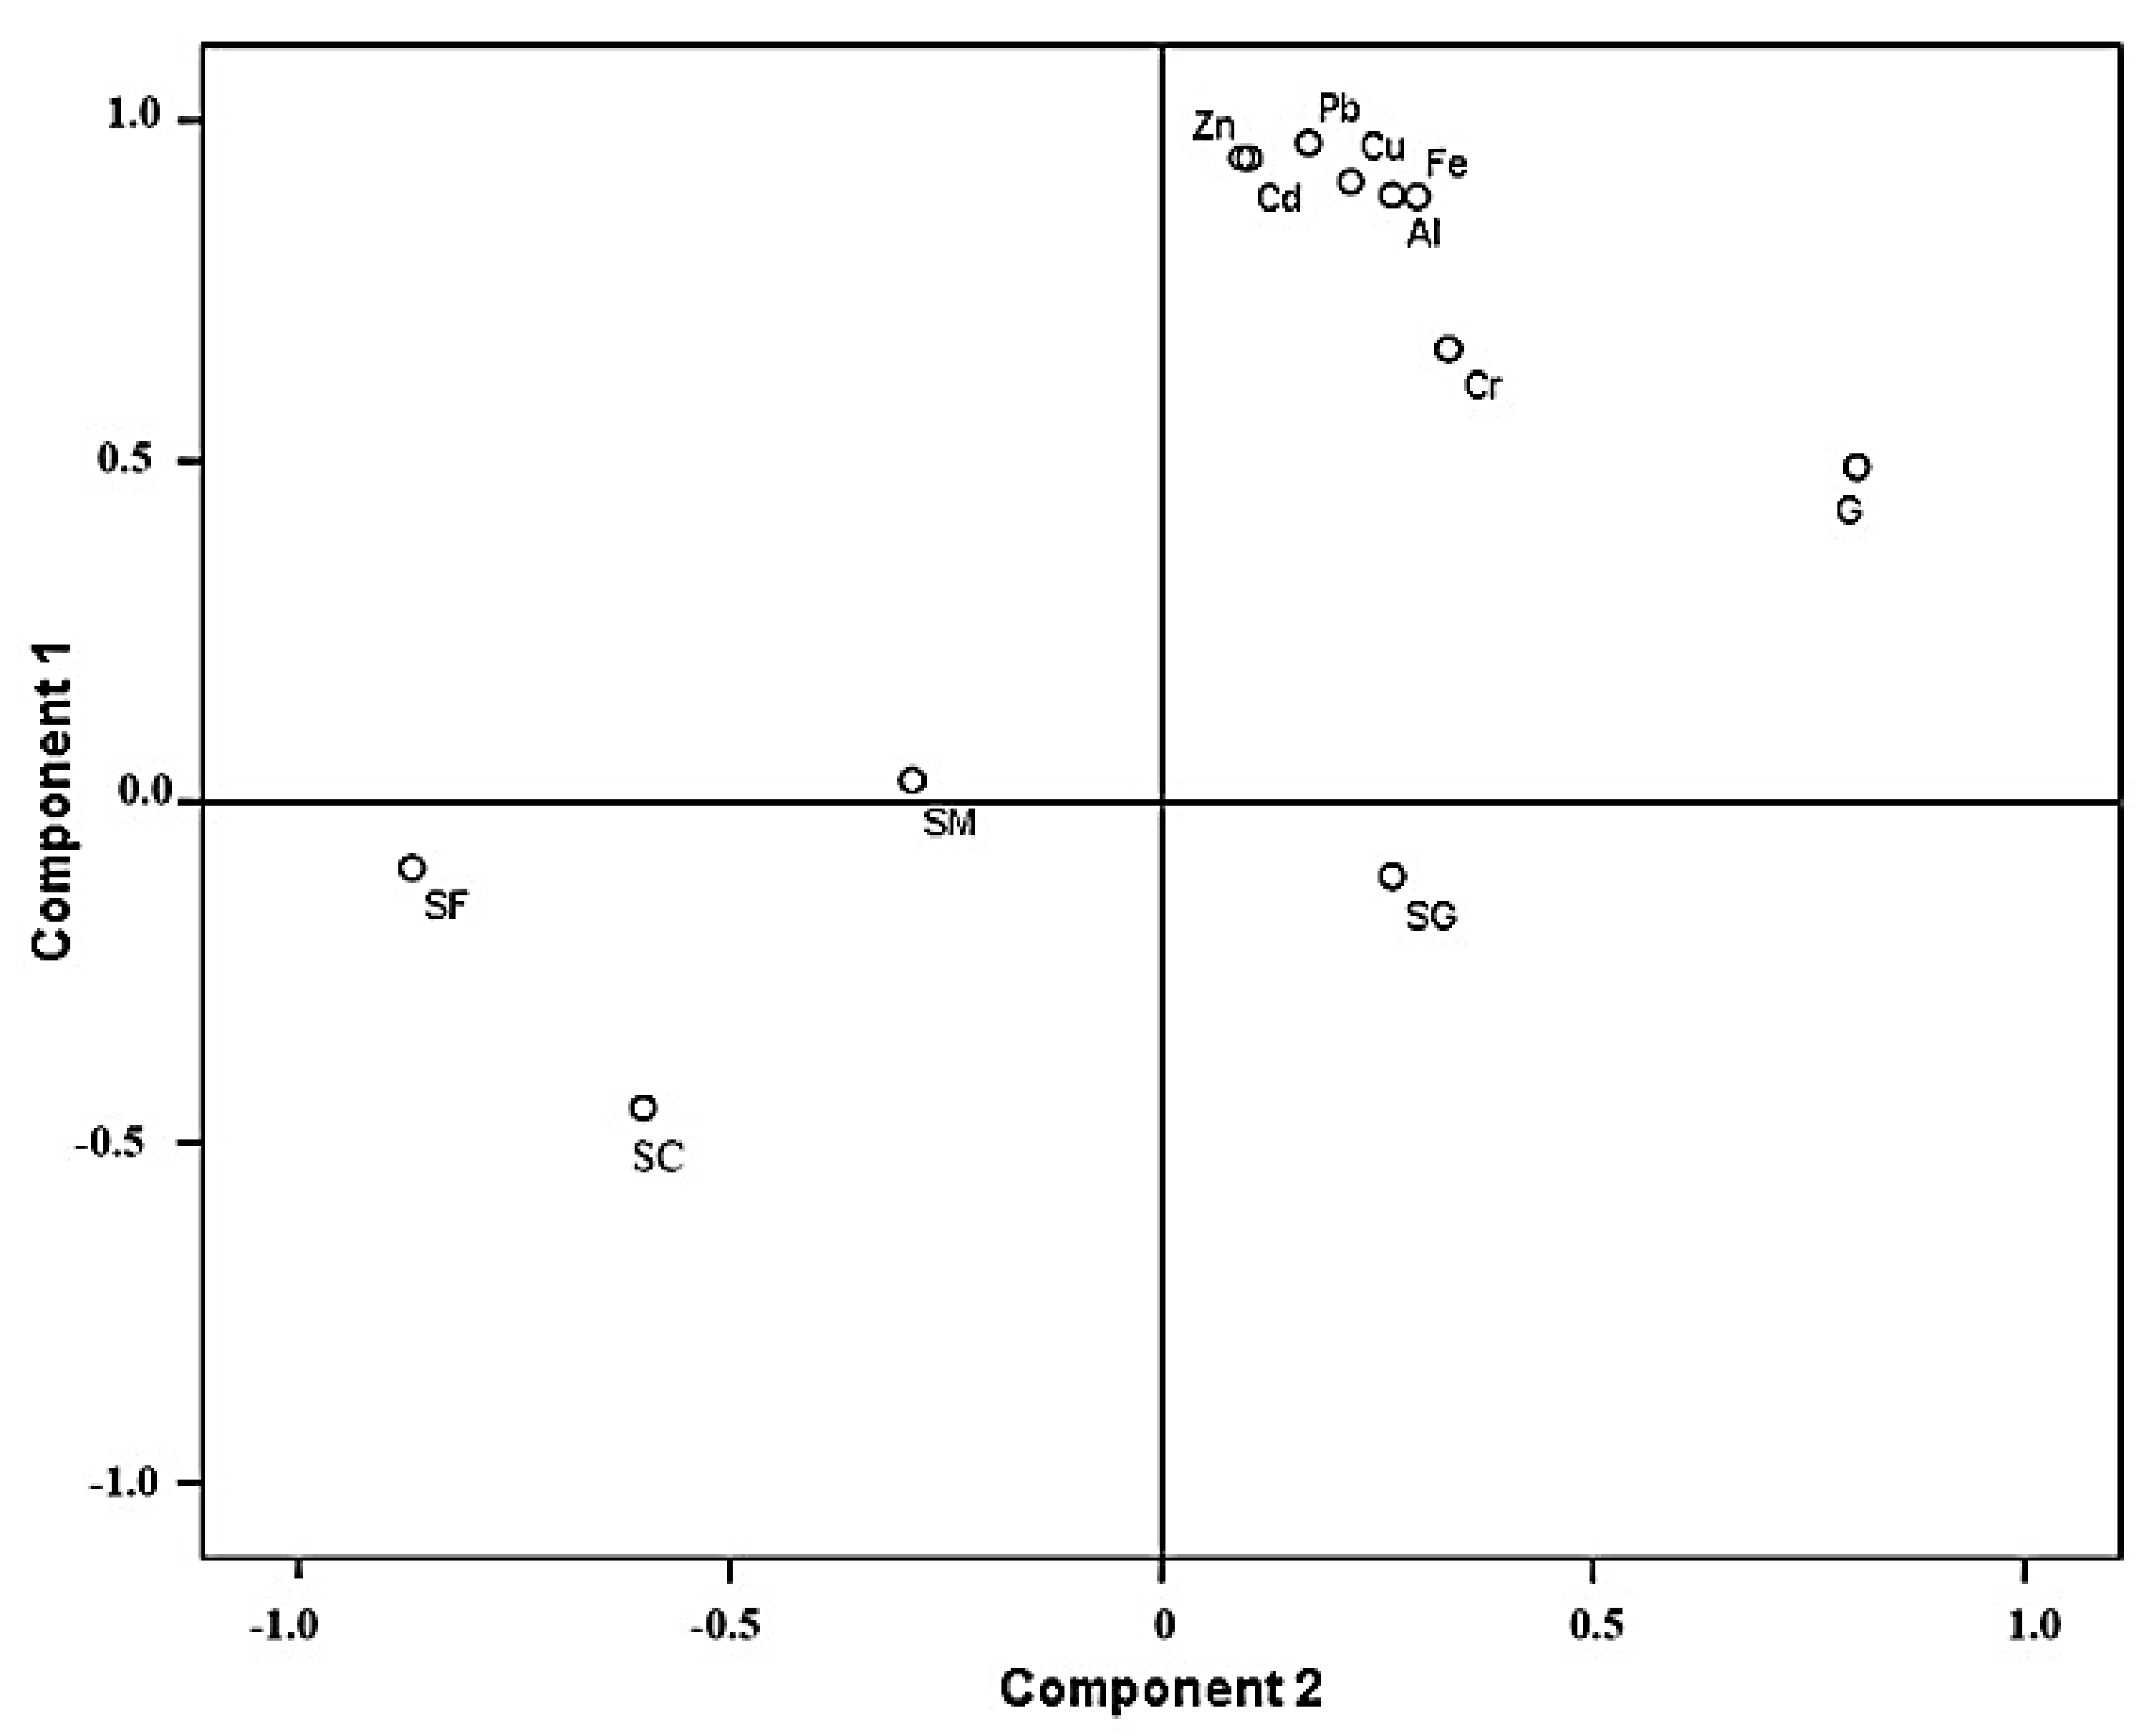
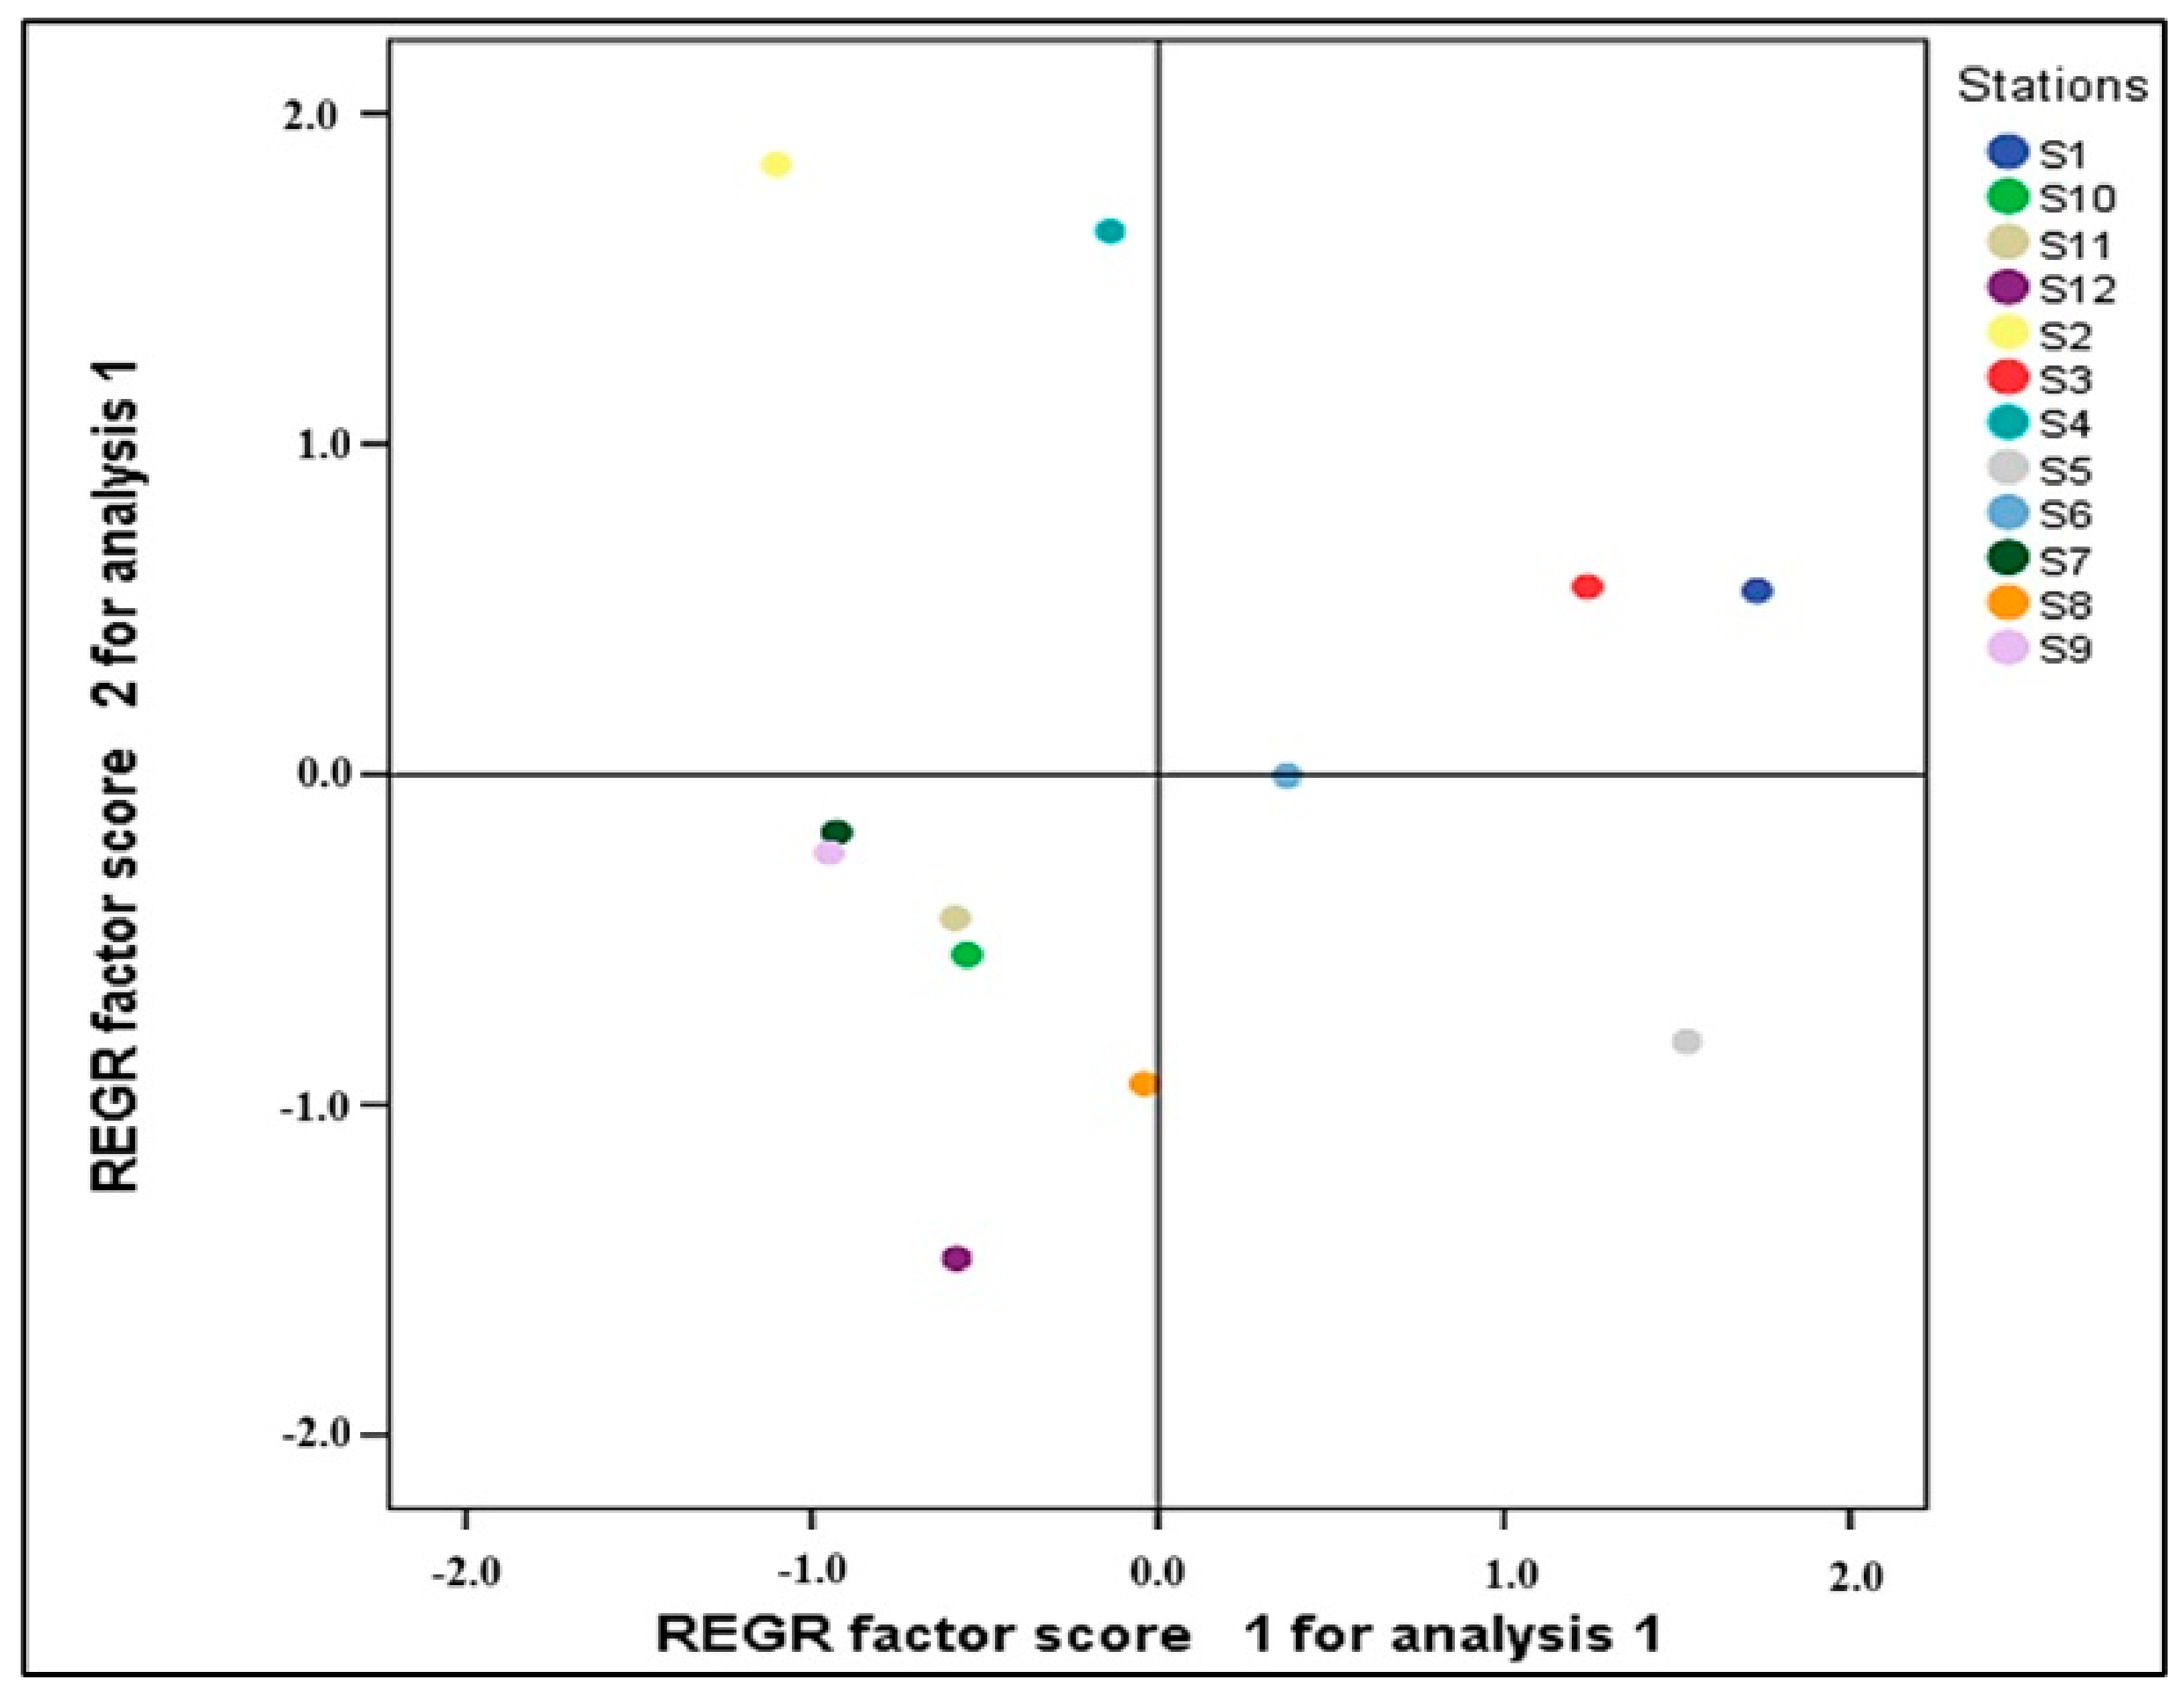
Analyses of the heavy metal concentrations and granulometric composition of bottom sediments from the river at each station revealed a significant level of water pollution by these toxic elements, with high values of Cd, Fe, Al, Zn, and Pb. To determine the relationship between trace metal elements, sediment granulometry, and the distribution of stations based on these characteristics, 12 environmental variables were evaluated using principal component analysis (PCA). The PCA analysis identified two significant variables, Component 1 and Component 2, with eigenvalues over 1.0. Component 1 accounted for 57.52% of the variation and showed a substantial and positive correlation with the amounts of Cd, Cu, Al, Zn, and Pb (Figure 5). Component 2, which accounted for 18.83% of the variation, had a substantial negative correlation with concentrations of Al. By projecting the sample sites perpendicular to the individual PTE vectors or extending them beyond the origin of the coordinate system, we may estimate the background sediment concentration (Figure 6). The highest levels of Cd, Cu, Al, Zn, and Pb were found at stations S1 and S3, whereas the lowest levels were seen at sample locations S7, S8, S9, S10, S11, and S12. Component 2 had a positive correlation with gravel content and a negative correlation with fine sand content. The angle formed by the vectors of the different metals give insights into their interrelationships. The connection between variables is larger as the angle decreases but, when the angle reaches 90°, there is no association. The investigation revealed a significant link between the concentrations of PTEs in the bottom sediments and the amount of gravel present. However, no correlation was found between PTE concentrations and the levels of clay, silt, and sand.

3.4. Pollution Indexes and Ecological Hazards

3.4.1. The Geo-Accumulation Index (Igeo)

The geo-accumulation index (Igeo) was used to evaluate the degree of contamination by PTEs in the sediment at the bottom. The Igeo values for Cu and Cr were found to be below zero, indicating that they may be categorized as uncontaminated with these elements. Igeo values for Al were less than 1 except at four locations, S1, S3, S5 and S6. At these locations, the Igeo values were slightly greater than 1.0, which indicated that these stations can be classified as highly to extremely contaminated with Al. The greatest contamination was with Fe, Cd and Pb, and was noted at stations S1, S3, S4, S5 and S6; these stations were considered extremely polluted with these elements. Meanwhile, the others were classified as polluted to heavily polluted with these elements. For Zn at all the other locations—except for S7 and S9, which showed Igeo values less than 0—Igeo values greater than 0 were observed. Thus, according to Igeo classification, the background sediment of the sampling sites S7 and S9 are practically uncontaminated with Zn. Meanwhile, the sediment samples from S10, S11, S4, S6, and S8 showed moderate contamination, with Igeo values greater than 1.0. Whereas those of S1, S3, and S5 displayed heavy contamination, with Igeo values greater than 4.0, which demonstrates severe pollution of the background sediments (Figure 7).

3.4.2. The Enrichment Factor (EF)

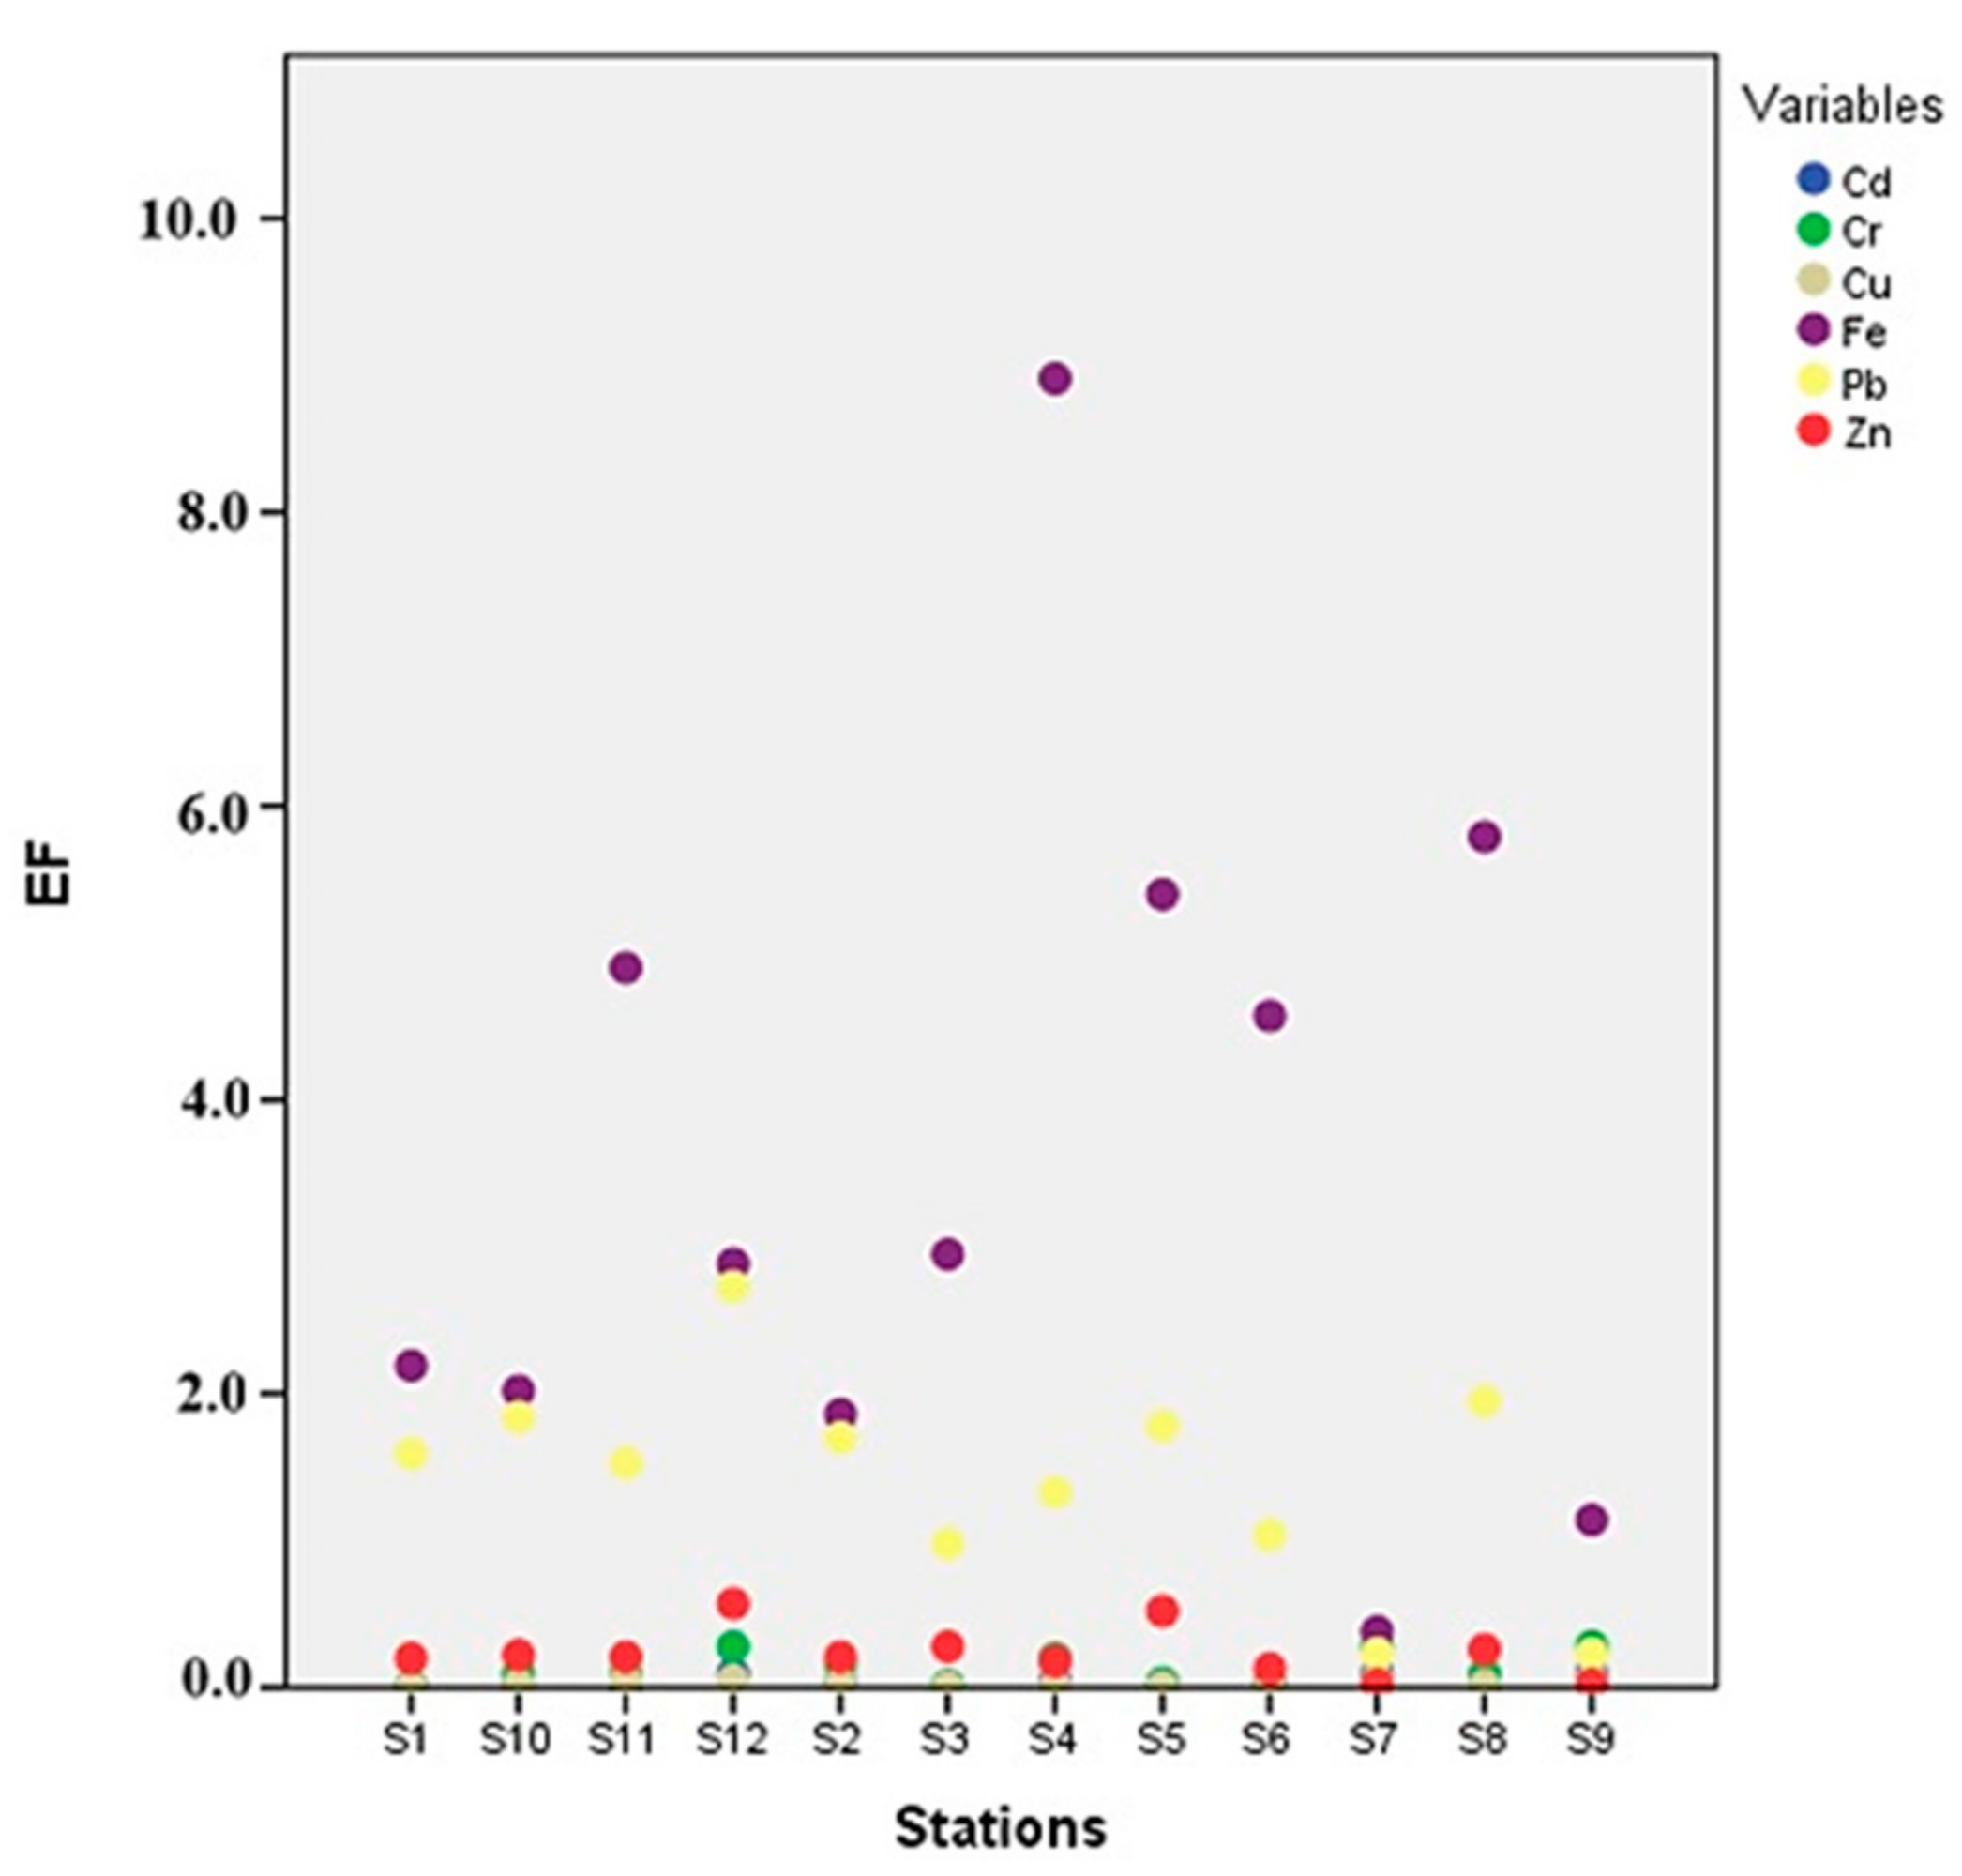
The enrichment factor (EF) was used to identify potential sources of PTEs. For Cr, Cd, Cu, and Zn, EF values were generally below 1.0 (Figure 8), indicating that these PTEs might have a natural origin resulting from weathering processes. For Pb, EF values ranged from 0.98 to 2.73, with values exceeding 1.0 observed in the sediment of ten sites. Additionally, EF values for Fe fluctuated between 0.38 and 8.91, with values greater than 5 at stations S4 and S8. An enrichment factor above 1.5 suggests that the PTEs likely originated from external sources, such as anthropogenic or diffuse pollution sources [46,47].

3.4.3. Ecological Hazard Assessment by Potential Ecological Hazard Index and Modified Potential Ecological Hazard Index

Values for the hazard index (RI), which is based on the contamination factor of each PTE [31], ranged from 5.93 to 241.91. In general, RI values were less than 150 at nine locations, which indicated a low ecological hazard associated with the concentration of PTEs in the background sediment. Values over 150 were observed at three locations in the upper Inaouene wadi (S1, S3, and S5), indicating a moderate ecological hazard to benthic organisms. The greatest contribution to the RI was Pb, with an average percentage of 37% (Figure 9).
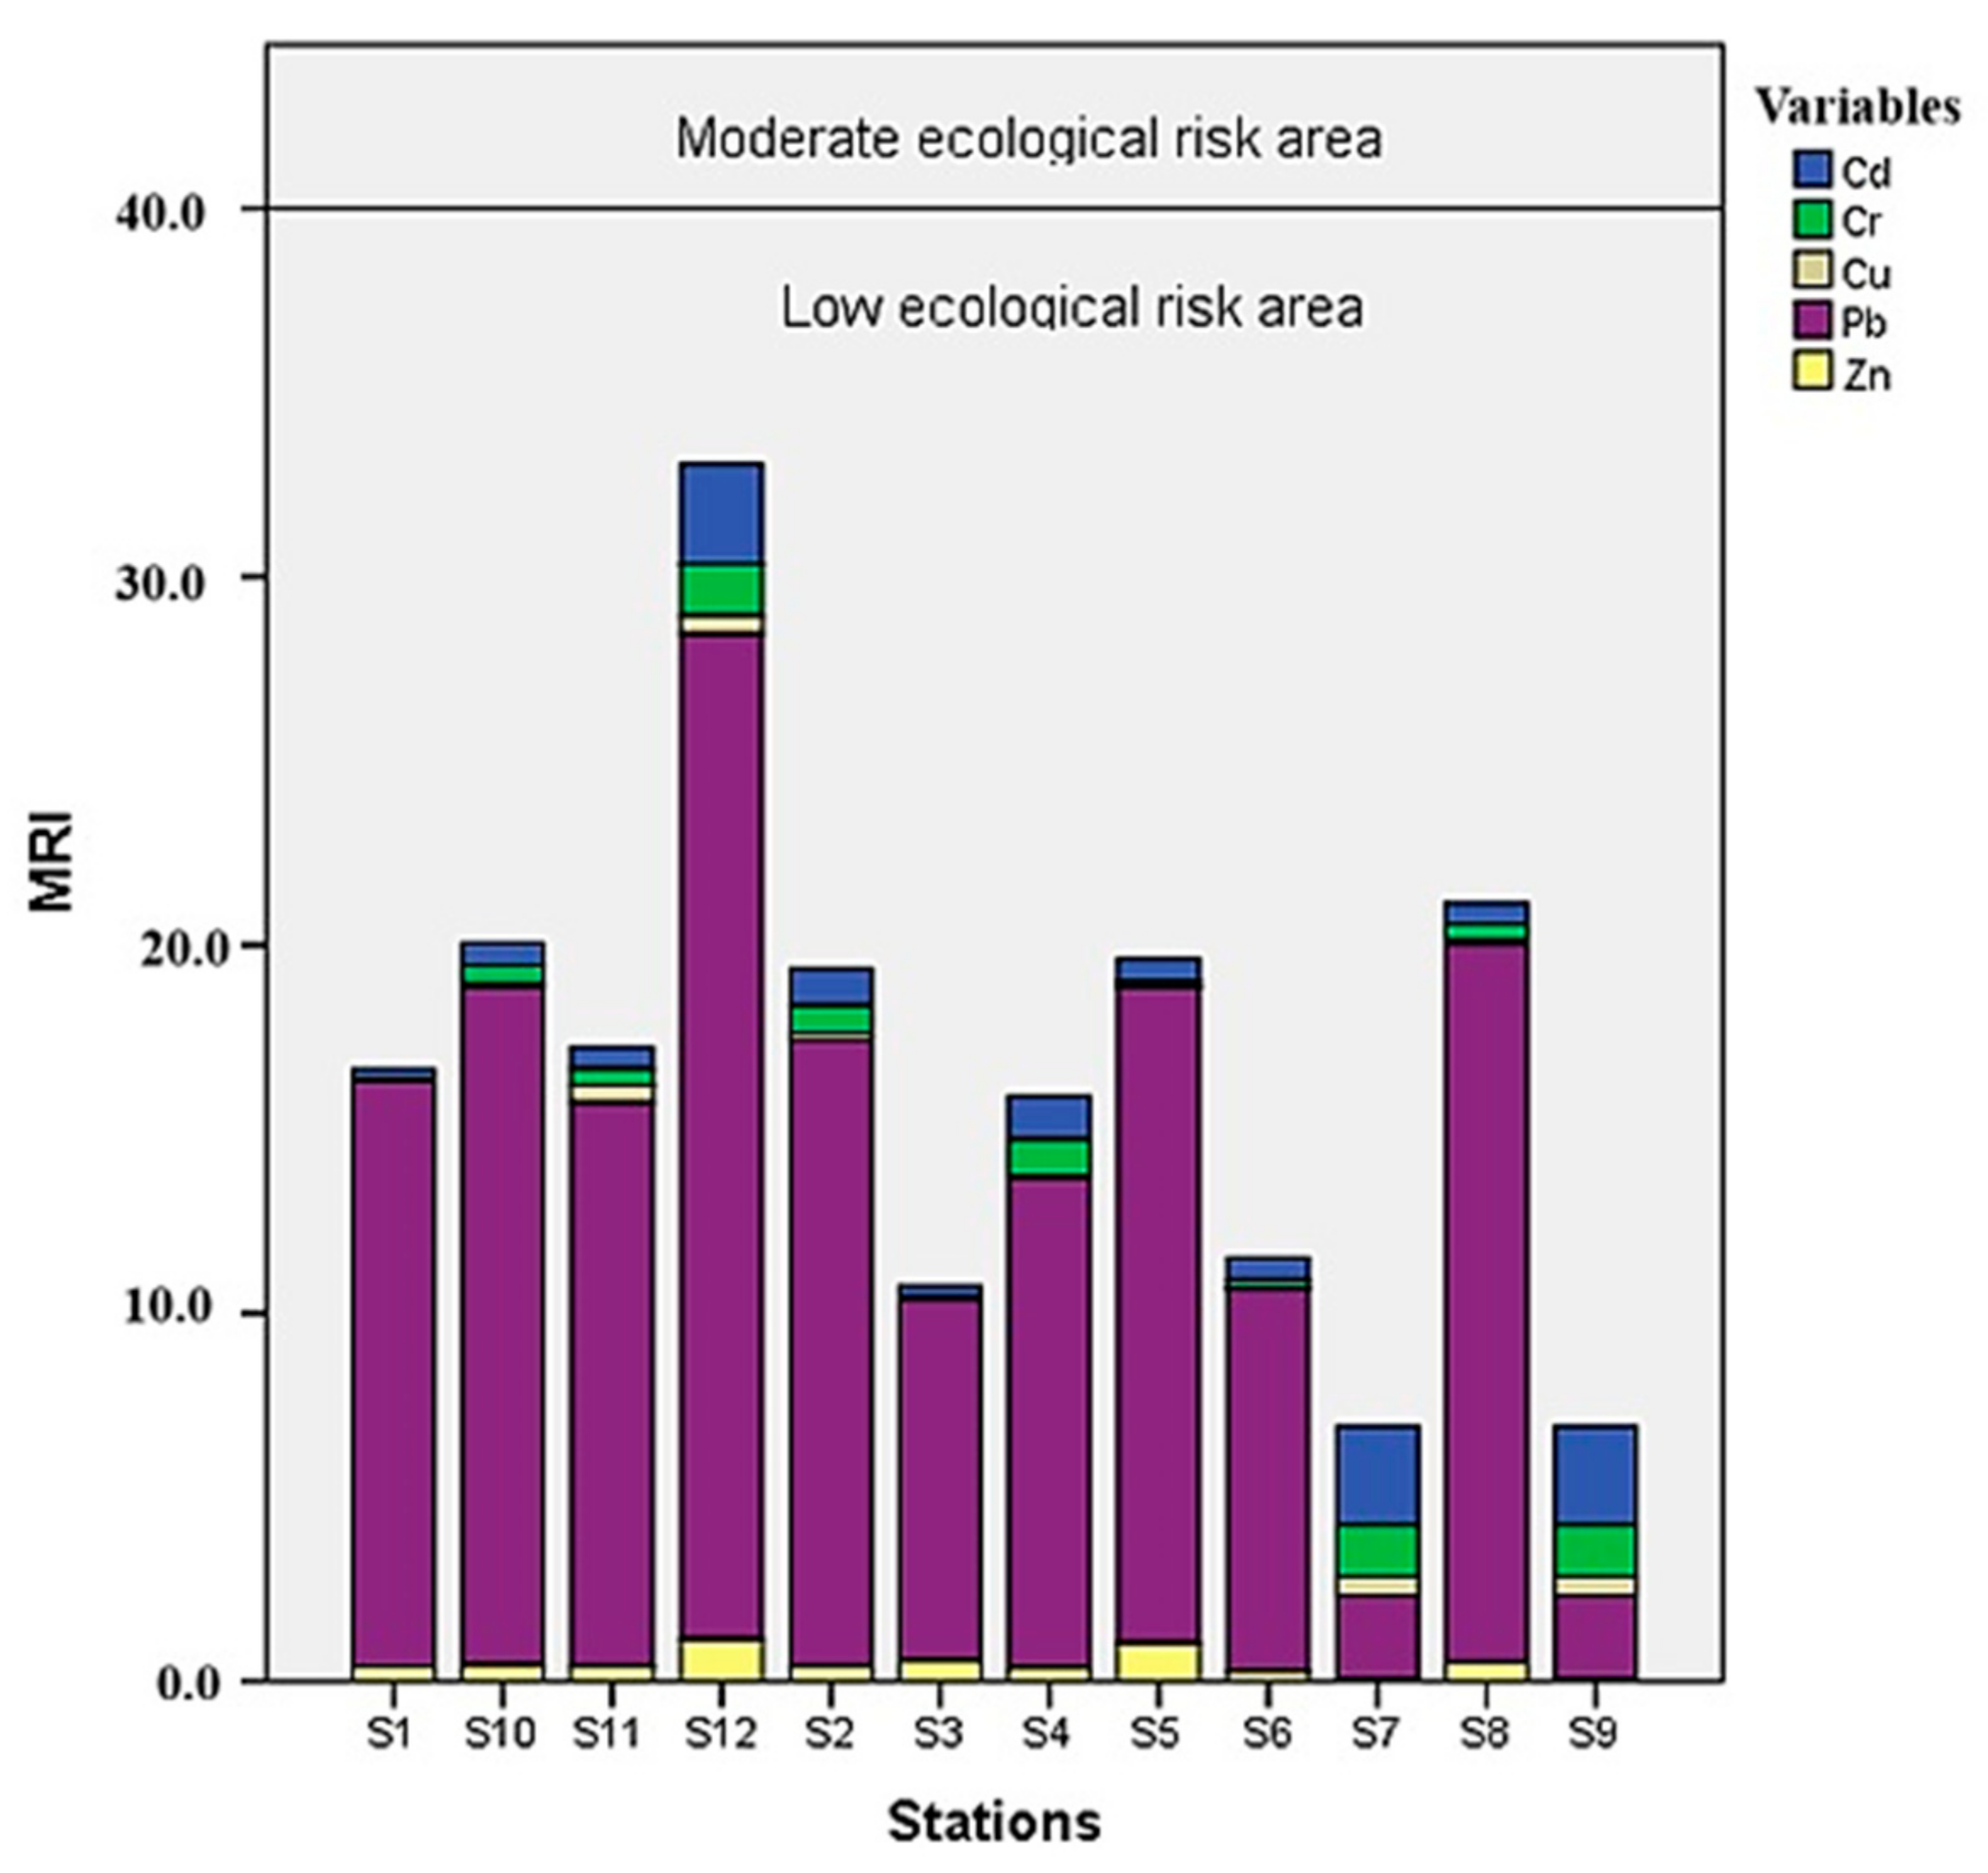
All MRI values were below 40 (Figure 10) in all sites, indicating a low ecological risk in the region.

4. Discussion

The concentrations of potentially toxic elements (PTEs) in sediments and their interrelationships are primarily influenced by human sources, sediment texture, and organic matter content [48,49]. The composition of sand, silt, and clay is influenced by the meteorological, hydrological, and geological characteristics of the watershed. These variables impact the transportation of PTEs in riverine systems. Globally, background sediments are characterized by relatively great variability in concentrations of metals. The sediments analyzed in this study are in a watershed affected by pollution upstream of the Inaouene wadi; therefore, concentrations of PTEs in background sediments are greater upstream and lesser downstream. Elevated levels of PTEs in sediments may occur when residential wastewater is introduced, surpassing the national criteria for sediment quality. Our findings corroborated the results obtained by Rezouki et al. (2021) [45], which demonstrated the existence of chemical and biological pollution linked to human activities (such as agricultural runoff and domestic wastewater). Furthermore, the study suggested that local anthropogenic activities have the potential to intensify the contamination of certain metals in the sediment at the bottom [45].
The principal component analysis (PCA) confirmed our obtained results and interpretations. The PC1 and PC2 axes explained 76.35% of the total information. PC1 was positively influenced by Al, Cd, Cu, Fe, Pb, and Zn, suggesting that these elements may originate from common sources [50]. Stations S1, S2, and S3 were negatively associated with the PC1 axis, indicating that they were significantly impacted by heavy metals due to their upstream locations close to the contamination sources of the city of Taza and the Oued Amlil, which are characterized by wastewater discharge [8,51]. PC2 showed a strong association with the variables of fine sand (FS) and Al. The graphical representation of the twelve studied stations on the PC1 × PC2 plot clearly illustrates the differences between these stations. Component 2 exhibited a positive correlation with gravel content and a negative correlation with fine sand and Al, characterizing the stations that were associated with low levels of trace metal elements. The study revealed a significant link between the concentrations of PTEs in bottom sediments and gravel content. However, no correlation was found between PTE concentrations and the levels of clay, silt, or sand.
Relatively great values of the Igeo, EF, and RI at locations upstream suggest that the origin of metals is anthropogenic. The greater concentrations of trace metals at upstream locations were from contributions of wastewater from the city of Taza and Amlil wadi. Saleem et al. (2018) [52] found that the levels of PTEs were particularly high in locations near urban and semi-urban regions. PTEs may also originate from untreated urban/industrial waste discharge, agricultural runoff, and vehicular emissions [52]. The small increase in concentrations of PTEs observed near the Idriss I dam could be a consequence of changing hydrologic conditions in the reservoirs during situations of flooding and increased water flow [53].
Sediment quality indices (RI and MRI) were used as indicators to evaluate the toxicological hazards presented by PTEs, including Pb, Cd, Zn, Cr, and Cu, to the benthic environment. The results for areas S1, S3, S4, S5, and S6 showed that there is still a significant toxicity danger and that the concentrations of Cr, Cu, Cd, Fe, Pb, and Zn have recently risen. Inferring conclusions only from the overall quantities of PTEs in sediment, without considering naturally occurring amounts arising from the change of bedrock, might sometimes result in inaccurate findings [54].
Polymetallic pollution poses a possible ecological hazard (RI). The hazard level was low (ER < 150) for all areas except for S1, S3, and S5. In these places, the RI suggests a moderate ecological hazard (40 < RI < 80), specifically for Pb. These discrepancies are associated with the calculation technique for the individual risk (RI) for each element, which considers the toxicity weight (30 for Cd, 5 for Cu and Pb, and 2 for Cr). The overall concentration was inadequate to evaluate the possible risk of metal availability to living organisms [22,55]. The partitioning of metals into residual and non-residual fractions was assessed with the use of common EDTA and HCl extractions, which are frequently employed to recover the largest proportion of trace elements that are loosely bound to organic and inorganic complexes [56,57]. HCl is capable of extracting metals from exchangeable and carbonate phases, but EDTA is more effective at extracting metals that are tightly bonded to oxides and organics with a recognized affinity for metals [18,58,59].

5. Conclusions

This study assessed the concentrations of potentially toxic elements (PTEs) in the sediments of the Inaouene Wadi across 12 sampling stations, revealing significant levels of contamination, particularly near urban and agricultural discharge points in the upstream region of the river (stations S1, S3, and S5). Correlation analyses using PCA and HAC demonstrated a positive association among most of these elements (Cd, Pb, Cr, Ag, Al, Cu, Fe, and Zn), indicating a common source for these pollutants. This connection was especially pronounced at stations S1, S3, and S5, which were directly impacted by domestic and industrial discharges from the cities of Taza and Oued Amlil. The use of geochemical indicators, such as the geo-accumulation index (Igeo), enrichment factor (EF), ecological hazard index (RI), and the modified ecological risk index (MRI) provided a comprehensive assessment of the environmental impact. The PTE contamination in the Inaouene Wadi, particularly for Cd, Pb, Cr, Ag, Al, Cu, Fe, and Zn, is deeply concerning. It poses a significant threat to sediment quality, endangering local biodiversity and raising serious concerns for human health. These findings underscore the urgent need for targeted pollution control measures to protect the aquatic ecosystem and public health. Effective strategies should include improvements in wastewater treatment facilities, the implementation of better agricultural practices, and the enhancement of waste management systems. Continuous monitoring and further studies are essential to evaluate the effectiveness of these measures and ensure sustainable management of the Inaouene Wadi’s water resources.

Author Contributions

Conceptualization, S.R. and T.M.; data curation, S.R. and T.M.; formal analysis, S.R. and T.M.; funding acquisition, M.N.A., B.E.G., O.N. and A.A.S.; investigation, S.R. and T.M.; methodology, S.R., T.M., I.Z. and A.A.; project administration, I.Z.; resources, L.E.H. and R.F.; software, S.R. and T.M.; supervision, I.Z., M.N.A., B.E.G. and A.A.; validation, L.E.H., R.F., I.Z., M.N.A., B.E.G., O.N., A.A.S. and A.A.; visualization, M.N.A., B.E.G., O.N. and A.A.S.; writing—original draft, S.R., T.M., and A.A.; writing—review & editing, L.E.H., R.F., I.Z. and A.A. All authors have read and agreed to the published version of the manuscript.

Funding

This study was funded by the Researchers Supporting Project number PNURSP2024R103 at the Princess Nourah bint Abdulrahman University, Riyadh, Saudi Arabia.

Data Availability Statement

The datasets presented in this study are available upon reasonable request from the corresponding author.

Acknowledgments

The authors extend their appreciation to the Researchers Supporting Project number PNURSP2024R103 of the Princess Nourah bint Abdulrahman University, Riyadh, Saudi Arabia. The authors are also thankful to the Researchers Supporting Project number RSPD2024R1057 from the King Saud University, Riyadh, Saudi Arabia.

Conflicts of Interest

The authors declare no conflicts of interest.

Appendix A. Description of the Sampling Stations and Their Characteristics

Presentation of the StationsGeographic CoordinatesDescription of the Stations
LATITUDE NLONGITUDE W
S1Larbaa wadi 34°13′58.841″4°3′42.36″The blackish color of the water, along with its unpleasant odor and visual nuisance, indicated the influence of wastewater discharge. Additionally, the presence of solid waste accumulated at the edge of the watercourse further exacerbates environmental impact.
S2Lahdar wadi34°14′3.659″4°3′50.099″The right bank is fed by tributaries that collect runoff from the pre-Rifian hills and are characterized by Jurassic marl and limestone formations.
S3Upstream of Inaouene wadi 34°13′40.942″4° 4′7.528″Upstream of the Inaouene wadi, the waters exhibit a blackish color, accompanied by olfactory and visual nuisances.
S4Inaouene wadi located in Ghiata Al Gharbia34°11′57.611″4°12′24.865″The presence of agricultural activity was used to estimate the degree of self-purification of the watercourses.
S5Amlil wadi34°11′17.293″4°16′39.879″The right bank of the Inaouene wadi, characterized by a blackish water color and olfactory and visual nuisance, helped to detect the influence of wastewater discharge and was affected by uncontrolled dumping.
S6Inaouene wadi34°11′16.967″4°16′39.88″The detection of wastewater discharge helped estimate the degree of self-purification of the watercourses.
S7Zirg wadi34°09′54.2″4°20′24.5″Presence of agricultural activity.
S8Inaouene wadi after Zirg34°09′54.5″4°20′24.4″The degree of self-purification of the watercourses was estimated.
S9Bouhlou wadi34°07′56.4″4°24′33.8″The tributary of the left bank of the Inaouene wadi, fed by the Tazekka massif and the limestone of the Middle Atlas, is little affected by anthropic and agricultural factors and has a bottom made up of coarse gravel.
S10Metmata wadi34°07′00.6″4°32′17.4″This region is a tributary of the left bank of the Inaouene wadi and was little affected by agricultural and anthropic activity.
S11Downstream of Inaouene wadi sidi abd jlil34°08′16.2″4°30′09.6″The color and odor of the water seemed to be acceptable.
S12Idriss 1st dam34°7′31.989″4°39′50.032″All parameters seemed to be acceptable.

References

  1. Chedadi, M.; Bassouya, M.; Agour, A.; Asmi, H.E.; Merzouki, M.; Bari, A. Assessment of sediments contamination by potential toxic elements, in relationships with the physicochemical characteristics of Moroccan Oued Fez river. Sci. Afr. 2023, 22, e01949. [Google Scholar] [CrossRef]
  2. Pobi, K.K.; Nayek, S.; Gope, M.; Rai, A.K.; Saha, R. Sources evaluation, ecological and health risk assessment of potential toxic metals (PTMs) in surface soils of an industrial area, India. Env. Geochem. Health 2020, 42, 4159–4180. [Google Scholar] [CrossRef] [PubMed]
  3. Tholkappian, M.; Ravisankar, R.; Chandrasekaran, A.; Jebakumar, J.P.P.; Kanagasabapathy, K.; Prasad, M.; Satapathy, K. Assessing heavy metal toxicity in sediments of Chennai Coast of Tamil Nadu using Energy Dispersive X-ray Fluorescence Spectroscopy (EDXRF) with statistical approach. Toxicol. Rep. 2018, 5, 173–182. [Google Scholar] [CrossRef] [PubMed]
  4. Hayzoun, H.; Garnier, C.; Durrieu, G.; Lenoble, V.; Le Poupon, C.; Angeletti, B.; Ouammou, A.; Mounier, S. Organic carbon, and major and trace element dynamic and fate in a large river subjected to poorly-regulated urban and industrial pressures (Sebou River, Morocco). Sci. Total Environ. 2015, 502, 296–308. [Google Scholar] [CrossRef]
  5. Faouzi, J.; Bedoui, I.; Rezouki, S.; Moubchir, T.; Allali, A.; EloutassI, N.; Lahkimi, A. Vertical transfer of bacteriological and parasitological pollutants from irrigation water to soil and crops. Ecol. Eng. Environ. Technol. 2023, 24, 93–103. Available online: https://yadda.icm.edu.pl/yadda/element/bwmeta1.element.baztech-0ef0576d-5dd7-4d24-ab67-4db7b4207fa7 (accessed on 10 July 2024). [CrossRef]
  6. Moubchir, T.; Eloutassi, N.; Bendaoud, A.; Belkhiri, A.; Maai, M.; Moubchir, M.; Zahir, I. Heavy metals analysis and quality evaluation in drinking groundwater around an abandoned mine Area of Ouichane (Nador’s Province, Morocco). J. Ecol. Eng. 2023, 24, 118–127. Available online: https://bibliotekanauki.pl/articles/24201772.pdf (accessed on 10 July 2024).
  7. Qiu, Y.-W. Bioaccumulation of heavy metals both in wild and mariculture food chains in Daya Bay, South China. Estuar. Coast. Shelf Sci. 2015, 163, 7–14. [Google Scholar] [CrossRef]
  8. Rezouki, S.; El-Haji, S.; Moubchir, T.; Faouzi, J.; Bendaoud, A.; Beniaich, G.; Allali, A.; Eloutassi, N. Evaluation of the impact of anthropic activities on the physico-chemical and microbiological parameters of the water of the wadi inaouene and its tributaries. Ecol. Eng. Environ. Technol. 2023, 24, 282–294. Available online: https://yadda.icm.edu.pl/yadda/element/bwmeta1.element.baztech-688757fd-6e59-42cf-8af8-e6108b4e6956 (accessed on 10 July 2024).
  9. Volpe, M.; La Cara, F.; Volpe, F.; De Mattia, A.; Serino, V.; Petitto, F.; Zavalloni, C.; Limone, F.; Pellecchia, R.; De Prisco, P.; et al. Heavy metal uptake in the enological food chain. Food Chem. 2009, 117, 553–560. [Google Scholar] [CrossRef]
  10. Parsa, M.; Shirazy, A.; Shirazi, A.; Pour, A.B. Processing and interpretation of geochemical data for mineral exploration. In Geospatial Analysis Applied to Mineral Exploration; Elsevier: Amsterdam, The Netherlands, 2023; pp. 171–188. Available online: https://www.sciencedirect.com/science/article/pii/B9780323956086000044 (accessed on 3 October 2024).
  11. Zhang, S.; Chen, B.; Du, J.; Wang, T.; Shi, H.; Wang, F. Distribution, assessment, and source of heavy metals in sediments of the Qinjiang River, China. Int. J. Environ. Res. Public Health 2022, 19, 9140. [Google Scholar] [CrossRef]
  12. Liu, X.; Sheng, Y.; Liu, Q.; Li, Z. Ecological and environmental risks of heavy metals in sediments in Dingzi Bay, South Yellow Sea. Mar. Pollut. Bull. 2023, 188, 114683. [Google Scholar] [CrossRef] [PubMed]
  13. N’guessan, Y.M.; Probst, J.L.; Bur, T.; Probst, A. Trace elements in stream bed sediments from agricultural catchments (Gascogne region, SW France): Where do they come from? Sci. Total Environ. 2009, 407, 2939–2952. [Google Scholar] [CrossRef] [PubMed]
  14. Cabral Pinto, M.M.S.; Silva, M.M.V.G.; Ferreira da Silva, E.A.; Dinis, P.A.; Rocha, F. Transfer processes of potentially toxic elements (PTE) from rocks to soils and the origin of PTE in soils: A case study on the island of Santiago (Cape Verde). J. Geochem. Explor. 2017, 183, 140–151. [Google Scholar] [CrossRef]
  15. Rodríguez, J.; Tueros, I.; Borja, A.; Belzunce, M.; Franco, J.; Solaun, O.; Valencia, V.; Zuazo, A. Maximum likelihood mixture estimation to determine metal background values in estuarine and coastal sediments within the European Water Framework Directive. Sci. Total Environ. 2006, 370, 278–293. [Google Scholar] [CrossRef]
  16. Birch, G. Determination of sediment metal background concentrations and enrichment in marine environments–a critical review. Sci. Total Environ. 2017, 580, 813–831. [Google Scholar] [CrossRef]
  17. Singh, K.P.; Mohan, D.; Singh, V.K.; Malik, A. Studies on distribution and fractionation of heavy metals in Gomti river sediments—A tributary of the Ganges, India. J. Hydrol. 2005, 312, 14–27. [Google Scholar] [CrossRef]
  18. Leleyter, L.; Probst, J.-L. A New Sequential Extraction Procedure for the Speciation of Particulate Trace Elements in River Sediments. Int. J. Environ. Anal. Chem. 1999, 73, 109–128. [Google Scholar] [CrossRef]
  19. Charriau, A.; Lesven, L.; Gao, Y.; Leermakers, M.; Baeyens, W.; Ouddane, B.; Billon, G. Trace metal behaviour in riverine sediments: Role of organic matter and sulfides. Appl. Geochem. 2011, 26, 80–90. [Google Scholar] [CrossRef]
  20. Lao, C.; Casas, J.M.; Rosas, H. Heavy metals and metalloids in sediments from the Llobregat basin, Spain. Environ. Geol. 2003, 44, 325–332. [Google Scholar] [CrossRef]
  21. Hassimi, H.; Taleb, A.; Bouezmarni, M.; Karzazi, O.; Taleb, M.; Kherbeche, A.; Debbaut, V. The effect of the physicochemical conditions variations on the behavior of heavy metals trapped in polluted fluvial system sediments: The case of Oued Sebou, Morocco. Appl. Water Sci. 2019, 9, 1–8. [Google Scholar] [CrossRef]
  22. Benabdelkader, A.; Taleb, A.; Probst, J.; Belaidi, N.; Probst, A. Anthropogenic contribution and influencing factors on metal features in fluvial sediments from a semi-arid Mediterranean river basin (Tafna River, Algeria): A multi-indices approach. Sci. Total Environ. 2018, 626, 899–914. [Google Scholar] [CrossRef] [PubMed]
  23. Neto, J.R.; Andrade, E.M.; Palácio, H.A.; Sales, M.M.; Maia, A.R. Influence of land use/occupation on water quality in the Trussu river valley, Ceará, Brazil. Rev. Ciência Agronômica 2017, 48, 59–69. [Google Scholar]
  24. Moubchir, T.; Faouzi, J.; Loukili, E.H.; Bendaoud, A.; Belkhiri, A.; Rezouki, S.; Eloutassi, N.; Zahir, I. Investigation of the Hydrochemistry Quality of the Ouichane Groundwater (Morocco) Using Multivariate Statistical Methods and Diagram Analysis. Moroc. J. Chem. 2024, 12, 734–746. [Google Scholar]
  25. Branchu, P.; Badin, A.L.; Bechet, B.; Eisenlohr, L.; Priol, T.L.; Marseille, F.; Trielli, E. Pollution D’origine Routière et Environnement de Proximité. VertigO-La Rev. Électronique En Sci. De L’environnement 2013, 15. Available online: https://journals.openedition.org/vertigo/12775 (accessed on 10 July 2024). [CrossRef]
  26. Lionard, E.; Coquery, M.; Lyon, I. Échantillonnage des Sédiments: Préparation d’un Essai Collaborative; Hal Inrae: Paris, France, 2013; p. 24. [Google Scholar]
  27. Montarges-Pelletier, E.; Jeanneau, L.; Faure, P.; Bihannic, I.; Barres, O.; Lartiges, B.S. The junction of Fensch and Moselle rivers, France; mineralogy and composition of river materials. Environ. Geol. 2007, 53, 85–102. [Google Scholar] [CrossRef]
  28. Da Silva, Y.J.A.B.; Nascimento, C.W.A.D.; Biondi, C.M. Comparison of USEPA digestion methods to heavy metals in soil samples. Environ. Monit. Assess. 2014, 186, 47–53. [Google Scholar] [CrossRef]
  29. Lepel, E.A.; Stefansson, K.M.; Zoller, W.H. The enrichment of volatile elements in the atmosphere by volcanic activity: Augustine volcano 1976. J. Geophys. Res. Ocean. 1978, 83, 6213–6220. [Google Scholar] [CrossRef]
  30. Sinex, S.A.; Helz, G.R. Regional geochemistry of trace elements in Chesapeake Bay sediments. Environ. Geol. 1981, 3, 315–323. [Google Scholar] [CrossRef]
  31. Hakanson, L. An ecological risk index for aquatic pollution control.a sedimentological approach. Water Res. 1980, 14, 975–1001. [Google Scholar] [CrossRef]
  32. Muller, G. Index of geoaccumulation in sediments of the Rhine River. Geo J. 1969, 2, 108–118. [Google Scholar]
  33. McLennan, S.M. Chapter 7. Rare Earth Elements in Sedimentary Rocks: Influence of Provenance and Sedimentary Processes. In Geochemistry and Mineralogy of Rare Earth Elements; De Gruyter: Berlin, Germany, 2018; Volume 189, pp. 169–200. [Google Scholar] [CrossRef]
  34. Solomon, K.; Giesy, J.; Jones, P. Probabilistic risk assessment of agrochemicals in the environment. Crop. Prot. 2000, 19, 649–655. [Google Scholar] [CrossRef]
  35. Zhu, H.-N.; Yuan, X.-Z.; Zeng, G.-M.; Jiang, M.; Liang, J.; Zhang, C.; Yin, J.; Huang, H.-J.; Liu, Z.-F.; Jiang, H.-W. Ecological risk assessment of heavy metals in sediments of Xiawan Port based on modified potential ecological risk index. Trans. Nonferrous Met. Soc. China 2012, 22, 1470–1477. [Google Scholar] [CrossRef]
  36. Benzougagh, B.; Meshram, S.G.; Baamar, B.; Dridri, A.; Boudad, L.; Sadkaoui, D.; Mimich, K. Relationship between landslide and morpho-structural analysis: A case study in Northeast of Morocco. Appl. Water Sci. 2020, 10, 175. [Google Scholar] [CrossRef]
  37. Deschamps, T.; Benzaazoua, M.; Bussière, B.; Belem, T.; Mbonimpa, M. Mécanismes de rétention des métaux lourds en phase solide: Cas de la stabilisation des sols contaminés et des déchets industriels. VertigO-La Rev. Électronique En Sci. De L’environnement 2006, 7. [Google Scholar] [CrossRef]
  38. Kimball, B.A.; Callender, E.; Axtmann, E.V. Effects of colloids on metal transport in a river receiving acid mine drainage, upper Arkansas River, Colorado, U.S.A. Appl. Geochem. 1995, 10, 285–306. [Google Scholar] [CrossRef]
  39. Elliott, H.A.; Liberati, M.R.; Huang, C.P. Competitive Adsorption of Heavy Metals by Soils. J. Environ. Qual. 1986, 15, 214–219. [Google Scholar] [CrossRef]
  40. Geesey, G.; Borstad, L.; Chapman, P. Influence of flow-related events on concentration and phase distribution of metals in the lower Fraser River and a small tributary stream in British Columbia, Canada. Water Res. 1984, 18, 233–238. [Google Scholar] [CrossRef]
  41. Basta, N.T.; Tabatabai, M.A. Effect of cropping systems on adsorption of metals by soils: II. Effect of pH. Soil Sci. 1992, 153, 195–204. [Google Scholar] [CrossRef]
  42. Benbouih, H.; Nassali, H.; Ei Abdellaoui, A.; Srhiri, A. Speciation chimique du zinc et du cuivre dans les sediments du lac Fouarat au Maroc. J. Soc. Chim. De Tunis. 2001, 4, 1279–1286. [Google Scholar]
  43. Campbell, P.G.C. Associate Committee on Scientific. Biologically Available Metals in Sediments; National Research Council of Canada: Ottawa, ON, Canada, 1988; Volume 27694. [Google Scholar]
  44. Kovacs, M.; Nyary, I.; Toth, L. The microelement content of some submerged and floating aquatic plants. Acta. Bot. Hung. 1984, 30, 173–185. [Google Scholar]
  45. Rezouki, S.; Allali, A.; Touati, N.; Mansouri, D.; Eloutassi, N.; Fadli, M. Spatio-temporal evolution of the physico-chemical parameters of the Inaouen wadi and its tributaries. J. Chem. 2021, 9, 3–9. [Google Scholar]
  46. Yongming, H.; Peixuan, D.; Junji, C.; Posmentier, E.S. Multivariate analysis of heavy metal contamination in urban dusts of Xi’an, Central China. Sci. Total Environ. 2006, 355, 176–186. [Google Scholar] [CrossRef] [PubMed]
  47. Zhang, J.; Liu, C. Riverine Composition and Estuarine Geochemistry of Particulate Metals in China—Weathering Features, Anthropogenic Impact and Chemical Fluxes. Estuar. Coast. Shelf Sci. 2002, 54, 1051–1070. [Google Scholar] [CrossRef]
  48. Lin, Q.; Liu, E.; Zhang, E.; Li, K.; Shen, J. Spatial distribution, contamination and ecological risk assessment of heavy metals in surface sediments of Erhai Lake, a large eutrophic plateau lake in southwest China. CATENA 2016, 145, 193–203. [Google Scholar] [CrossRef]
  49. Wang, X.; Zhang, L.; Zhao, Z.; Cai, Y. Heavy metal pollution in reservoirs in the hilly area of southern China: Distribution, source apportionment and health risk assessment. Sci. Total Environ. 2018, 634, 158–169. [Google Scholar] [CrossRef]
  50. El Hajjami, S.; Abriak, N.-E.; Souabi, S.; El Alami, M. +Study of Metallic Contamination of Oued Sebou Sediments, Morocco. Environ. Technol. Innov. 2021, 23, 101680. [Google Scholar] [CrossRef]
  51. Laaraj, M.; Benaabidate, L.; Mesnage, V. Assessment of inaouene river pollution for potable water supply, Northern Morocc. J. Ecol. Eng. 2020, 21, 68–80. Available online: https://yadda.icm.edu.pl/baztech/element/bwmeta1.element.baztech-7a14f851-1dc6-4bf7-afbc-0d81c8bf73f9 (accessed on 3 October 2024). [CrossRef]
  52. Saleem, M.; Iqbal, J.; Akhter, G.; Shah, M.H. Fractionation, bioavailability, contamination and environmental risk of heavy metals in the sediments from a freshwater reservoir, Pakistan. J. Geochem. Explor. 2018, 184, 199–208. [Google Scholar] [CrossRef]
  53. Bing, H.; Wu, Y.; Zhou, J.; Sun, H.; Wang, X.; Zhu, H. Spatial variation of heavy metal contamination in the riparian sediments after two-year flow regulation in the Three Gorges Reservoir, China. Sci. Total Environ. 2019, 649, 1004–1016. [Google Scholar] [CrossRef]
  54. Burton, G.A., Jr. Sediment quality criteria in use around the world. Limnology 2002, 3, 65–76. [Google Scholar] [CrossRef]
  55. Badassan, T.E.; Avumadi, A.M.; Ouro-Sama, K.; Gnandi, K.; Jean-Dupuy, S.; Probst, J.L. Geochemical composition of the Lomé lagoon sediments, Togo: Seasonal and spatial variations of major, trace and rare earth element concentrations. Water 2020, 12, 3026. [Google Scholar] [CrossRef]
  56. Cuvier, A.; Leleyter, L.; Probst, A.; Probst, J.-L.; Prunier, J.; Pourcelot, L.; Le Roux, G.; Lemoine, M.; Reinert, M.; Baraud, F. Why comparison between different chemical extraction procedures is necessary to better assess the metals availability in sediments. J. Geochem. Explor. 2021, 225, 106762. [Google Scholar] [CrossRef]
  57. Leleyter, L.; Rousseau, C.; Biree, L.; Baraud, F. Comparison of EDTA, HCl and sequential extraction procedures, for selected metals (Cu, Mn, Pb, Zn), in soils, riverine and marine sediments. J. Geochem. Explor. 2012, 116–117, 51–59. [Google Scholar] [CrossRef]
  58. Baize, D. Teneurs totales en éléments traces métalliques dans les sols (France): Références et stratégies d’interprétation. Programme ASPITET 1997, 1–410. [Google Scholar]
  59. Kuo, S.; Lai, M.; Lin, C. Influence of solution acidity and CaCl2 concentration on the removal of heavy metals from metal-contaminated rice soils. Environ. Pollut. 2006, 144, 918–925. [Google Scholar] [CrossRef] [PubMed]
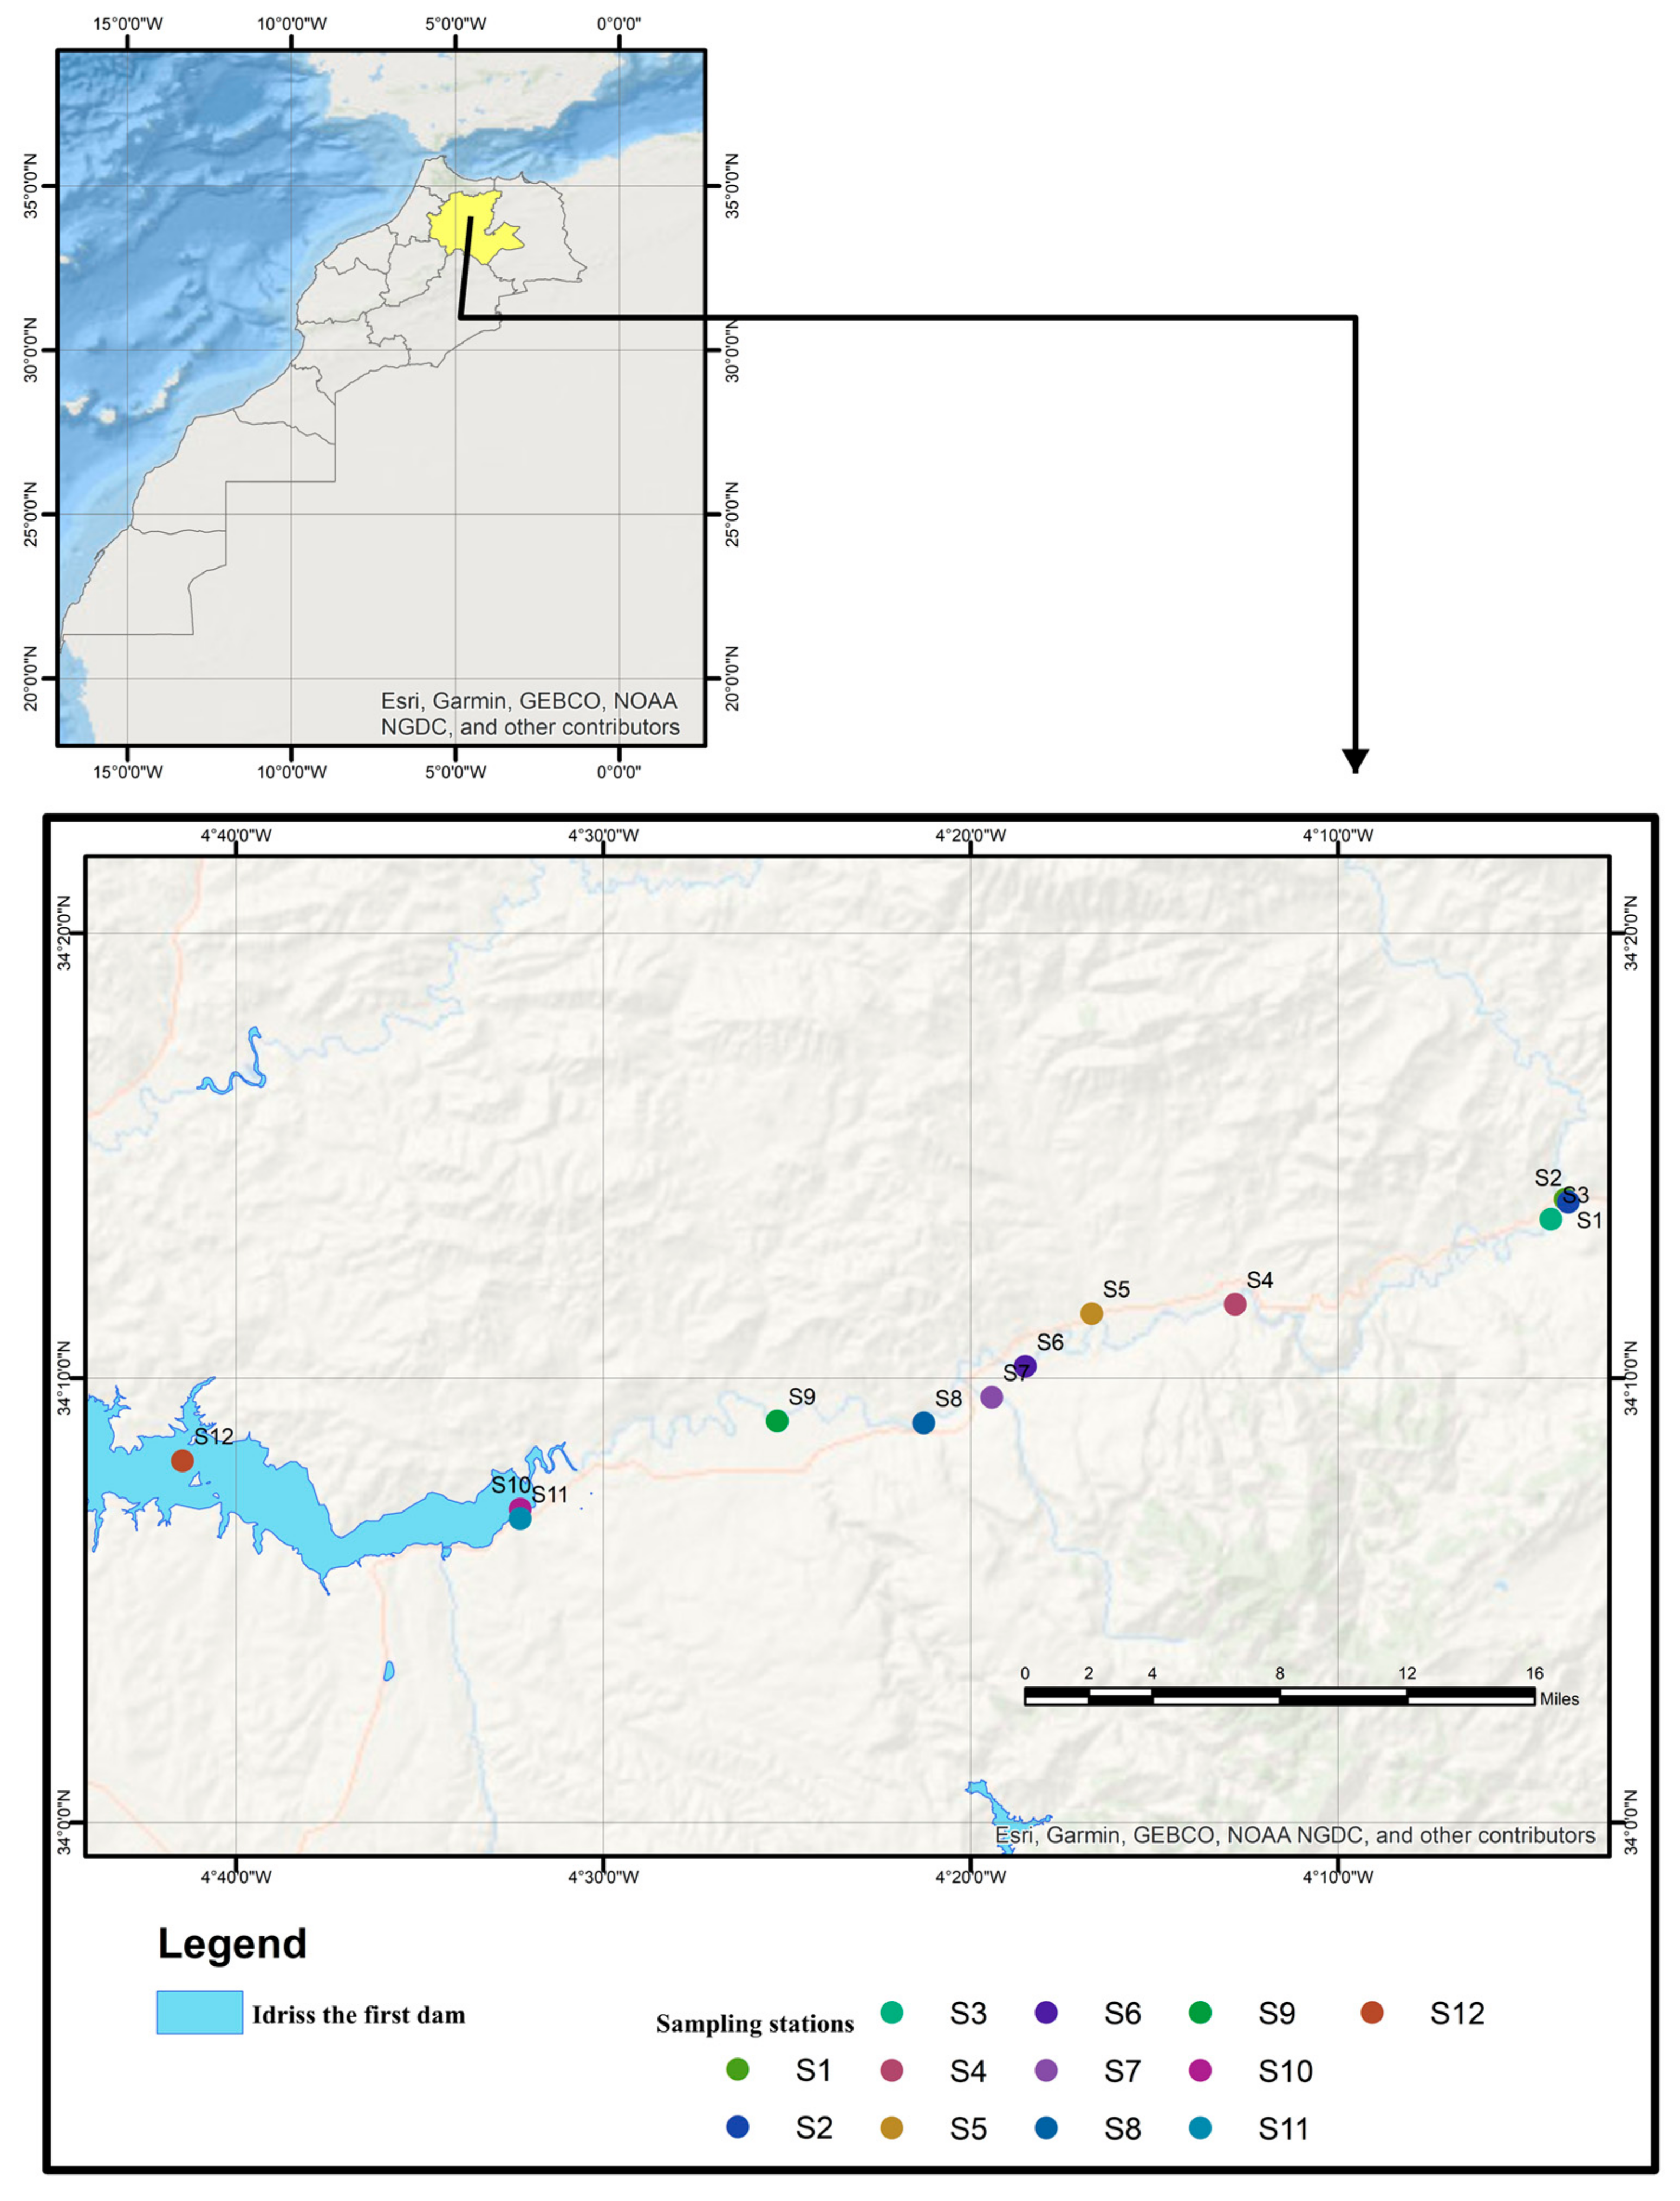
Figure 1. Location of the sampling stations in the studied area.
Water 16 02936 g001
Figure 2. Distribution of sedimentary particles at each station along the Inaouene wadi and its tributaries.
Water 16 02936 g002
Figure 3. Concentrations of PTEs in sediment samples (g/kg) from the Inaouene wadi and its main tributaries.
Water 16 02936 g003
Figure 4. Hierarchical ascending classification (HAC) of the studied stations, where Y axis represent the sample sites and X axis represent the resized class combination distance.
Water 16 02936 g004
Figure 5. PTE concentrations as a function of background sediment sample texture.
Water 16 02936 g005
Figure 6. The stations in the F1 × F2 factorial plane.
Water 16 02936 g006
Figure 7. Spatial distribution of the geo-accumulation index values (Igeo).
Water 16 02936 g007
Figure 8. Spatial distribution of trace element enrichment factor values in the sediment samples of the Inaouene wadi.
Water 16 02936 g008
Figure 9. Spatial variation in the potential ecological hazard index (RI) along the Inaouene wadi.
Water 16 02936 g009
Figure 10. Spatial variation in the modified potential ecological hazard index (MRI) along the Inaouene wadi.
Water 16 02936 g010
Table 1. Percentage of metal in the carbonate and exchangeable fractions of the sediment samples.
SiteS1S2S3S4S5S6S7S8S9S10S11S12
% of Metal in Carbonate and Exchangeable Fractions (A)% Pb506550596746645748556645
% Cd835063676760407150406967
Table 2. Values of ∂ referring to metal in the carbonate and exchangeable fractions [31,35].
% of Metal in the Carbonate and Exchangeable Fraction (A)
>501.60
31–501.40
11–301.20
1–101.00
<11.00
Table 3. Comparison of PTEs concentrations in sediments.
Potential Toxic Elements (mg kg−1)
CdCrCuPbZnFeReference
World’s rivers0.00030.120.050.040.11-[42]
Sebou wadi0.00001–0.0110.47–77.512.5–6250.5–1930–125019–30.300[43]
Moulouya wadi0.19–0.8-19.4–27.8819.2–71081–949-[44]
Khmiss wadi0.05–0.674.15–67.531–8710–5741.25–2002087–7800[45]
Rdom wadi0–0.011–1.90.2–2.11.2–2.71–3.8178–468[46]
Tislit-Talsint wadi0.3533.3058.5485.84142.6539.390[47]
Sebou wadi-77.93–119--79.27–12133.330–44.190[48]
Hassar wadi1.5–17.4107.7–258.9165.4–326.615.03–148.2458.02–1768.91700–2500[49]
Inaouene wadi90–0.110–1131.1–111–70122.1–190082–19.905Present study
Disclaimer/Publisher’s Note: The statements, opinions and data contained in all publications are solely those of the individual author(s) and contributor(s) and not of MDPI and/or the editor(s). MDPI and/or the editor(s) disclaim responsibility for any injury to people or property resulting from any ideas, methods, instructions or products referred to in the content.