1. Introduction
Flooding occurs when excessive rainfall or snowmelt generates water flows too large to be contained within riverbeds. As the river overflows, it causes significant damage to surrounding lands, settlements, infrastructure, and ecosystems, disrupting normal socio-economic activities in the affected areas [
1]. In recent years, it has been noted that the amount of surface water directly flowing into runoff has increased due to the destruction of vegetation cover by both urbanization and agricultural practices [
2,
3]. Over the past two decades, floods have been the most frequent natural disaster, accounting for 44% of all events recorded by the Centre for Research on the Epidemiology of Disasters (CRED) Emergency Events Database, and they have caused the greatest economic losses globally in comparison to other disaster types. Addressing flood-related challenges is therefore critical for promoting sustainable urbanization and environmental protection strategies [
4].
Furthermore, climate change has contributed to an increased frequency of flood events, underscoring the growing need for accurate flood modeling to mitigate their impact [
5]. Flood modeling is typically categorized into two main groups: hydrological and hydraulic models. Hydrological models play a crucial role in decision-making processes related to watershed management, water resource assessments, hydrological forecasting, and understanding the underlying processes. These models simulate flow components such as surface runoff, subsurface runoff, and base flow caused by precipitation at the basin outlet. In contrast, hydraulic modeling involves computer simulations that use specific formulas, parameters, and data to analyze the distribution networks of drinking water, wastewater, or stormwater [
6].
An essential aspect of hydraulic modeling, particularly when assessing floodplains, is determining hydraulic capacities accurately. This requires not only a precise understanding of the geometric structures of riverbeds, but also the correct estimation of the bed resistance coefficient. While the impact of natural vegetation on bed resistance in both the main channels and floodplains of rivers has been recognized for many years, recent studies have focused on addressing uncertainties related to this parameter [
7,
8,
9,
10,
11]. In this context, roughness—defined as the size and shape of the surface or channel and floodplain material that creates frictional resistance to flow—remains a critical parameter for hydraulic flow modeling [
6,
12,
13]. As a key factor in bed resistance, roughness plays a crucial role in controlling water flow velocities within hydraulic models.
As roughness influences water flow dynamics, it also directly affects the rate at which flood waves form as a result of surface runoff [
14,
15,
16]. The water velocity in a river channel section is inversely proportional to bed roughness. Manning’s n is a coefficient that characterizes the roughness of the river channel and its longitudinal variations. Empirical formulas and coefficients, observational methods, and laboratory experiments are used to estimate surface roughness in rivers. Hydraulic models optimize roughness coefficients using computer-based simulations, while remote sensing and Geographic Information Systems (GIS) technologies analyze surface features via satellite images and aerial photographs. Combining these methods allows for more accurate and comprehensive roughness estimates [
17,
18,
19,
20,
21,
22].
As roughness estimates are crucial for understanding river dynamics, their accuracy becomes even more critical when considering real-world applications. Determining the roughness coefficient in surface waters presents significant challenges. Implementing in-channel modifications based on existing projects without considering the current state of the channels—specifically, without reassessing the roughness coefficient—is not appropriate. In this context, the present study aims to determine the riverbed resistance coefficient of the Filyos River, influenced by the effects of natural vegetation on the riverbed. The selection of the Filyos River for this study is primarily due to its history of periodic flooding, having experienced flood disasters in 1982, 1986, 1989, 1991, 2009, and 2023 [
23,
24,
25,
26]. The coefficients of resistance determined within this study were tested using hydraulic modeling. This modeling allows us to analyze the changes in the flood capacity of the riverbed and assess the performance of previously implemented flood control projects. By integrating these findings, we aim to provide a more accurate evaluation of the effectiveness of flood protection structures in varying scenarios, ultimately offering guidance for future interventions in rivers at risk of flooding.
The primary contribution of this study lies in its potential to inform and guide planners in the formulation of project-planning documents that facilitate sustainable watershed management. Furthermore, the findings are intended to support the development of coordinated action plans that can be implemented prior to the occurrence of disasters, thereby enhancing preparedness and resilience in flood-prone areas.
Definition of Study Area
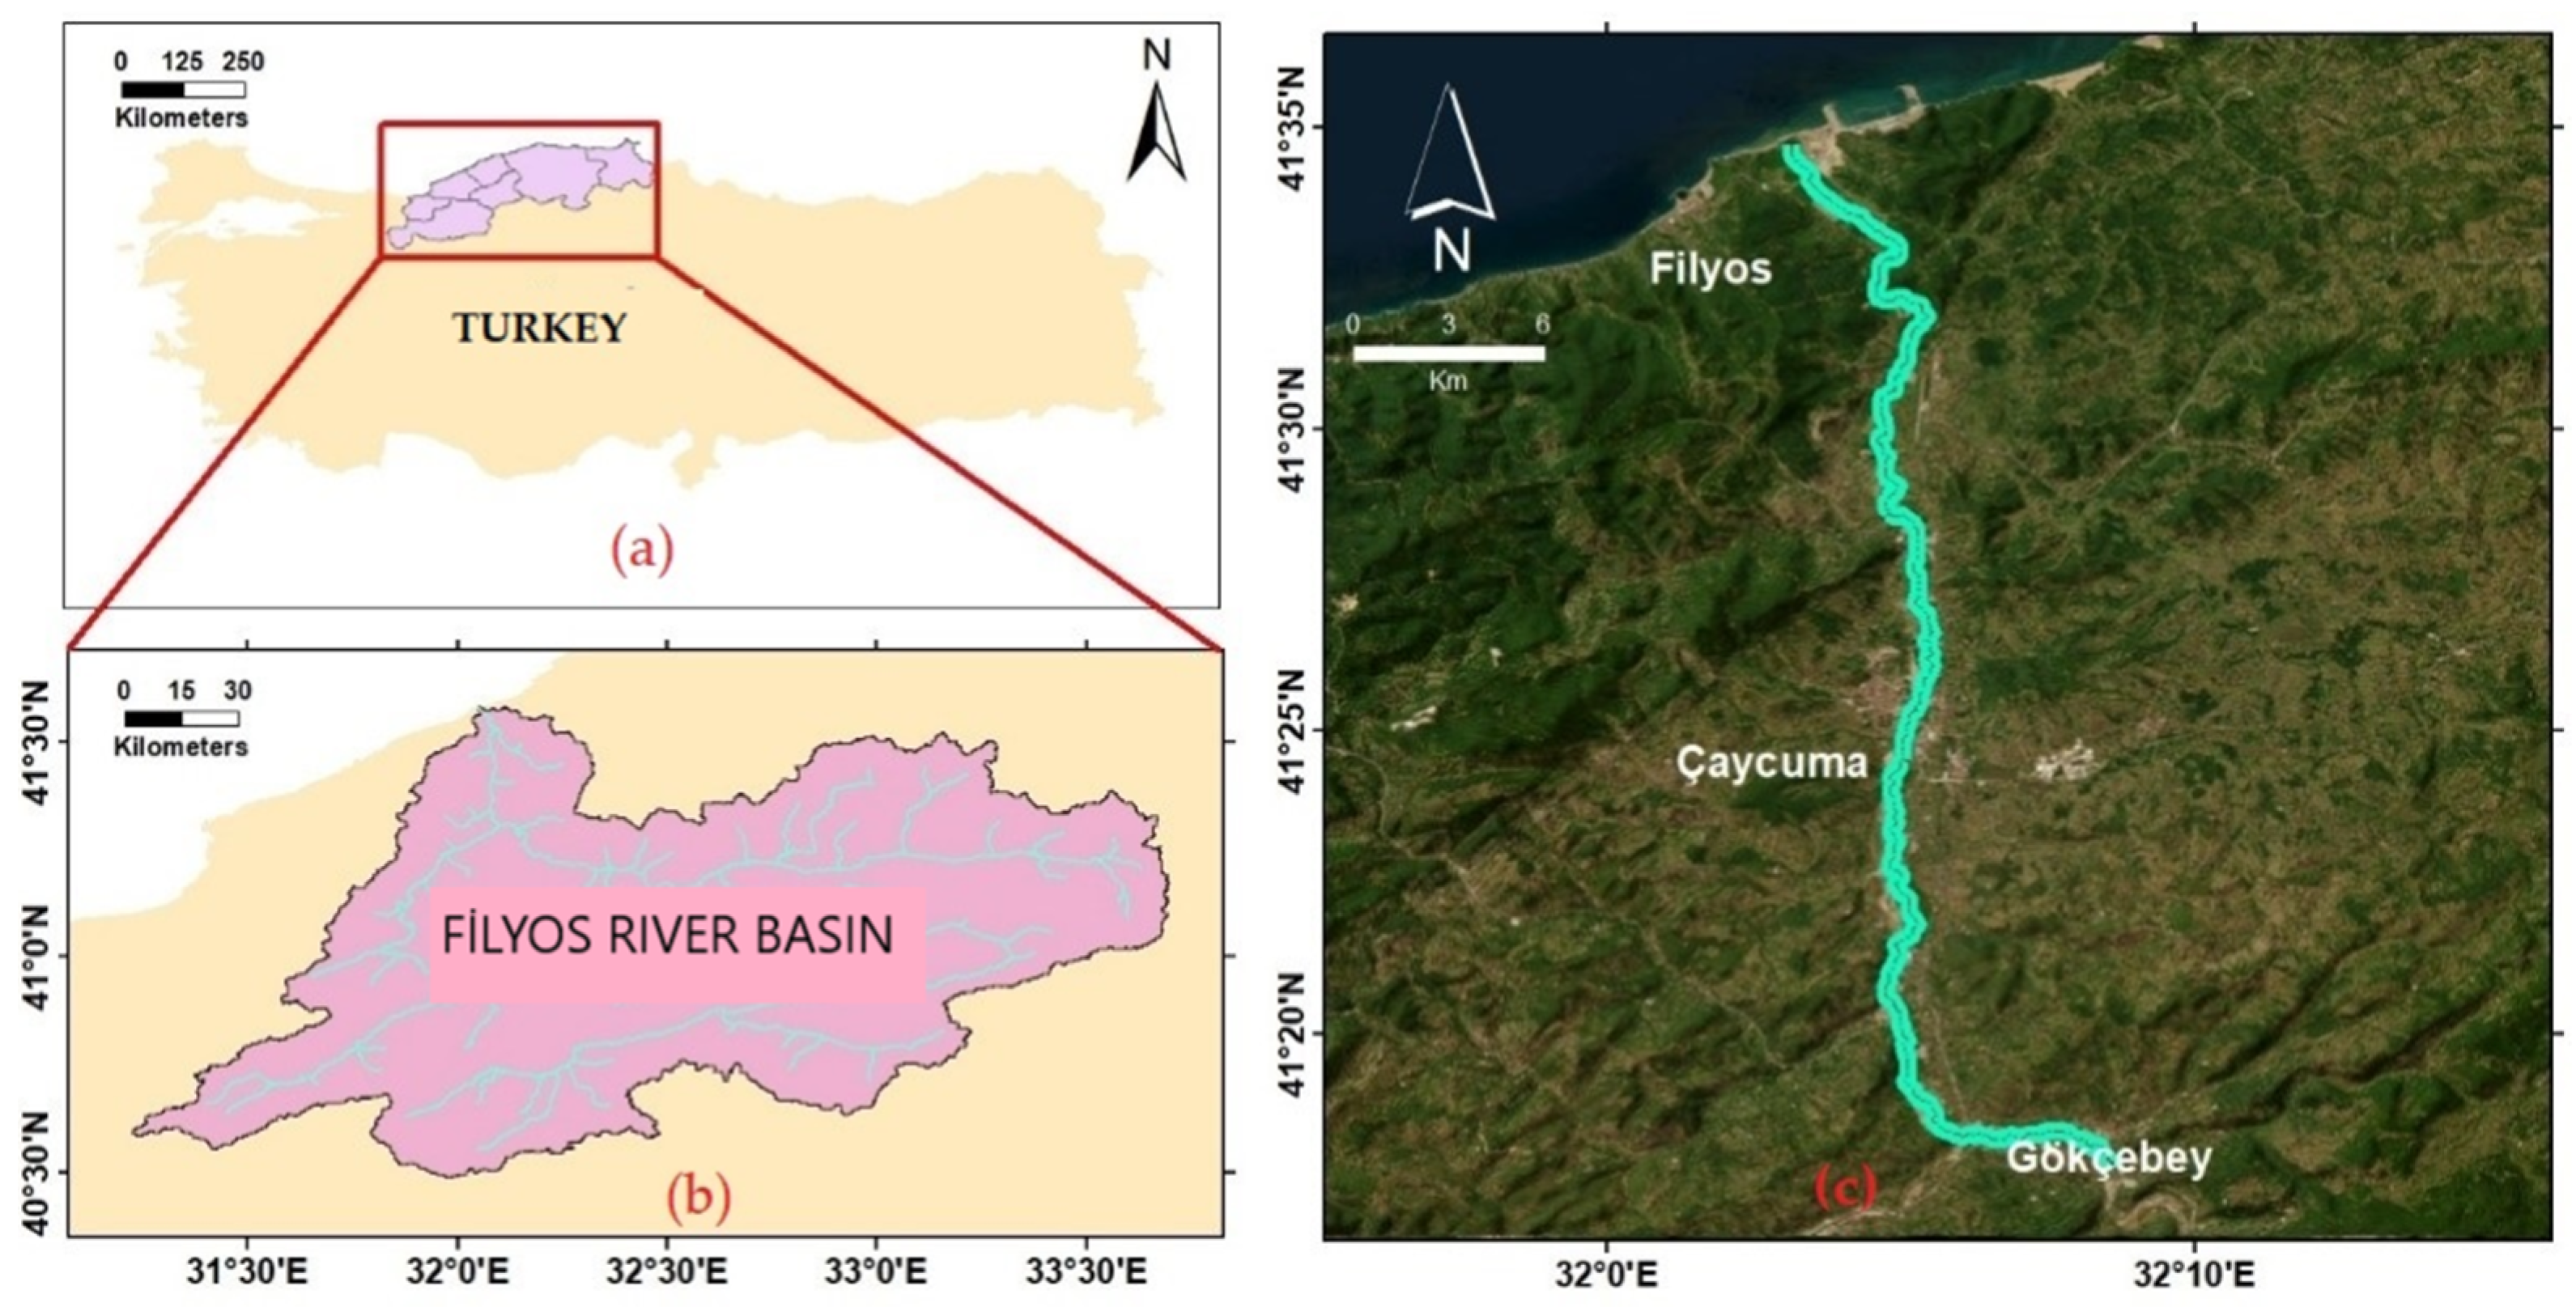
The Western Black Sea Basin is one of Turkey’s 25 hydrological basins, constituting 3.7% of the country’s total surface area. It is divided into five sub-basins: Devrekani-Gerze, Filyos, Bartın Stream, Melen Stream, and Ereğli. The Filyos River, situated within the Filyos sub-basin, drains an area of 13,300 km
2, contributing to the overall catchment area of the Western Black Sea Basin (
Figure 1).
The Filyos River, located between 40°29′ and 41°36′ north latitudes and 31°11′ and 33°42′ east longitudes, has a total length of 228 km [
27]. It is formed by the confluence of several rivers flowing in different directions. Due to its passage through forested and rainy regions, the river exhibits a stable flow regime. In the region, where the Black Sea climate prevails, the highest precipitation occurs during the fall and winter months. The Filyos River carries an average of 2.9 km
3 of water and 4.2 million tons of sediment annually. The river’s highest flow rate of 219 m
3/s is observed in April, while the lowest flow rate of 18 m
3/s occurs in September [
28].
2. Method
Flood problems need to be addressed for the development of environmental protection strategies and sustainable urbanization management. In recent years, climate change has led to short-term heavy rainfall, altering seasonal norms and causing floods. In addition, projects built on the river can also disrupt the natural balance. Therefore, hydraulic analyses are essential in engineering applications related to riverbeds. Key parameters for these analyses include river flow, bed slope, and the physical properties of the surface [
9,
29,
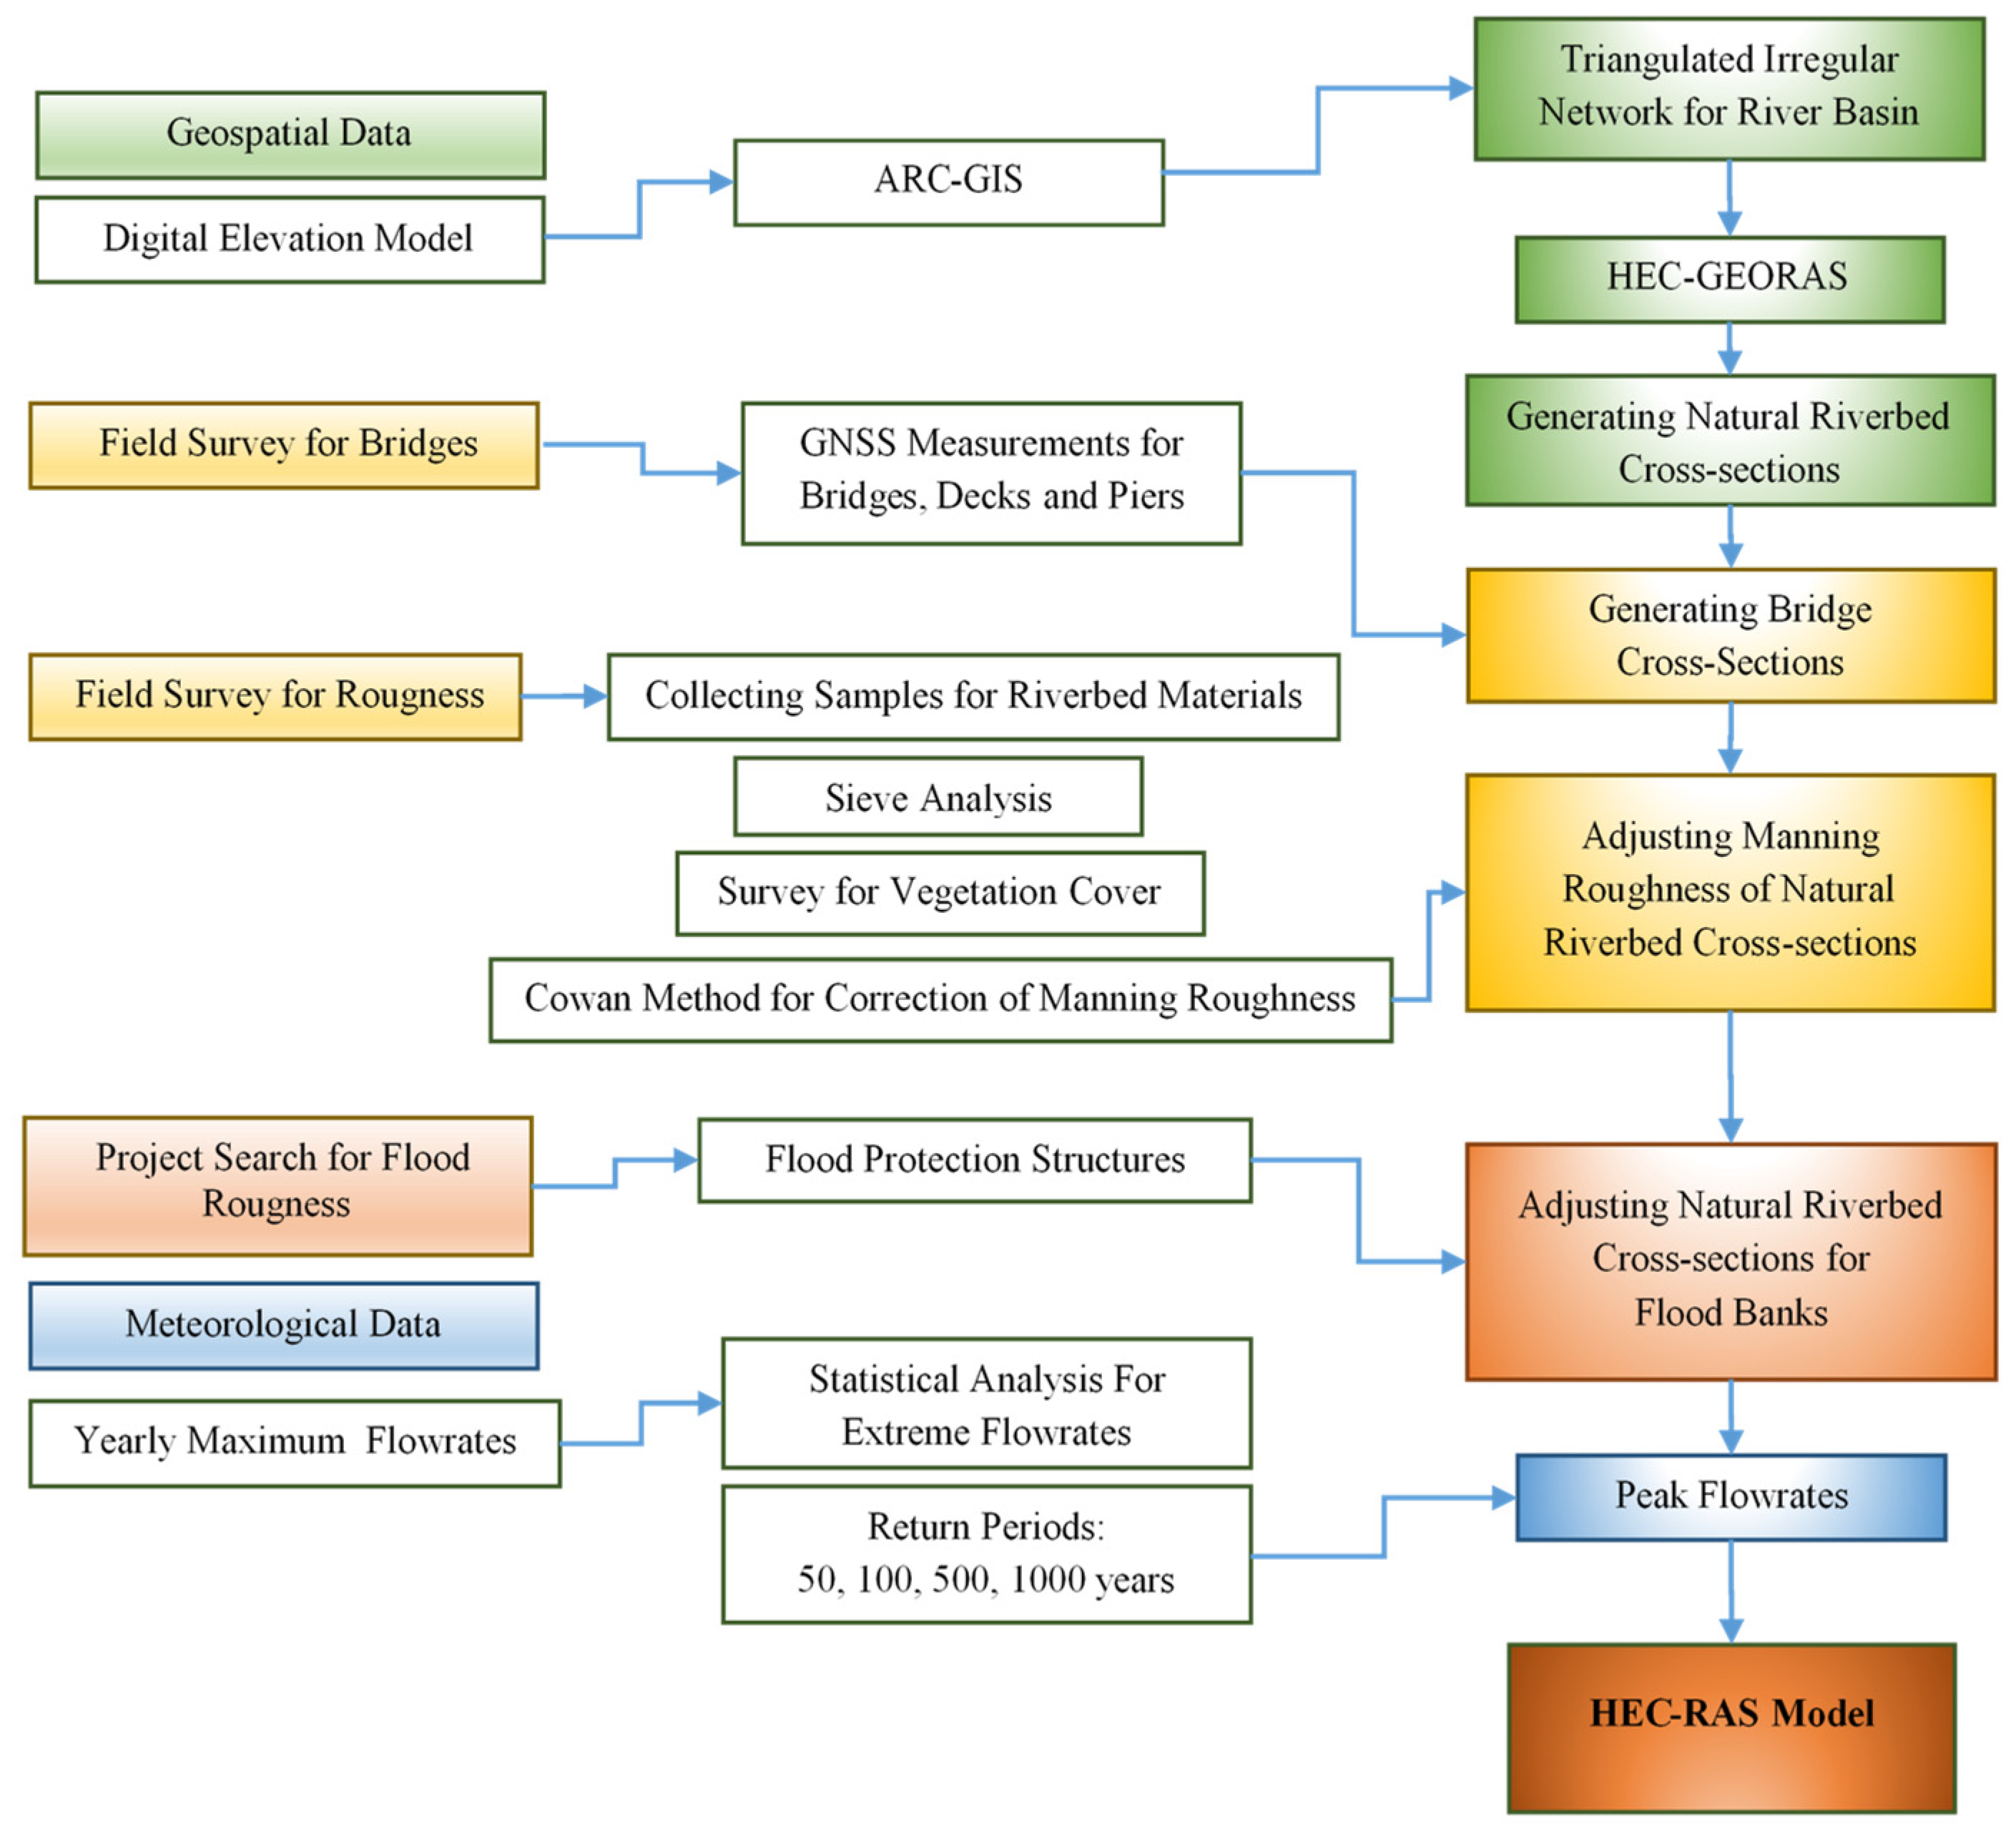
30]. In this study, to evaluate the effect of natural vegetation on the hydraulic potential of the Filyos River, the river was divided into eight regions, and the bed roughness coefficient (n) for each region was calculated by using the Cowan method. The flowchart of the study is given in
Figure 2. The relevant parameters were input into the HEC-RAS software, which was developed for the U.S. Army Corps of Engineers (USACE) [
31]. HEC-RAS allows users to perform one-dimensional steady flow, one- and two-dimensional unsteady flow calculations, sediment transport computations, and water temperature and quality modeling. The objective function of the HEC-RAS program is to simulate water flow in rivers and floodplains for flood risk management and water resource planning, analyze flow behavior, predict flood extents, and evaluate the design of hydraulic structures. The program provides critical information to support engineering decisions [
32,
33]. The assumptions underlying HEC-RAS create an important framework for ensuring the model’s accuracy, based on the premise that flow is one-dimensional, roughness coefficients are constant, and channel geometry is homogeneous. While the program can model both steady and unsteady flow conditions, these assumptions may influence flow dynamics. In this context, HEC-RAS plays a significant role in developing effective water resource management and environmental protection strategies.
2.1. Sampling and Sieve Analysis
To assess the influence of riverbed material and natural vegetation on hydraulic potential, the river was segmented into eight distinct regions (
Figure 3,
Table 1). These regions were selected based on the homogeneous distribution of key factors influencing the Manning’s n coefficient, including geometric structures, vegetation densities, substrate composition, and bed forms. Within each region, no significant variation in the n coefficient was observed, while notable differences in n coefficients were identified between regions. Sediment samples were collected from each region to analyze grain size distribution, as grain size exerts a direct impact on hydraulic resistance, energy dissipation, sediment transport, and erosion processes. These elements are essential for understanding water flow dynamics and the physical characteristics of the riverbed.
The results of the sieve analysis conducted in the laboratory were evaluated, and the roughness coefficient (n) was determined using both the modified Cowan method and numerical approaches. Given that the Cowan method was employed in the project conducted by the State Hydraulic Works (DSI), it was similarly utilized in this study to facilitate a comparative framework. By comparing the n coefficients, the maximum values for each region were selected to ensure a conservative approach, and the Manning roughness coefficients were subsequently established. These roughness coefficients were categorized as right bank, channel, and left bank within the sections of each region; and were incorporated into the geometric data tab of the HEC-RAS program as input parameters. The results were then evaluated across multiple recurrence intervals.
2.2. Numerical Methods
Yochum (2018) proposed nine quantitative methods to determine the Manning roughness coefficient (n). Each method provides a step-by-step approach for assessing parameters such as the valid range, slope, relative depth, and, in one case, the presence of stepwise large wood in steeper channels. These methods are considered impotant tools for making accurate and reliable calculations in water engineering applications.
Additionally, in 2018, the National Center for Stream and Aquatic Ecology developed a spreadsheet tool (
Table 2) to assist practitioners in selecting appropriate flow resistance coefficients, such as Manning’s n and the Darcy–Weisbach equation, for use in hydraulic flow channel analyses.
These nine models (Rickenmann and Recking, Griffiths, Limerinos, Yochum, Aberle and Smart, Lee and Ferguson, Bathurst, Jarrett, Hey, and Cowan) provide theoretical and practical approaches for determining roughness and flow resistance in river and stream channels. Each model is based on distinct theoretical foundations and computational techniques, evaluating variables such as channel geometry, soil properties, flow velocity, and hydraulic conditions in a different way. Their applications vary, with some models being more suited for flood management and water resource planning, while others are preferred for channel design and sediment transport analysis. The selection of an appropriate model depends on the analysis of available data and local conditions, ensuring that the most suitable approach is applied to meet the project’s requirements (
Table 1).
For example, models such as Rickenmann and Recking, Griffiths and Limerinos are primarily designed to address sediment transport and channel roughness in fluvial systems. These models are grounded in theoretical frameworks developed to elucidate and predict complex sediment transport dynamics. The Rickenmann and Recking model is particularly employed for predicting sediment transport during flood events, whereas the Griffiths model focuses on estimating the roughness coefficient based on channel geometry and flow conditions. The Limerinos model, on the other hand, addresses the intricate processes of sediment transport, emphasizing the interactions between erosion and sediment deposition within riverbeds. In contrast, the remaining six models (Yochum, Aberle and Smart, Lee and Ferguson, Bathurst, Jarrett, and Hey) offer broader applicability and are utilized in diverse areas such as hydraulic computations, water resource management, and channel design. These models incorporate distinct theoretical underpinnings and parameter sets to estimate roughness coefficients in accordance with the specific physical and hydraulic characteristics of the channel. The choice of model should be informed by the particular needs of the project and the hydraulic and sediment transport processes under investigation [
32].
2.3. Cowan Method
The Cowan Method was developed by W.L. Cowan in 1956 and improved by V.R. Arcement and G.J. Scheider in 1989. The General Directorate of State Hydraulic Works (DSI) used the coefficients given in
Table 3 for roughness coefficient calculation until 2010. However, this table was designed for channels without sediment problems. Then, in 2016, the “channel slope conditions” parameter was added to the roughness table by the DSI flood specialization commission, and it became the “Modified Cowan Method”; today it has become one of the most appropriate methods for roughness coefficient calculation for stream beds (Equation (1)).
Here:
nb = coefficient selected according to the soil properties of the channel,
n1 = a correction value for the effects of surface irregularities,
n2 = a coefficient chosen for variations in channel cross-section shape and size,
n3 = a coefficient determined for the effect of obstacles in the channel
n4 = a coefficient chosen for flow conditions and vegetation,
m = a coefficient expressing the degree of curvature of the channel.
DSI proposed using the roughness values from Benson-Dalrymple (1967) and Chow (1959) for the selection of the roughness coefficient in the modified Cowan method (n
b). The coefficient of channel cross-sectional change n
2 is evaluated as in the original Cowan method. Similarly, the coefficient of channel cross-sectional change n
3 is selected by considering the effects such as debris, bumps, drops, dykes, bridge abutments in the channel as in the original Cowan method. The vegetation parameter n
4, however, can vary significantly depending on the type and density of vegetation in the original Cowan method. The n
4 coefficient proposed by DSI specifically considers the reclamation status of the riverbed, and the parameter is selected accordingly for beds intended for reclamation [
15].
Table 3.
General Directorate of State Hydraulic Works (DSI) Manning’s table of values.
Table 3.
General Directorate of State Hydraulic Works (DSI) Manning’s table of values.
| Channel Type | Manning’s Roughness Coefficient |
|---|
| Normal concrete channels | 0.016 |
| Quarry stone wall or grouted riprap channel | 0.018 |
| Dry wall or dry riprap channel | 0.028 |
| Channels with straight cross-section constructed in a dry area, sand | 0.028 |
| Deformed slopes due to vegetation- and sand-accumulated channels | 0.035 |
| Channels opened with blasting agent in natural resources and straightened slopes | 0.038–0.047 |
| Wild tributary rivers, irregular and large pebbled rock bases | 0.050–0.070 |
| Flood plain and valley bottoms | 0.038–0.048 |
The coefficients determined based on the physical condition of the riverbed are substituted in Equation (1) to obtain the Manning roughness coefficient (n). Notably, flood protection structures have already been constructed by DSI within the study area. In this study, the ‘Modified Cowan Method’, as employed by DSI, was adopted to determine the roughness coefficient, ensuring meaningful results and facilitating comparative analysis.
3. Modeling
When modeling river flow, it is crucial to first define the objectives of the model and establish which assumptions are permissible. A geometrically accurate representation of the riverbed and channel, the appropriate determination of boundary conditions (e.g., flow rates), the correct selection of roughness coefficients (such as Manning’s n), and the use of suitable models for sediment transport and sedimentation analyses are essential for improving model accuracy. Additionally, the integration of time series and meteorological data further enhances the precision of the model. These factors collectively contribute to the generation of reliable results and a deeper understanding of the river’s hydrological dynamics.
In line with these considerations, this study utilized ArcGIS and HEC-RAS programs to identify areas prone to flooding. ArcGIS serves as a fundamental tool for preparing the necessary geospatial maps, while HEC-RAS is a comprehensive, graphical software designed for one-dimensional hydraulic modeling of flows in natural rivers and open channels. HEC-RAS enables the calculation of water surface profiles, sediment transport, bed movement, water quality analysis, and various hydraulic structures under both steady and unsteady flow conditions [
6,
8,
12,
16].
Field measurements, geometric data obtained by flow observation stations were entered into the HEC-RAS 5.0.7 program used within the scope of the study, and the working unit of the program was defined as the metric system. The 1/1000 scale flight intake map obtained from the ArcGIS program was transferred to the HEC-RAS program. The cross-sections were arranged from upstream to downstream. Then the roughness coefficient obtained from the Cowan method was defined. For the river, the measured flow rates of Q1000 = 4468 m3/s, Q500 = 4055 m3/s, Q100 = 3119 m3/s, Q50 = 1756 m3/s obtained from DSI 23rd Regional Directorate were used in the program.
For flow input, the measured flow rates of Q
1000, Q
500, Q
100, Q
50 were entered separately in the relevant field, and after entering the flow type, the flow rate was defined as the critical flow rate. Then the values entered for the flow were saved. Profile calculations were made, starting from the downstream for sub-critical flows and from the membrane for over-critical flows with known or accepted initial conditions. Sub-critical profiles were calculated by the program to be above the critical depth, and above-critical profiles to be below the critical depth. In cases where the flow regime changes from sub-critical to supercritical or from supercritical to sub-critical, the program uses mixed flow regime calculation [
17].
After defining the flow regime, the geometric and land elevations of a total of 4 bridges in the study area were entered into the program. The embankments on the river were examined within the program, and the geometries and existing land elevations of the embankments were created as a result of the project studies. In line with the project data, slope heads-bottoms and embankment widths were entered. Land elevations were taken from Google Earth and geometric data were taken from DSI.
4. Results and Discussion
The samples collected from the study area were subjected to sieve analysis in the laboratory. A granulometry curve was drawn for each sample, according to the results obtained from the sieve analysis to determine the nb value in the Cowan method, which is used as a roughness coefficient determination method. D50 and D84 values were calculated using the interpolation method from the obtained curve.
The values of D
50 and D
84 were calculated by selecting the method that provides the range of applicability from the numerical methods, and n
b values were calculated. A table was created in order to compare these calculated values with the n
b values obtained from the modified Cowan method (
Table 4).
Rickenmann and Recking, Griffiths and Limerinos models and Cowan’s method have in common the purpose of determining the roughness coefficient in channels. These models and methods are used to understand the flow resistance and hydraulic characteristics of water in rivers or canals. Each of them may use different theoretical or practical approaches to estimate the roughness coefficient, taking into account factors such as channel geometry, soil properties, and flow conditions. Therefore, for these four methods, the coefficient was chosen based on the soil characteristics of the channel (
Table 4).
When determining the n values, the soil characteristics of the channel, surface irregularities, the cross-sectional shape of the channel, the size of the obstacles in the channel, the density of vegetation and the degree of curvature of the channel should be taken into consideration. Based on these criteria, the n values determined for each region from the modified Cowan method table are given in
Table 5.
5. HEC-RAS Solutions
The roughness coefficients obtained for each region were used as input parameters in the HEC-RAS program for the sections within the regions as right bank, channel, and left bank. The study was carried out in two steps: examining the river as a whole and examining the sections with high flood area.
In the first step, the roughness coefficients obtained for the flow rates Q1000, Q500, Q100, and Q50 and the roughness coefficient value (0.028) used by DSI during project design were run in the program and the results were compared.
For the flow rate Q1000, it is already stated that 54,059.46 m2 will be affected by flooding. However, as a result of the study obtained with field data, it was determined that an area of 111,634.94 m2 would be affected by flooding. In the study conducted for the flow rate of Q500 = 4055 m3/s, although it was determined that an area of 47,992.93 m2 would be affected by a possible flood in the current situation, the flood area was determined as 100,513.3 m2 as a result of the study. For a flow rate of Q100 = 3119 m3/s, the existing flood area is 34,908.25 m2. The flood area obtained as a result of the field study was 74,184.23 m2. As a result of the analyses, the flood area that will be caused by the flow rate of Q50 =1756 m3/s is 17,876.7 m2, while the flood area determined by the roughness coefficient determined as a result of the field study is 35,300.25 m2.
In the second step, by examining the outputs obtained from the HEC-RAS program, the sections with the highest flood area change rate were identified and compared with the section in the existing project. Manning’s coefficient, flow area, flow velocity, and max. depth values of the sections were taken into consideration during the comparison. The cross sections and their locations are given in the table below (
Table 6).
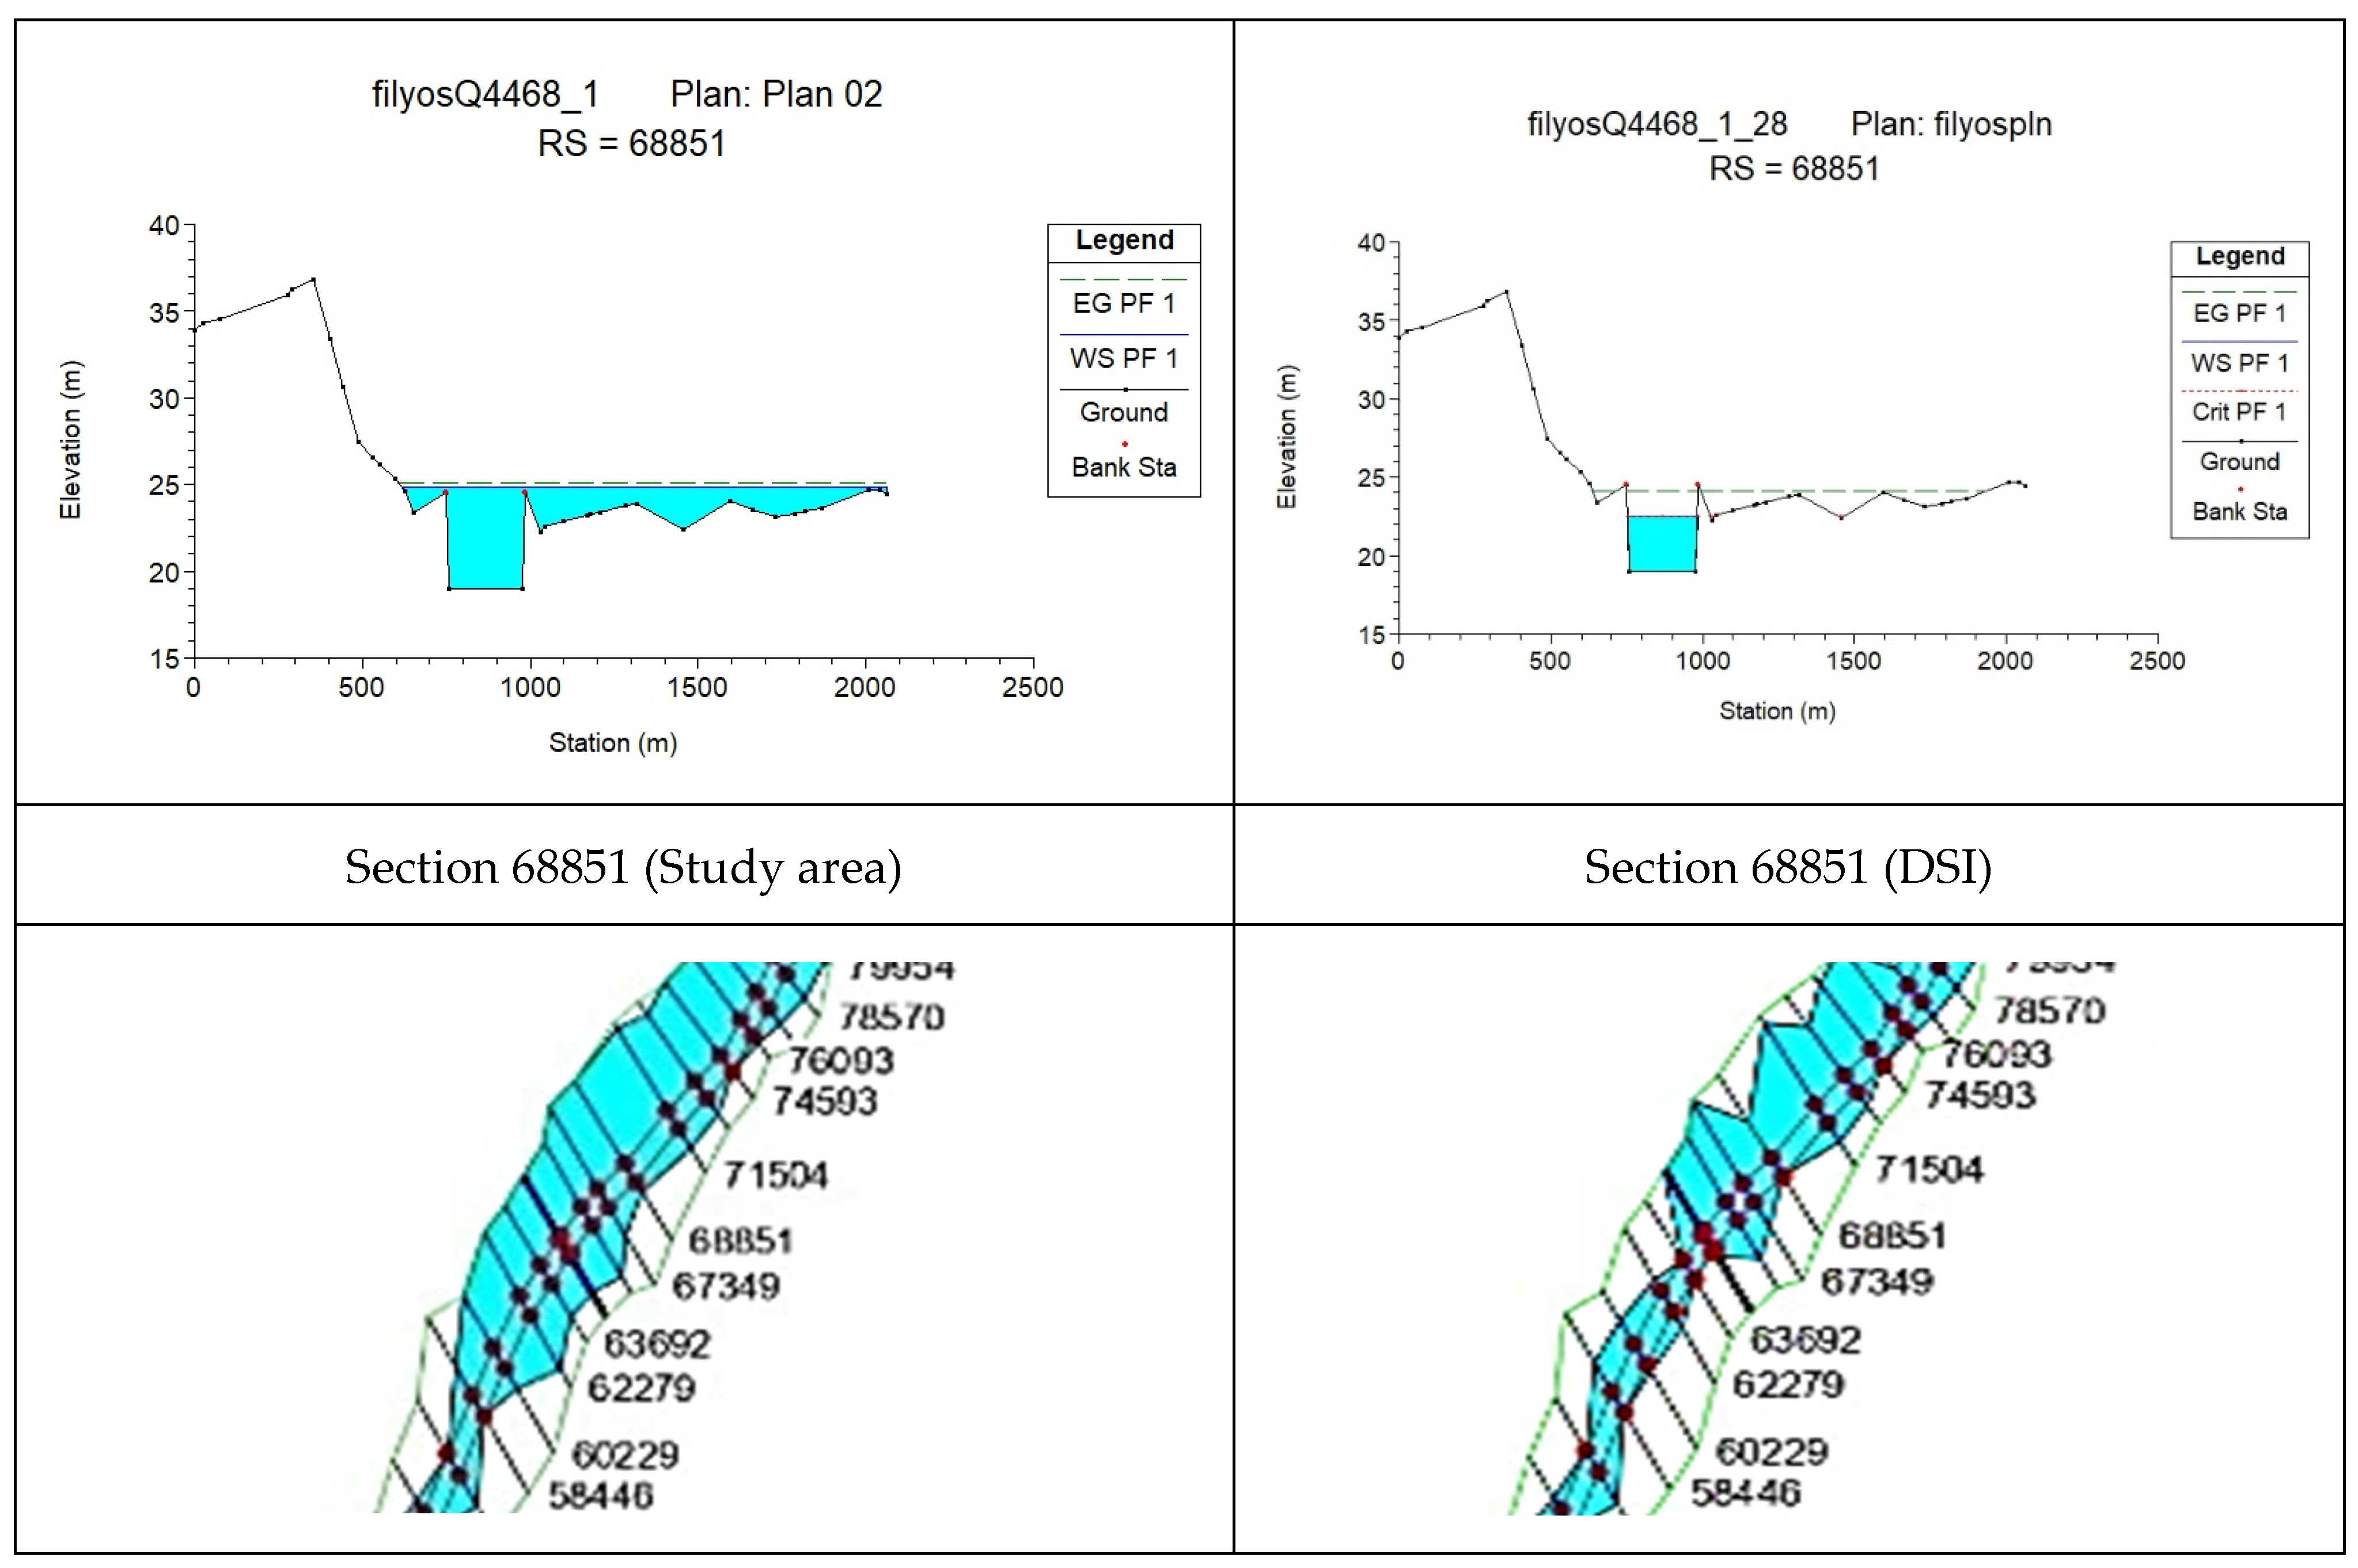
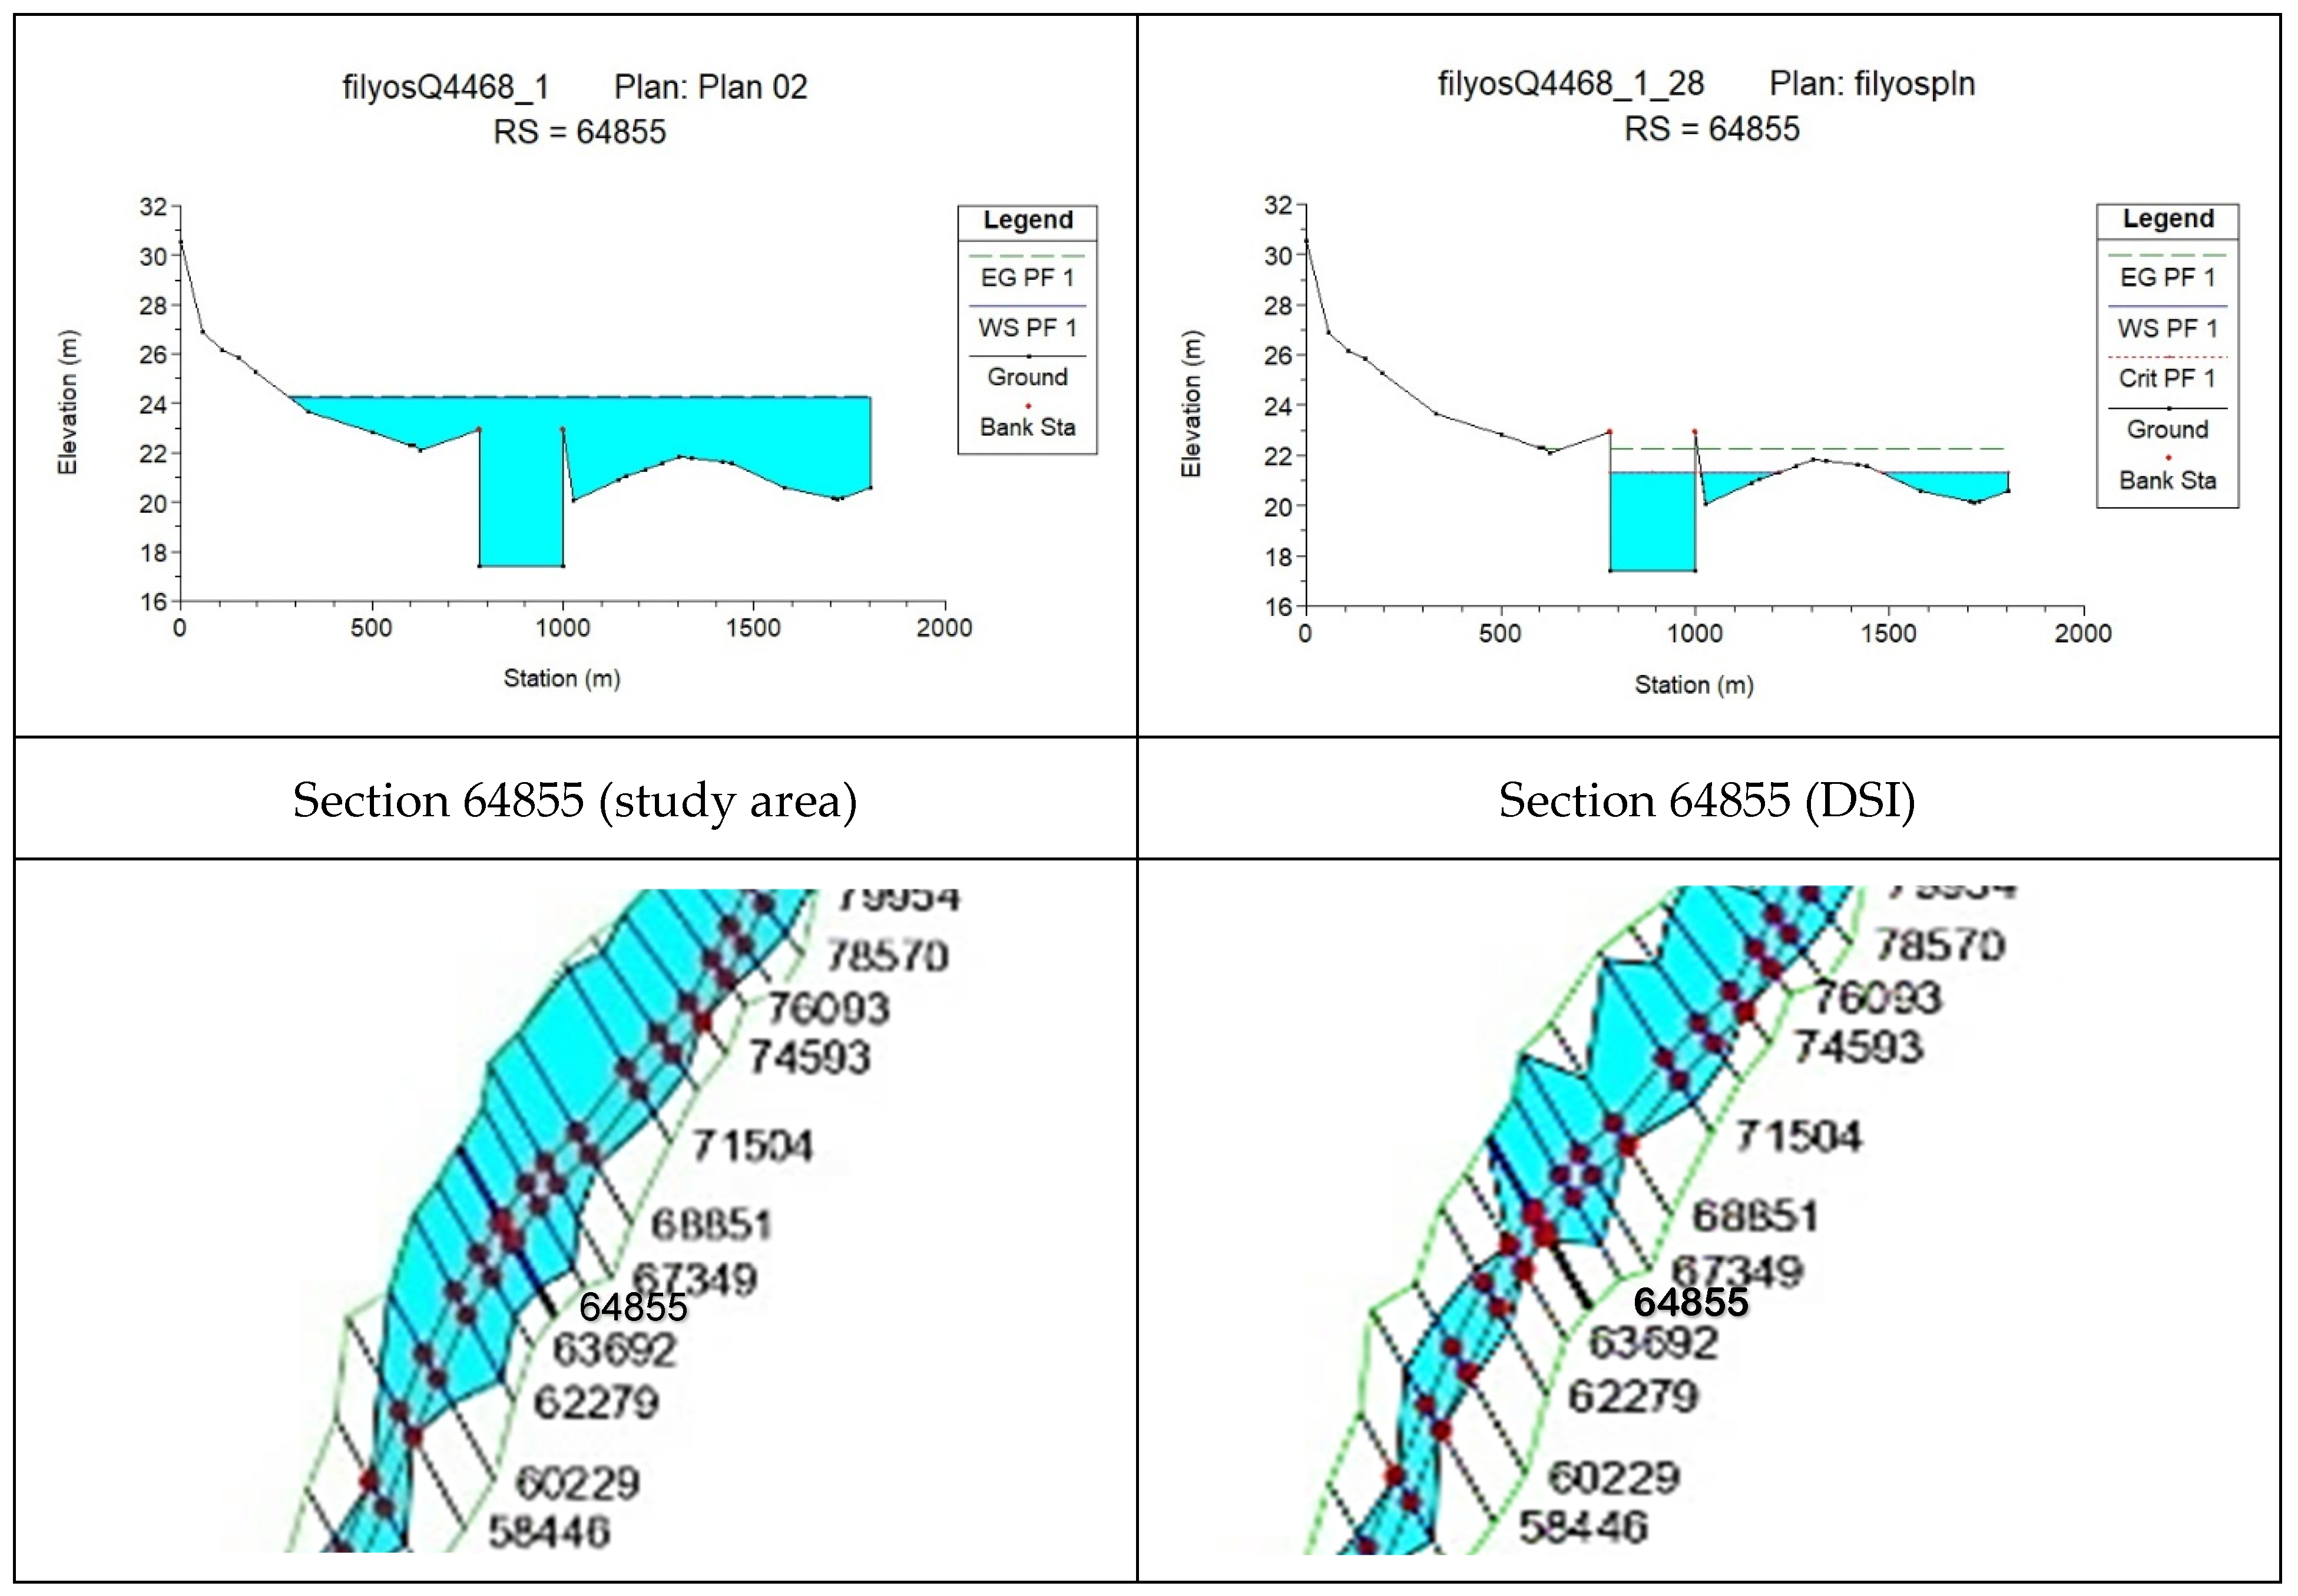
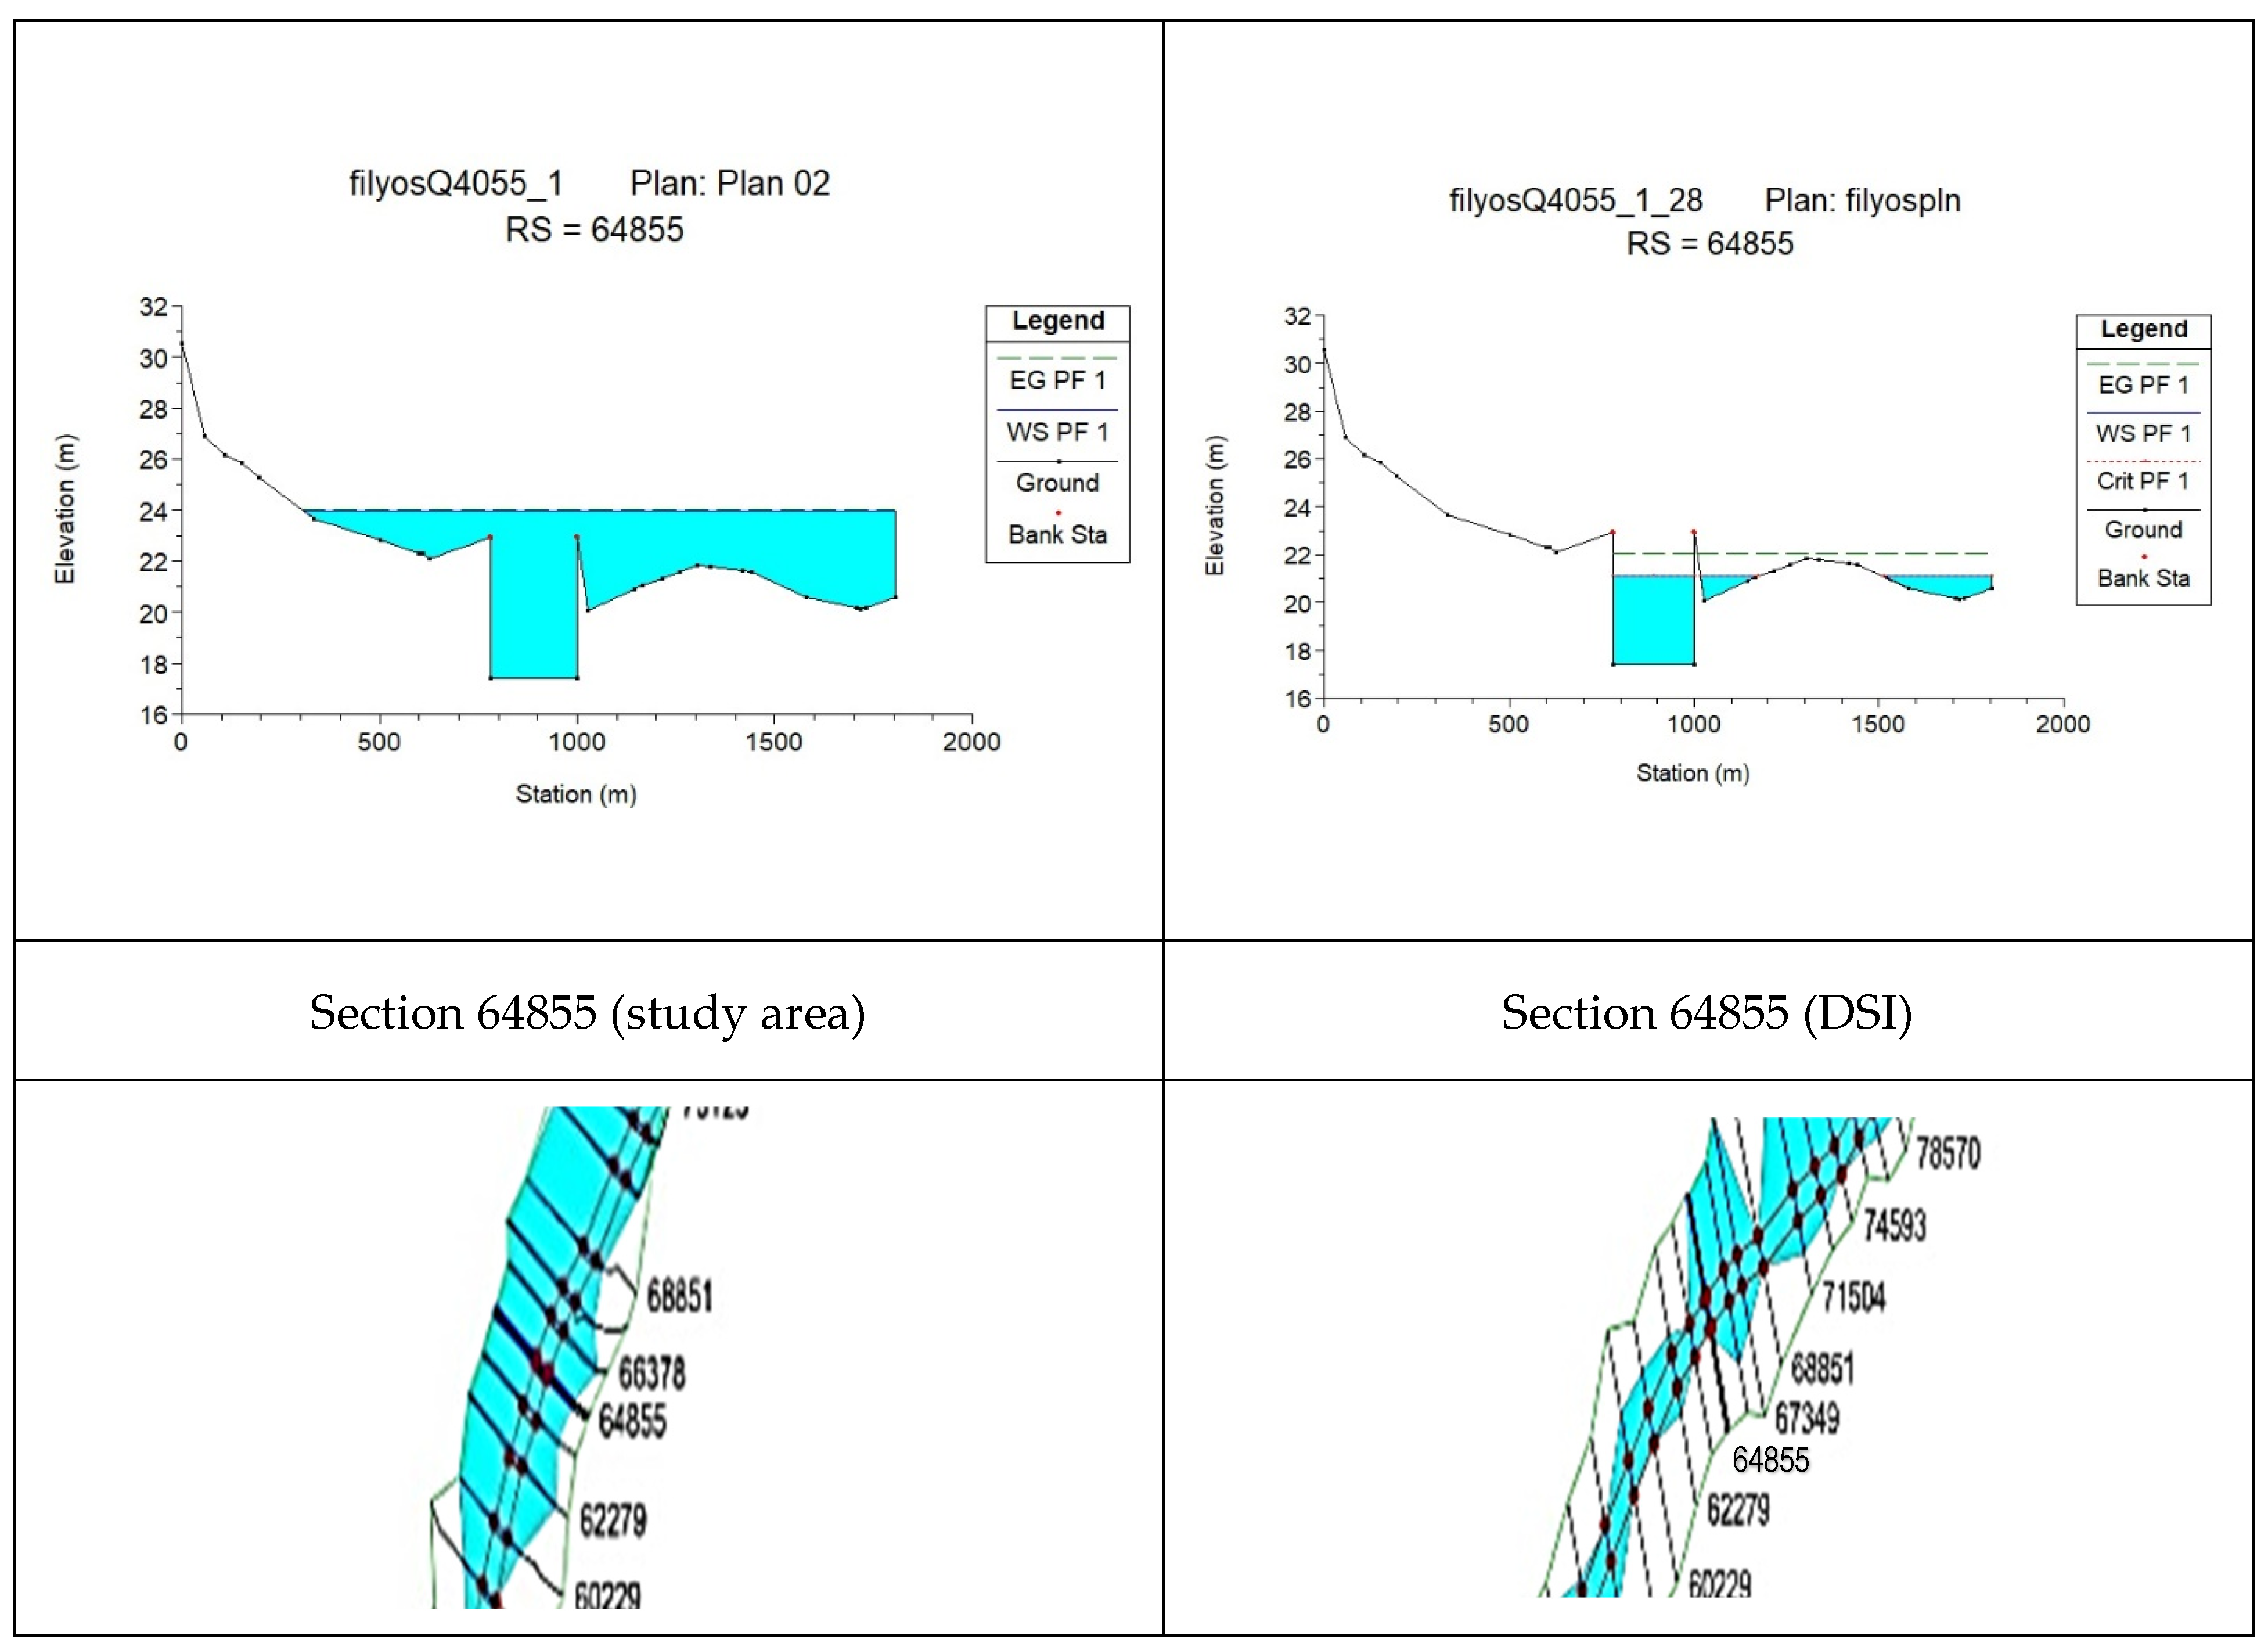
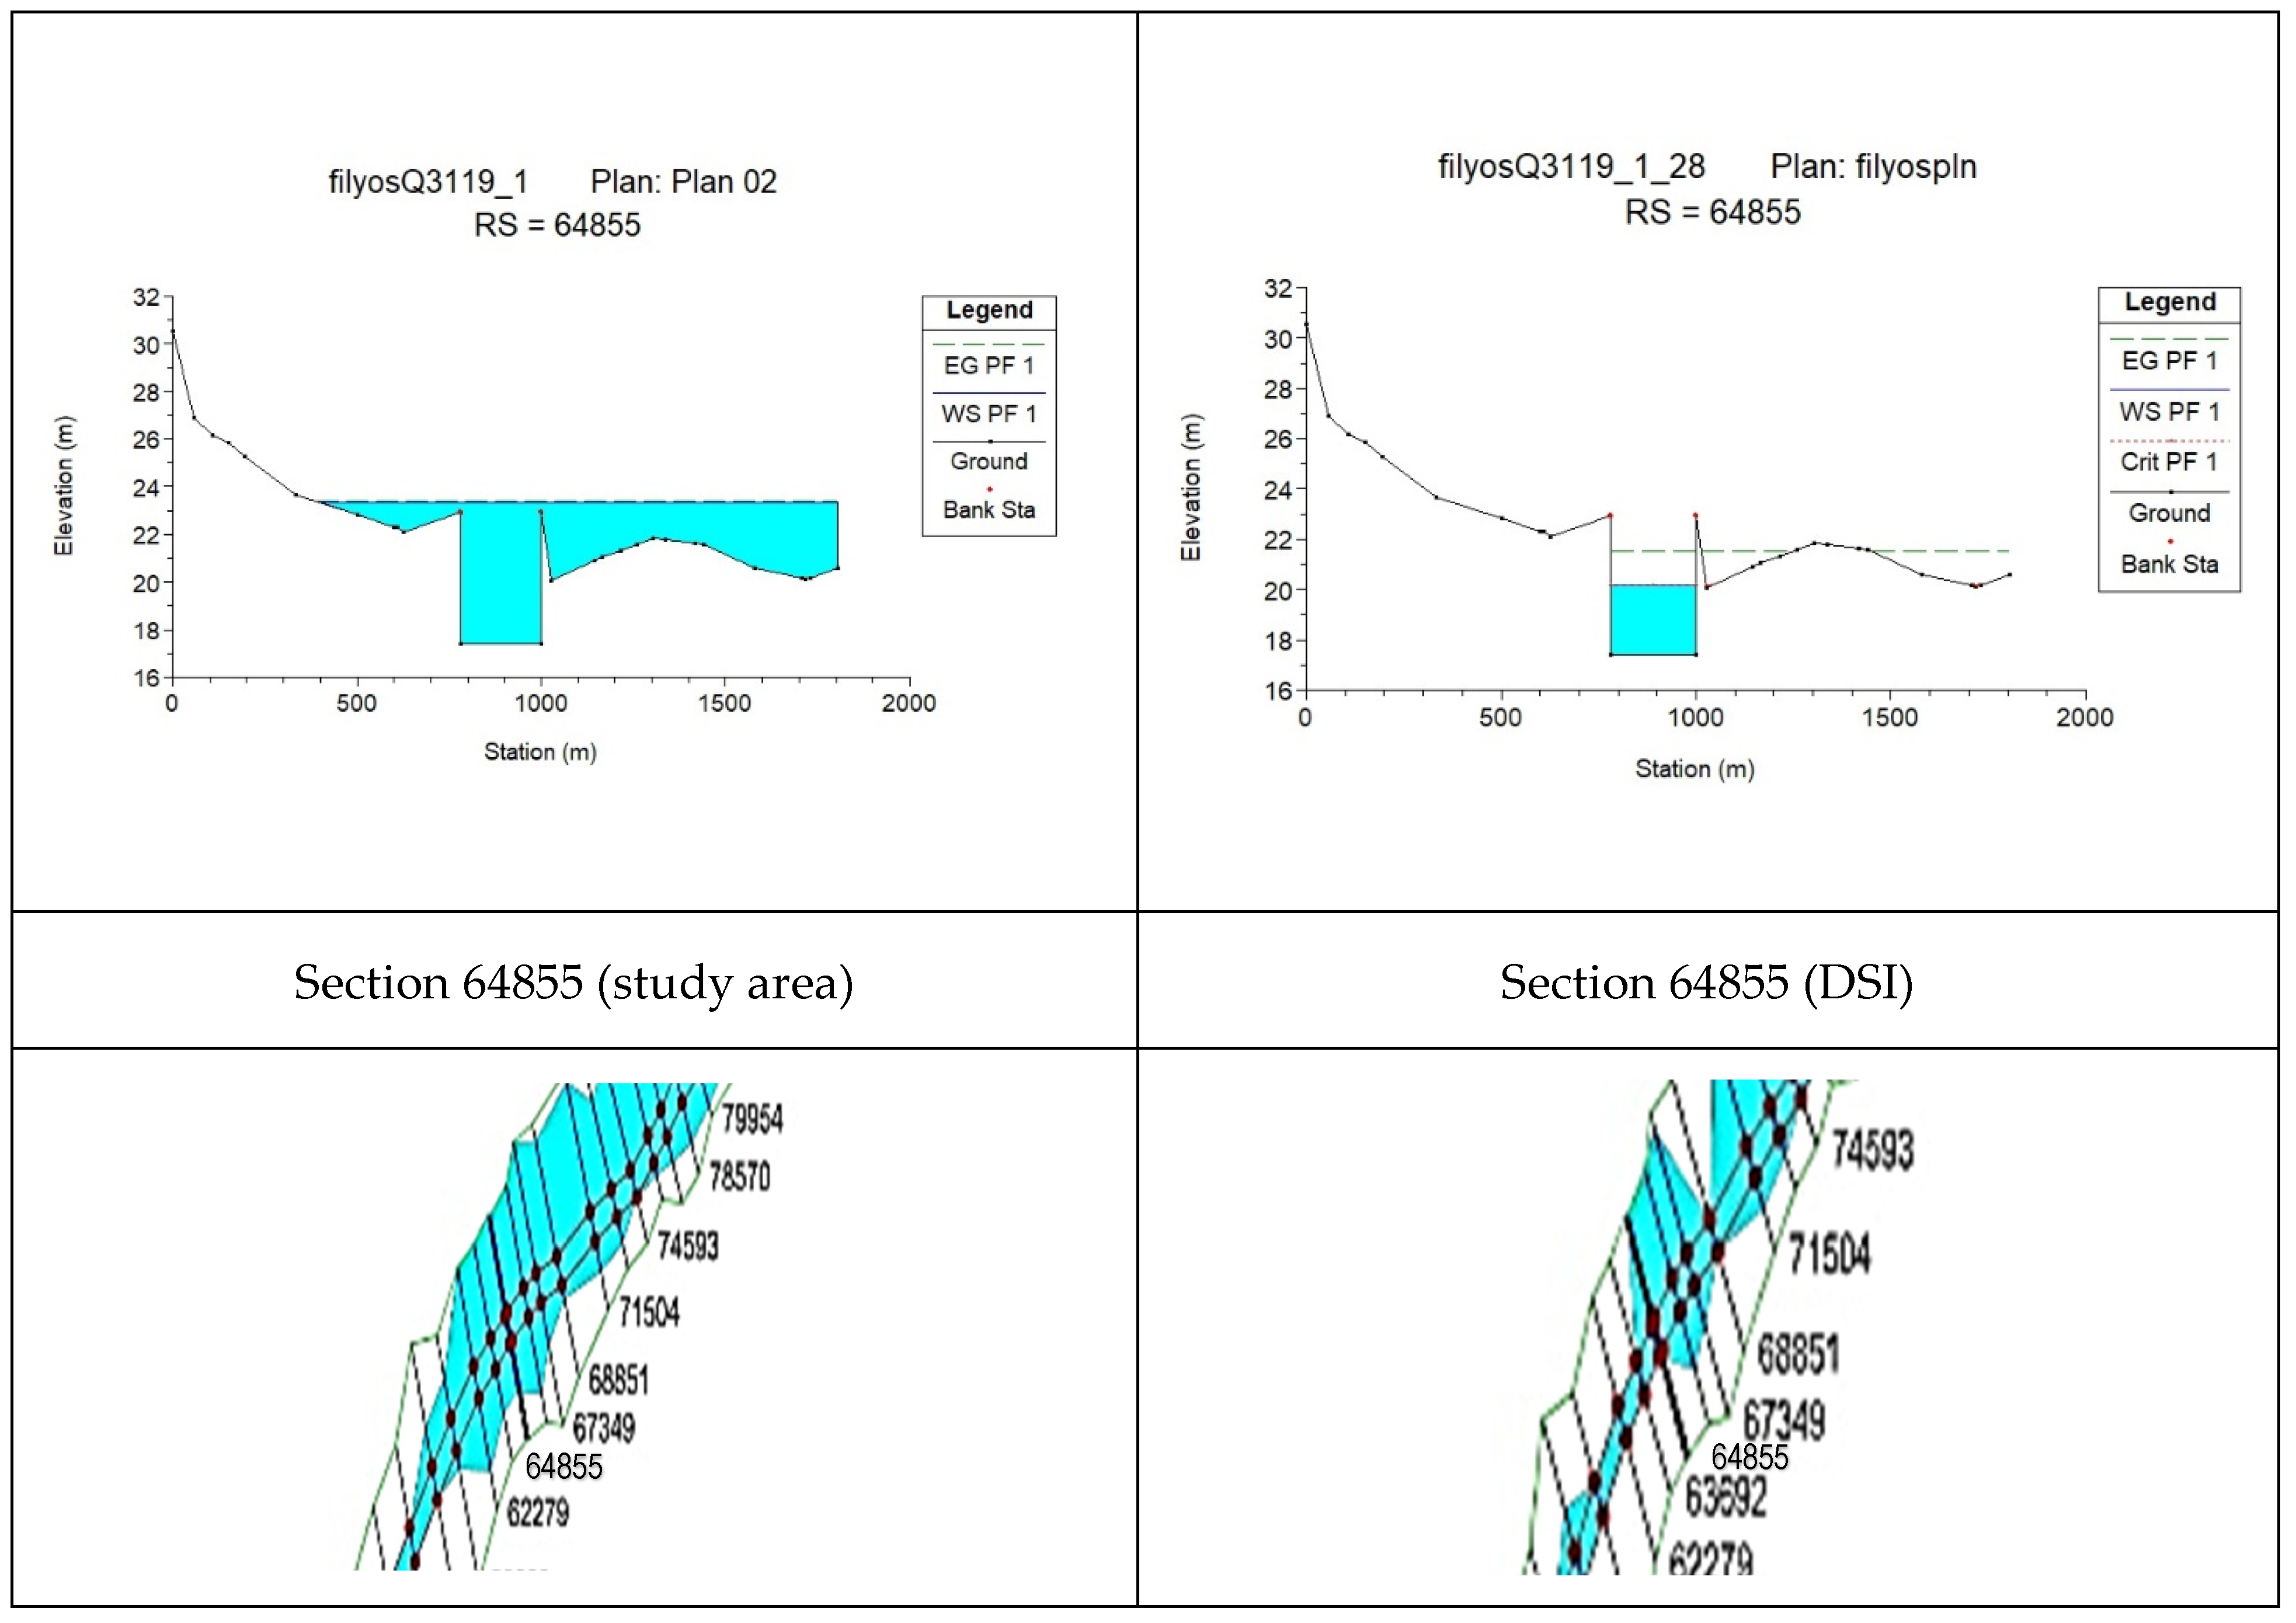
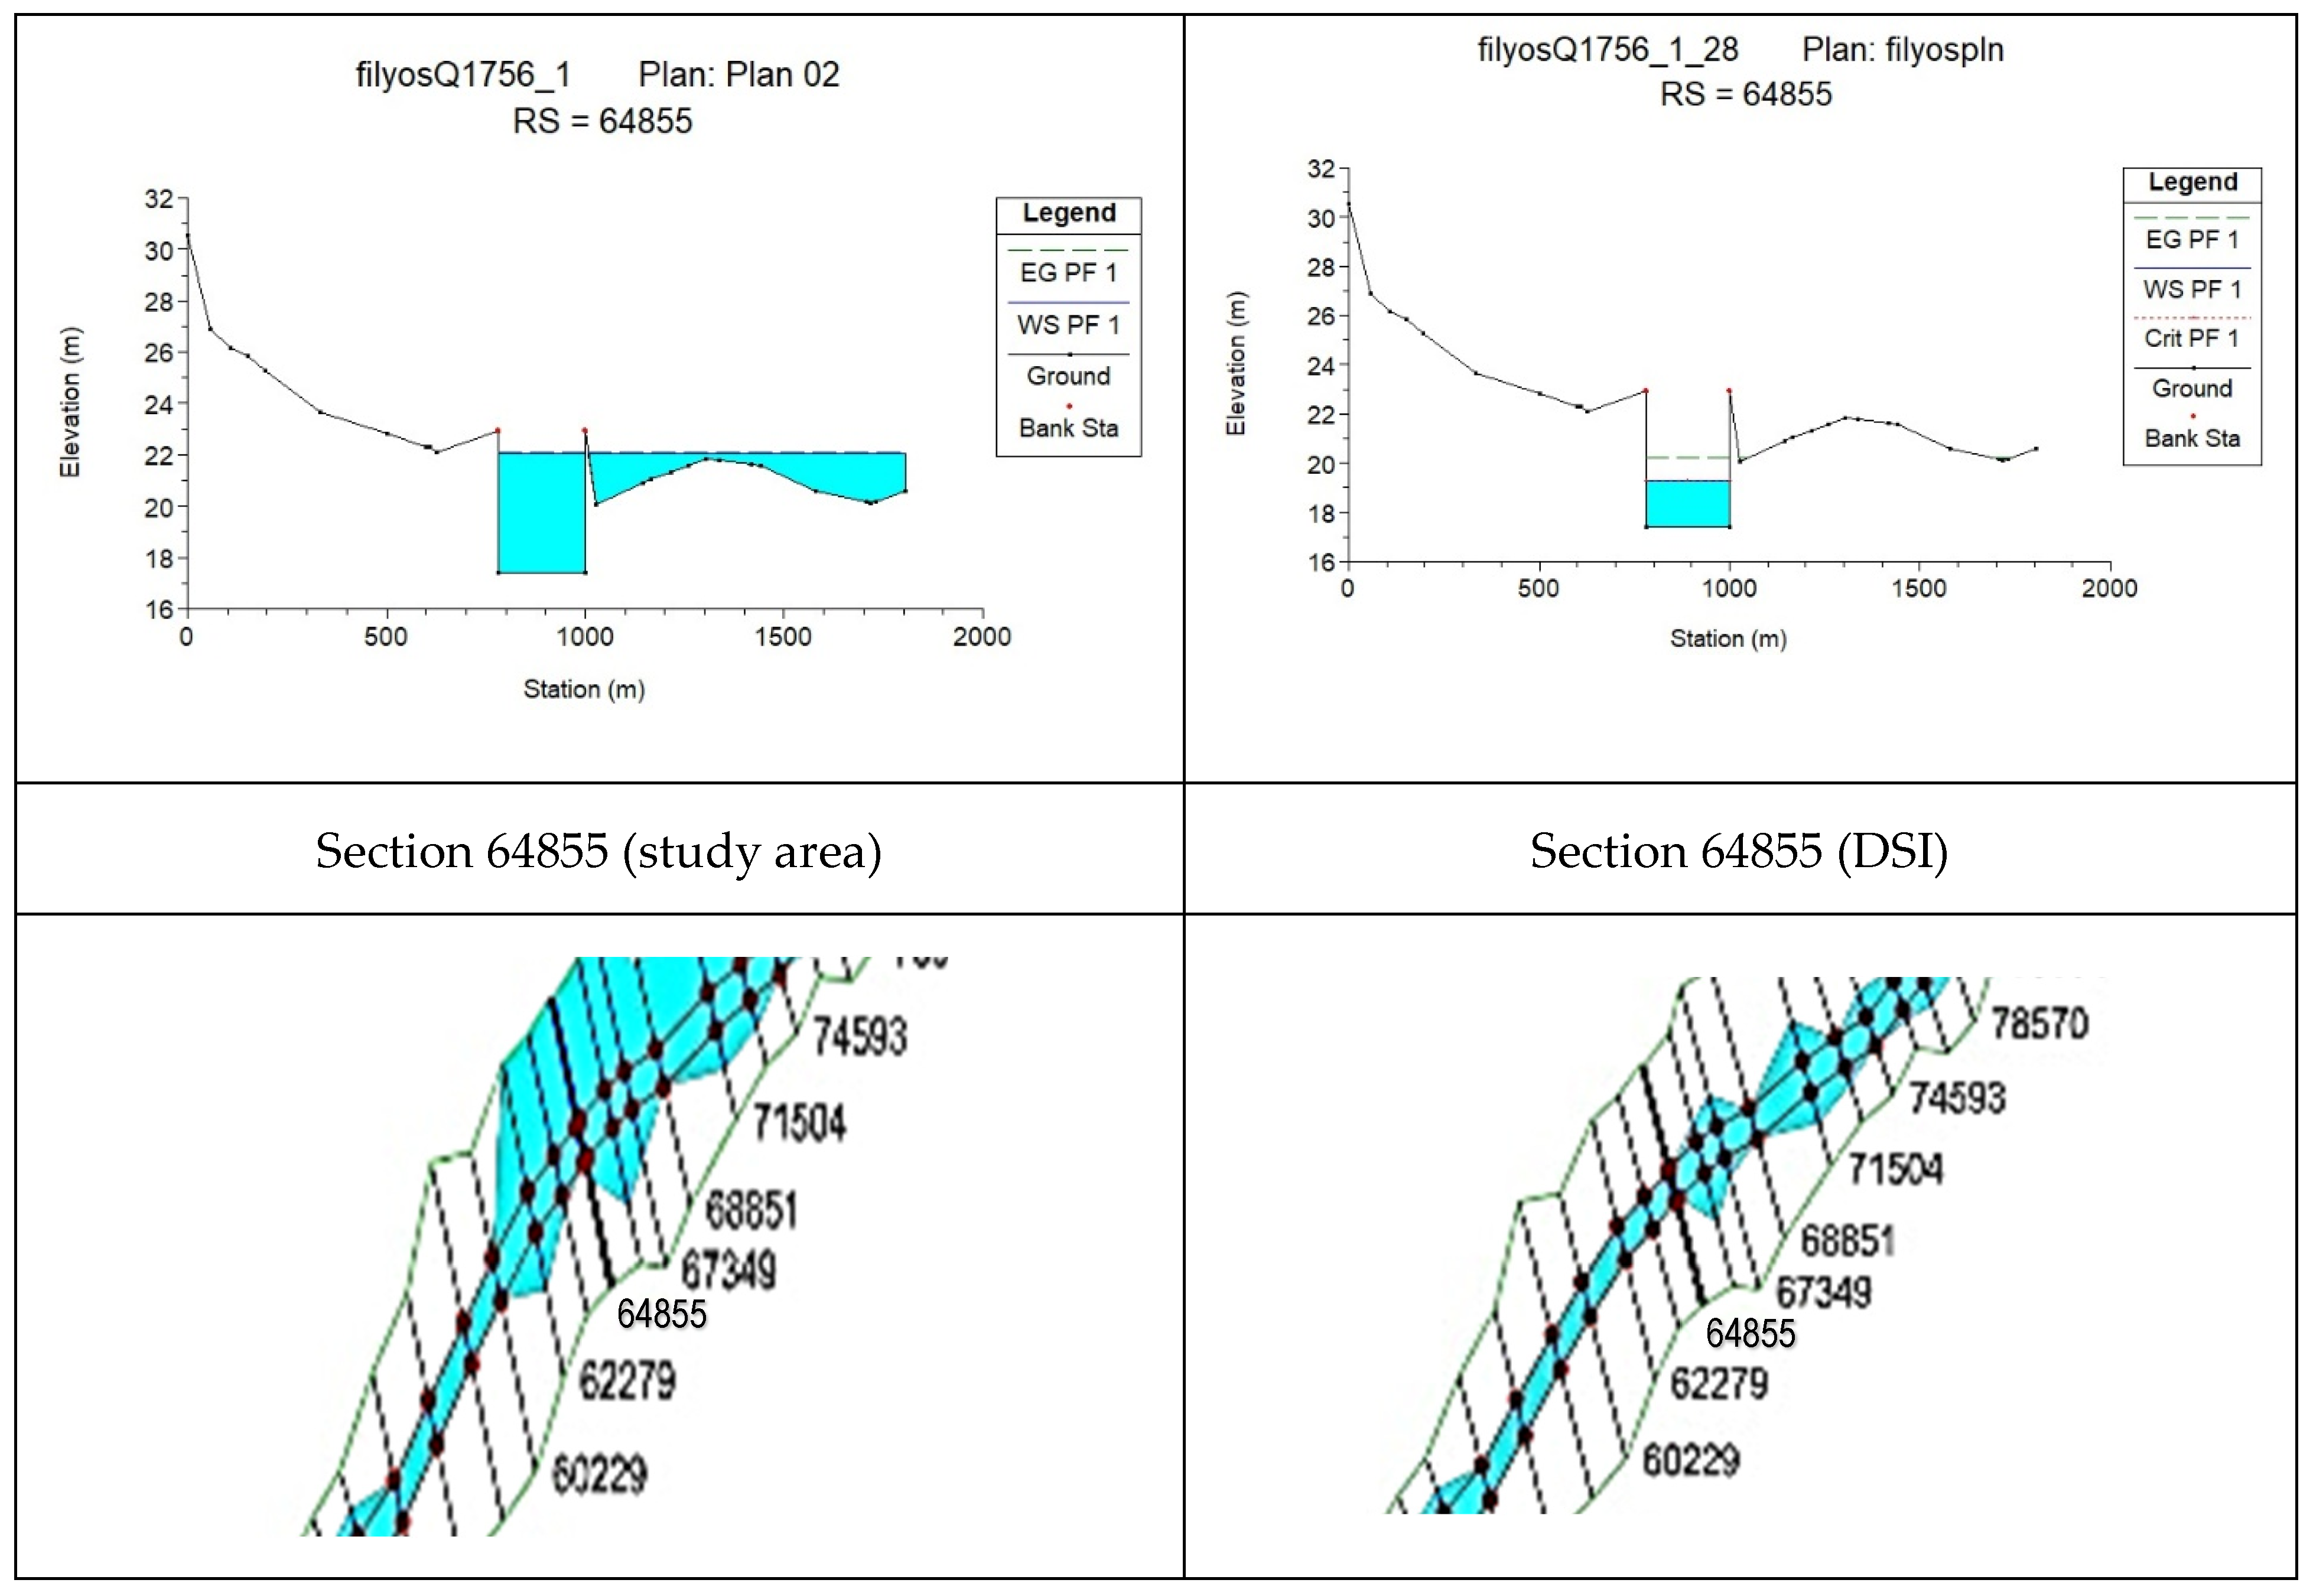
According to the Manning’s coefficient (0.046) obtained as a result of the field study, it was observed that the flood area of the relevant section increased from 778.27 m
2 to 2981.44 m
2. The change in the coefficient resulted in an increase of 70.7% in the maximum depth and 283.1% in the flow area (
Figure 4 and
Figure 5), while the flow velocity decreased by 60.9%.
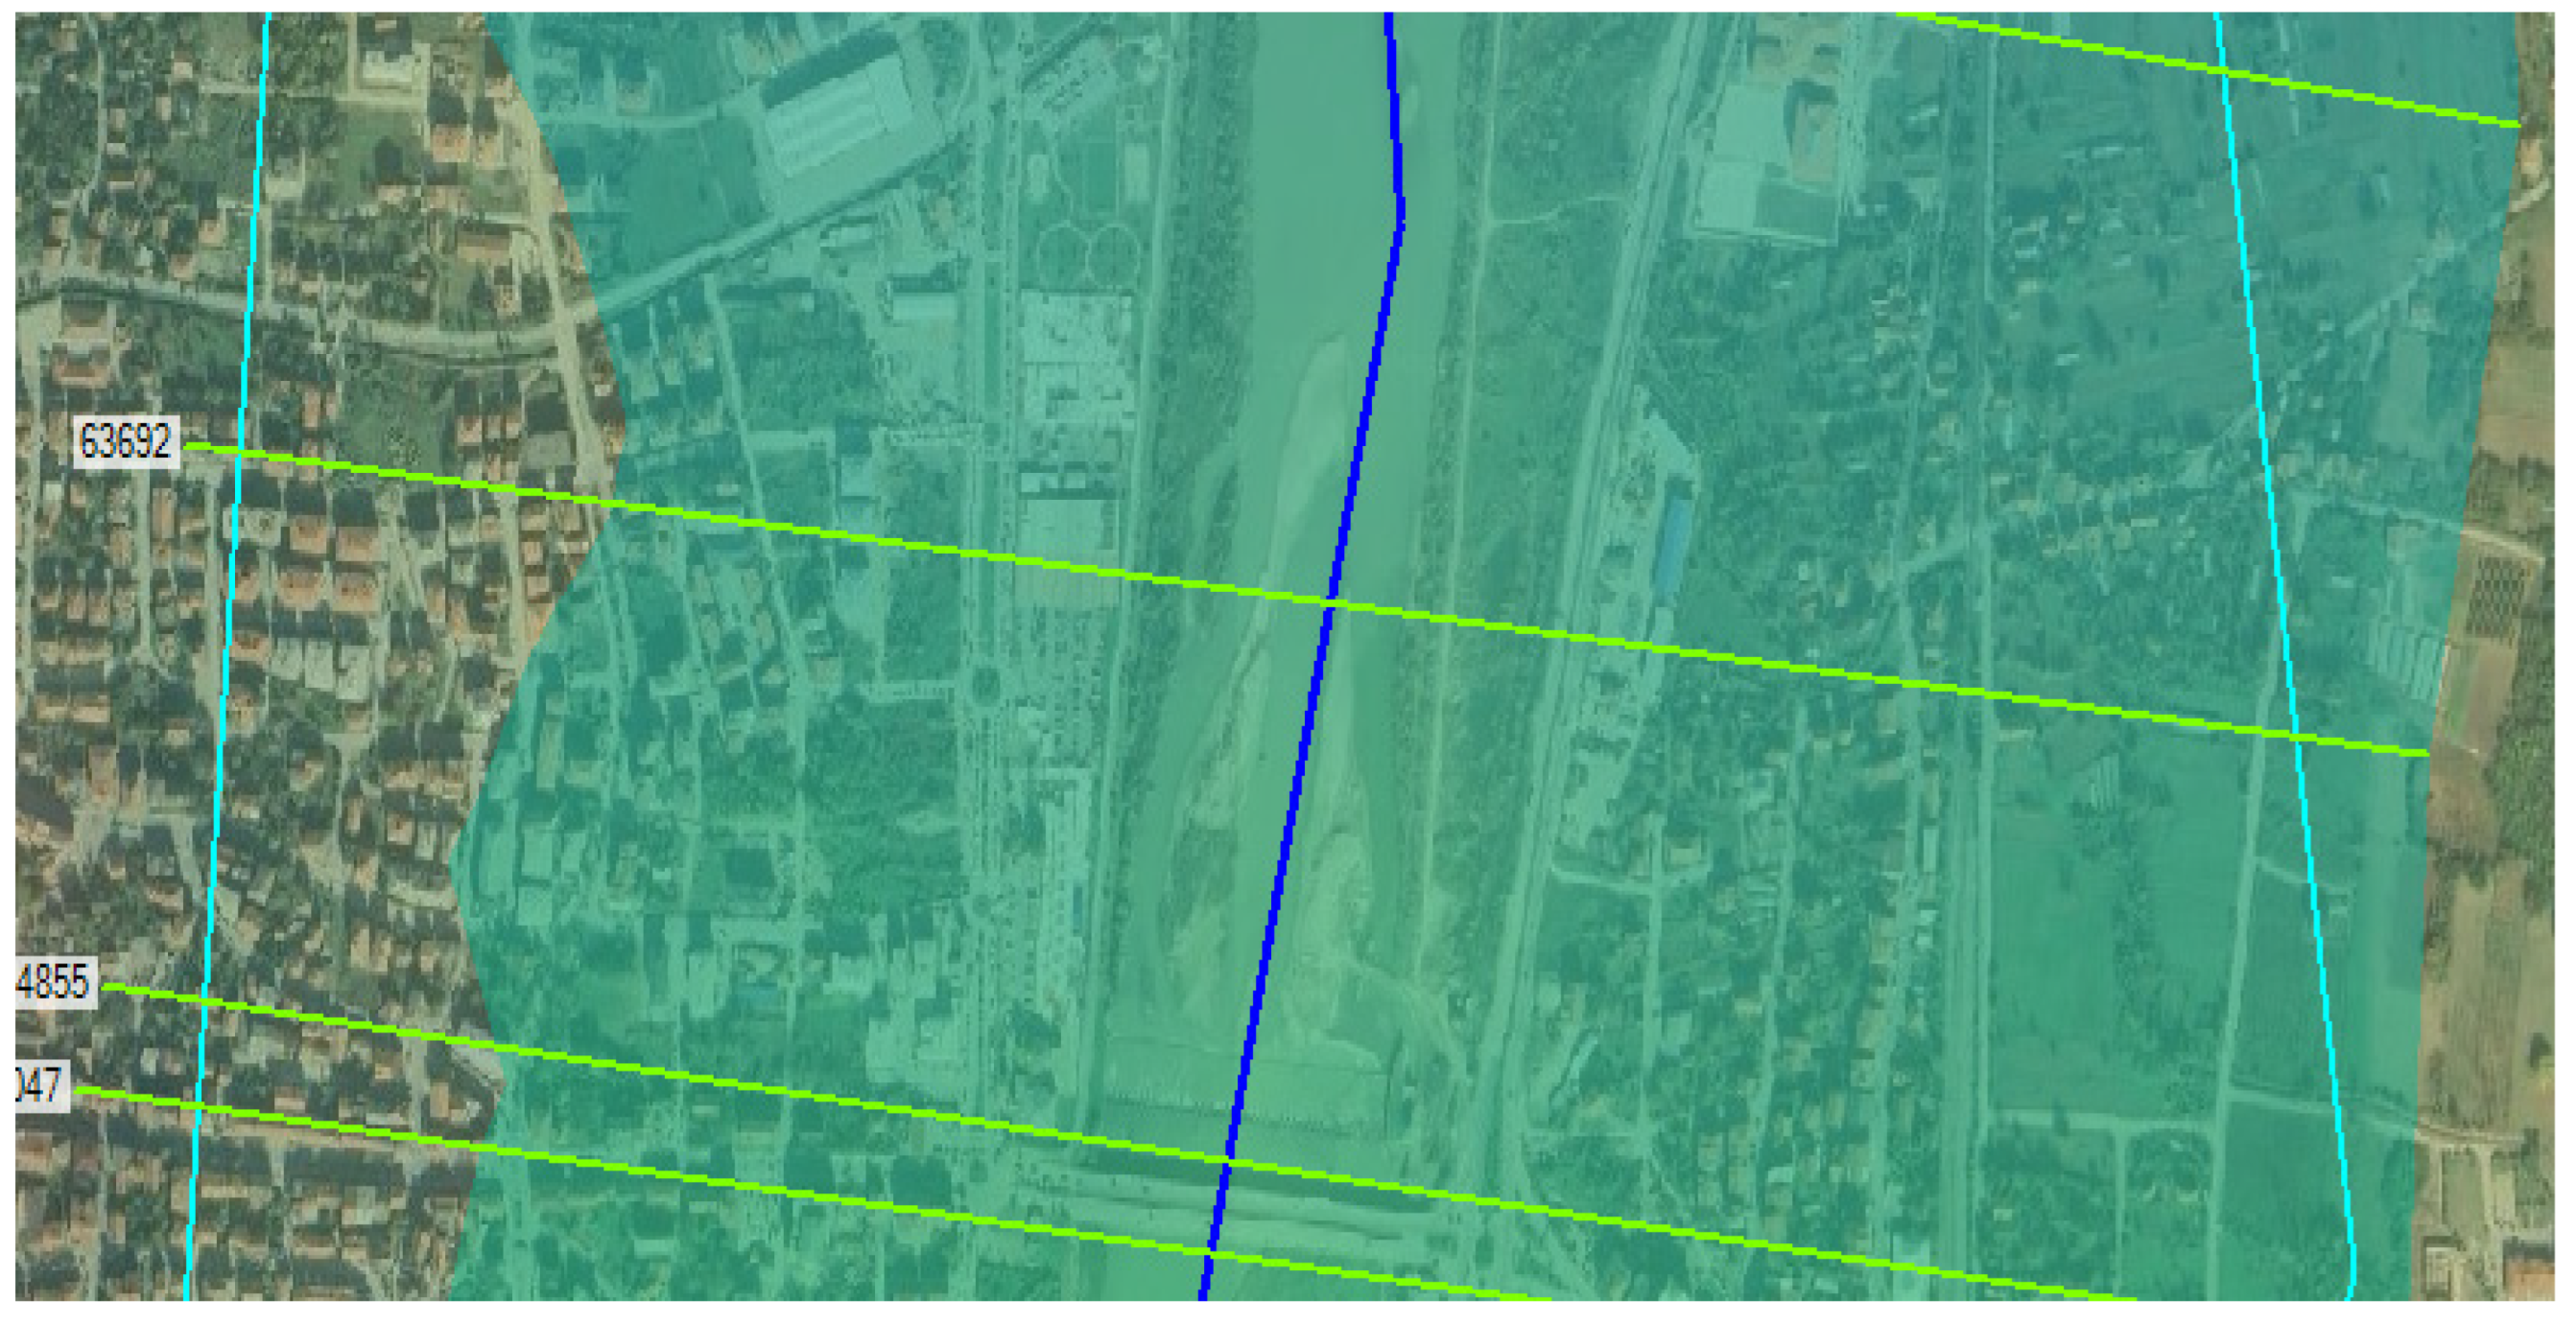
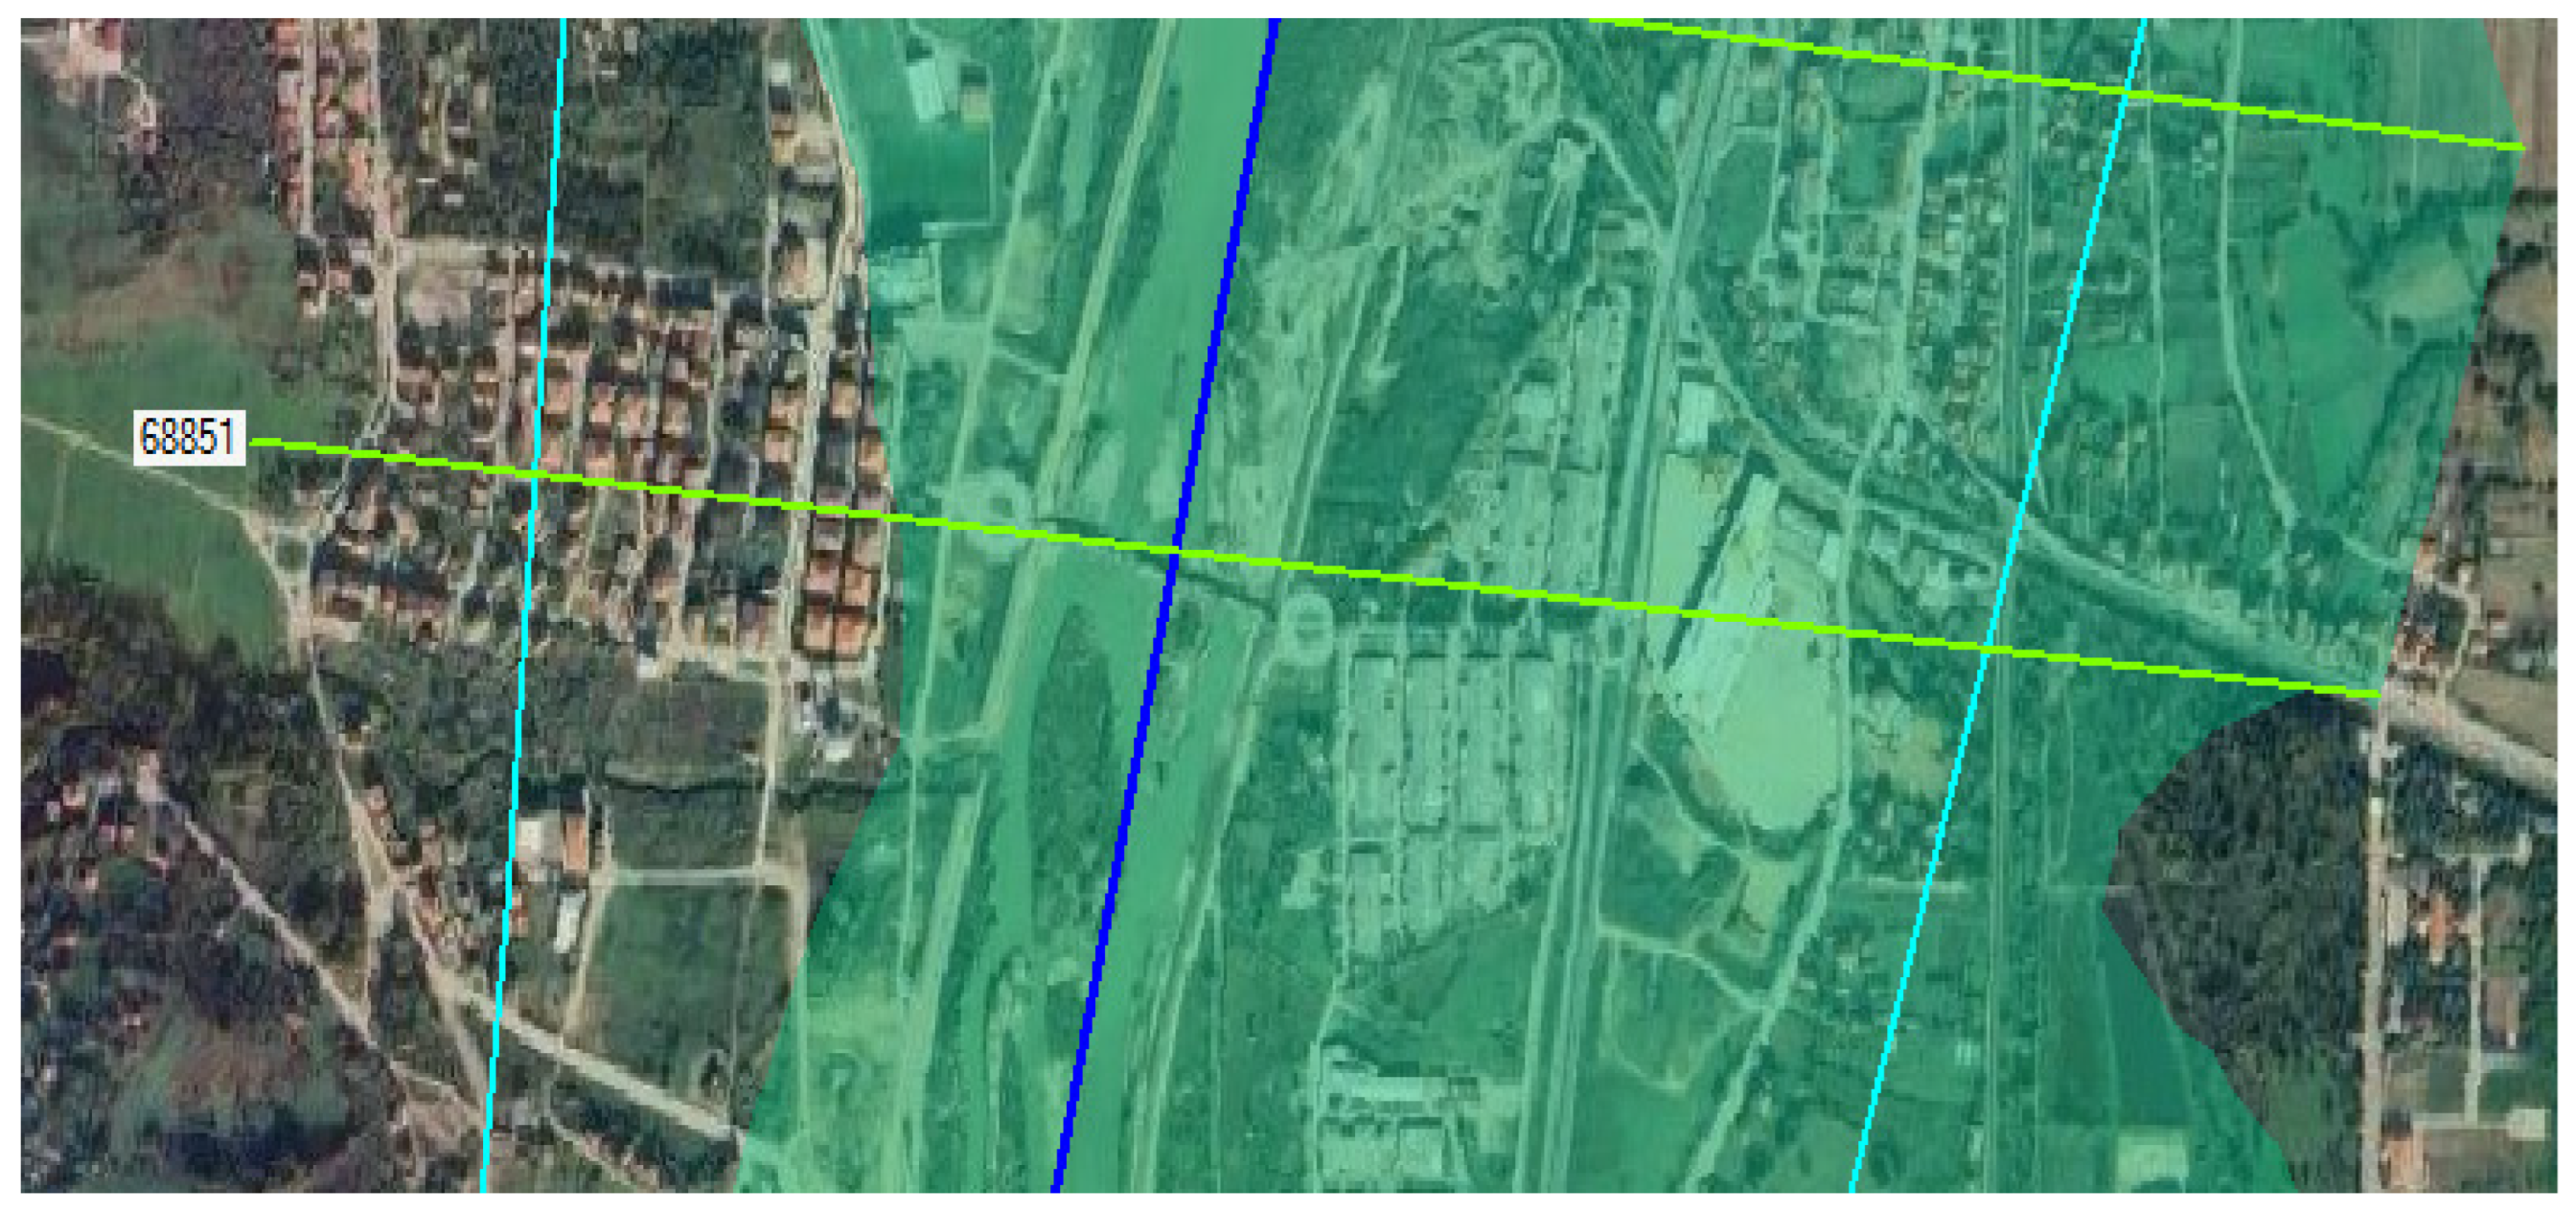
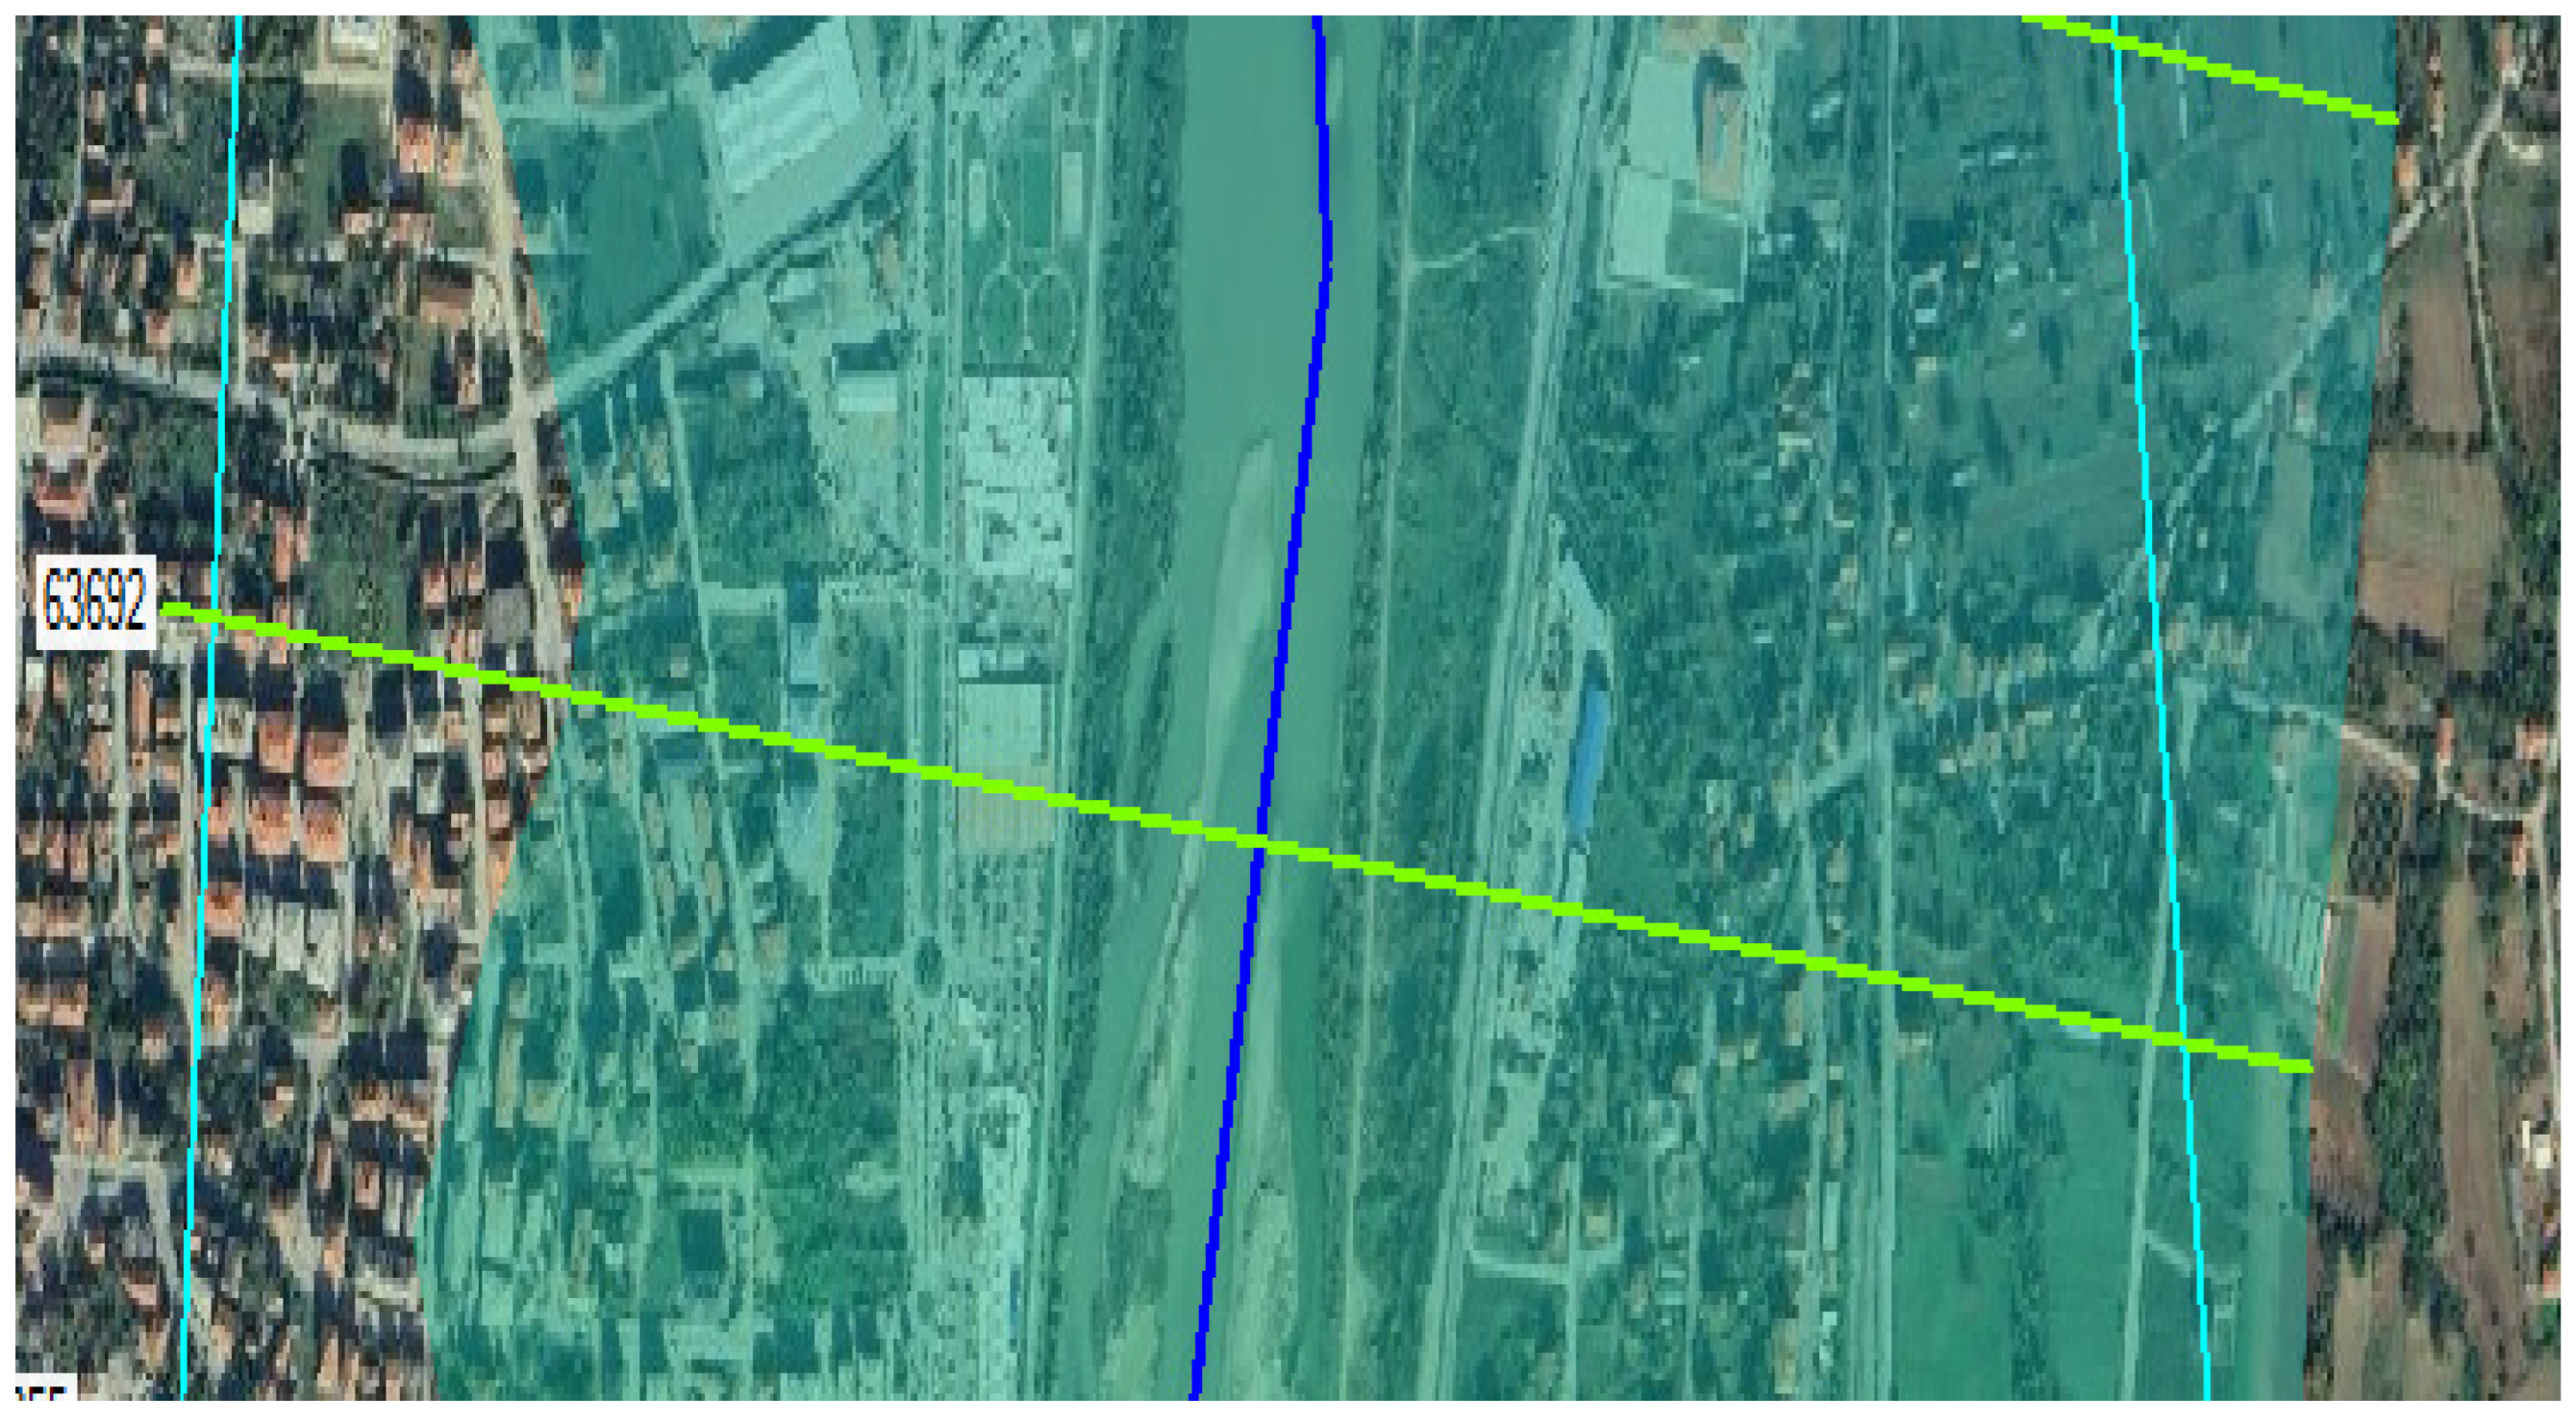
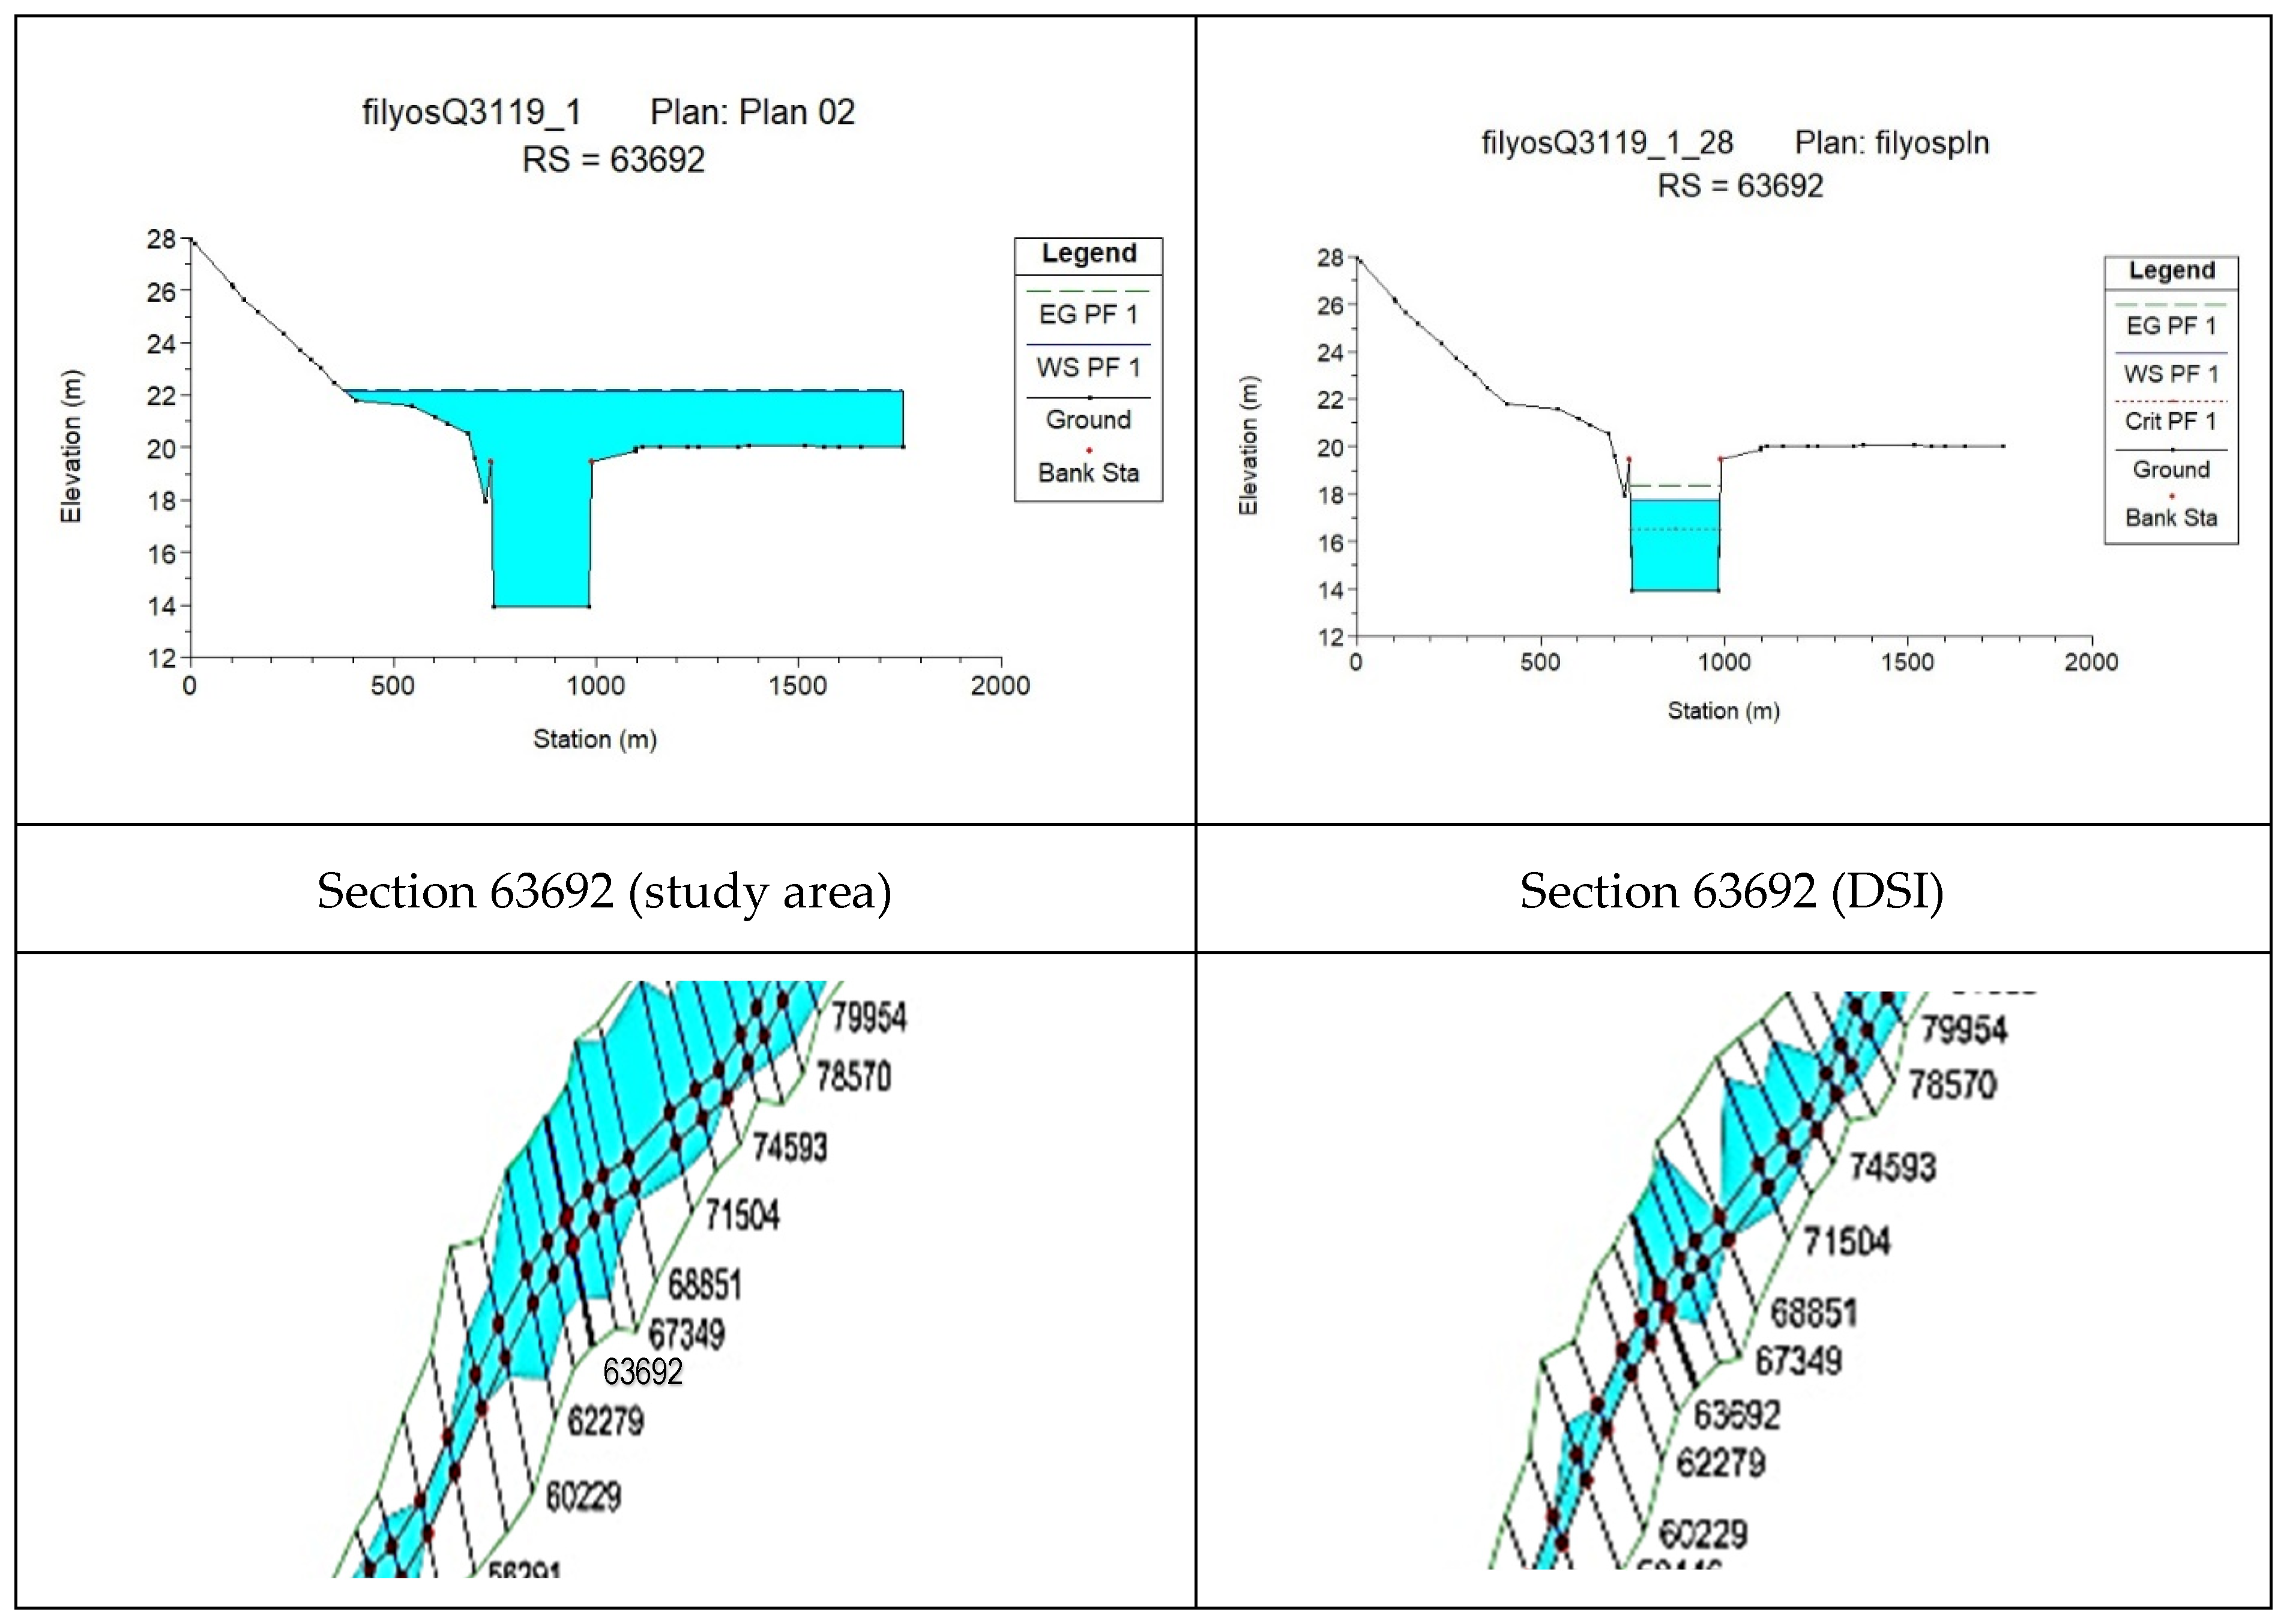
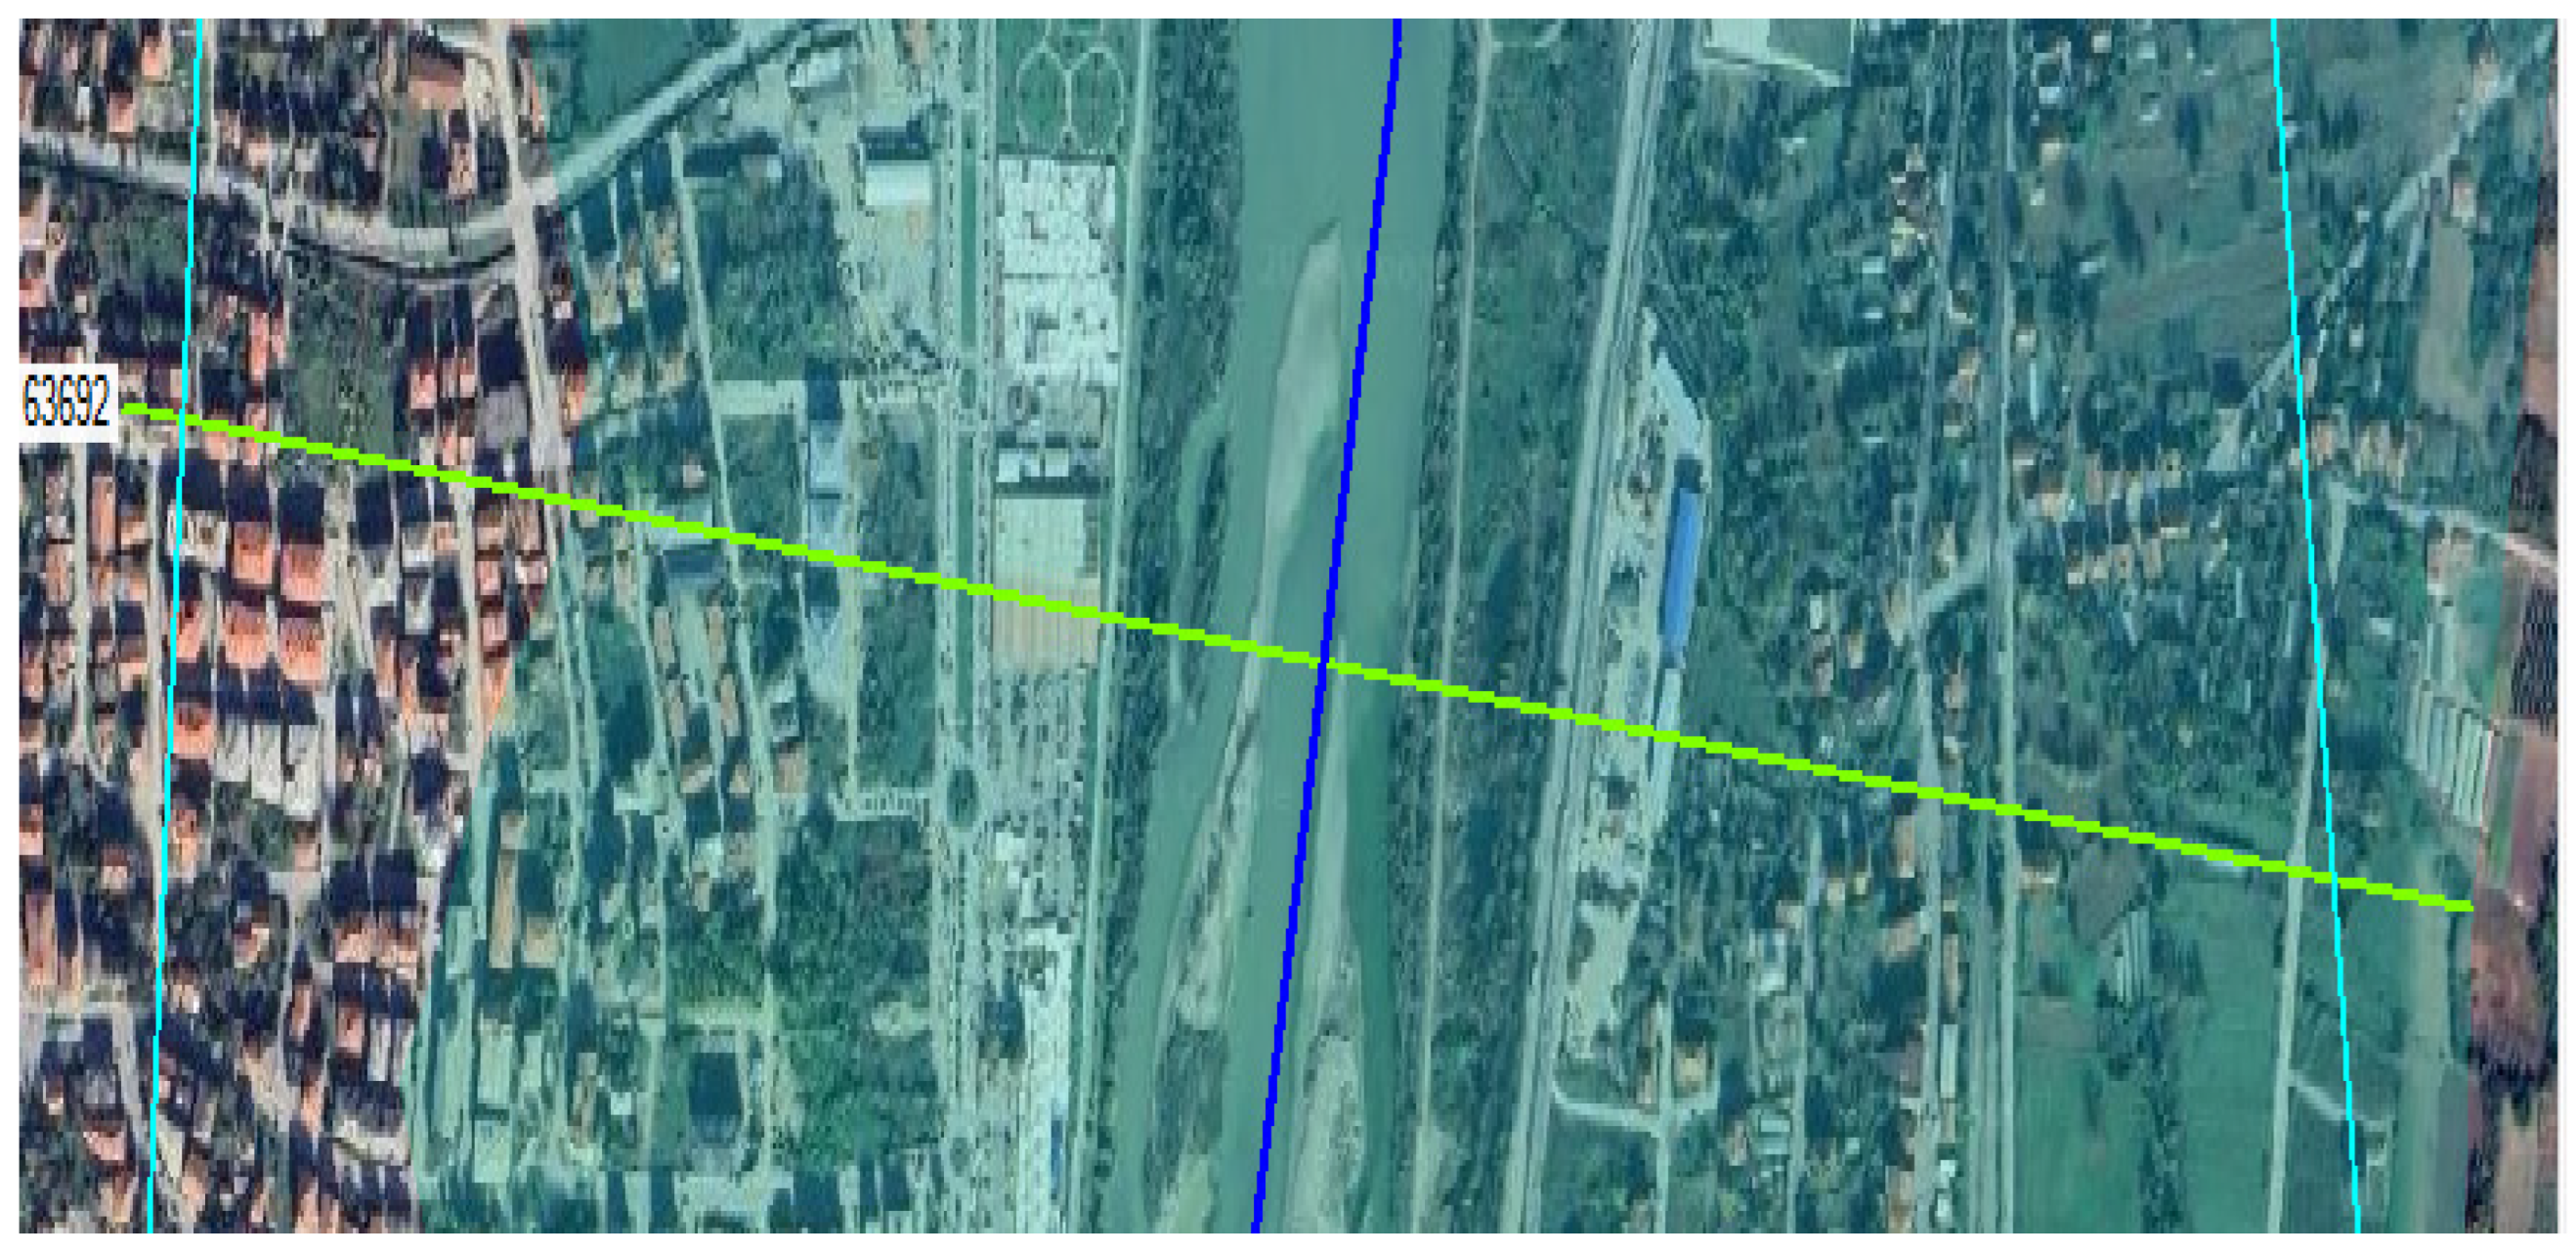
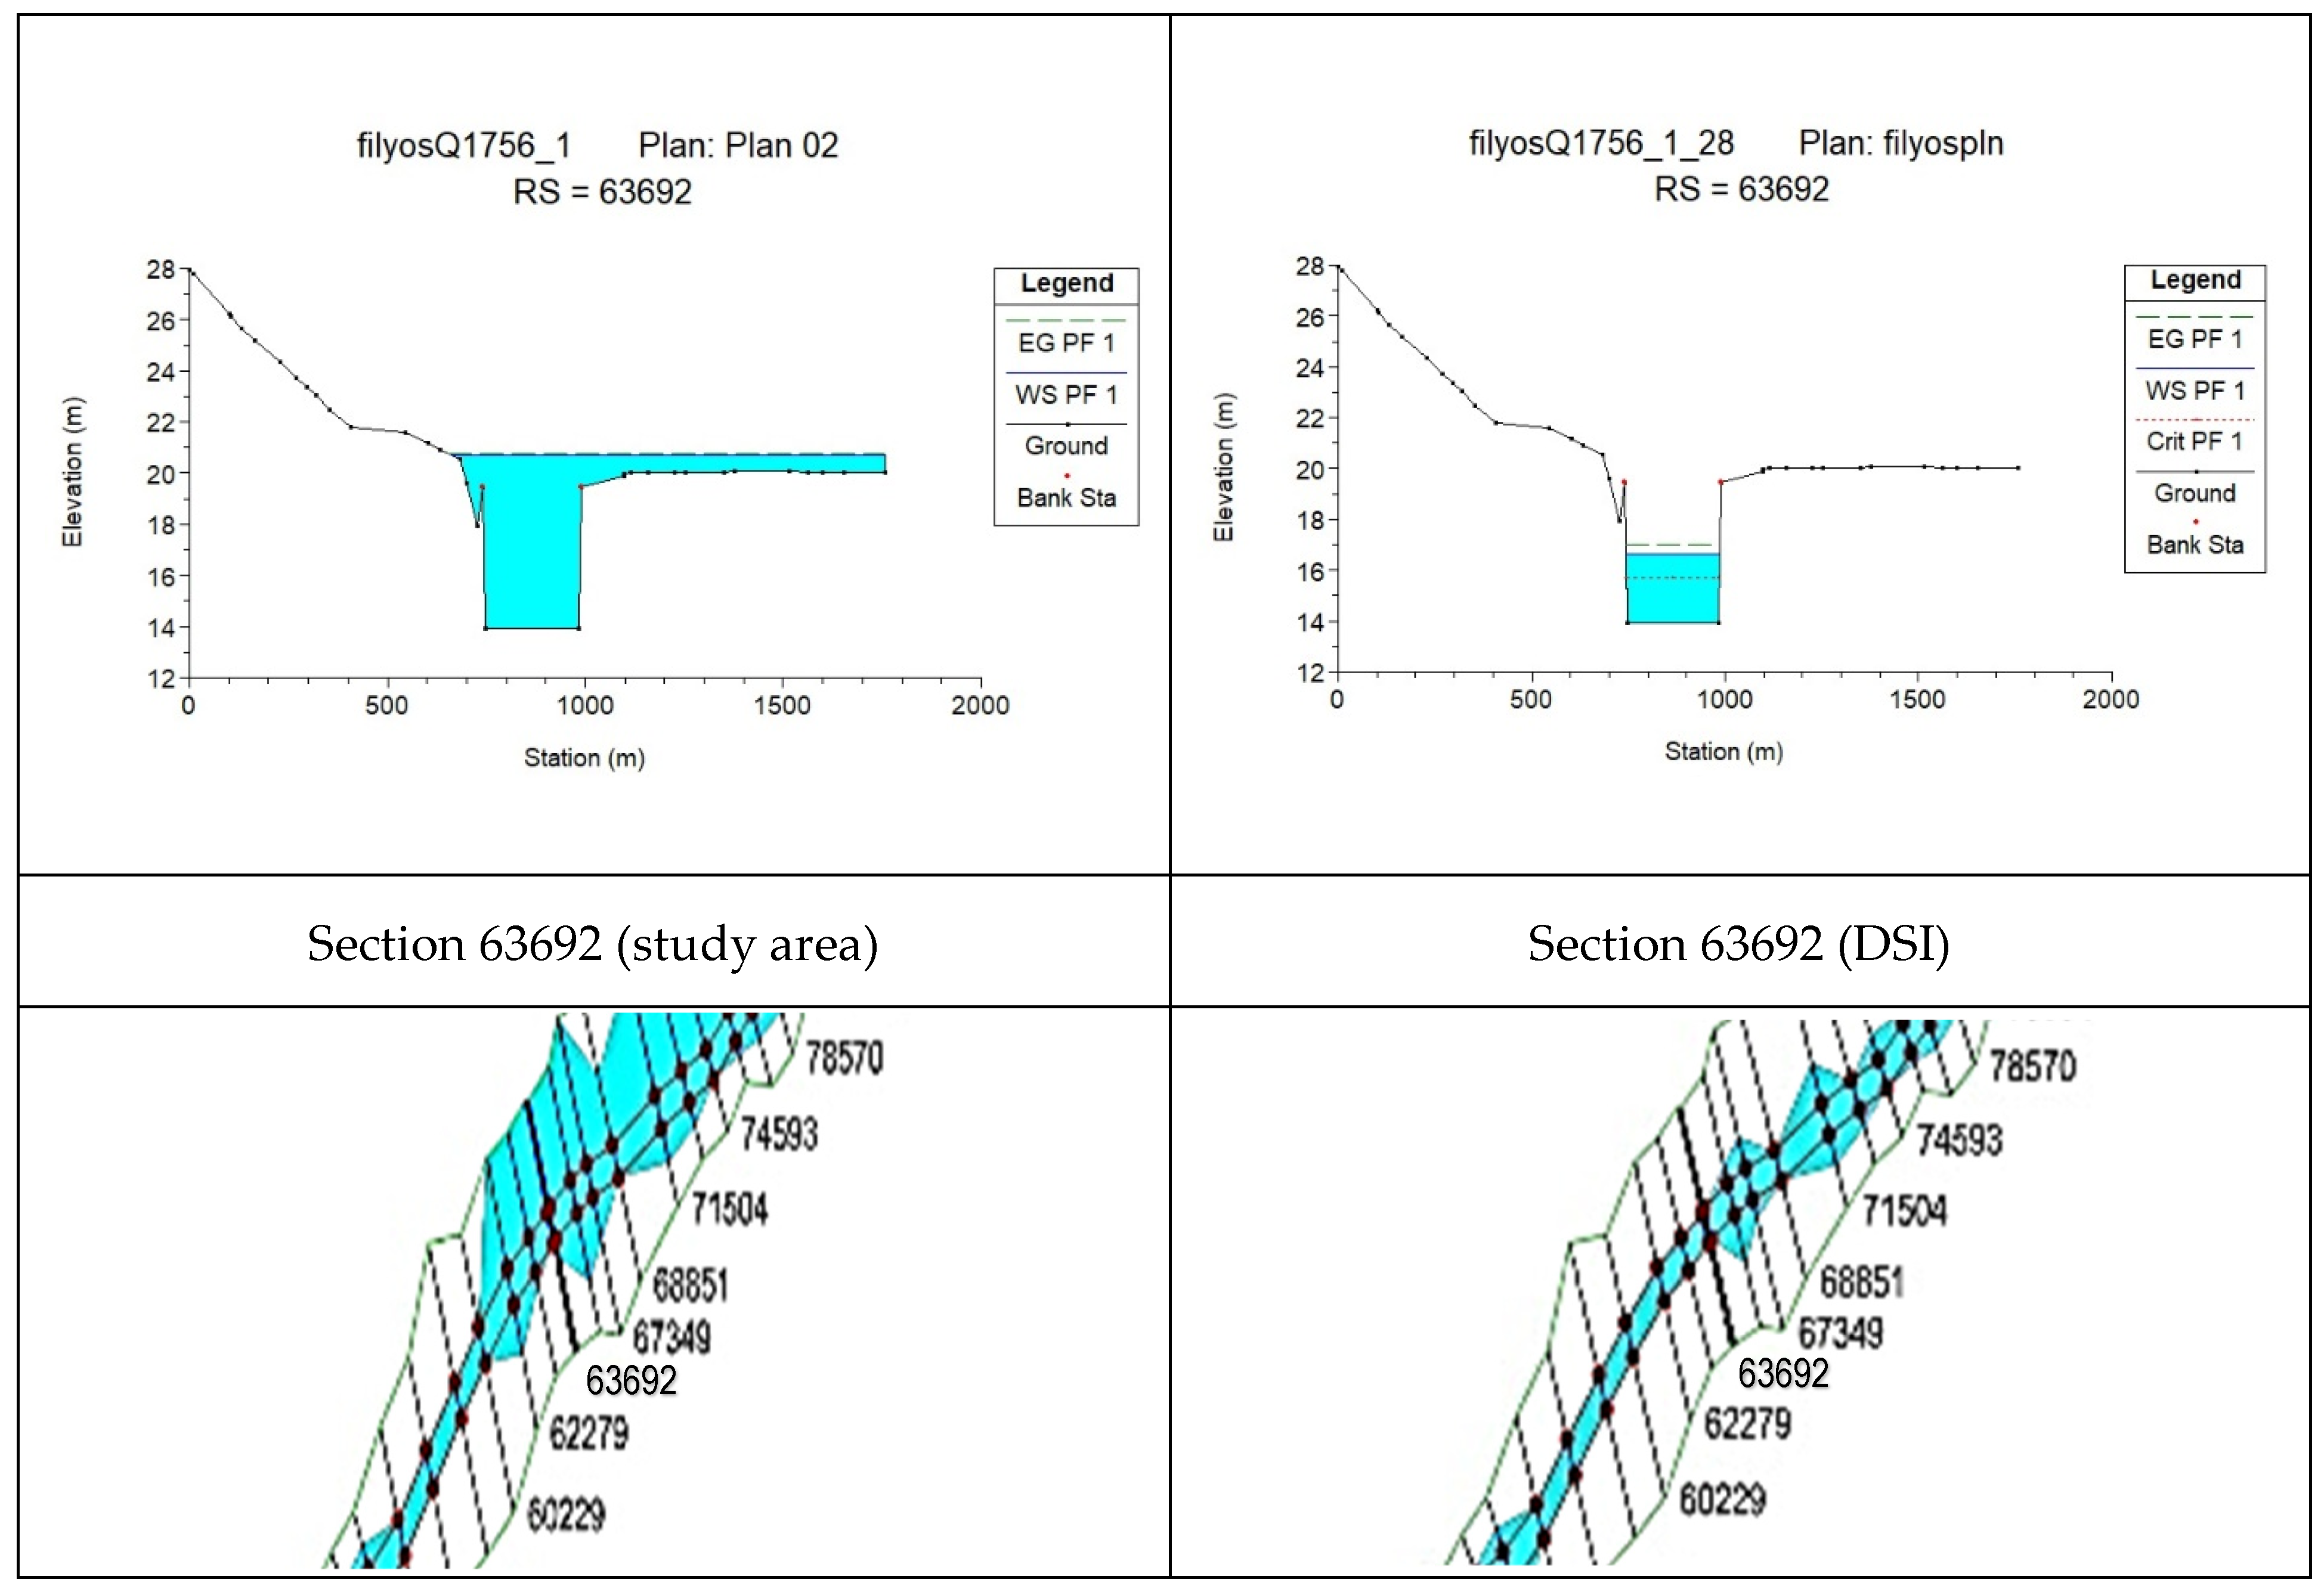
In cross-section 63692, the change in roughness caused an increase in maximum depth (315%) and flow area (923.3%), but a decrease in flow velocity (85.8%) (
Figure 6 and
Figure 7).
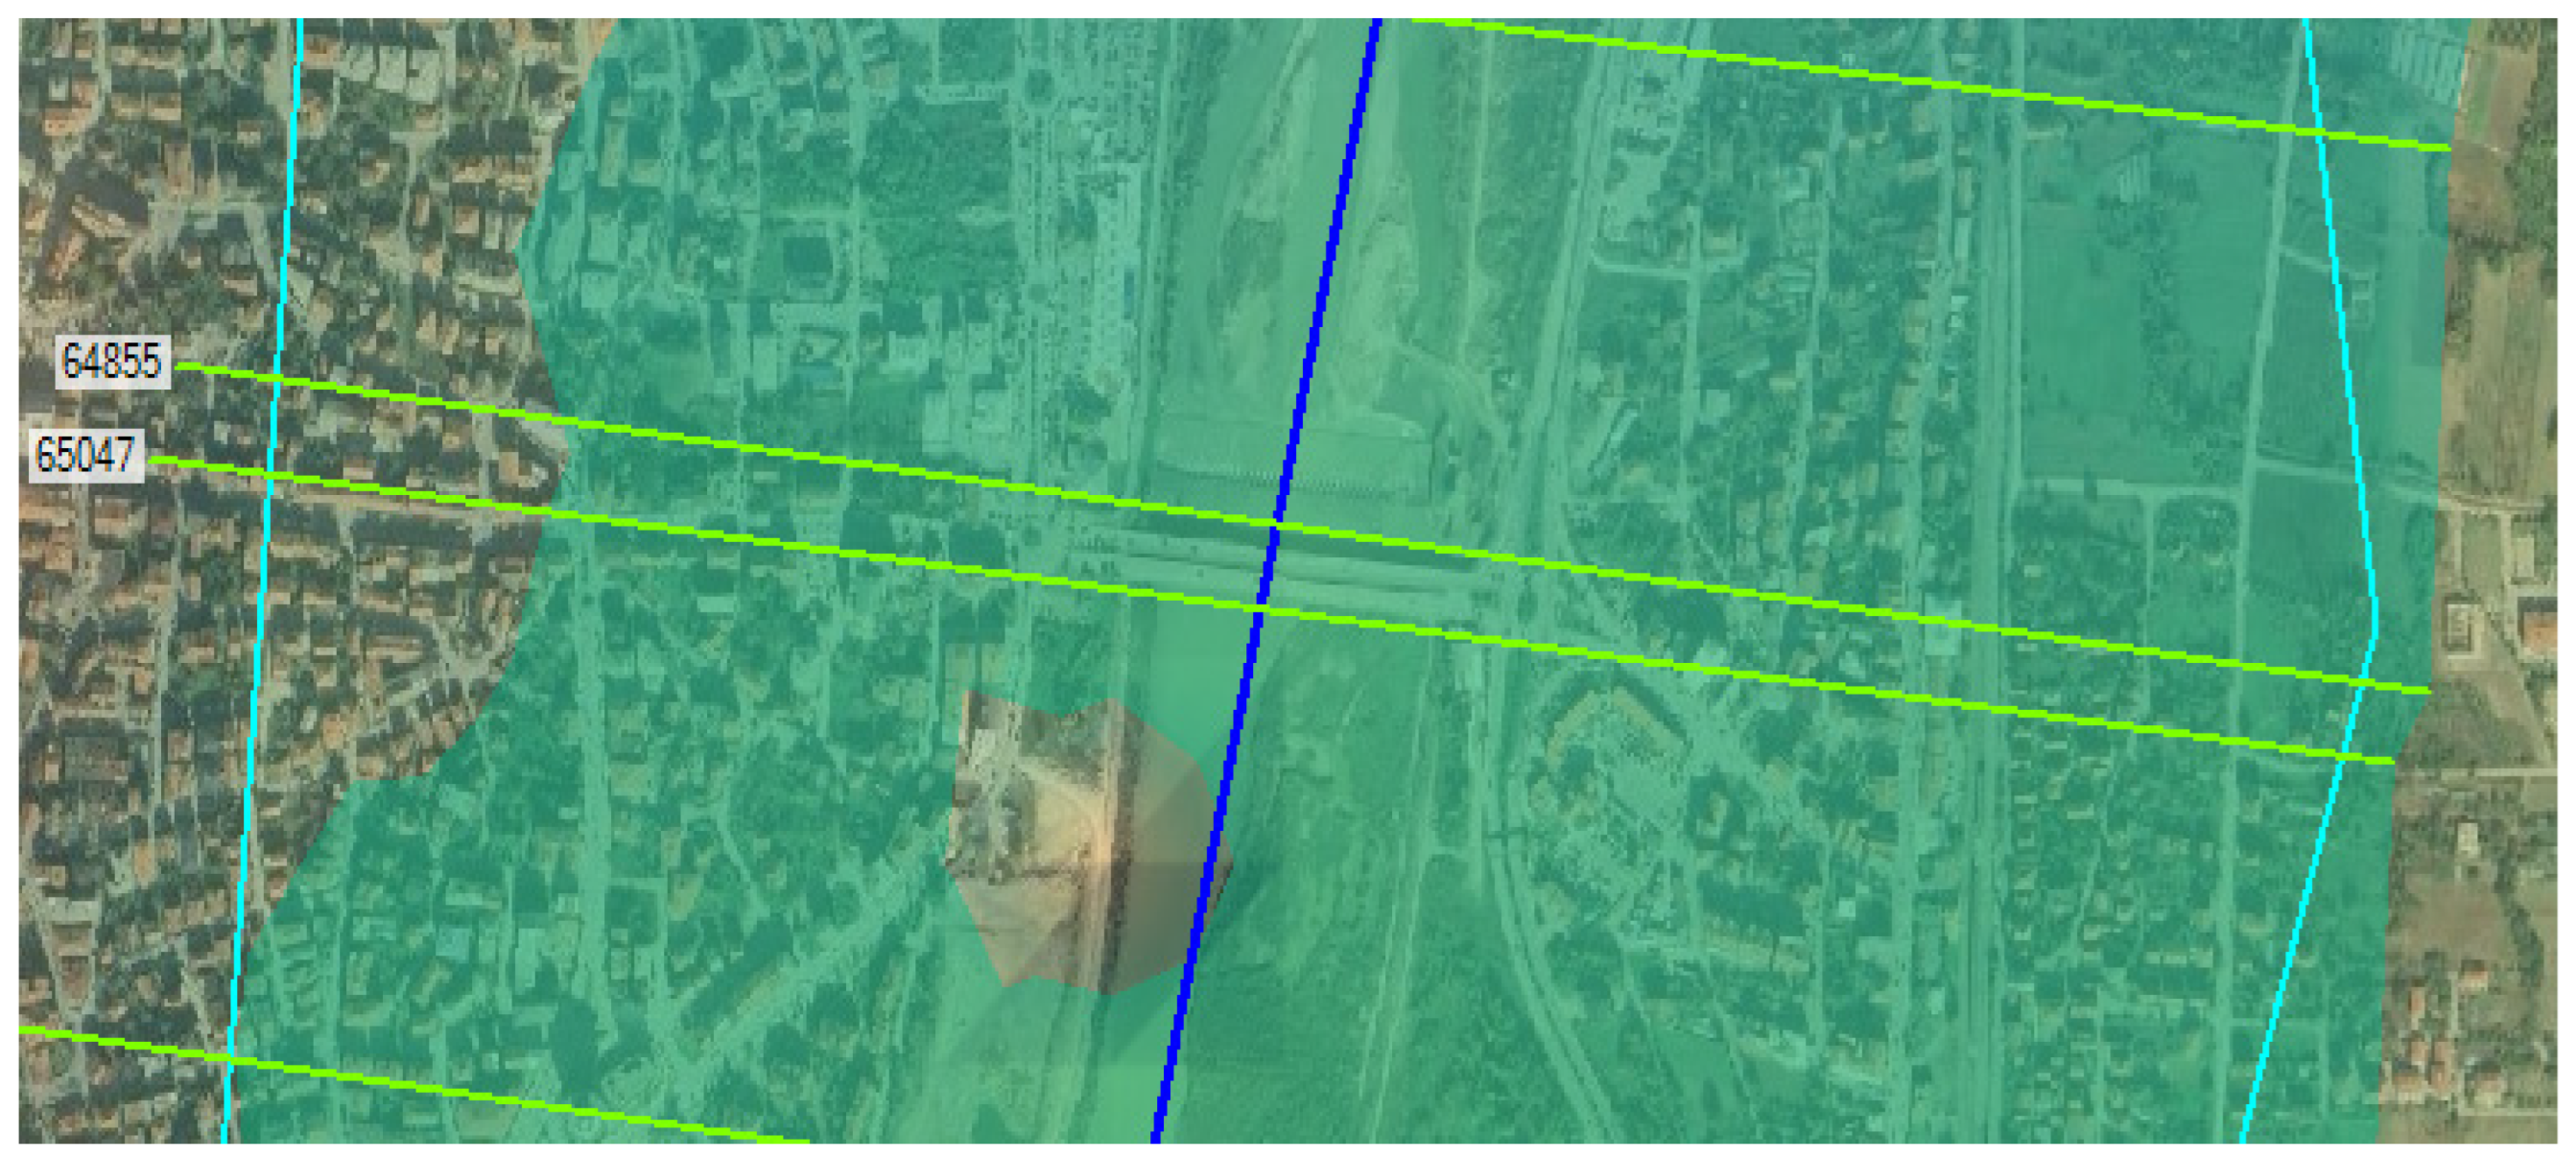
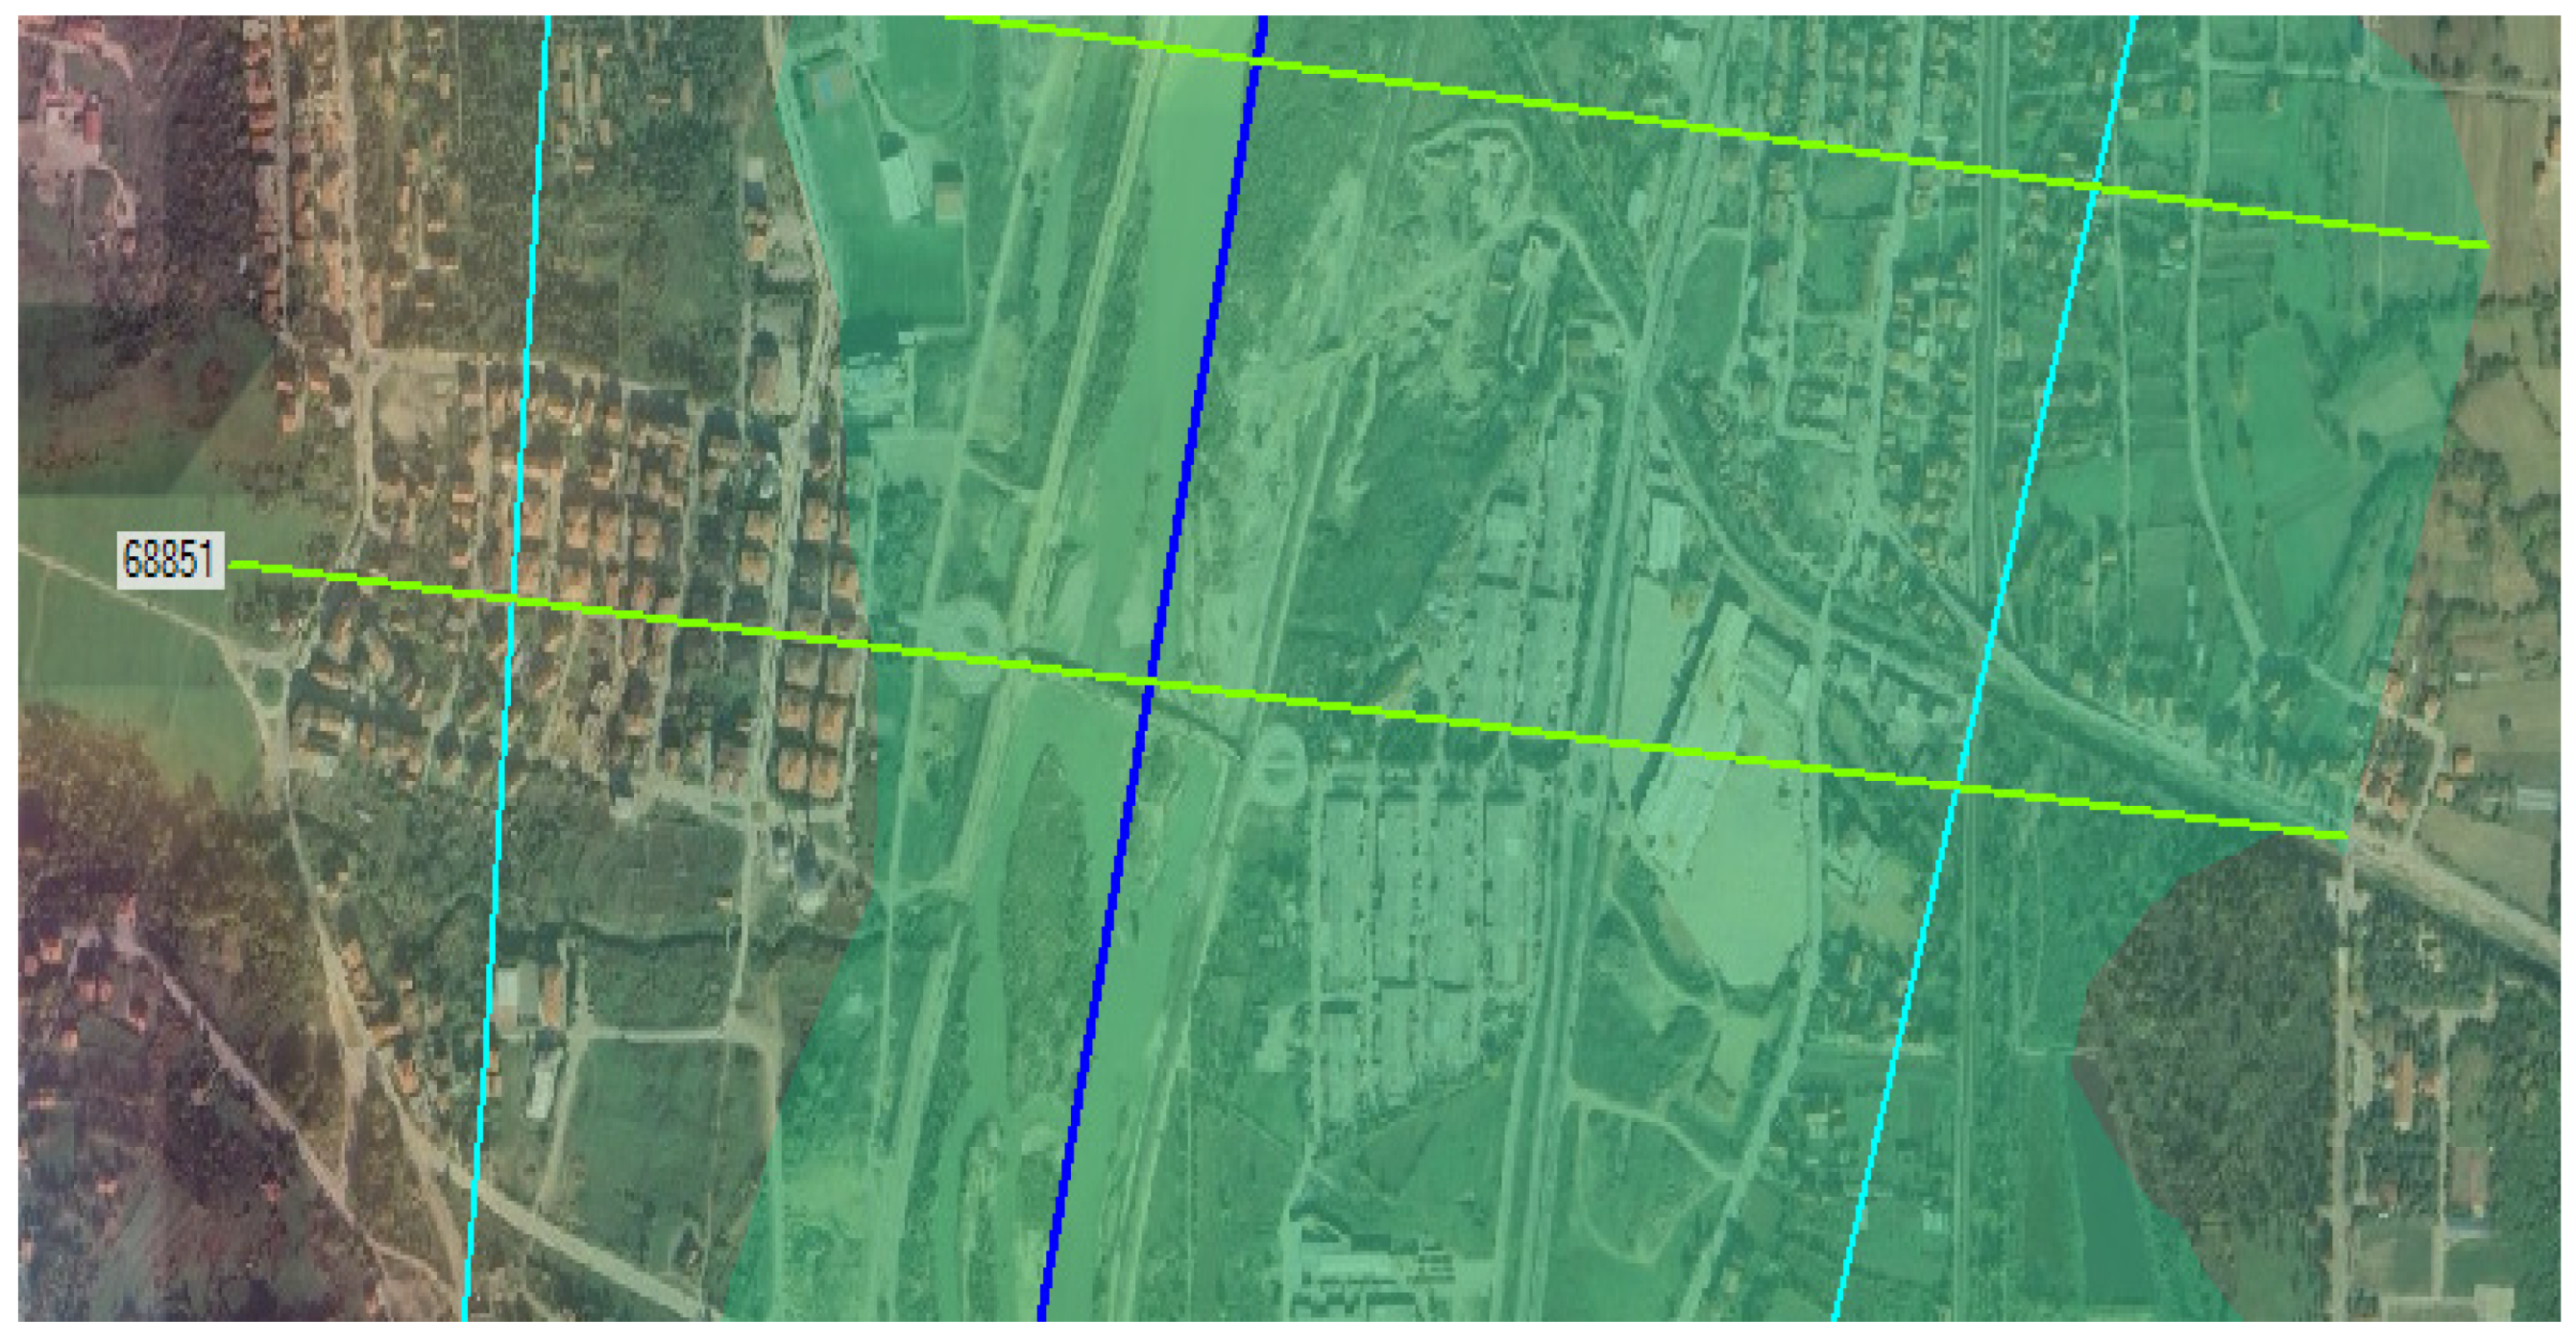
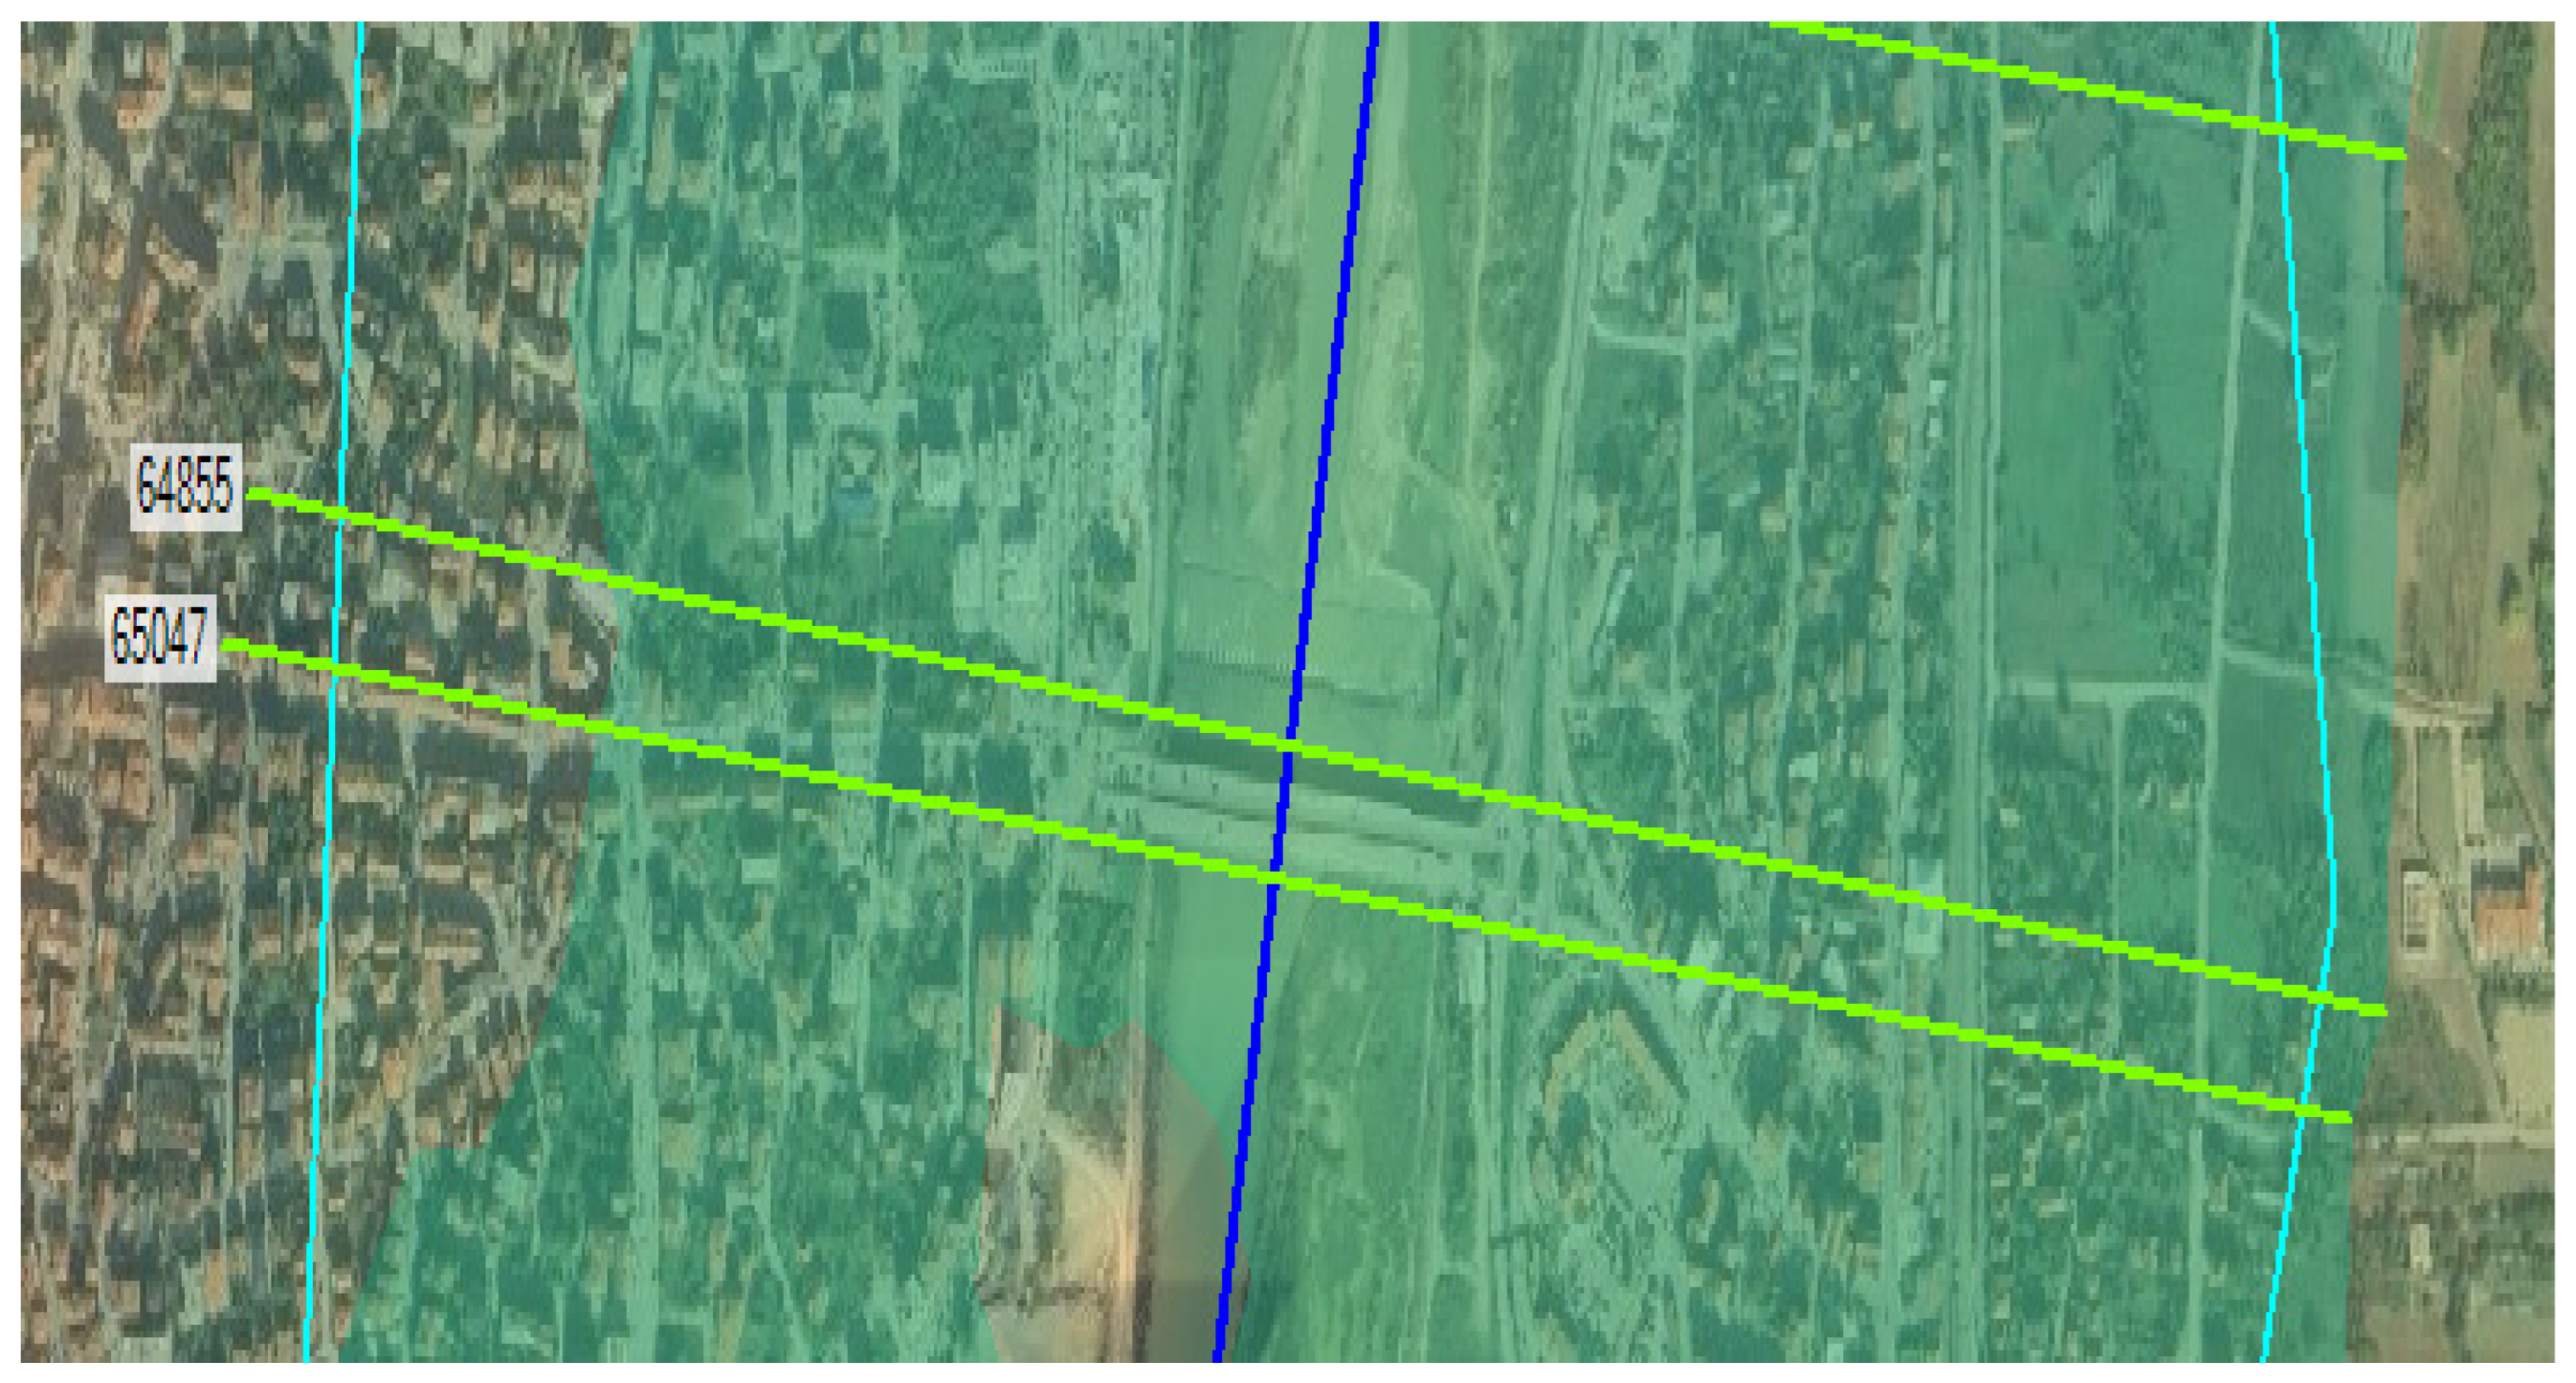
For the cross-section downstream of the bridge, the increase in the river bed roughness caused a change in the flood cross-section (
Figure 8 and
Figure 9).
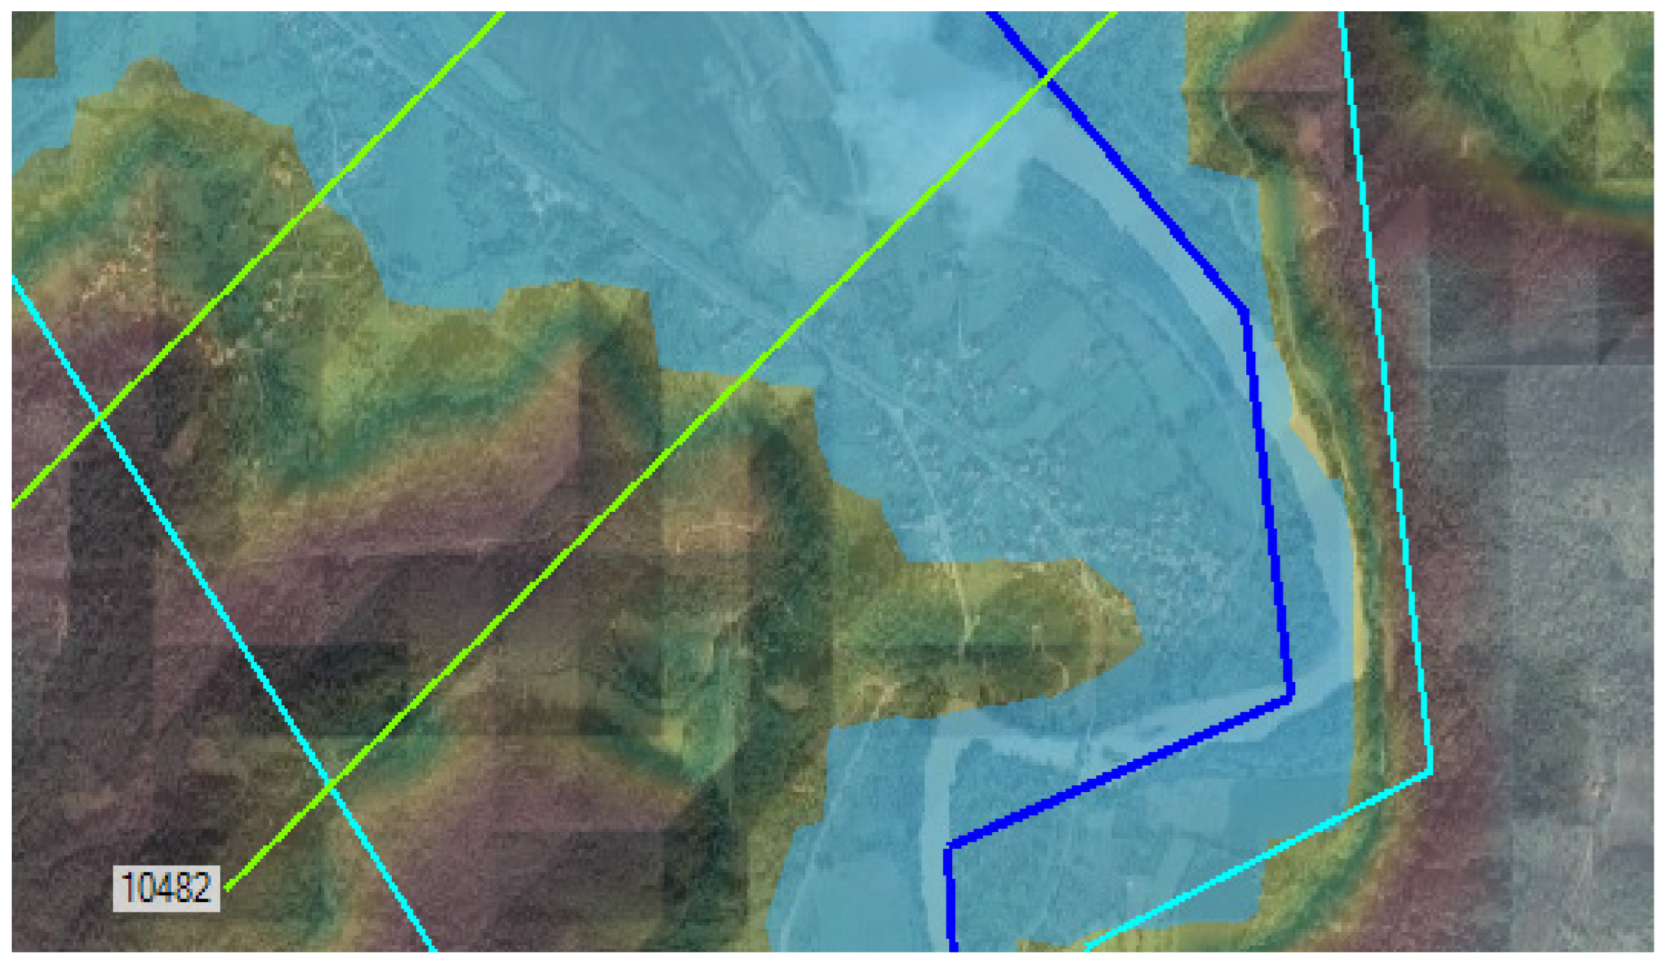
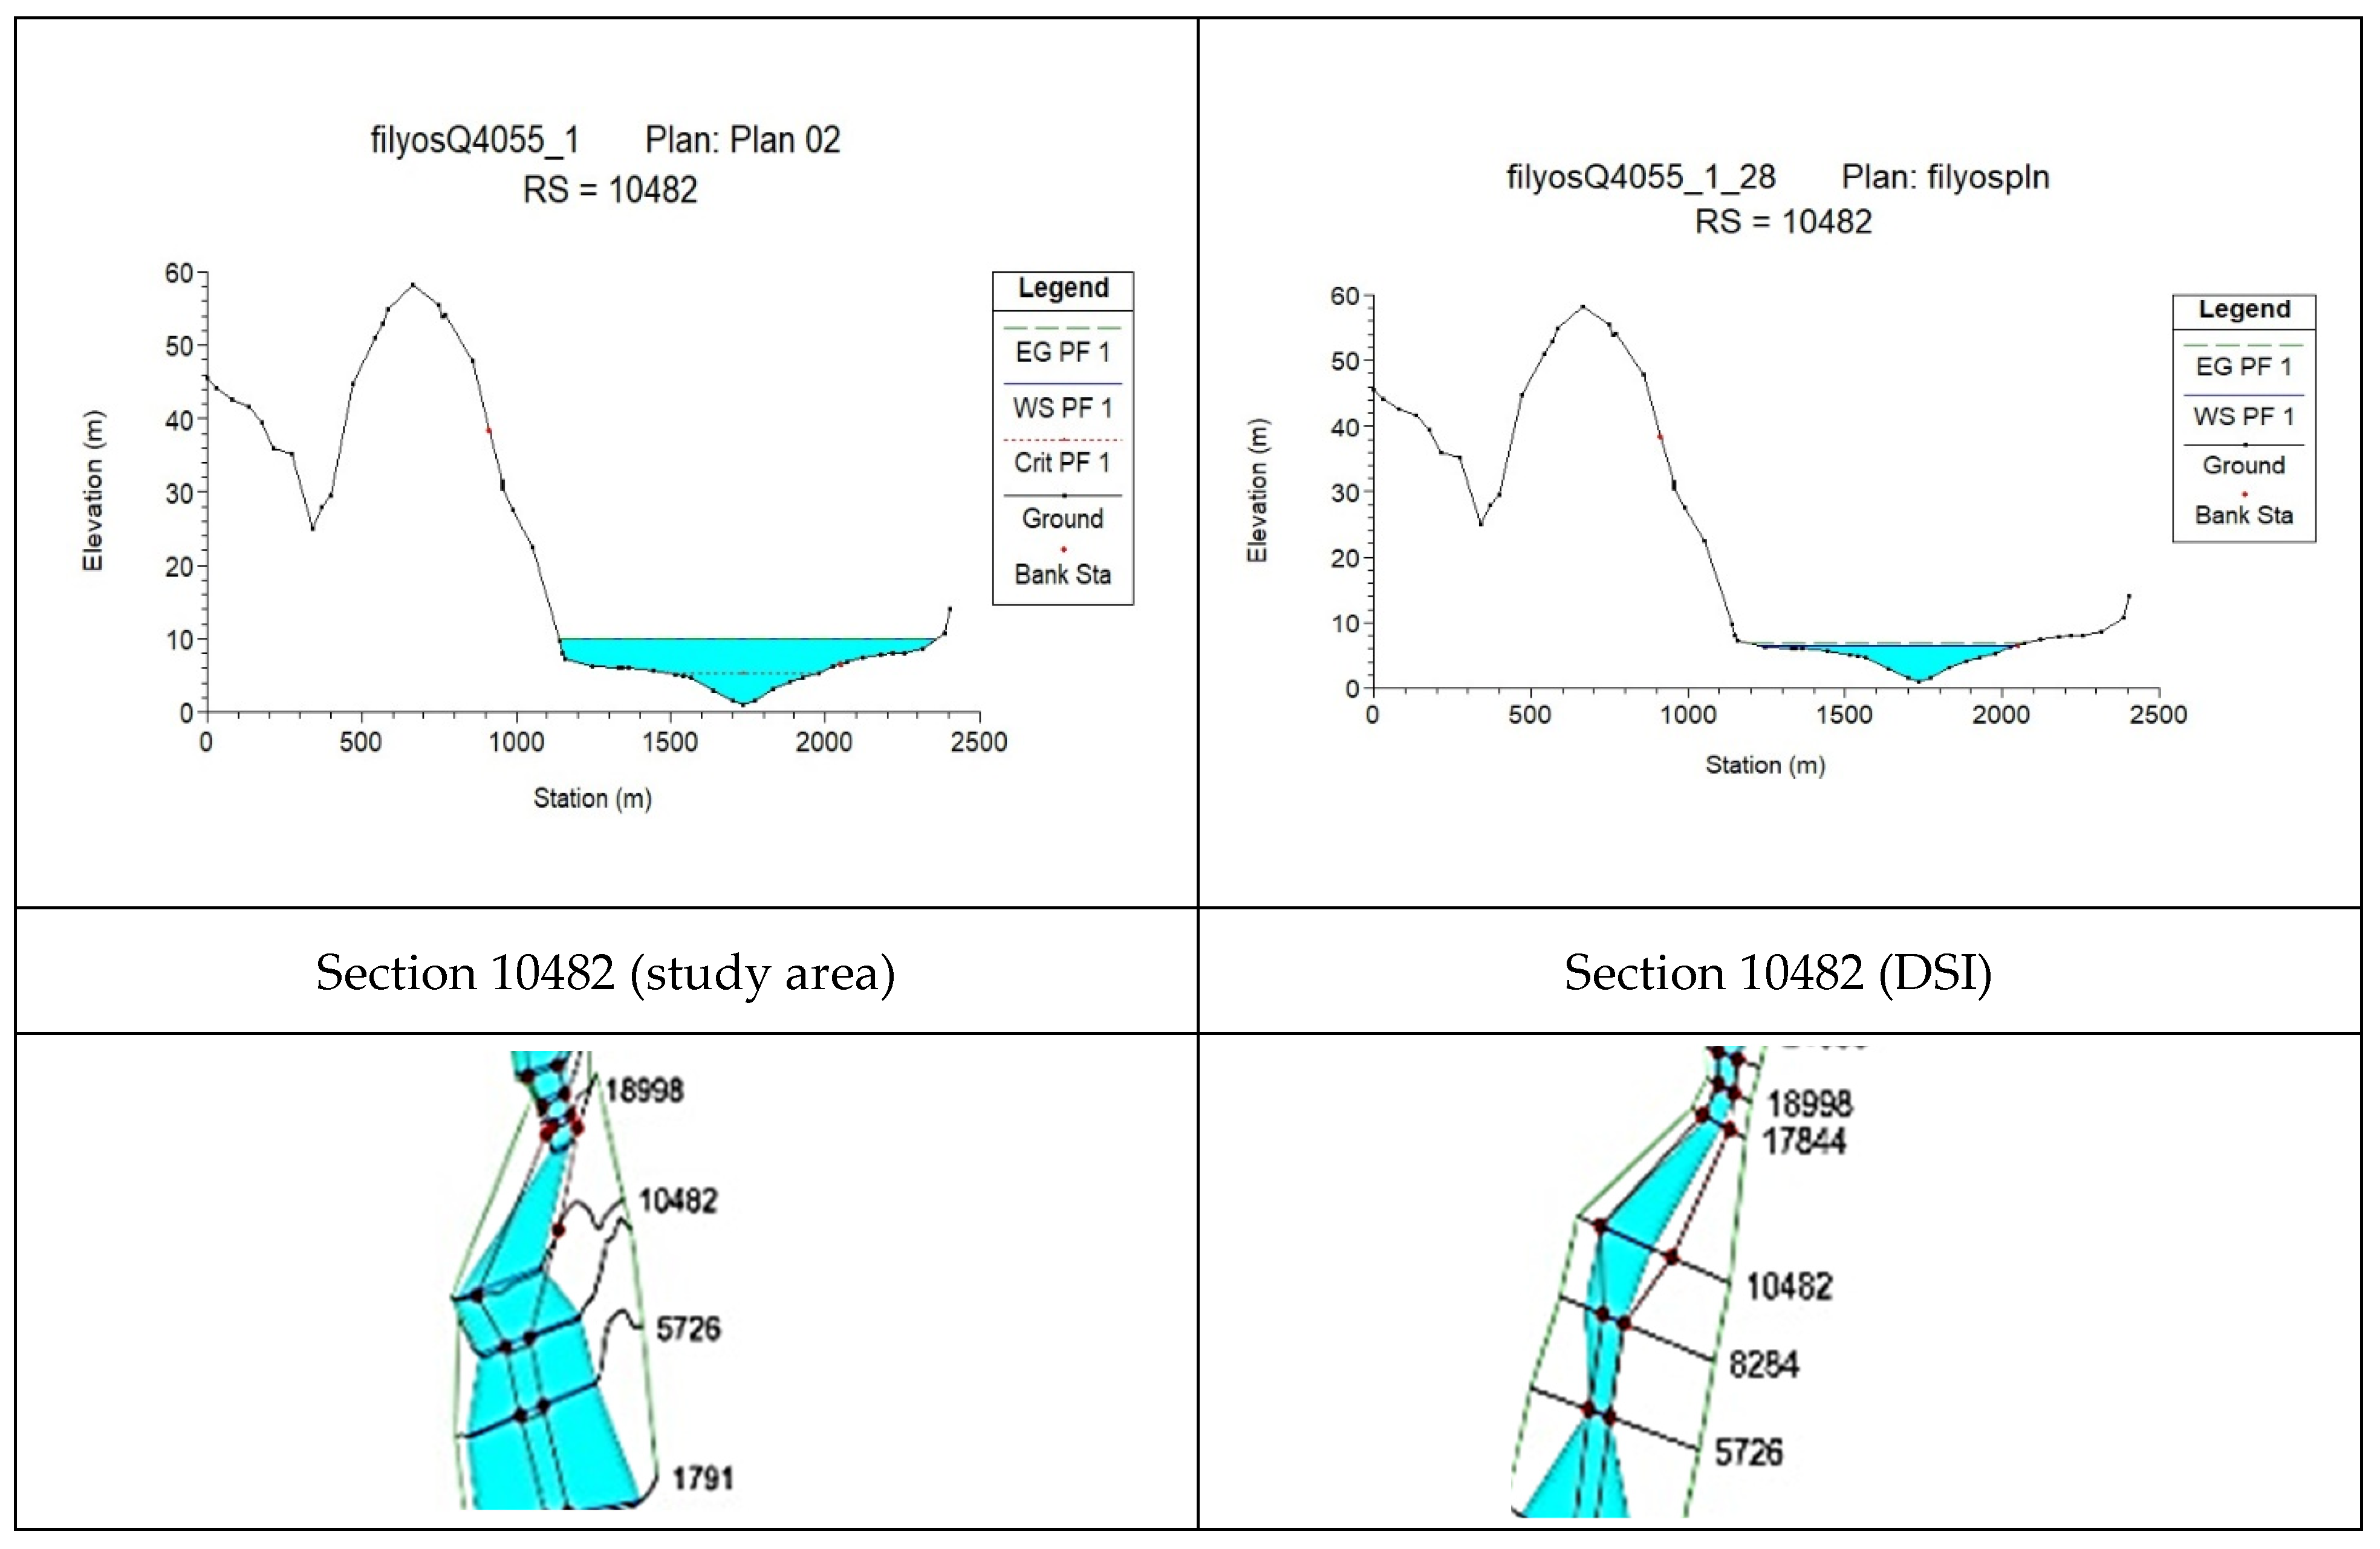
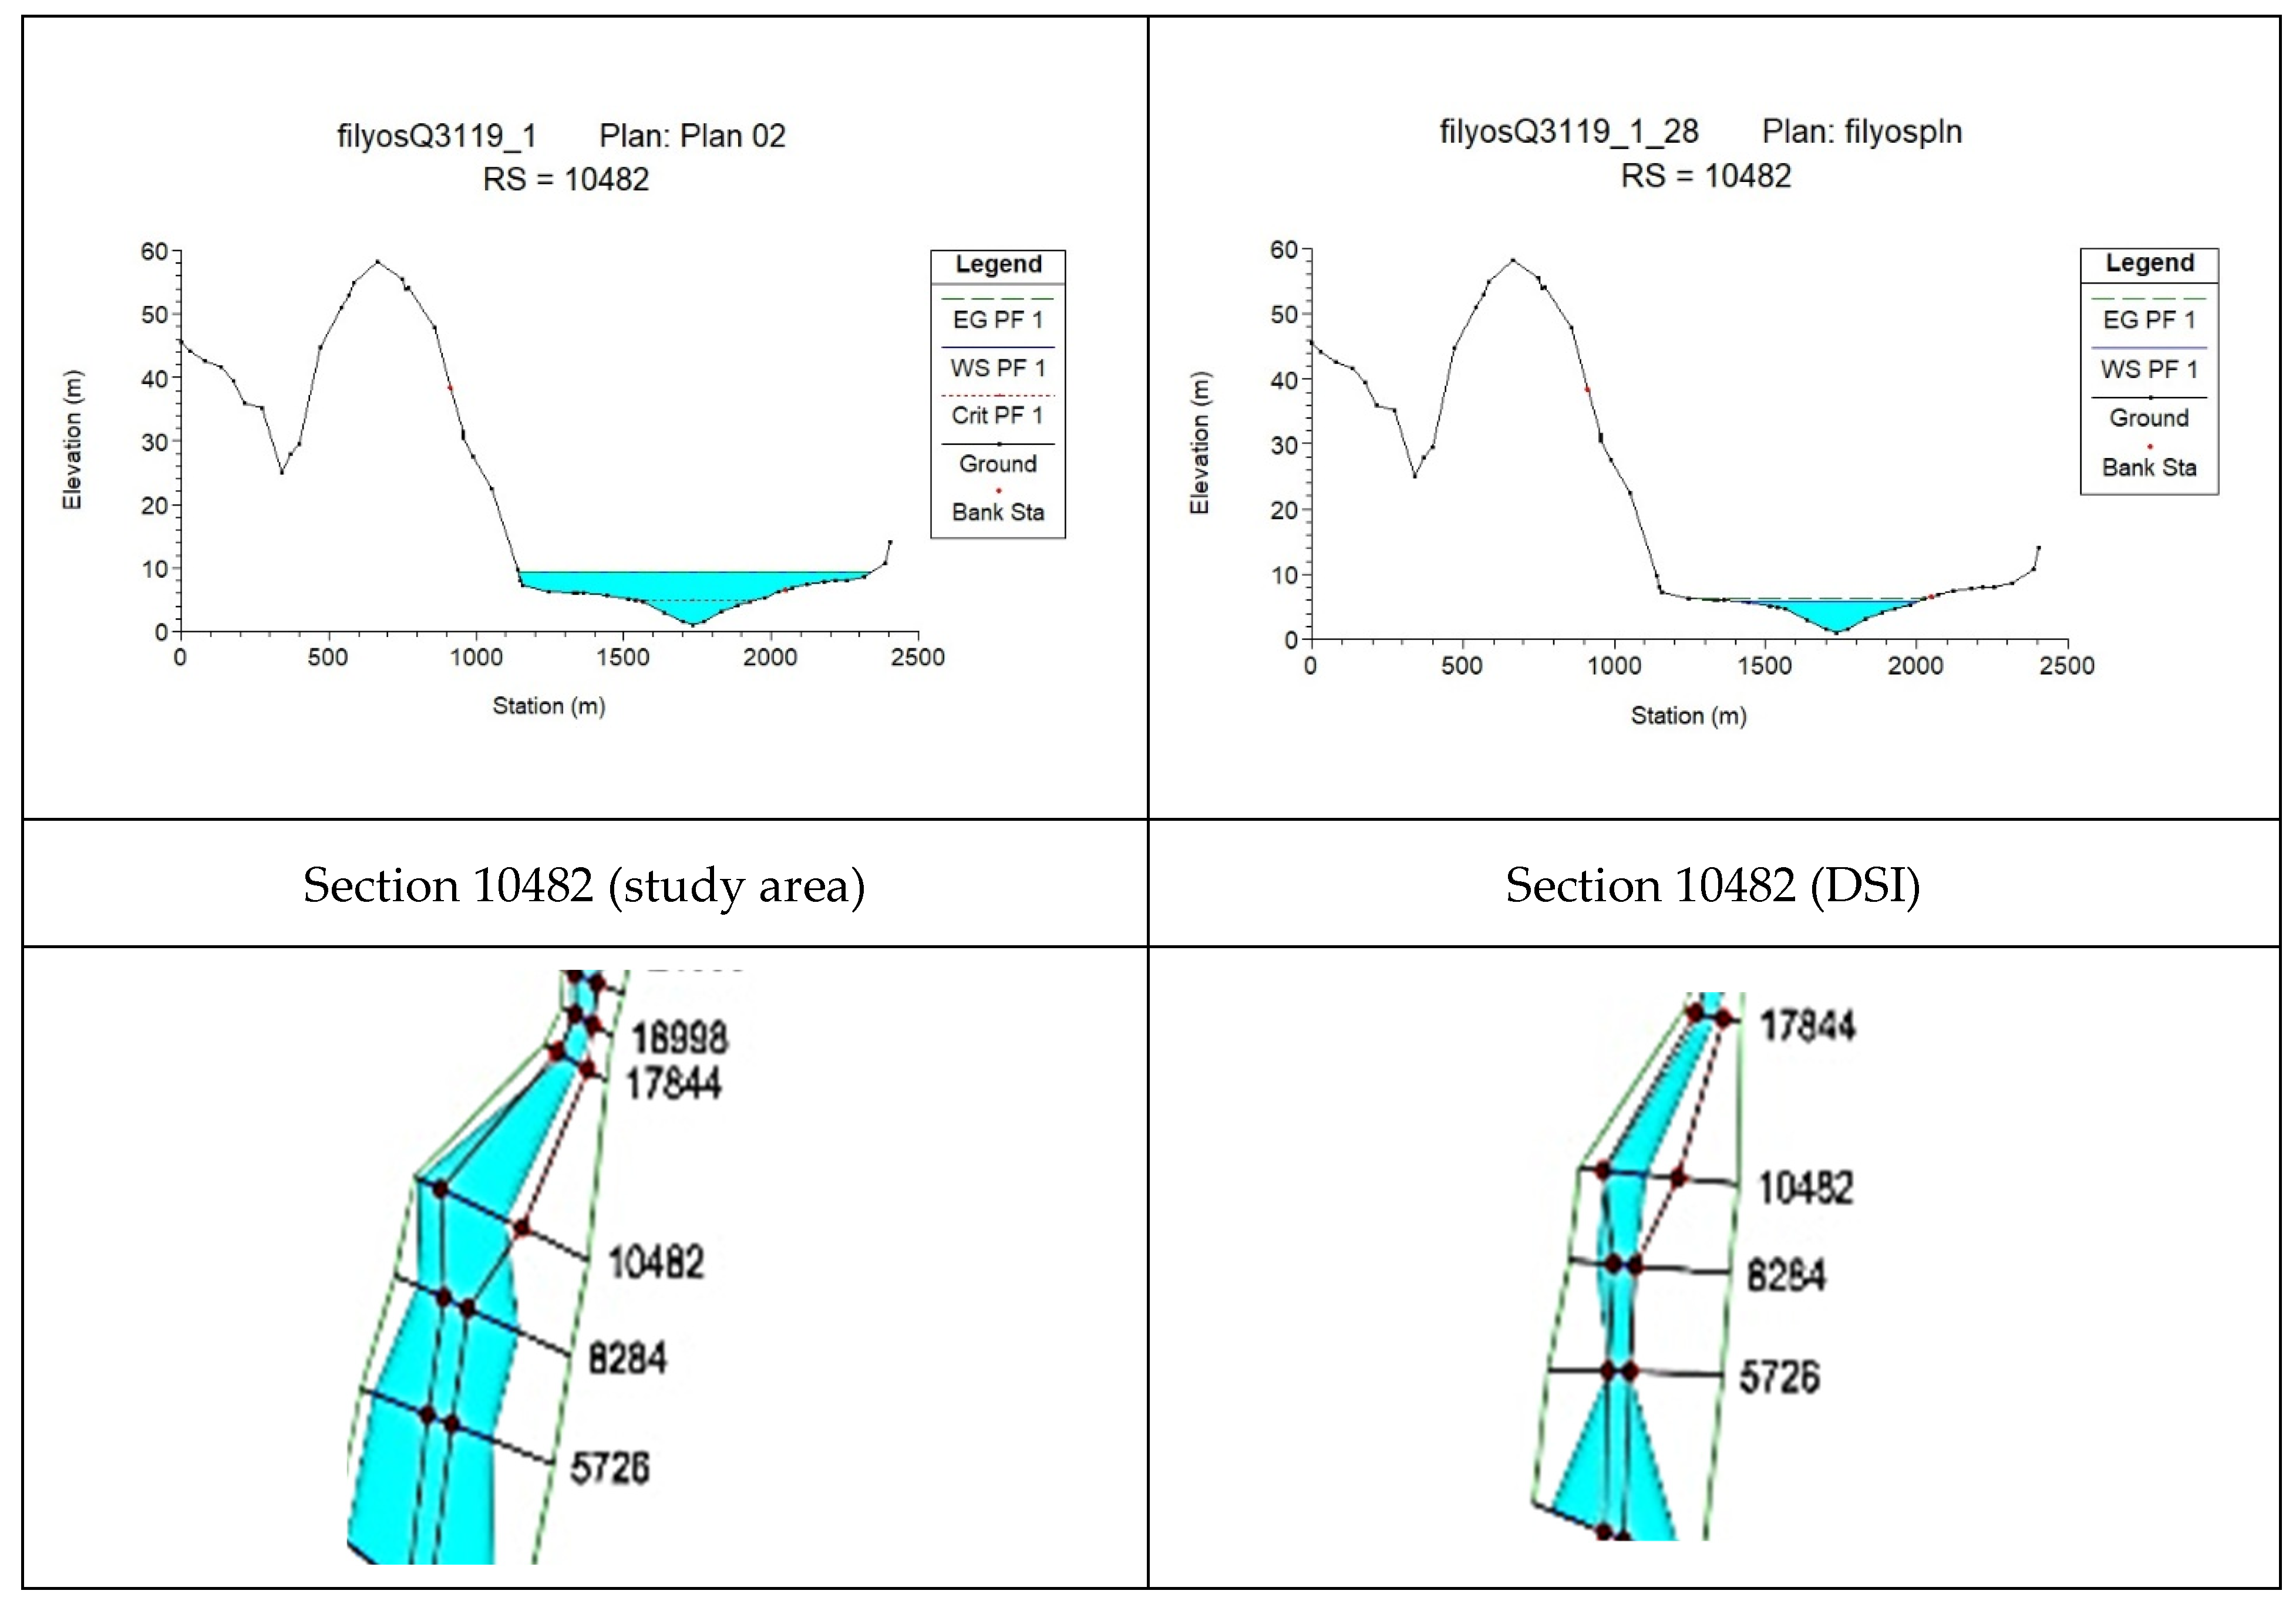
Although there was no change in the roughness coefficient in this section of the river, the meanders in the river bed caused a change in the flood section (
Figure 10 and
Figure 11).
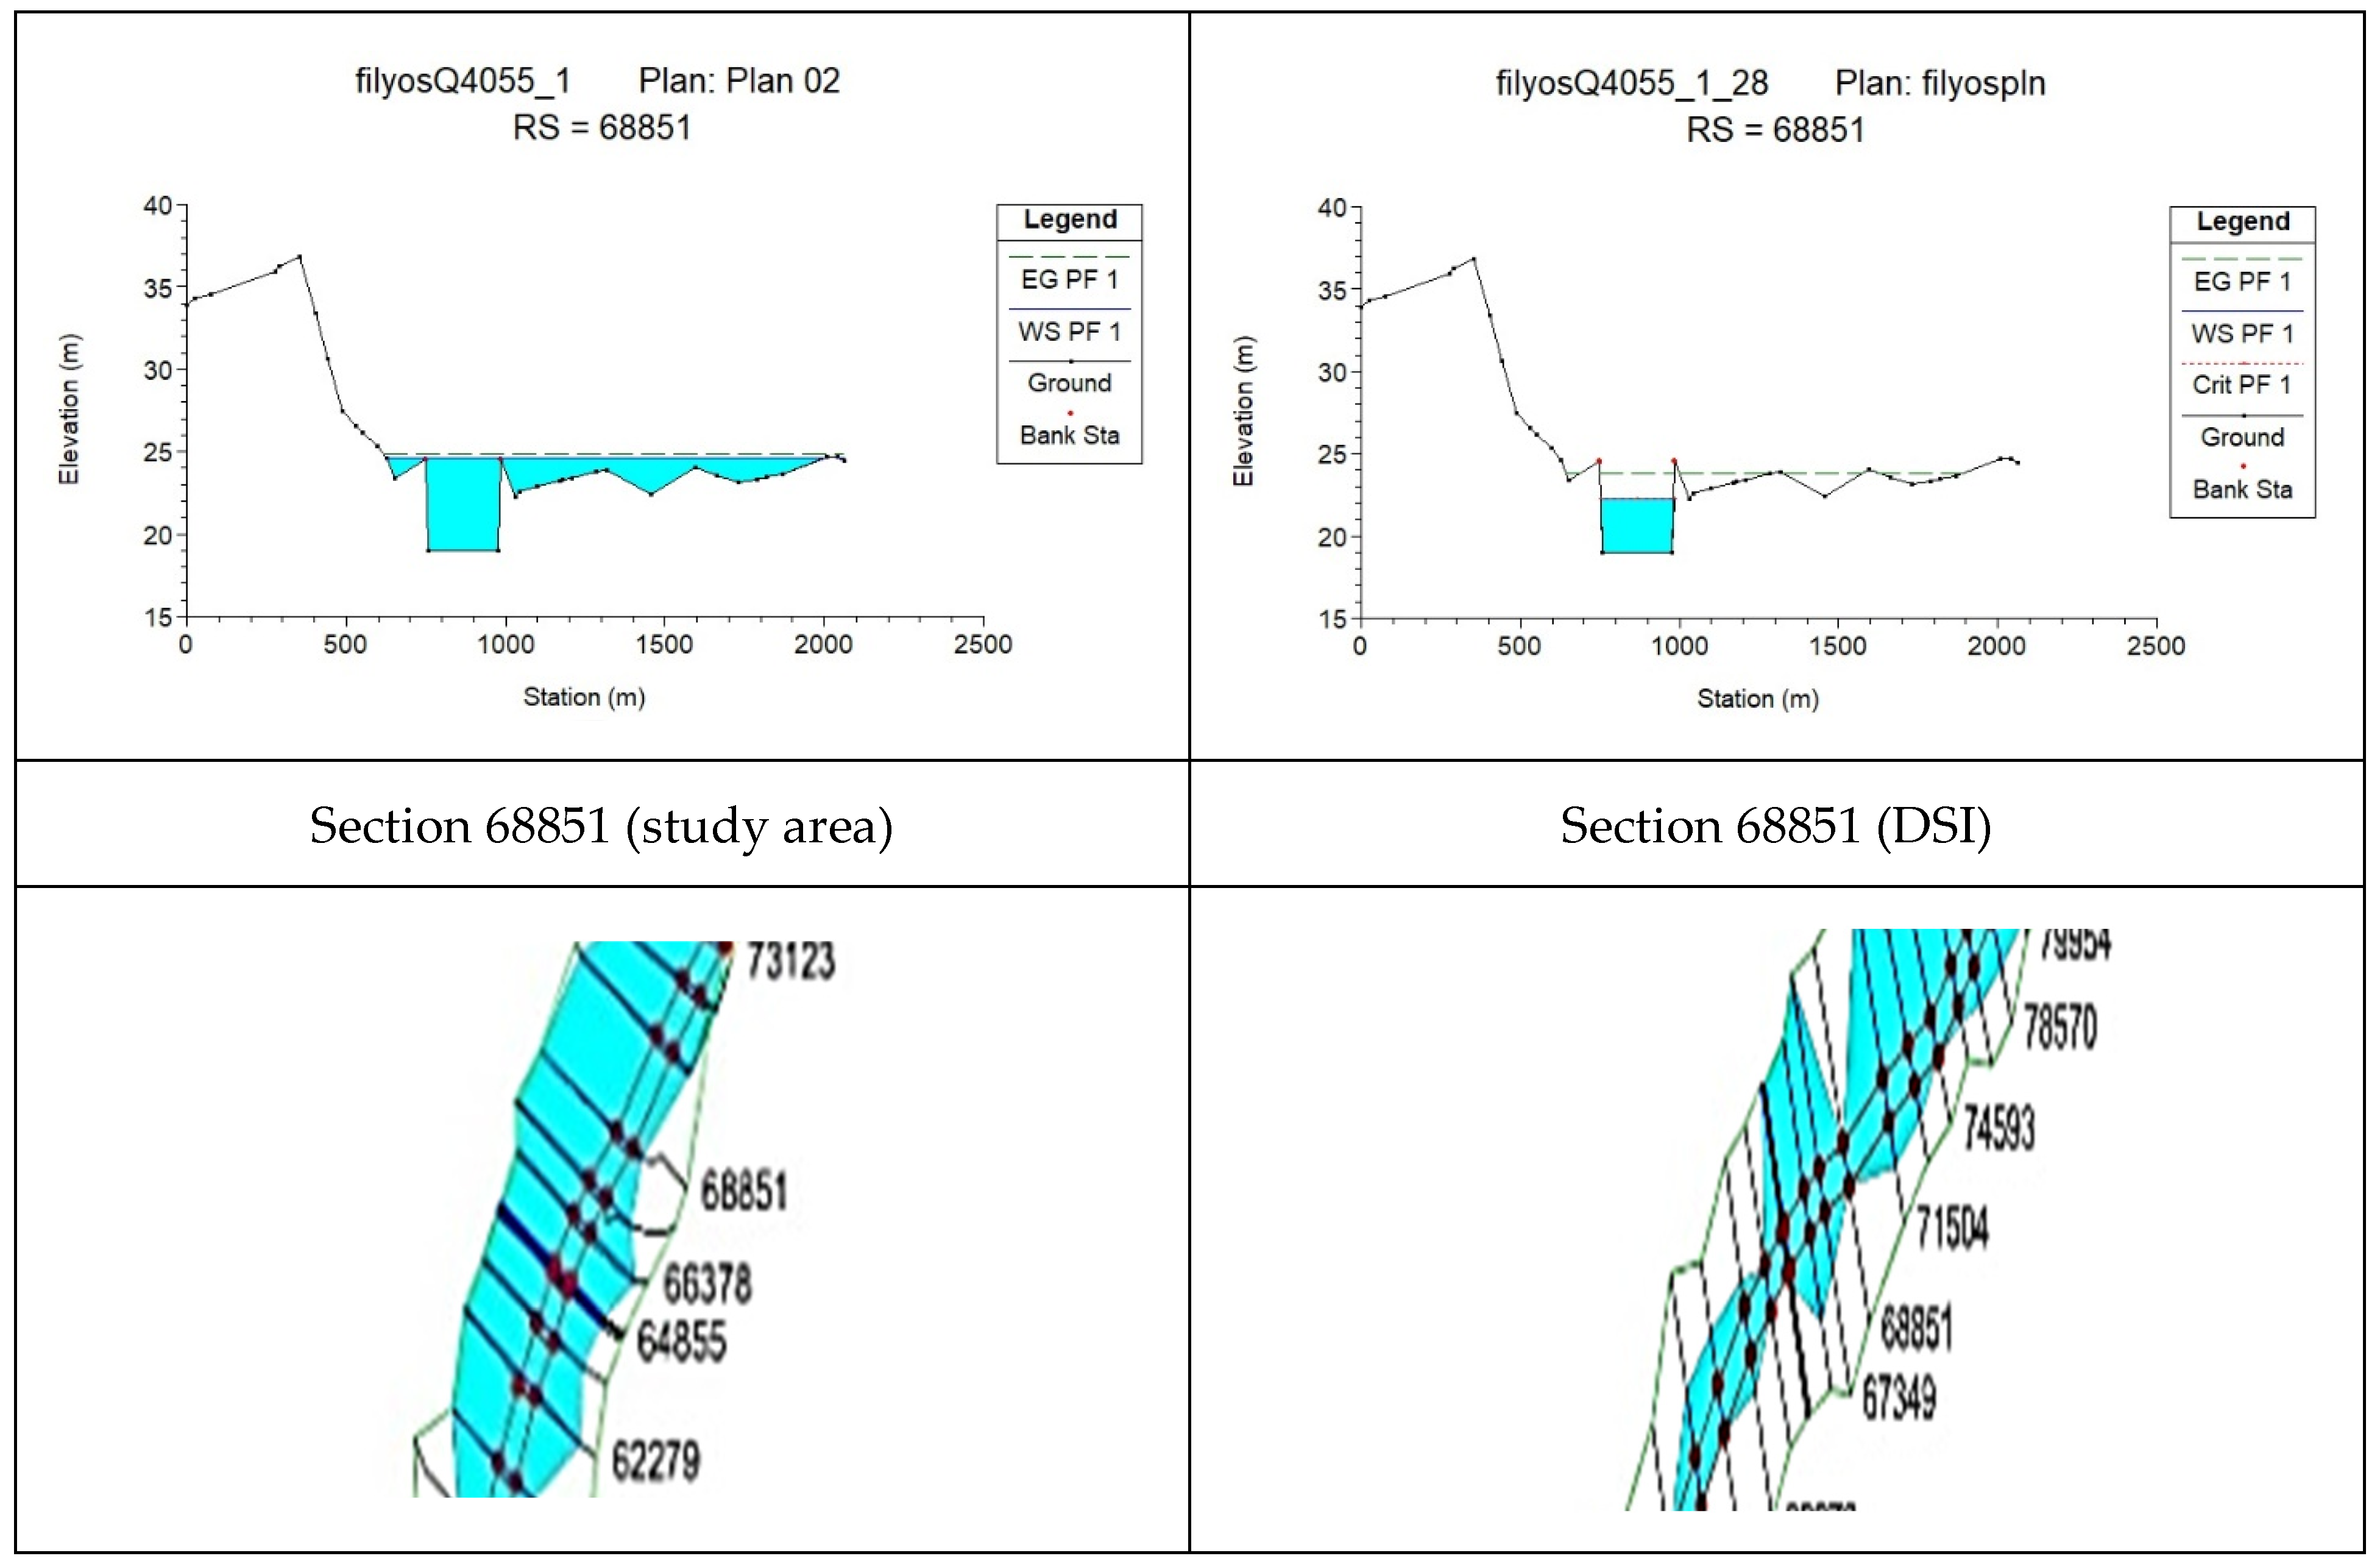
The increase in the Manning’s coefficient in the cross section resulted in a decrease in the flow velocity and an increase in the maximum depth and flow area (
Figure 12 and
Figure 13).
With the change in the n coefficient between the two sections where the flow rate and channel slope remained constant, the average flow velocity decreased by 85.75% (
Figure 14 and
Figure 15), while the maximum depth and flow cross-sectional area increased by 333.17% and 924.81%, respectively.
In the cross-section shown in
Figure 16 and
Figure 17, an increase in maximum depth and flow area was observed. It was determined that the flow velocity decreased (66.7%).
In the section located downstream of the bridge that provides access to Çaycuma district center, the flood area increased from 261.29 m
2 to 2939.47 m
2 with the increase in the roughness coefficient obtained in the field study (
Figure 18 and
Figure 19).
The maximum depth of the cross-section increased while the flow velocity value decreased. There was an increase in the flow area of 474.6% (
Figure 20 and
Figure 21).
The maximum depth and flow area increased by 69.98% and 278.5%, respectively, while the average flow rate decreased by 72.05% (
Figure 22 and
Figure 23).
It was determined that the floodplain tends to increase in the right coastal direction with the increase in the roughness coefficient (
Figure 24 and
Figure 25).
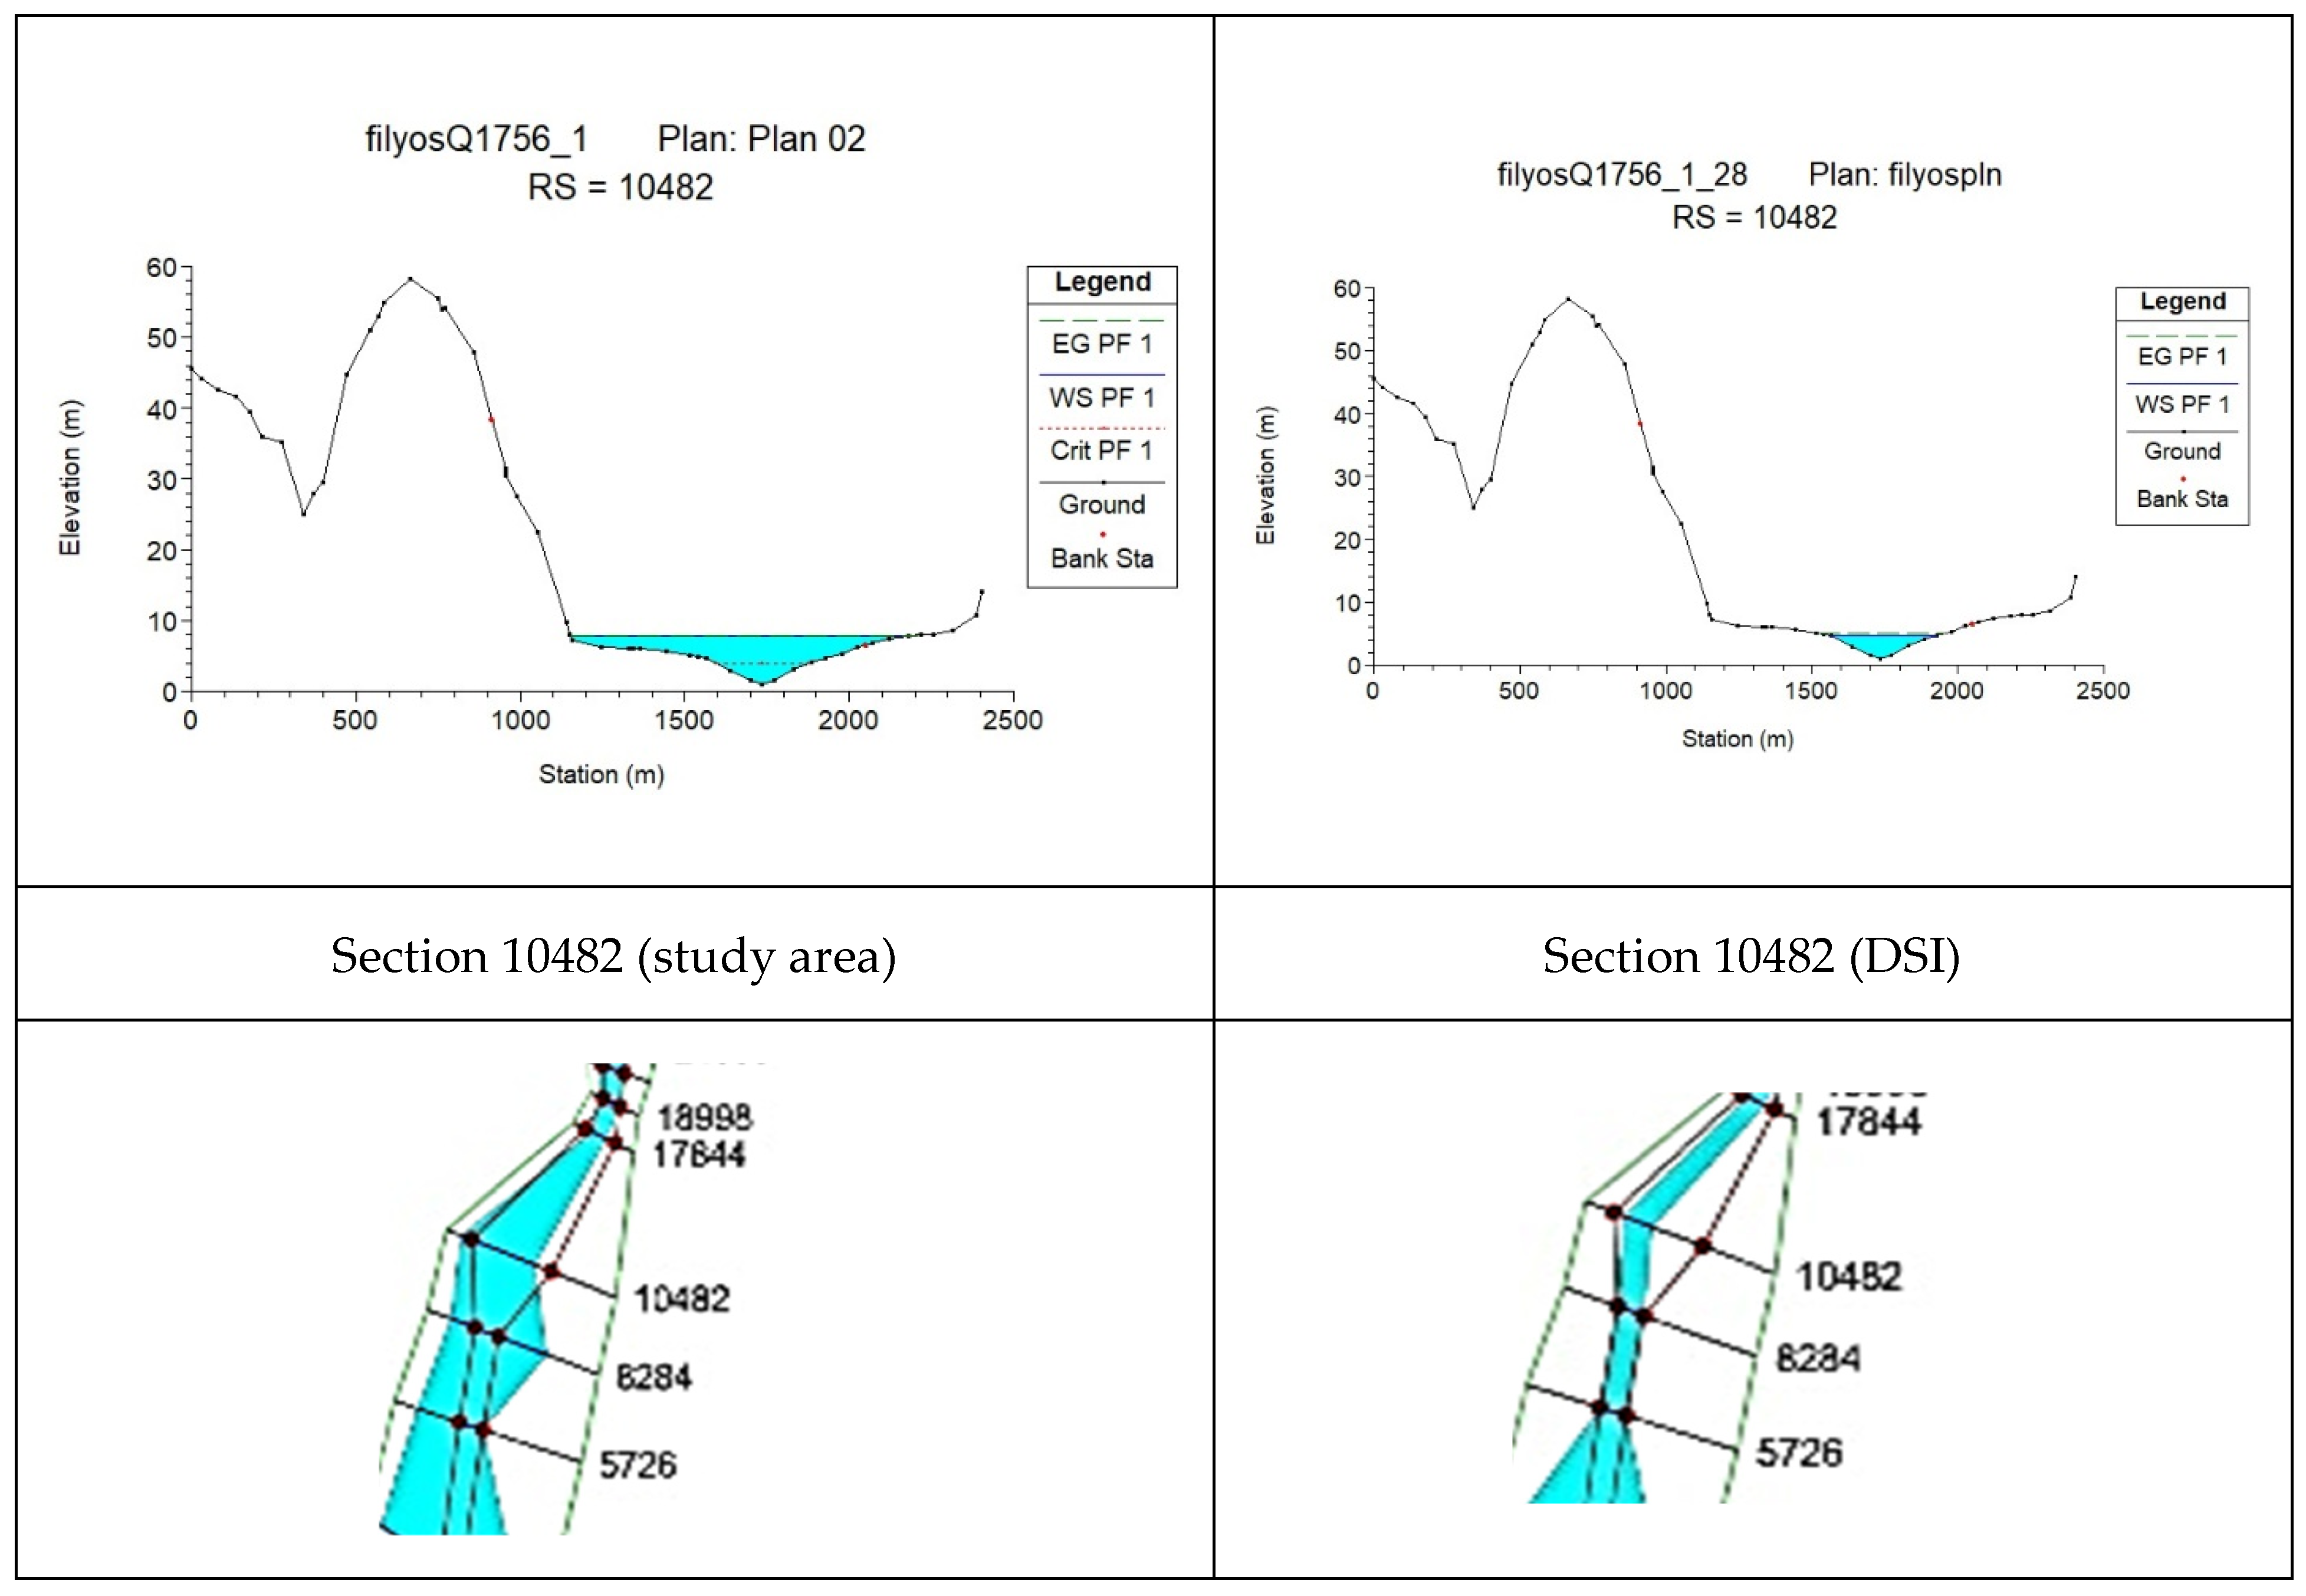
It was determined that the results obtained from the two studies under the same flow rate and slope differed due to the change in the roughness coefficient (
Figure 26). The increase in in-channel roughness caused an increase in the flood area (
Figure 27).
As can be seen from
Figure 28 and
Figure 29, the floodplain is distributed in the right bank direction. The vegetation in the form of islets on the river bed caused the roughness coefficient to increase significantly.
At a flow rate of 1756 m
3/s, there is a tendency for the flood area to increase in the right coastal direction (
Figure 30 and
Figure 31).
An increase in the in-bed roughness coefficient will result in a significant increase in the right bank direction (
Figure 32 and
Figure 33).
There was a 151.5% increase in maximum depth, a 258.95% increase in flow cross-sectional area, and a 353.7% decrease in flow velocity (
Figure 34 and
Figure 35).
Flood areas in the sections deemed risky were also included in the program outputs (
Table 7).
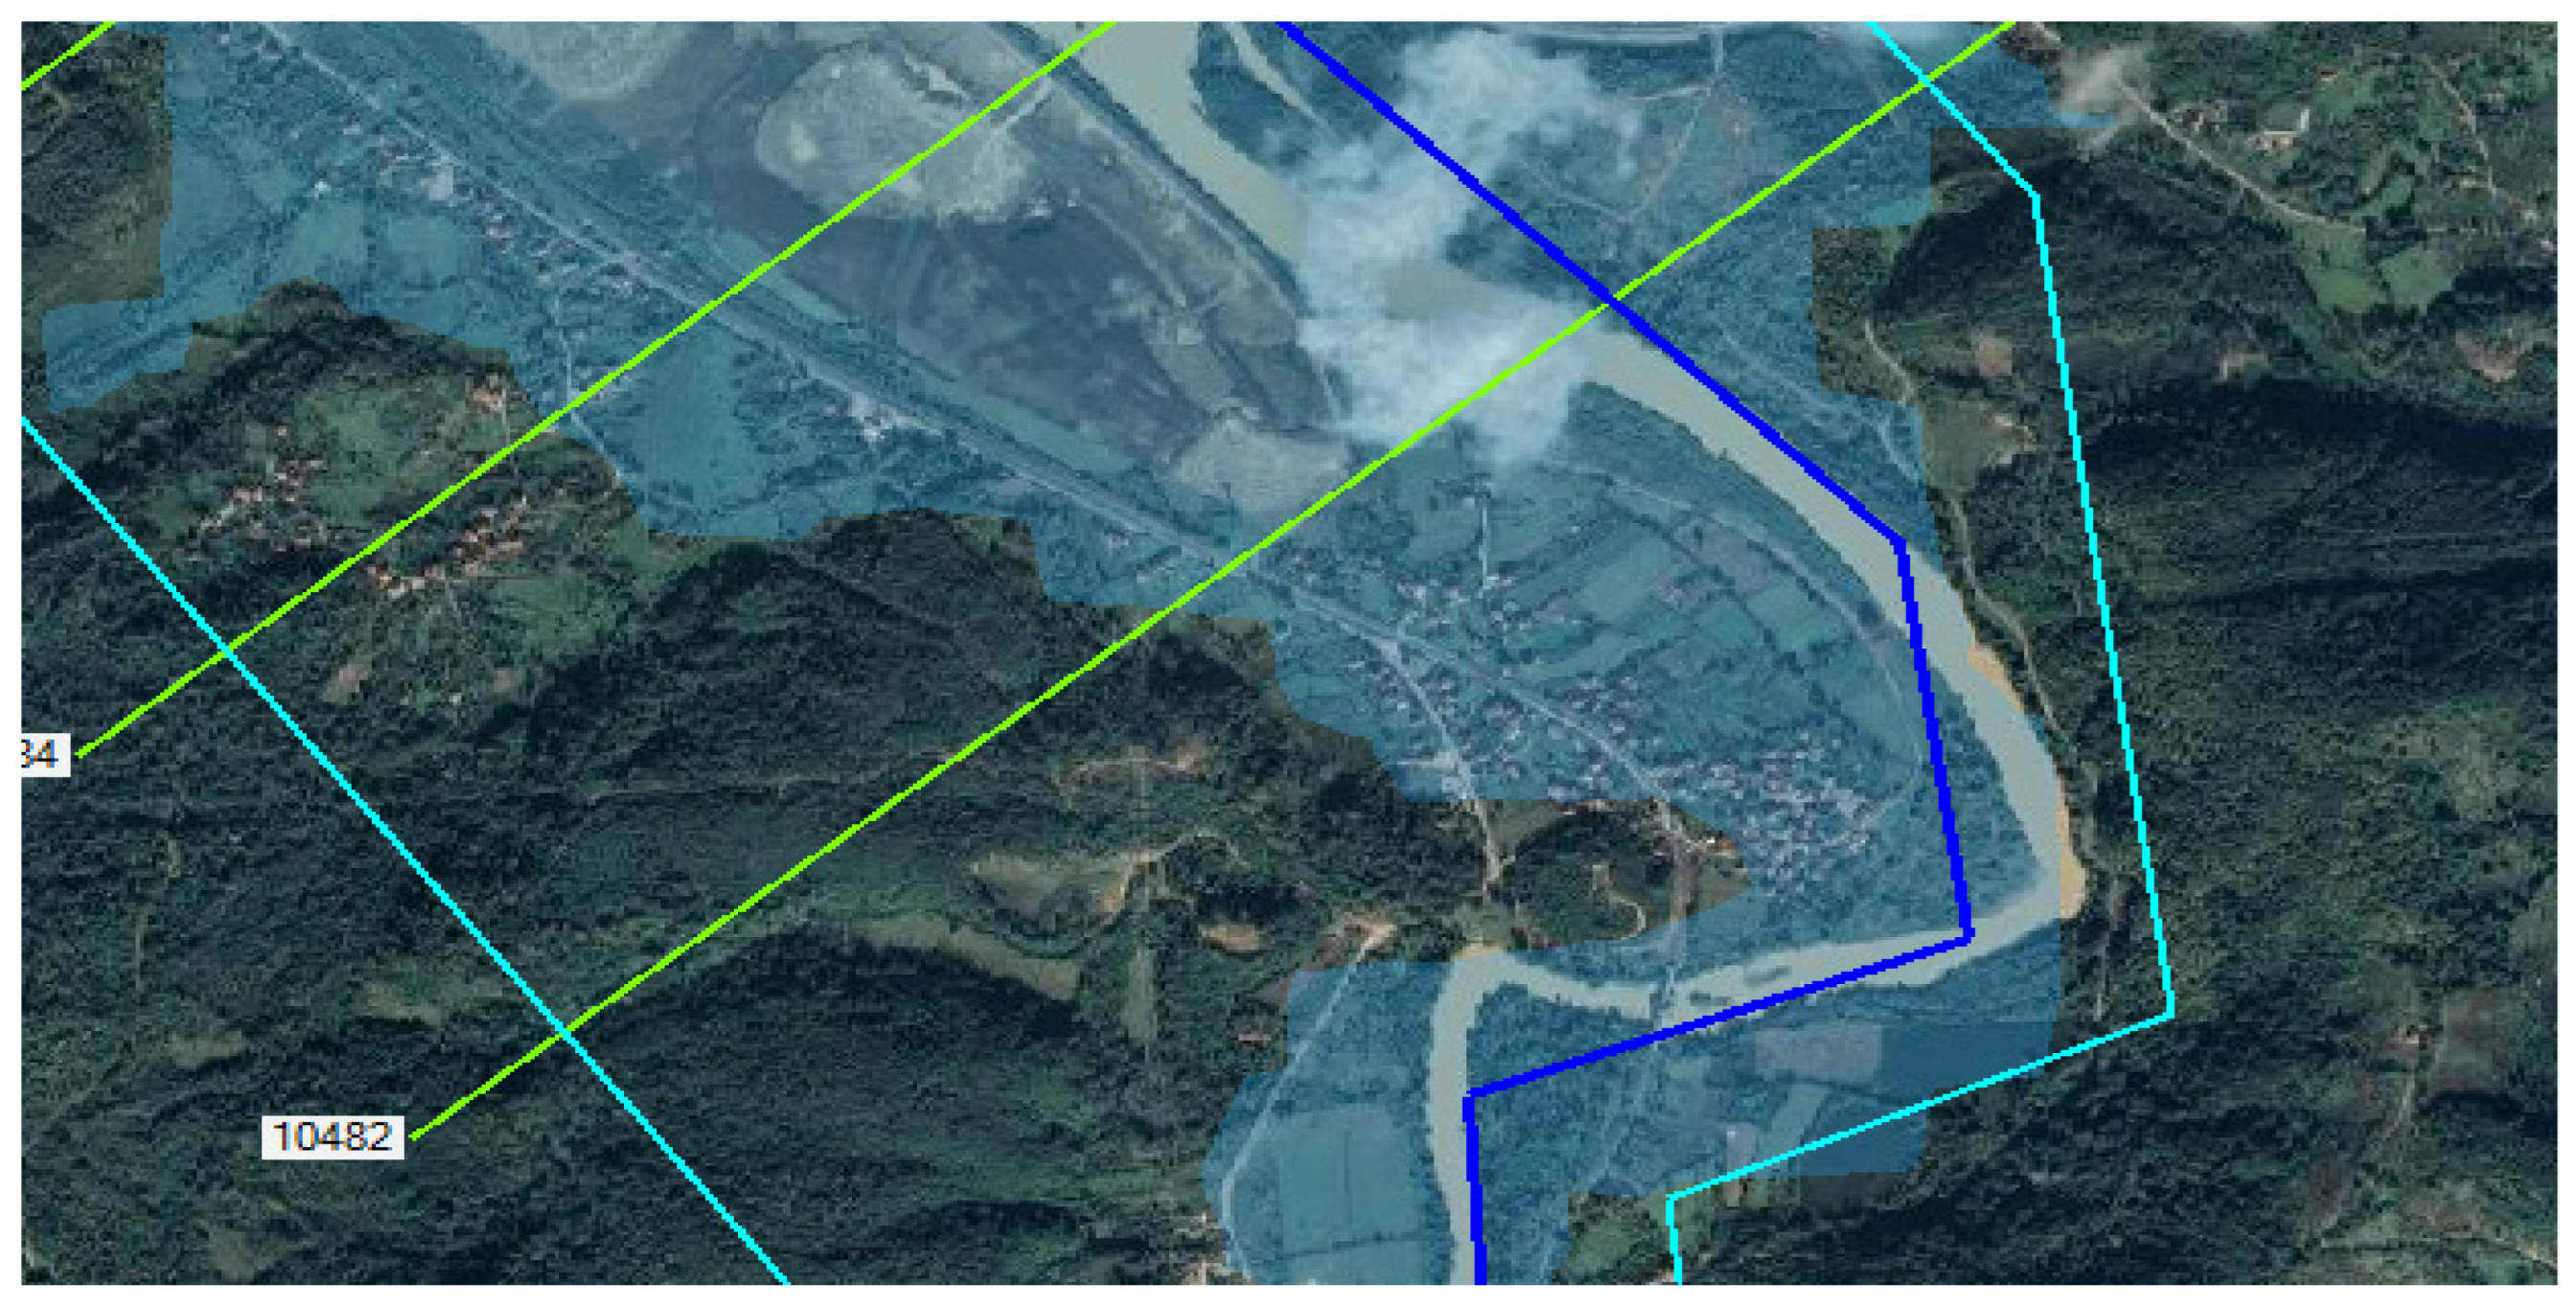
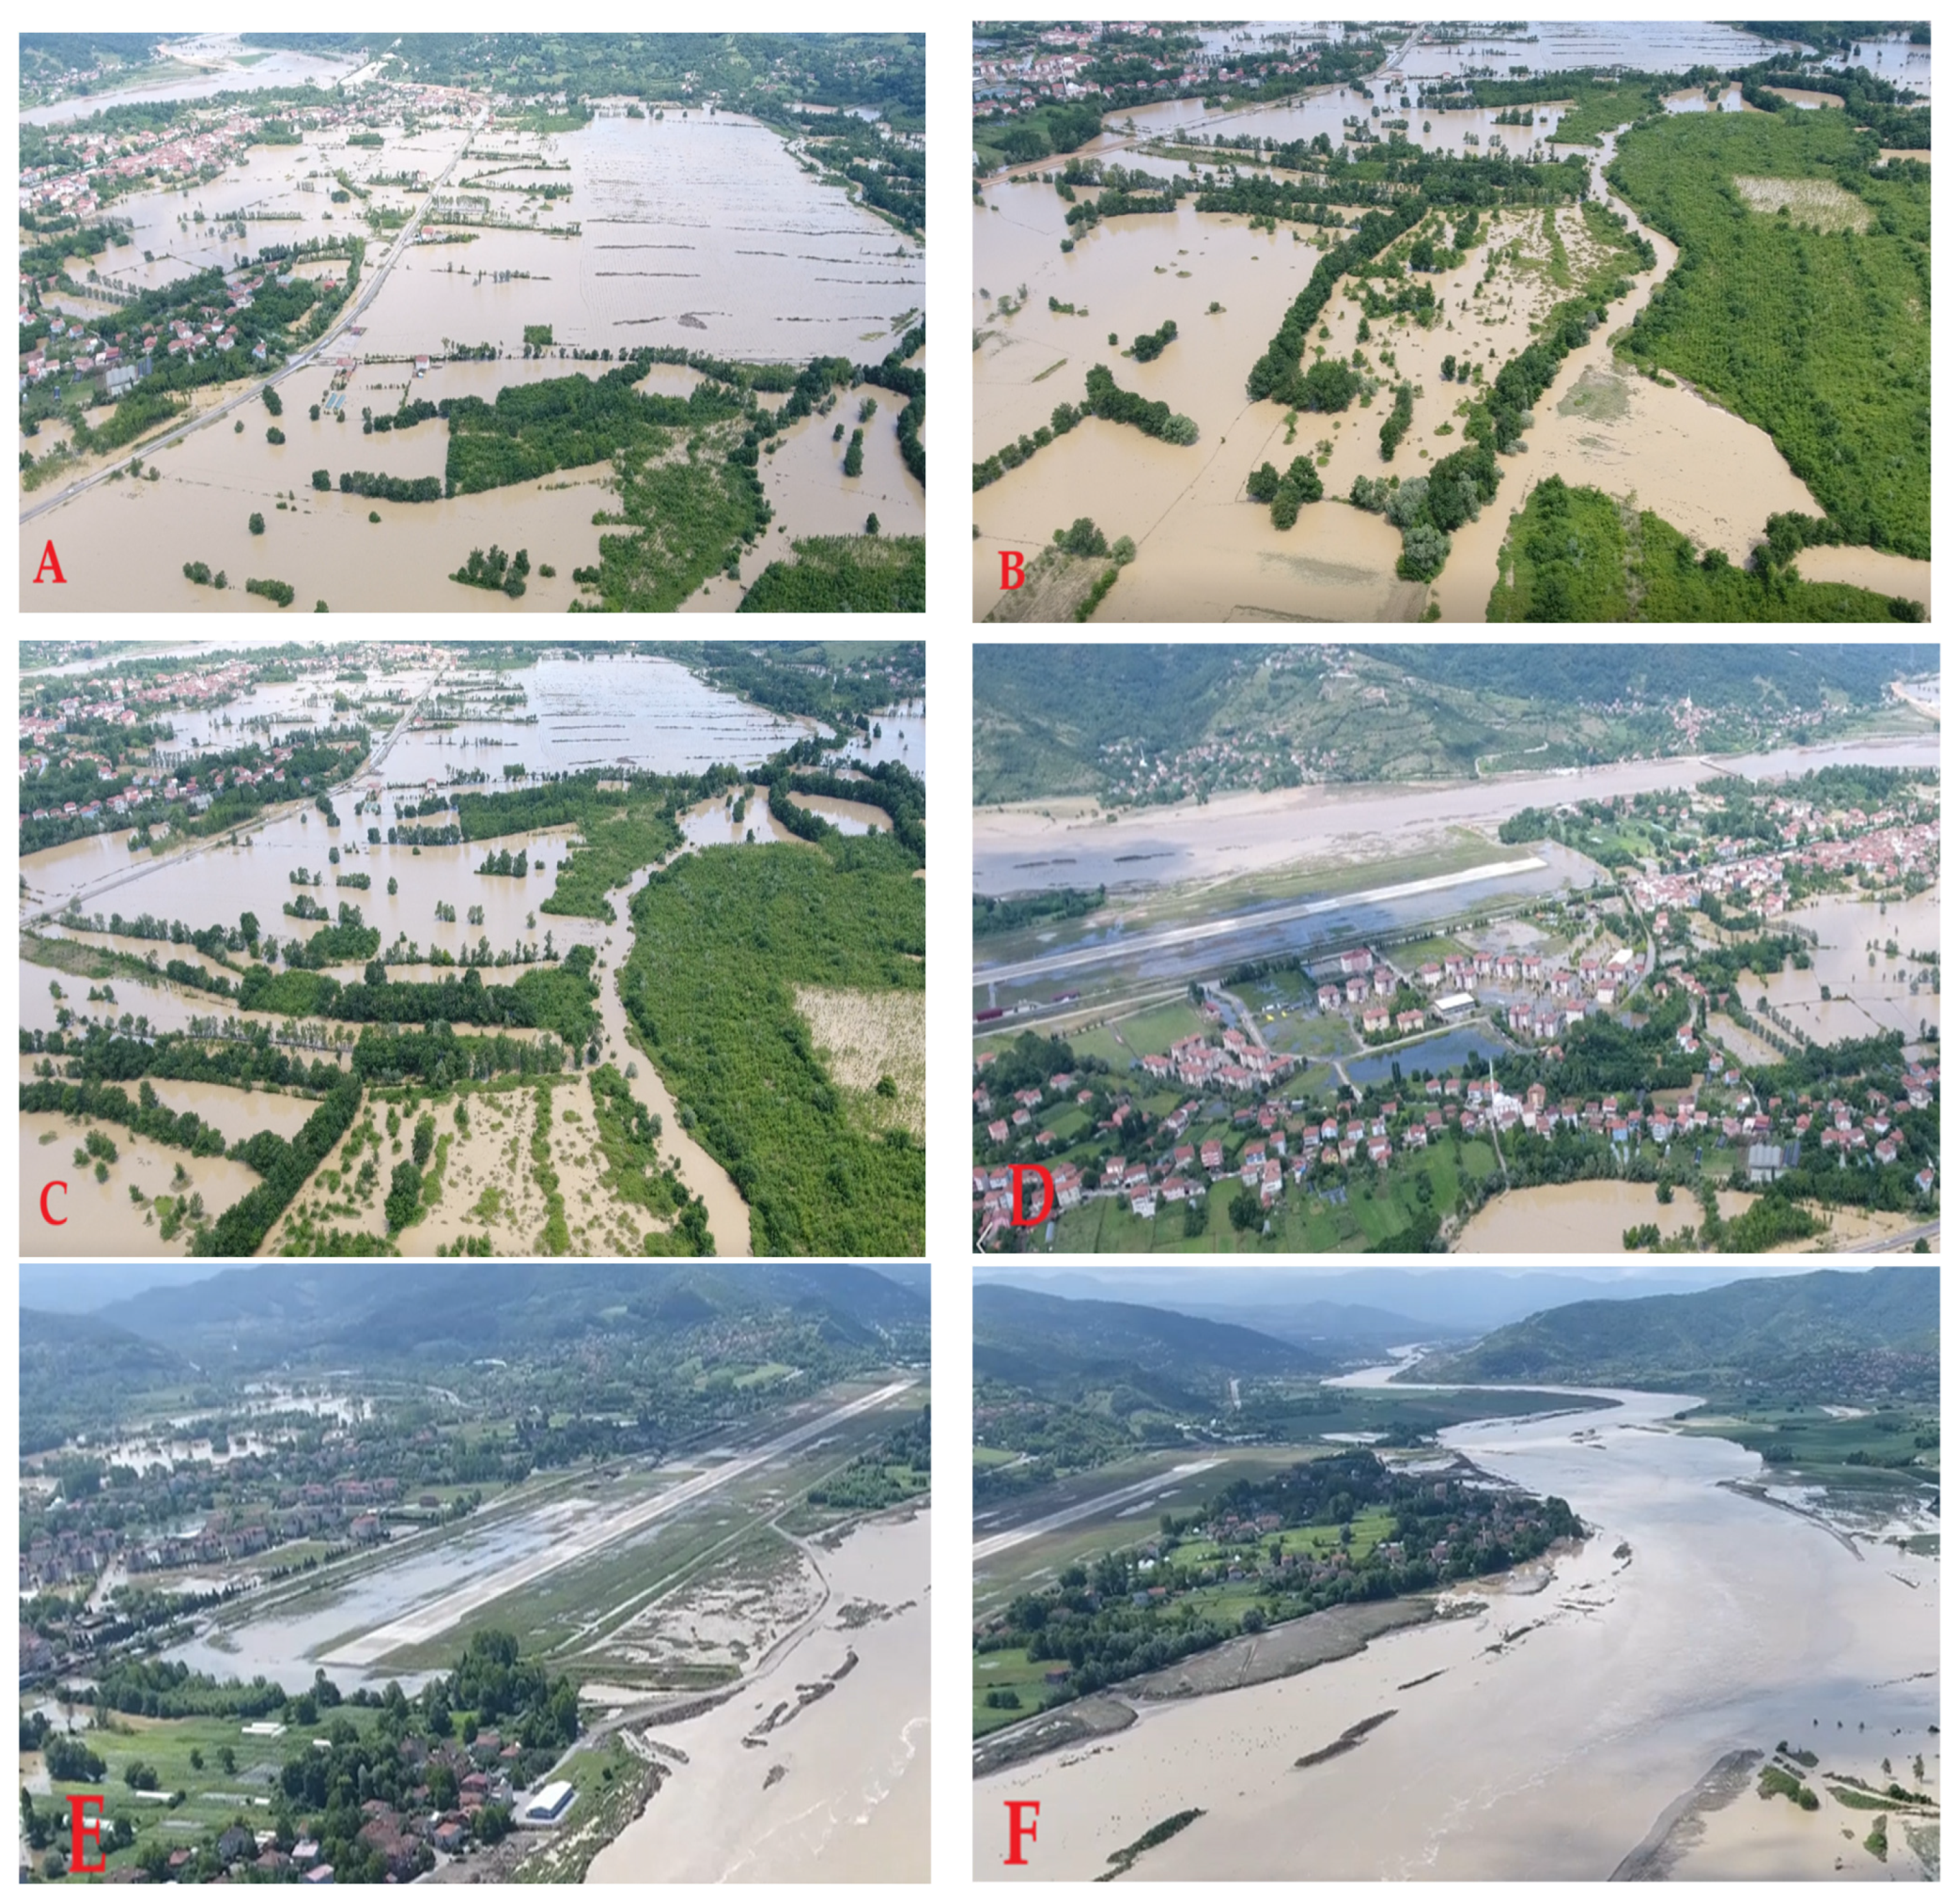
The study was finalized in June 2023. One month later (9 July 2023), floods occurred in the study area and both main roads, the airport, and agricultural lands were severely damaged (
Figure 36). The maximum flow in the last three years exceeded 1187 m
3/s. However, although the flow of the flood that occurred in July 2023 was 418 m
3/s, the existing protection structures could not meet the flood flow. This shows that in-bed regulation works were insufficient.
6. Conclusions
In this study, the effect of natural vegetation and bed material on the hydraulic potential of the Filyos River in the Western Black Sea Basin was investigated. The study area was divided into eight regions and the roughness coefficients were calculated for each region by taking into account factors such as channel geometry, soil properties, and flow conditions by including the bridges and embankments on the river. The obtained data were analyzed in HEC-RAS program and flood areas were calculated. The results based on roughness coefficients are as follows:
High amount of sediment in B1 region due to the fact that there is no flood structure and there are perennial plants in the bed;
Flood protection structures on the right and left banks of the B2 zone would not be effective in case of a possible flood;
Flood protection structures on the right coast of B3 and B4 regions will not be able to function during the flood and Çaycuma toki structures will be damaged;
There is no in-channel arrangement in the downstream part of the B5 region and Çaycuma district center will be greatly affected by a possible flood;
B6 region will have a great extent of flood damage in the area where Çaycuma Airport is located;
The narrowing of the river structure in the B7 region resulted in excessive sediment accumulation and lack of flood protection structures;
It was observed that 30% of the right and left shores of the B8 area, where the river meets the Black Sea, were designed with stacked stone fortifications, while the remaining part consisted of wooded slopes.
As a result of the fact that a large part of the existing dikes on the river will not be able to meet the flow, it will cause material and moral damages in the settlements on the right and left banks of the river, in the areas where the commercial zone is the most intense, and on agricultural lands.
Therefore, the results of the research should be included in the planning and project studies in the basin. It will be an important tool in preventing and coordinating flood damages, taking security measures in areas with high flood risk and creating an emergency action plan.
This study has several limitations that may affect the reliability of its findings. First, the accuracy of flood modeling heavily depends on the quality and availability of input data, such as historical flow measurements and rainfall information; limitations in their temporal and spatial resolution could lead to unreliable predictions. Additionally, while the effects of natural vegetation on bed resistance are acknowledged, the dynamic nature of vegetation and its changes over time due to seasonal growth, human intervention, and climatic variations may not be fully captured, potentially impacting roughness estimations. Moreover, hydraulic and hydrological models often require simplifications, which might overlook important physical processes; thus creating discrepancies between modeled results and actual flood behavior. The use of remote sensing and GIS technologies, although valuable, may not adequately capture fine-scale variations in roughness and vegetation. Furthermore, the selection of appropriate roughness coefficients can be subjective, leading to uncertainties, while variability in empirical formulas and coefficients across different studies may introduce inconsistencies. Lastly, the study may not account for temporal changes in the riverbed and surrounding areas that could influence flood dynamics, limiting the generalizability of the results.
