Abstract
This research work focuses on the development and application of a storm-tracking algorithm for identifying and tracking storm cells. The algorithm first identifies storm cells on the basis of reflectivity thresholds and then matches the cells in the tracking procedure on the basis of their geometrical characteristics and the distance within the weather radar image. A sensitivity analysis was performed to evaluate the preferable thresholds for each case and test the algorithm’s ability to perform in different time step resolutions. Following this, we applied the algorithm to 54 rainfall events recorded by the National Technical University X-Band weather radar, the rainscanner system, from 2018 to 2023 in the Attica region of Greece. Testing of the algorithm demonstrated its efficiency in tracking storm cells over various time intervals and reflecting changes such as merging or dissipation. The results reveal the predominant southwest-to-east storm directions in 40% of cases examined, followed by northwest-to-east and south-to-north patterns. Additionally, stratiform storms showed slower north-to-west trajectories, while convective storms exhibited faster west-to-east movement. These findings provide valuable insights into storm behavior in Athens and highlight the algorithm’s potential for integration into nowcasting systems, particularly for flood early warning systems.
Keywords:
storm tracking; weather radar; reflectivity; identification; rainscanner; rainfall pattern; cloud; storm cell 1. Introduction
Weather monitoring and forecasting are as old as the beginning of civilization. Although the water circle was recognized in ancient times (Plato, Aristotle), the cause of natural disasters, and specifically extreme rainfall events associated with lightning, was often associated with the presence and act of the most powerful of Gods, e.g., Zeus in ancient Greece, Set in ancient Egypt, Illapa in Inca mythology (third in power), Thor in Norse mythology, while, in monotheistic religions, the act of inducing storms and lightning was attributed to God’s wrath, judgment, and punishment towards humanity. Even in recent times, extreme storm weather and flooding are the predominant natural hazards affecting humans, causing widespread devastation that can displace people, damage property and critical public infrastructure, and ultimately result in loss of life. This fact is not likely to change since the effects of climate change are projected to increase the intensity and frequency of such events [1,2,3,4]. Notably, the Mediterranean region has witnessed substantial economic losses and loss of life from recent flash floods [5,6,7,8,9,10].
To that end, precise weather monitoring and forecasting have become critical for prevention systems such as flood and storm early warning [11]. Although many meteorological parameters affect weather, the presence and effect of rainfall are the most important, followed by intense wind. Extreme rainfall, in conjunction with human activity, causes land cover change and flooding. Flash floods, in particular, are presently among the most lethal weather-related hazards on a global scale. Their origin diverges from conventional river-driven floods, primarily from abrupt and intense precipitation over a brief duration. Usually confined to local settings, they are closely associated with convective storms, limiting their spatial impact [12].
The instruments used to measure rainfall can be categorized into two groups: ones that detect and quantify rainfall at the surface, such as rain gauges and disdrometers, and remote-sensed instruments that measure rainfall well above the ground [13]. Of the above, those offering the better and more advanced methods of storm tracking are the remote-sensed ones, especially weather radars, since they offer high spatial and temporal resolution, which is crucial for weather forecasting [14,15,16]. For these reasons, more efficient ways involving remote-sensed precipitation measurements, i.e., weather radars and satellites, have increased attention [17]. Storm tracking through weather radar monitoring dates back to the 1950s in the USA. Weather radars measure reflectivity, which can be transformed into rainfall intensity using a Z–R relationship [15,18,19]. However, transformation into rainfall intensity is not necessary for storm tracking since reflectivity itself, after being filtered, provides all the information to determine a storm’s location and strength.
There are numerous storm-tracking algorithms in use, with the most frequently cited being the TITAN project [20] and the SCIT system [21]. The TITAN project brought to the forefront the use of reflectivity thresholds for identifying cells and a method to perform real-time nowcasting on the basis of evaluating a series of properties. Since then, numerous improvements or new algorithms have been discussed, mainly compared to the above [22,23,24,25,26]. Two main categories provide cell tracking: centroid-based and cross-correlation algorithms [26,27]. The first is better at identifying and tracking individual convective cells, while the latter can produce more accurately the speed and direction of large moving storms [27]. Another way of obtaining tracks is through sheer image analysis, specifically optical flow [28,29], which is usually used as a complete nowcasting tool [30,31]. Moreover, fuzzy logic and neural networks can be implemented in either the cell identification or the cell tracking process [32,33], showing promise in increasing the accuracy of generated results, although a large training dataset is required in such cases [32].
In most of the above-cited cases, C-Band weather radar datasets are used, which compared to X-Band weather radars, have smaller spatial and temporal resolutions. Moreover, these algorithms are hard to find, as in an available computer code, and complex to apply when used with other weather radar datasets due to inconsistencies in data formats. Moreover, whereas a storm-tracking algorithm’s primary purpose is to track storm cells in real time, they can also be applied to past events to provide insights about rainfall pattern behavior over the observed area. This kind of analysis is significant, as identifying areas that are frequently affected by high rainfall intensity leads to enhanced Flood Early Warning Systems (FEWS) [34], which include the installation and maintenance of rainfall monitoring equipment designed for flood protection [35,36], and thus further improve the planning of structural and non-structural flood mitigation measures. Although the use of intensity duration frequency curves assists in such cases, the high spatial coverage of weather radars, and especially the X-Band systems, which are inexpensive, feature better spatial resolution and are more versatile since they can also be mounted on a vehicle [37], should be able to provide with added information in low-monitored areas found in rural and semi-urban regions.
In this research work, the main focus is on analyzing rainfall patterns in Athens, Greece. The NTUA X-Band weather radar, the “Rainscanner” system, has been used to analyze the storm patterns over Athens in recent years. This analysis provides two benefits, one being the development of an easy-to-use storm-tracking algorithm, able to analyze high spatial and temporal resolution datasets, and second, providing insights into the storm behavior in Athens, useful for identifying possible flood-prone areas and understanding the rainfall patterns over Athens for use in possible FEWS implementations.
2. Materials and Methods
2.1. Study Area and Data Used
This research work makes use of the NTUA rainscanner datasets. The rainscanner system is installed on the NTUA campus in the Zografou municipality, located five km from the city of Athens center. The elevation of the installation is 200 m, and it features a 50 km effective range. The system operates at a fixed angle of two degrees, which is set as low as possible to avoid obstacles in central and western Athens, such as the high elevation areas of Aigaleo, Penteli, and Parnitha mountains, ensuring a clear view to the west, past the Aigaleo mountain and over the Saronic Gulf.. From a topographical point of view, the rainscanner is not at an optimal position to observe the entire Attica Region due to its proximity to the mountain Hymettus on the southeast. As seen in Figure 1, this proximity leads to an obstruction of view to the entire southeast area, which results in considerable data loss. However, it is a known fact, also to be highlighted in this research, that most rainfall fields in the area have a western-to-eastern direction, which suits the rainscanner position. Concerning the range–elevation factor, at distances from 10 to 20 km, where the majority of Athens urban space lies, the rainscanner’s beam height ranges from 550 to 900 m above sea level, with the elevation of central Athens and Mount Aigaleo being 60 m and 400 m, respectively. Mount Aigaleo is critical to the development and trajectory of rainfall patterns since it lies as a high-elevation barrier between the western Attica area and the Athens city center.
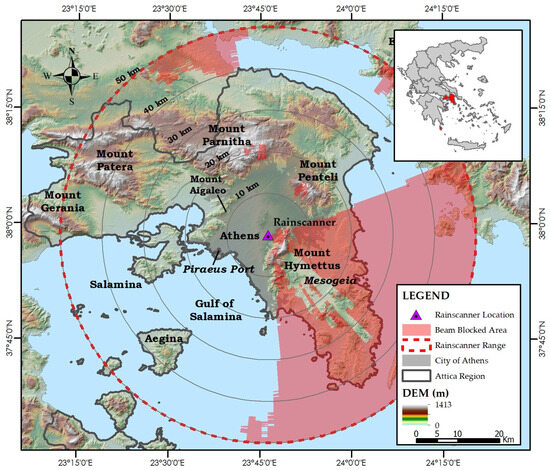
Figure 1.
The study area, the Attica region, along with the beam blockage area.
In Attica, a high number of small and steep basins are found. The largest is the Kifissos River basin, which is highly urbanized, and the second is the Sarantapotamos River Basin, which features rural characteristics on the high elevations and urban characteristics near its outlet.
The rainscanner datasets consist of fine spatial and temporal resolution gridded datasets. The system produces raw data in gridded reflectivity measurements of 1000 × 1000 pixels, with a spatial resolution of 100 m × 100 m per pixel and a temporal resolution of two minutes. In Figure 2 the Rainscanner pre-process data correction is illustrated. First, a quality control procedure is performed, where the datasets are audited for missing data or abnormal values. This procedure is performed by applying a ground-clutter correction, where abnormal reflectivity from non-rainfall objects is removed or corrected, and then by filling no-data cells by interpolating nearby cell values. The interpolation is performed only where specific rules apply, such as the size and the distance of the no-data gaps from available cell values. Several cells at the gap border can be interpolated at considerably significant no-data gaps, whereas cells further away remain as no-data. These gaps are visible in Figure 1, where the beam-blocked areas are featured with the red polygon, showing no-data gaps near the Mount Penteli and Parnitha peaks. The interpolation algorithm is performed automatically on all cells per reflectivity image. A reflectivity image is constructed as the average value of 24 scans, thus minimizing the effect of non-constant errors.
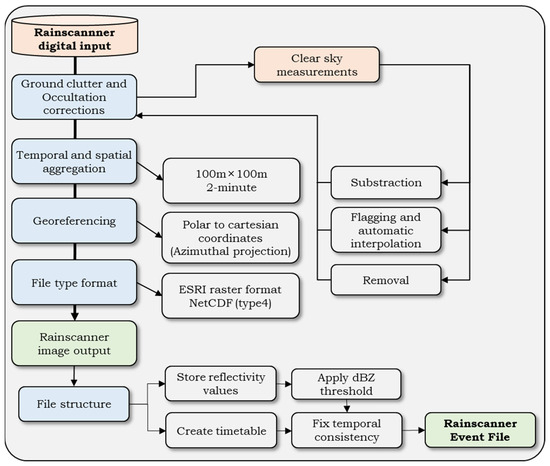
Figure 2.
The rainscanner pre-process data correction procedure.
Finally, after each image is constructed, the entire event database is checked for temporal consistency, i.e., no 2-min image is missing in succession, while a threshold limit is also applied to remove any abnormal values that were not corrected after the ground-clutter procedure. This process is performed to quickly eradicate any errors generated from the clutter that have not been included in generating the ground clutter filter.
2.2. Storm-Tracking Algorithm
There are two main processes involved in storm tracking. The first focuses on identifying the storm cells in a single image, while the second focuses on tracking the cells in consecutive images. In Figure 3, the complete framework of the storm-tracking algorithm is shown.
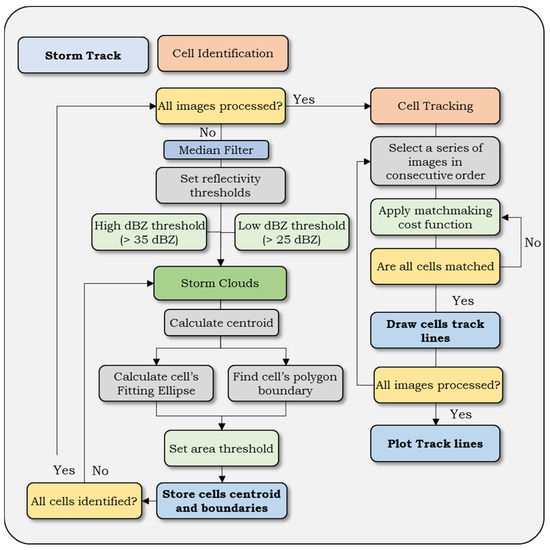
Figure 3.
The storm-tracking algorithm flow chart.
2.2.1. Cell Identification
Cell identification takes precedence using image analysis techniques for every radar image. First, the weather radar image is processed with a 2D median filter to reduce noise. This filter replaces each grid value with the median of its surrounding 3 × 3 grid, effectively blurring the image. This step eliminates anomalous high or low reflectivity values, distinguishing actual rainfall patterns from data artifacts. Additionally, nearby storm cells separated by small gaps can be merged into a single, cohesive cell structure.
Following the application of the median filter, the identification process takes place using the multiple reflectivity threshold method. In a single weather radar image, two thresholds are critical. The first features a smaller value and divides the radar image into areas where storm cells are observed. The second feature is a higher value, usually used to identify a storm cell core.
Technically, a low reflectivity threshold captures the majority of reflectivity within a picture, identifying “large” uniform storm cells of moderate mean reflectivity, while a high threshold leads to small storm cells. The problem arises with the actual values these thresholds should hold. A small or even moderate threshold value (i.e., 20–30 dBZ) will most actually identify a large number of cells; however, identifying the storm’s cell core, particularly its tracking, becomes a challenging and error-prone task. In the other case, a high reflectivity threshold, e.g., above 35 dBZ, will identify the actual storm cores to be tracked; however, it leads to fewer storms being tracked, leading to possible false merging and splitting situations, or missing tracking timeframes due to no identification of storm cells in a single timeframe. It is vital to notice that a high threshold is useful for distinguishing between convective and stratiform systems. Convective events tend to feature intense storm cores with smaller spatial coverage, while stratiform events cover larger areas with weaker reflectivity cores. Therefore, identifying high-reflectivity cells is associated with convective storms, whereas moderate reflectivity with large footprints is associated with stratiform cells. To aid with the ident
Finally, besides the reflectivity value, another important factor in cell identification is the actual shape of the recognized cells. When applying the thresholds, the result is multiple polygons of reflectivity above the threshold. The median filter assists in forming regular polygons with no sharp edges, but they remain polygons with varying areas, which is not ideal for tracking purposes. To that end, using a better mathematical shape is preferred; therefore, a fitting ellipse routine is added to this algorithm. The ellipse is drawn to include all the polygon nodes within its boundaries.
The identification process is applied until all storm cells are processed within a single radar image. The polygon boundaries and centroid, fitted ellipse centroid, eccentricity, and the minor and major axes vectors are stored for each cell. A further criterion is added to the final selection process where, if a polygon does not meet a pre-specified minimum area, it is removed from the identification process since only cells with sufficient area are considered eligible for tracking. This minimum area value is selected based on the value of the reflectivity threshold since a higher reflectivity threshold leads to smaller cells, whereas a smaller threshold leads to larger cells. Adjustments to the minimum area should be made to reflect this. In this work, after several observations, a minimum area of 4 km2 was selected for a typical storm cell, whereas a cell core, i.e., the area of high reflectivity, was identified as an area of at least 1 km2 in size.
In nowcasting systems, the primary focus often lies in tracking storms with high rainfall intensity; hence, a high threshold is preferable, mainly when multiple images are utilized for image disaggregation. In this research work, a sensitivity analysis was performed, and multiple thresholds were utilized to observe the differences. Nonetheless, employing a multi-threshold approach proves more compelling, where various thresholds create a hierarchical structure, initially identifying low storm coverage and subsequently pinpointing sub-cells with high reflectivity. Reflectivity values below 20 dBZ are typically disregarded as part of rainfall storms unless snowfall is present. This study employs three thresholds: one for delineating storm coverage above 25 dBZ, another for distinguishing storm cores with values surpassing 30 dBZ, and, finally, one for identifying the most hazardous storms, with a threshold set at 40 dBZ.
2.2.2. Cell Tracking
The cell tracking process takes place after the identification of all cells. The method used is developed on the basis of motion vector and cross-correlation. Specifically, the matching between two consecutive radar images is performed by applying an optimization process between the different storm cells identified in each consecutive image. To that end, a cost function is used to find the best fit, which incorporates cell characteristics, such as area and the fitting ellipse properties, which results in the best possible matchmaking between the identified storm cells of the two images. All possible entity combinations are assigned to the assessment matrix, which is then solved through a match pair algorithm [38]. The algorithm aims to solve the linear assignment problem of assigning rows, i.e., storm cells in time ti, to columns, storms cells in time ti+1, to minimize the assignments’ total cost (TC). The total cost of a solution M is the sum of the cost of all matched pairs added to the cost of all unmatched pairs as follows:
where TC is the total cost, Cost is an m-by-n matrix, M is a p-by-2 matrix, where M(i,1) and M(i,2) are the row and column of a matched pair, costUnmatched is the cost of no matching, and (m + n − 2p) is the total number of unmatched rows and columns.
The cost function can have many forms. The most basic uses Euclidean distance, meaning that the closer two cells are, the less the Cost value. However, more attributes can be added to the function to match two storm cells. Similarly to the work of Munoz et al. [24], the distance Lc, area Ac, structure Sc, and eccentricity Ec components are used in the cost function with relative weights as follows:
where w1,…w4 weights of the above-defined factors are taken as 0.4, 0.25, 0.25, and 0.1, respectively [24]. The linear assignment problem will find the pairs by minimizing the cost function. If only the cost function is used, the result is not ideal because it cannot deal well with cells that are either born, expire, split, or merged between frames. Therefore, an added term is added to the cost function, the costUnmatched, which aids in ending the minimization process without trying to match all cells. Equation (1) compares the value of 2 times the costUnmatched term to the entries of the Cost function to determine whether it is more beneficial for a row or column to remain unmatched. The costUnmatched term in this implementation is a maximum distance at which tracking should not be performed. For instance, if only two storm cells are identified in two consecutive images, but their distance is above a “distance threshold”, i.e., more than 10 km, then a matching should not be made since it is evident that the previous frame cell just disappeared in the next frame, while the latter was a newborn cell. This algorithm uses a distance threshold of 10 km for a 2-min frame comparison.
When the tracking algorithm is run once, most cells are joined, and the first assignments are made. Cells not assigned to other cells are subject to merge, split, disappear, or born situations. A merge is when two cells are merged into a single entity, meaning that only one track should be formed afterward, while a split means that a single entity will generate two tracks in future predictions. The cost function is applied once in the current implementation, and the best fitting matchmakings are performed. If cells of the previous time image remain unmatched, the matchmaking procedure is re-applied but with the removal of the cells of the previous image that were matched. This leaves space for unmatched cells to be matched with the new cells and thus results in a merge situation. The splitting is performed accordingly but by removing the current unmatched cells, this time compared to the previous image cells. The distance threshold in each case dictates whether the cell will be merged or diminished and whether a cell belongs to a splitting cell or is a newly formed cell.
The above algorithm is developed in MATLAB® programming language. The algorithm’s input is the rainscanner event file generated, as shown in Figure 2. In the current implementation, the event file is generated by the use of the netCDF files created by the rainscanner system for each time frame. In practice, the algorithm makes use of a single reflectivity timetable where the spatial resolution of the cells is known. Furthermore, the only parameters of the algorithm are the used threshold values for the identification and tracking processes, namely, the reflectivity threshold, the minimum cell area, the maximum tracking distance, and the cost function weights of Equation (1). This formulation makes the code applicable to any weather radar dataset as long as quality-controlled weather datasets are provided.
2.3. Rainfall Pattern Dataset
The storm-tracking algorithm is applied to a series of events ranging from 2018 up until 2023, which are included in the analysis. The database consists of up to 80 different rainfall event files collected by the authors responsible for the operation and maintenance of the rainscanner system. However, because various rainfall events did not generate considerable rainfall, this study used a list of 54 events, which featured a considerable amount of duration and reflectivity values to be exposed by the storm-tracking algorithm developed. In Figure 4, the monthly distribution of the events used is shown. The majority of events occurred in winter, from October to February, followed by spring, March to May, while only a few occurred during the summer. However, it is noticeable that more events occur in June than in May, which usually feature convective characteristics, i.e., smaller footprints but with high rainfall rates. The main objective of the algorithm application is to analyze the rainfall patterns concerning (a) the storm cell coverage and the areas that are frequently affected by high rainfall intensity, e.g., over 35 dBZ reflectivity, which is approximately 6–7 mm/h depending on the Z–R relationship used, and (b) to identify the major directions of the storm cells, relatively to the storm characteristics and seasonality. These are performed after applying the storm-tracking algorithm, identifying the tracking lines of the most significant storm cells.
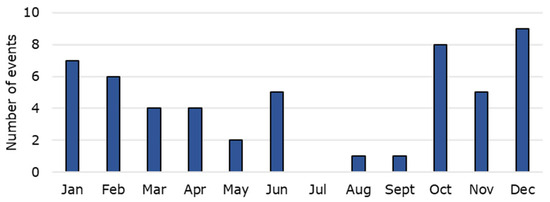
Figure 4.
Monthly distribution of recorded events used in the study.
3. Results
3.1. Cell Identification Analysis
The first section focuses on the performance of the storm-tracking algorithm. In Figure 5, an analysis is performed to examine the thresholds used in the cell identification process. The images showcase a single timeframe where different thresholds and shapes are used to detect the cells. In each row, a different reflectivity threshold is used (25, 30, and 35 dBZ), while in each row, the difference between selecting the exact polygon to the fitted ellipse is shown.
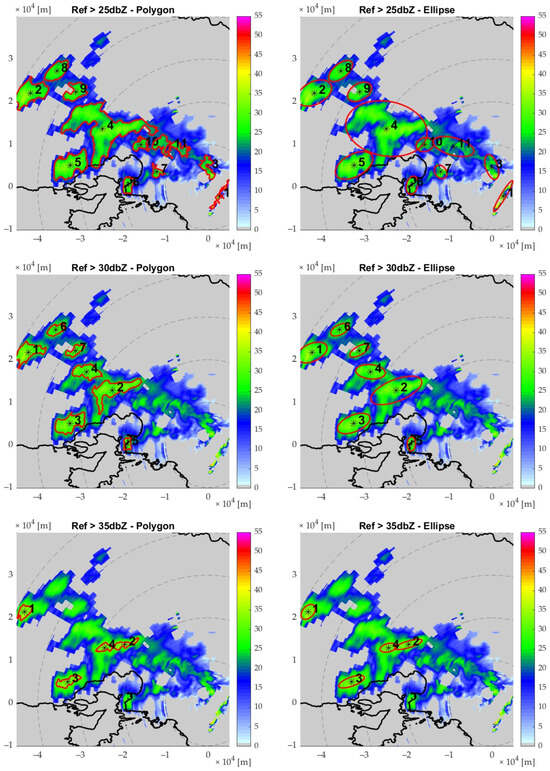
Figure 5.
The results of the cell algorithm are shown when a different reflectivity threshold is used; 25-, 30-, and 35-dBZ are shown in each row, while in each column when a polygon or fitting ellipse is used to form the boundaries. In each frame, the red shapes illustrate the boundaries of the cells, the star symbol the cell’s centroid’s location and the number the ID of each cell.
First, we examine the used thresholds. It is evident that the higher the threshold used, the smaller the storm cells. For instance, when a 25 dBZ threshold is used, 11 unique storm cells are detected, whereas eight and only 4 for the 30 and 35 dBZ thresholds, respectively. By sheer observation, the lower threshold seems to over-perform, while the highest threshold seems to under-perform to the number of storm cells detected by the human eye. Since most storm events in Athens featured a mean 25–35 dBZ reflectivity, the optimal reflectivity threshold is the 30 dBZ level. Furthermore, when comparing the polygon-ellipse shapes used, it is evident that in the lower thresholds, the fitting ellipse tends to provide less quality results when trying to encapsulate a large cell, as seen in the number 4 cell, whereas cells with a smaller size are ideally identified.
This problem is eradicated when a higher threshold is used. In this case, the results show a good fit, which also tends to better represent the essence of a storm cell than the previously used polygon. For instance, in the high 35 dBZ threshold, a fitting ellipse is favored over the uneven shape of the small polygons, which feature sharp edges. A fitting ellipse, being a mathematical shape, is more suitable for correlation analysis as its eccentricity and rotation can be utilized in the cell matchmaking algorithm; therefore, it is generally the preferred shape.
Assessing all the above findings, the strategy used in the identification process is as follows. First, the 30 dBZ threshold is used to identify the storm cells that need to be tracked. A fitting ellipse is then formed, and the centroid, eccentricity, and the minor and major axes vectors are stored for each cell. The 25 dBZ threshold is then applied to figure the cell boundaries. The cell polygon boundaries that include the above 30 dBZ cells are stored in the database of each of the 30 dBZ cells. Finally, the 35 dBZ (or 40 dBZ) fitting ellipse is drawn and, along with its centroid, stored for each of the 30 dBZ cells. This is performed to identify areas with high reflectivity representing areas with high rainfall. All these datasets are used later in the tracking algorithm.
3.2. Cell Tracking Results
After the identification, the tracking process follows. The main goal is to apply the matchmaking algorithm and assess its result under different temporal scales. Figure 6 displays six consecutive time frames at a 2-min interval, equal to the rainscanner’s temporal resolution. In the images shown, the 30 dBZ threshold and a fitted ellipse represent the storm cells, shown in red for the current time frame and with dashed black lines for the previous time frame. The same color scheme is applied to the centroids of each cell. In the first four frames of Figure 6, the matchmaking process is deemed highly accurate; however, this is because the cells do not undergo significant changes within a two-minute period, making cell association straightforward. However, the last two frames show slight discrepancies in the matchmaking process. In the 15:48 and 15:50 time frames, two cells merge to form a larger one. While the merge is acceptable at 15:48, the resulting ellipse at 15:50 is less accurate, as the cell takes on an inverted “V” shape, and the algorithm produces a single storm cell with a wrongly positioned centroid.
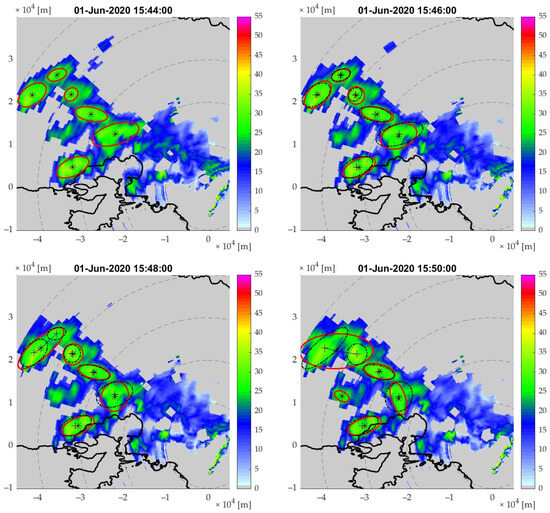
Figure 6.
The matchmaking procedure between six 2-min reflectivity fields time frames with a 2-min step. In each frame, the red shapes illustrate the boundaries of the cells, while the star and cross symbols illustrate the previous and current frame cell’s centroid’s location, respectively.
To avoid such matchmaking issues and enhance the identification and tracking process, combining multiple frames to create a single image is recommended, which can be achieved by merging past 2-min frames and calculating the average reflectivity values. For example, if two frames with timestamps 15:42 and 15:44 are merged, a 4-min reflectivity field is created with the timestamp of 15:44, illustrating the average reflectivity of the two frames. This process produces more uniform and consistent images, making it easier to identify larger storm cells rather than splitting them into smaller cells. Using a coarser resolution also improves the accuracy of nowcasting algorithms since it aligns better with other data types, such as rain gauges, which operate on similar, coarser timescales. However, it is essential to note that when merging frames, the reflectivity values are normalized, reducing both minimum and maximum values; therefore, the reflectivity threshold might need to be adjusted to reflect this. Nevertheless, in this application, as shown in Figure 7, and after several tests, the 30 dBZ threshold that was applied yielded satisfactory results. In Figure 7, five timeframes are merged to create 10-min reflectivity fields, with the tracking being performed on the original, 2-min resolution, similar to the tracking performed in Figure 6.
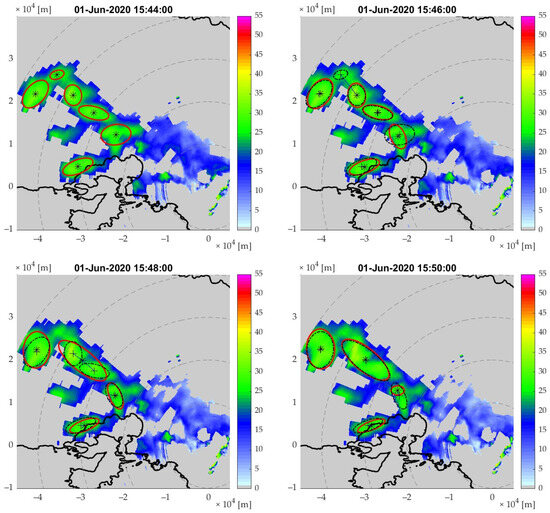
Figure 7.
The matchmaking procedure between six 10-min reflectivity fields time frames with a 2-min step. In each frame, the red shapes illustrate the boundaries of the cells, while the star and cross symbols illustrate the previous and current frame cell’s centroid’s location, respectively.
Comparing the same timestamp frames between Figure 6 and Figure 7, it is visible that the storm cells in Figure 7 are more blurred, with the ellipse being of a similar but smaller and different shape, as a result of averaging five reflectivity fields. As mentioned before, the timeframe 15:44 in Figure 6 is the 2-min reflectivity the rainscanner measures. In contrast, the timeframe 15:44 in Figure 8 is the 10-min reflectivity resulting from averaging timeframes 15:36, 15:38, 15:40, 15:42, and 15:44. The comparison shows that although the first tracking steps feature similar results, the difference is highlighted in the last two frames, the 15:48 and 15:50, where using the 10-min reflectivity a merge is formed from two nearby storm cells. In contrast, in the 2-min fields, this is not exhibited. Furthermore, in the 15:50 frame, fewer, larger storm cells are identified in the 10-min resolution, whereas in the 2-min resolution, they are shown as different storm cells. In the time frame 15:50, the cells are formed more consistently, making a better cell identification. Specifically, compared with the 2-min resolution, the transition between each timeframe is more natural, yet not less realistic. This comparison shows that using more data is preferable to achieving better results, even in such small scales as 2 min.
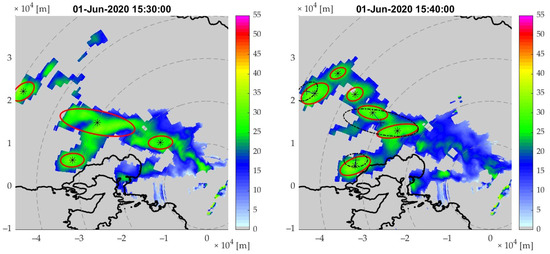
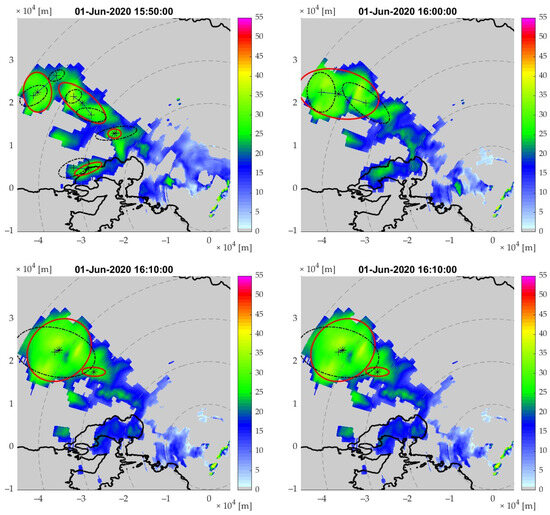
Figure 8.
The matchmaking procedure between six 10-min reflectivity fields time frames with a 10-min step. In each frame, the red shapes illustrate the boundaries of the cells, while the star and cross symbols illustrate the previous and current frame cell’s centroid’s location, respectively.
Therefore, the next step in algorithm testing is to increase the temporal resolution of the consecutive images. Naturally, images observed with a two-minute delay should not exhibit significant changes. Therefore, coarser resolutions are tested to estimate better the algorithm’s ability to track storm cells in consecutive images correctly. This application is usually used for nowcasting and forecasting since the more extensive the temporal gap, the better the lead time provided. Typical resolutions are in either 5-, 10-, 15-, and 30-min resolutions, while more extended periods, such as 1-, 3-, and 6-h, typically require more data, such as advanced cross-correlation algorithms, dual-frequency Doppler radars, wind velocity, and direction data, and even NWP products. However, the algorithm is tested in this test to assess its tracking ability on observed images rather than figuring out a possible future position.
Finally, Figure 8 shows the 10-min interval using merged 10-min resolution frames, similar to the previous tracking images. As was the previous results, the 10-min periods also showed good consistency. Specifically, the storm cells were found to be consistent with the used-to-be place and current place. For instance, by comparing the timeframe 15:50 shown in Figure 7 and Figure 8, it is shown that although in the past, cells were calculated using different data—specifically, the 10-min reflectivity at 15:48 in the former and the 10-min reflectivity at 15:40 in the latter—the consistency between the periods remains acceptable. This demonstrates that the algorithm can still be reliable for future predictions, even with larger time intervals.
3.3. Rainfall Patterns Analysis
After evaluating the ability of the storm-tracking algorithm to identify and track storm cells across multiple rainscanner images, it is used to construct the track of an entire event. In Athens, typical events have short durations, lasting 6- to 12-h, while summer convective events can have smaller durations of up to 4- to 9-h. Table 1 features a sublist of the events used in the analysis, with the date and duration of the events illustrated in the following figures.

Table 1.
Storm events characteristics featured within the main text.
Although the 30 dBZ limit is used as the primary threshold to identify storm cells, in order to produce more readable images and focus on the areas where high rainfall intensity was observed, we plot the storm cells’ boundaries and centroids that featured a reflectivity over 35 dBZ and 40 dBZ. These thresholds are used to emphasize regions that were hit by intense rainfall. These maps assist in assessing areas affected by the highest rainfall intensities. While the storm cells might have a bigger footprint, the 35 dBZ can be considered a relatively high threshold. When transforming this threshold to rainfall intensity, through the use of a Z–R relationship, such as the typical Marshal and Palmer [18], Z = 200 R1.6, 35 dBZ translates into 5.62 mm/h, while when using the Z–R relationship that was derived by the authors [19], who used the same radar datasets and correlation analysis with rain gauges, the Z = 321 R1.25 relationship, the 35 dBZ translates into 4.46 mm/h. Similarly, the 40 dBZ threshold translates into 11.53 mm/h and 9.47 mm/h rainfall intensity for the above Z–R relationships.
Figure 9 shows the regions affected mainly by two convective events, 31 and 50, using the 35 dBZ and 40 dBZ thresholds. The difference between utilizing a 35 and 40 dBZ threshold is shown in each column. In event 31, the main trajectory of the storm is more visible when observing the 40 dBZ threshold map. The storm’s movement had a northwest-to-east direction, first observed on the top of Mount Pateras, and followed a direction towards Aigaleo Mountain to the northern suburbs of Athens when comparing the maps to Figure 1. The triangle showcases the location of the rainscanner, which, as mentioned, is only 5 km from the city of Athens. Finally, the tracking is also visible in the 40 dBZ map for the E50 event with dashed black lines. Similar maps are made for the dataset, consisting of 50 storm events from 2018 to 2023.
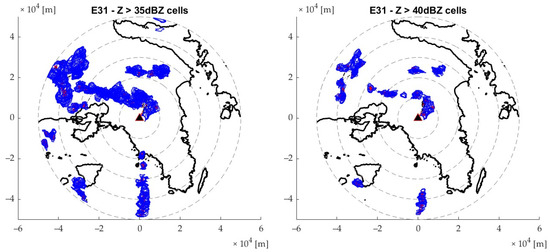
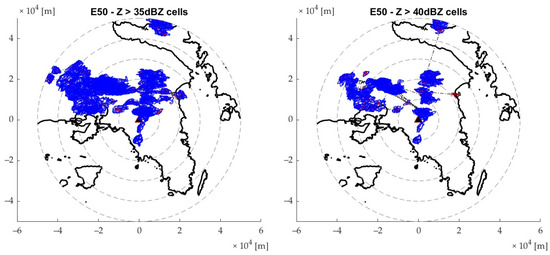
Figure 9.
Storm cells of events 31 and 50, for two reflectivity thresholds, illustrated with blue polygons; first column 35 dBZ, second column 40 dBZ. The triangle symbol illustrates the Rainscanner location, wher eas the dashed circles an increasing 10 km distance from its location.
By analyzing the similar maps of the entire event database, it is evident that most storm cells are located in the southeast region, over the islands of Aegina and Salamina. This result is attributed to the seawater feeding the storm cell more moisture. Considering the mainland areas, the areas most affected depend on the storm’s trajectory, with the coastal areas in the southwest, where Piraeus port is located, being the majority, while also the area west of the city of Athens, where the Aigaleo mountain is found (see Figure 1), also features a high number of impacts. The center of Athens, near the triangle that illustrates the rainscanner location, does not have that many impacts. Generally, rainfall events tend to have a western direction, towards the city center, then following a northern direction, due to the presence of Hymettus Mountain (found east of the rainscanner location).
Since these maps might be overwhelming when trying to understand the trajectory of the primary storm cell, in Figure 10, only the centroids of the 35 dBZ cells are illustrated with red dots. Moreover, four more events are added to the specific figure: events 6, 21, 61, and 62.
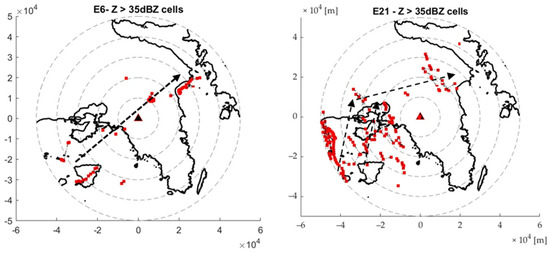
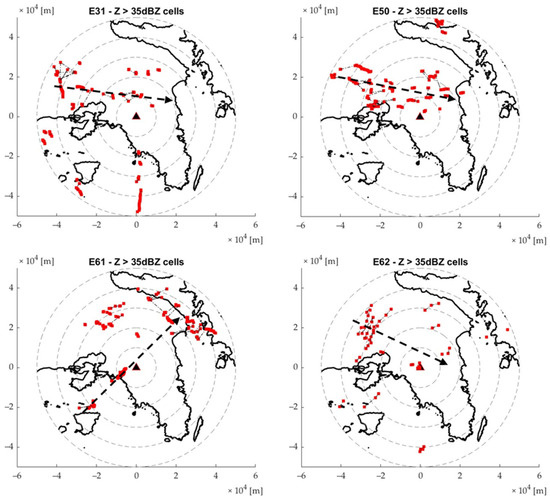
Figure 10.
Centroids and areas covered by storm cells with a reflectivity threshold >40 dBZ. The triangle symbol illustrates the Rainscanner location, whereas the dashed circles an increasing 10 km distance from its location. The dashed arrow illustrates the main trajectory of the storm.
On each frame, of Figure 10, an entire event is illustrated, and the main trajectory of the storm cells is plotted. This trajectory is extracted by evaluating all the results generated by the storm-tracking algorithm, focusing on the larger storm cells. Generally, the trajectory of the storm cell matches the location of the storm cell centroids. Event 21 shows a change of trajectory, where, first, the main trajectory had a south-to-north direction, only to change to an eastern direction.
The featured events are a subsection of all the events evaluated. In Figure 11, the main directions of the storms featured in Attica after analyzing the storm direction of each event, along with the percentage of each direction, which is also illustrated with the use of increasing line weights of each direction arrow. Most storms (40%) had a southeast-to-northwest direction, passing over Athens. Following this, a west-to-east and northwest-to-east direction is also featured, 20% and 12%, respectively, while some cases of a south-to-northeast direction, 6%. Finally, north-to-south directions are also featured, approximately 16% of the entire datasets. Another critical factor to consider is the event’s storm characteristics: the season they occurred, their velocity, and convective/stratiform classification. Events that featured stratiform characteristics, as identified by their large footprints, medium reflectivity, and slower velocity, usually occurred in the winter months, and mainly had a north-to-south direction. On the other hand, most of the events studied were convective events featuring a south-western-to-east direction, and an average velocity of about 45 km/h. Finally, even though no measurements were feasible to the southeastern part of the area due to radar beam blockage, no events featured a southeast-to-west direction where data were available.
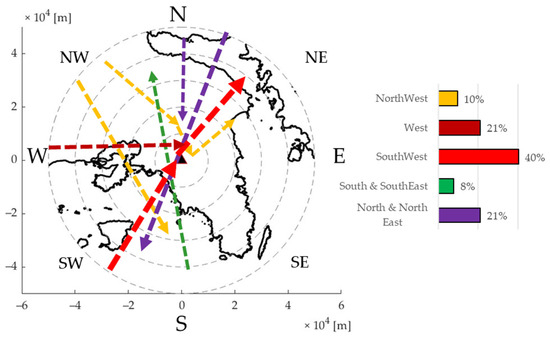
Figure 11.
Main directions of storm cells in the Attica Regio: red lines are the most reoccurring, followed by blue, yellow, and purple, according to the attached chart. The triangle symbol illustrates the Rainscanner location, whereas the dashed circles an increasing 10 km distance from its location.
It is important to stress that during the studied period, Greece experienced reasonably hot winters with a small number of rainy days, with a negligible impact on the region of Athens due to the topography of Greece. Therefore, most events occurring, or instead significantly impacting Athens infrastructures through flooding, have convective characteristics even in the winter months. Greece’s most recent events occurred from September (the 2020 Ianos and 2023 Daniel storms) to November (the 2017 Mandra event). While the first two had significant rainfall, these events did not affect the city of Athens, while the latter had a minimal footprint, fixed over the mountain Pateras in the western area of the Attica region.
4. Conclusions
The storm-tracking algorithm developed in this research concentrated on cell identification and tracking methods. The algorithm was evaluated on the basis of its ability to track storm cells through the use of various reflectivity thresholds and shapes. It was found that employing multiple thresholds is advantageous, as it allows for better identification of both the cell’s centroid and its actual boundaries. Specifically, the 25 dBZ threshold effectively defines polygon boundaries, while the 30 dBZ threshold is better suited for identifying primary cells. Given these findings, the 30 dBZ threshold and a fitting ellipse with a minimum area of 4 km2 were utilized in the matching algorithm, as it yielded the best results for detecting primary cells. A fitting ellipse is also preferred as a mathematical representation, as it works more effectively with the matching algorithms. Following this, the matchmaking algorithm is applied and tested for cell tracking across different temporal scales. While the rainscanner system records reflectivity products with a 2-min temporal resolution, such tracking is impractical, and, therefore, reflectivity fields with a 10-min resolution were generated by merging five consecutive images. The algorithm performed better with this extended tracking period, as more data per interval were used. Further runs of the algorithm over a 10-min tracking period showed effective performance, considering the number of tracked, merged, disappeared, or newly formed cells.
The tracking algorithm was then applied to over 80 events recorded with the rainscanner system. As mentioned earlier, of the 80 events, only 54 featured high enough reflectivity records to form well-identified tracking. The results featured two main findings. First, the areas predominantly affected by high rainfall intensity were identified by analyzing the storm cell’s borderlines in conjunction with a high reflectivity threshold. These areas are firstly the northern part of the Saronic Gulf, i.e., at the sea, while on the mainland, the areas most affected are the southwest coastal front of Athens, near Piraeus port, and regions surrounding the Aegaleo mountain. These areas tend to be affected due to topography since, in the first case, the coastal front is subjectable to high rainfall due to the proximity of the sea, which feeds the storm cells with added moisture, while in the latter case, it is the increase in elevation that is caused by the Aigaleo mountain. The second finding focuses on the primary storm directions in Attica. As expected, most storms (40% of events) moved from the southwest to east, followed by northwest-to-east and south-to-north directions.
Additionally, storms moving from the north and northeast to the west were common, though these events were associated with stratiform rainfall, characterized by slower-moving storms with light-to-moderate rainfall rates. In contrast, most convective events moved from west to east and exhibited higher velocities. Considering the above, this analysis highlights the importance of proper rainfall monitoring in early warning systems. As shown, since most storm systems had a west-to-east direction, it emphasizes the need to expand the monitoring system to the west further to detect these systems earlier and add to possible lead times when producing forecasts.
The obtained results showcase the algorithm’s ability to assess the rainscanner datasets and provide valuable information concerning the rainfall patterns and intense rainfall-prone areas over Athens. The algorithm’s applicability makes it a valuable tool for any weather radar system, ensuring better weather monitoring and warning systems in the respective areas of weather radar coverage. Ongoing research focuses on adding a nowcasting algorithm to predict real-time storm movement. Such nowcasting tools are essential for real-time monitoring and forecasting in a flood early warning system frame, we suggest that further analysis on a larger scale, i.e., radar scans covering further distances or using synoptic and mesoscale datasets, should have their merit since the 50 km range of the rainscanner can be considered small to provide adequate lead times. Nonetheless, this analysis brings to fruition the necessity of adopting high-quality measurements to deal with storm issues, which are expected to increase in frequency due to the effects of climate change.
Author Contributions
Conceptualization, A.B. and E.B.; methods, A.B.; software, A.B.; validation, A.B. and E.B.; formal analysis, A.B.; investigation, A.B.; resources, A.B. and E.B.; data curation, A.B.; writing—original draft preparation, A.B.; writing—review and editing, A.B. and E.B.; visualization, A.B.; supervision, E.B.; project administration, E.B.; funding acquisition, A.B. All authors have read and agreed to the published version of the manuscript.
Funding
This research received no external funding.
Data Availability Statement
The data that support the findings of this study may be available from the corresponding author upon reasonable request.
Conflicts of Interest
The authors declare no conflicts of interest.
References
- Alfieri, L.; Salamon, P.; Pappenberger, F.; Wetterhall, F.; Thielen, J. Operational Early Warning Systems for Water-Related Hazards in Europe. Environ. Sci. Policy 2012, 21, 35–49. [Google Scholar] [CrossRef]
- Baltas, E. Impact on Water Resources in a Mountainous Basin under the Climate Change Transient Scenario (UKTR). AJCC 2014, 3, 118–128. [Google Scholar] [CrossRef][Green Version]
- Kourtis, I.M.; Tsihrintzis, V.A. Update of Intensity-Duration-Frequency (IDF) Curves under Climate Change: A Review. Water Suppl. 2022, 22, 4951–4974. [Google Scholar] [CrossRef]
- Kourtis, I.M.; Nalbantis, I.; Tsakiris, G.; Psiloglou, B.E.; Tsihrintzis, V.A. Updating IDF Curves under Climate Change: Impact on Rainfall-Induced Runoff in Urban Basins. Water Resour. Manag. 2023, 37, 2403–2428. [Google Scholar] [CrossRef]
- Diakakis, M.; Mavroulis, S.; Deligiannakis, G. Floods in Greece, a Statistical and Spatial Approach. Nat. Hazards 2012, 62, 485–500. [Google Scholar] [CrossRef]
- Diakakis, M.; Andreadakis, E.; Nikolopoulos, E.I.; Spyrou, N.I.; Gogou, M.E.; Deligiannakis, G.; Katsetsiadou, N.K.; Antoniadis, Z.; Melaki, M.; Georgakopoulos, A.; et al. An Integrated Approach of Ground and Aerial Observations in Flash Flood Disaster Investigations. The Case of the 2017 Mandra Flash Flood in Greece. Int. J. Disaster Risk Reduct. 2019, 33, 290–309. [Google Scholar] [CrossRef]
- Pereira, S.; Diakakis, M.; Deligiannakis, G.; Zêzere, J.L. Comparing Flood Mortality in Portugal and Greece (Western and Eastern Mediterranean). Int. J. Disaster Risk Reduct. 2017, 22, 147–157. [Google Scholar] [CrossRef]
- Feloni, E. Assessment of Flood Induced by Heavy Rainfall Using Advanced Methodologies, as a Premise for an Integrated Flood Early Warning System: The Case of Attica Region. Ph.D. Thesis, National Technical University of Athens, Zografou, Greece, 2019. [Google Scholar]
- Varlas, G.; Anagnostou, M.N.; Spyrou, C.; Papadopoulos, A.; Kalogiros, J.; Mentzafou, A.; Michaelides, S.; Baltas, E.; Karymbalis, E.; Katsafados, P. A Multi-Platform Hydrometeorological Analysis of the Flash Flood Event of 15 November 2017 in Attica, Greece. Remote Sens. 2019, 11, 45. [Google Scholar] [CrossRef]
- Spyrou, C.; Varlas, G.; Pappa, A.; Mentzafou, A.; Katsafados, P.; Papadopoulos, A.; Anagnostou, M.N.; Kalogiros, J. Implementation of a Nowcasting Hydrometeorological System for Studying Flash Flood Events: The Case of Mandra, Greece. Remote Sens. 2020, 12, 2784. [Google Scholar] [CrossRef]
- Anagnostou, M.N.; Kalogiros, J.; Nikolopoulos, E.; Derin, Y.; Anagnostou, E.N.; Borga, M. Satellite Rainfall Error Analysis with the Use of High-Resolution X-Band Dual-Polarization Radar Observations over the Italian Alps. In Perspectives on Atmospheric Sciences; Springer: Berlin/Heidelberg, Germany, 2017; pp. 279–286. [Google Scholar]
- Houze, R.A., Jr.; Rasmussen, K.L.; Zuluaga, M.D.; Brodzik, S.R. The Variable Nature of Convection in the Tropics and Subtropics: A Legacy of 16 Years of the Tropical Rainfall Measuring Mission Satellite. Rev. Geophys. 2015, 53, 994–1021. [Google Scholar] [CrossRef]
- Michaelides, S.; Levizzani, V.; Anagnostou, E.; Bauer, P.; Kasparis, T.; Lane, J.E. Precipitation: Measurement, Remote Sensing, Climatology and Modeling. Atmos. Res. 2009, 94, 512–533. [Google Scholar] [CrossRef]
- Price, K.; Purucker, S.T.; Kraemer, S.R.; Babendreier, J.E.; Knightes, C.D. Comparison of Radar and Gauge Precipitation Data in Watershed Models across Varying Spatial and Temporal Scales. Hydrol. Process. 2014, 28, 3505–3520. [Google Scholar] [CrossRef]
- Bournas, A.; Baltas, E. Comparative Analysis of Rain Gauge and Radar Precipitation Estimates towards Rainfall-Runoff Modelling in a Peri-Urban Basin in Attica, Greece. Hydrology 2021, 8, 29. [Google Scholar] [CrossRef]
- Sokol, Z.; Szturc, J.; Orellana-Alvear, J.; Popová, J.; Jurczyk, A.; Célleri, R. The Role of Weather Radar in Rainfall Estimation and Its Application in Meteorological and Hydrological Modelling—A Review. Remote Sens. 2021, 13, 351. [Google Scholar] [CrossRef]
- Berenguer, M.; Corral, C.; Sánchez-Diezma, R.; Sempere-Torres, D. Hydrological Validation of a Radar-Based Nowcasting Technique. J. Hydrometeor. 2005, 6, 532–549. [Google Scholar] [CrossRef][Green Version]
- Marshall, J.S.; Palmer, W.M.K. The Distribution of Raindrops with Size. J. Meteorol. 1948, 5, 165–166. [Google Scholar] [CrossRef]
- Bournas, A.; Baltas, E. Determination of the Z-R Relationship through Spatial Analysis of X-Band Weather Radar and Rain Gauge Data. Hydrology 2022, 9, 137. [Google Scholar] [CrossRef]
- Dixon, M.; Wiener, G. TITAN: Thunderstorm Identification, Tracking, Analysis, and Nowcasting—A Radar-Based Methodology. J. Atmos. Ocean. Technol. 1993, 10, 785–797. [Google Scholar] [CrossRef]
- Johnson, J.T.; MacKeen, P.L.; Witt, A.; Mitchell, E.D.W.; Stumpf, G.J.; Eilts, M.D.; Thomas, K.W. The Storm Cell Identification and Tracking Algorithm: An Enhanced WSR-88D Algorithm. Weather Forecast. 1998, 13, 263–276. [Google Scholar] [CrossRef]
- Ranganayakulu, S.V.; Subrahmanyam, K.V.; Niranjan, A. A Novel Algorithm for Convective Cell Identification and Tracking Based on Optical Character Recognition Neural Network. J. Electromagn. Waves Appl. 2021, 35, 2239–2255. [Google Scholar] [CrossRef]
- Hu, J.; Rosenfeld, D.; Zrnic, D.; Williams, E.; Zhang, P.; Snyder, J.C.; Ryzhkov, A.; Hashimshoni, E.; Zhang, R.; Weitz, R. Tracking and Characterization of Convective Cells through Their Maturation into Stratiform Storm Elements Using Polarimetric Radar and Lightning Detection. Atmos. Res. 2019, 226, 192–207. [Google Scholar] [CrossRef]
- Muñoz Lopez, C.; Wang, L.; Willems, P. Enhanced Object-Based Tracking Algorithm for Convective Rain Storm and Cells. Atmos. Res. 2018, 201, 144–158. [Google Scholar] [CrossRef]
- Hou, J.; Wang, P. Storm Tracking via Tree Structure Representation of Radar Data. J. Atmos. Ocean. Technol. 2017, 34, 729–747. [Google Scholar] [CrossRef]
- Han, L.; Fu, S.; Zhao, L.; Zheng, Y.; Wang, H.; Lin, Y. 3D Convective Storm Identification, Tracking, and Forecasting—An Enhanced TITAN Algorithm. J. Atmos. Ocean. Technol. 2009, 26, 719–732. [Google Scholar] [CrossRef]
- Shah, S.; Notarpietro, R.; Branca, M. Storm Identification, Tracking and Forecasting Using High-Resolution Images of Short-Range X-Band Radar. Atmosphere 2015, 6, 579–606. [Google Scholar] [CrossRef]
- Wang, L.-P.; Ochoa-Rodríguez, S.; Van Assel, J.; Pina, R.D.; Pessemier, M.; Kroll, S.; Willems, P.; Onof, C. Enhancement of Radar Rainfall Estimates for Urban Hydrology through Optical Flow Temporal Interpolation and Bayesian Gauge-Based Adjustment. J. Hydrol. 2015, 531, 408–426. [Google Scholar] [CrossRef]
- Marrocu, M.; Massidda, L. Performance Comparison between Deep Learning and Optical Flow-Based Techniques for Nowcast Precipitation from Radar Images. Forecasting 2020, 2, 194–210. [Google Scholar] [CrossRef]
- Woo, W.; Wong, W. Operational Application of Optical Flow Techniques to Radar-Based Rainfall Nowcasting. Atmosphere 2017, 8, 48. [Google Scholar] [CrossRef]
- Zhu, J.; Dai, J. A Rain-Type Adaptive Optical Flow Method and Its Application in Tropical Cyclone Rainfall Nowcasting. Front. Earth Sci. 2022, 16, 248–264. [Google Scholar] [CrossRef]
- Jung, S.-H.; Lee, G. Radar-Based Cell Tracking with Fuzzy Logic Approach. Meteorol. Appl. 2015, 22, 716–730. [Google Scholar] [CrossRef]
- Lu, J.; Xue, S.; Zhang, X.; Zhang, S.; Lu, W. Neural Fuzzy Inference System-Based Weather Prediction Model and Its Precipitation Predicting Experiment. Atmosphere 2014, 5, 788–805. [Google Scholar] [CrossRef]
- Na, W.; Yoo, C. A Bias Correction Method for Rainfall Forecasts Using Backward Storm Tracking. Water 2018, 10, 1728. [Google Scholar] [CrossRef]
- Theochari, A.P.; Feloni, E.; Bournas, A.; Karpouzos, D.; Baltas, E. Multi-Criteria Decision Making and GIS Techniques in the Design of a Stream Gauging Network. World Rev. Sci. Technol. Sustain. Dev. 2019, 15, 358. [Google Scholar] [CrossRef]
- Theochari, A.-P.; Feloni, E.; Bournas, A.; Baltas, E. Hydrometeorological-Hydrometric Station Network Design Using Multicriteria Decision Analysis and GIS Techniques. Environ. Process. 2021, 8, 1099–1119. [Google Scholar] [CrossRef]
- Kalogiros, J.; Anagnostou, M.N.; Anagnostou, E.N.; Montopoli, M.; Picciotti, E.; Marzano, F.S. Correction of Polarimetric Radar Reflectivity Measurements and Rainfall Estimates for Apparent Vertical Profile in Stratiform Rain. J. Appl. Meteorol. Climatol. 2013, 52, 1170–1186. [Google Scholar] [CrossRef]
- Duff, I.S.; Koster, J. On Algorithms For Permuting Large Entries to the Diagonal of a Sparse Matrix. SIAM J. Matrix Anal. Appl. 2001, 22, 973–996. [Google Scholar] [CrossRef]
Disclaimer/Publisher’s Note: The statements, opinions and data contained in all publications are solely those of the individual author(s) and contributor(s) and not of MDPI and/or the editor(s). MDPI and/or the editor(s) disclaim responsibility for any injury to people or property resulting from any ideas, methods, instructions or products referred to in the content. |
© 2024 by the authors. Licensee MDPI, Basel, Switzerland. This article is an open access article distributed under the terms and conditions of the Creative Commons Attribution (CC BY) license (https://creativecommons.org/licenses/by/4.0/).