Article

Landscape Pattern Evolution and Driving Forces in the Downstream River of a Reservoir: A Case Study of the Lower Beijiang River in China

1
College of Water Conservancy and Civil Engineering, South China Agricultural University, Guangzhou 510642, China
2
Guangdong Engineering Laboratory of Estuarine Hydraulic, Guangdong Research Institute of Water Resources and Hydropower, Guangzhou 510635, China
3
State Key Laboratory of Hydroscience and Engineering, Tsinghua University, Beijing 100084, China
4
Southern Marine Science and Engineering Guangdong Laboratory (Zhuhai), School of Civil Engineering, Sun Yat-sen University, Zhuhai 519082, China
5
CCCC Second Harbor Engineering Co., Ltd., Wuhan 430040, China
6
Key Laboratory of Large-Span Bridge Construction Technology, Wuhan 430040, China
7
Research and Development Center of Transport Industry of Intelligent Manufacturing Technologies of Transport Infrastructure, Wuhan 430040, China
8
CCCC Highway Bridge National Engineering Research Centre Co., Ltd., Wuhan 430040, China
*
Author to whom correspondence should be addressed.
Water 2024, 16(20), 2875; https://doi.org/10.3390/w16202875
Submission received: 9 September 2024 / Revised: 7 October 2024 / Accepted: 9 October 2024 / Published: 10 October 2024

Abstract

:
Human activities, such as reservoir construction and riverbed sand extraction, significantly influence the hydrological and sedimentary dynamics of natural rivers, thereby directly or indirectly affecting river landscape pattern distribution. This study primarily focused on the lower Beijiang River (LBR) in China, an area characterized by intensive human activity. River landscape patterns were studied using historical topographical data and time-series Landsat remote sensing images. Natural and anthropogenic factors were considered to explore the driving forces behind the evolution of landscape patterns. The results indicated that the topography of the LBR underwent significant downcutting from 1998 to 2020. The average elevation of the study area decreased by 3.6 m, and the minimum thalweg elevation decreased by 6.7 m. Over the past 30 years, the local vegetation showed a relatively stable spatial distribution, whereas the area of sand remained relatively stable before 2012, followed by a sudden decline, and tended to stabilize in the last decade. The water area exhibited a gradually increasing trend. The transition maps indicated that the spatial changes in sand were the most significant, with only 39.6% of the sand remaining unchanged from 1998 to 2009 and 32.3% from 2009 to 2020. The corresponding landscape patterns showed that the fragmentation degree of sand increased, with the mean patch size decreasing by 69.2%. The aggregation of water intensified, as its aggregation index increased from 93.31% to 95.41%, while the aggregation of vegetation remained relatively minor, ranging from 89.52% to 90.12%. The annual average temperature, annual average maximum temperature, and annual rainfall days had the strongest correlations with the vegetation landscape pattern indices. Additionally, human activities may have been the primary driver of the landscape pattern evolution of water and sand. The findings of this study have positive implications for the maintenance of the diversity and stability of river ecosystems.

1. Introduction

The migration direction and rate of river channels are significantly influenced by human activities, especially the construction of reservoirs [1]. Over the past half century, more than 50,000 reservoirs have been built throughout the Yangtze River watershed alone [2]. The construction of reservoirs has particularly altered the original hydrological and sedimentary conditions of rivers, resulting in scouring and water level adjustments in the downstream channel of the reservoir [3,4,5]. The changes in the spatial configurations of water and sediment conditions would significantly affect the development of river landscape patterns [6,7].
Landscape patterns refer to the spatial distribution and arrangement of landscape patches that differ in type, quantity, shape, and attributes [8,9] and are a manifestation of landscape heterogeneity [10]. Landscape pattern evolution is a complex and dynamic process involving mutual interference and interactions between human socioeconomic activities and the regional environment [11,12,13]. This typically means that the structure and function of a landscape changes over time under the influence of external interference and succession [14]. Numerous studies have been conducted on landscape pattern changes in areas such as rivers, wetlands, forests, and cities [15,16,17,18].
Previous research has shown that changes in land-cover types are generally regarded as the foundation for studying landscape pattern evolution, and the mutual transformation characteristics of different land-cover types are often reflected in land-use transfer matrices [19,20,21]. Considering the substantial labor and material resource costs associated with large-scale field surveys, remote sensing (RS) and geographic information system (GIS) technologies have been widely applied in recent decades to interpret different land-cover types and calculate quantitative indicators [8,22]. Zhu et al. [18] analyzed changes in the distribution pattern of aquatic vegetation communities in Poyang Lake over the past 20 years using time-series Landsat RS images and revealed the relationship between vegetation areas and hydrological factors. Liang and Li [23] used Landsat images to extract landscape information about Nansi Lake in 1985, 2000, and 2015 and studied the spatiotemporal changes in lake landscape patterns in the vertical and horizontal directions. You et al. [9] utilized five Landsat TM RS images from 2000, 2005, 2010, 2015, and 2020 to quantitatively describe the spatiotemporal evolution patterns of land use in the Huaihe River Ecological and Economic Zone and found that a large amount of local arable land had been converted into construction land.
Analysis of the driving forces behind landscape pattern changes is also a core topic in landscape ecology research [15,21,24,25]. Previous studies have identified that human activities, along with climatic factors such as temperature and precipitation, are key driving forces for changes in landscape patterns [26]. Aguiar et al. [27] compared the differences in downstream riverscapes before and after the construction of hydropower dams. They found that riparian patches encroach into the river channel, covering a larger area and exhibiting greater size, but with less complex shapes and smaller edges in the post-dam period. Lupinacci et al. [28] mapped land-use and geomorphological changes in the lower reaches of the Piracicaba River before and after the construction of the Barra Bonita Reservoir. They found that the area of the river terraces decreased due to the construction of the reservoir, and the most significant land-use change was the expansion of sugarcane cultivation, increasing from 4% to 39%. Guo et al. [25] found that the landscape pattern evolution of the Dongting Lake wetland was influenced by natural factors (temperature, precipitation, and evapotranspiration) and by social factors (reservoir construction and farmland cultivation). They found that the construction of the Three Gorges Dam significantly altered wetland landscape dynamics by impacting the water level in the lake area. Lu et al. [29] proposed that from 1990 to 2020, farmland cultivation, aquaculture activities, urban expansion, and reservoir construction resulted in the loss of nearly 70% of natural wetlands in the middle and lower reaches of the Yangtze River Basin, whereas 47.8% of the natural wetlands exhibited a pronounced trend towards increased aridity, posing a serious threat to local landscape patterns.
This study aimed to (1) propose a reasonable method for dividing the river into vegetation, sand, and water; (2) reveal the changes in riverbed morphology and river landscape patterns of the lower Beijiang River (LBR) over the past 30 years; and (3) explore the potential driving forces behind landscape pattern evolution in the LBR. Studying the dynamic changes and driving factors of river landscape patterns is beneficial for the protection, restoration, planning, and management of river landscapes, as well as an important guarantee for building regional ecological security patterns.

2. Study Region

The Beijiang River is the second largest tributary of the Pearl River Basin, located in the northern part of Guangdong Province between 111°52′ to 114°41′ east longitude and 23°10′ to 25°25′ north latitude. The main stream of the Beijiang River covers a length of 468 km (458 km within Guangdong Province). The basin area is 46,710 km2 (42,930 km2 within Guangdong Province) with a total drop of 305 m and an average channel slope of 0.26‰. The LBR, from the Feilaixia Water Conservancy Complex (FWCC) to Sanshui, stretches over 98 km, with an average slope of 0.0815‰. The Qingyuan Water Conservancy Complex (QWCC) is located approximately 46 km downstream of the FWCC. The LBR is characterized by a wide river plain with levees along the banks, sandy shoals, and islands scattered throughout, resembling a pattern of alternating wide and narrow lotus roots [30,31].
Since the completion of the FWCC in 1999 and the QWCC in 2012, some shallow shoals in the upstream reservoir area have been submerged, leading to a concentration of shallow shoals in the Shijiao–Sanshui river section. Therefore, this study primarily focuses on the downstream section of the Beijiang River, specifically the approximately 52 km stretch of the Shijiao–Sanshui river section, to analyze the landscape patterns of different land-cover types in this region. Figure 1c displays a standard false-color composite image of the study area from 22 December 1998, where vegetation is represented in red, sandy areas in white, mudflats in brown, and water bodies in blue.
There are five hydrological stations in the study area: Shijiao, Datang, Lubao, Huangtang, and Sanshui, among which Shijiao Station is the key control station for the LBR, with an average flow rate of 1307 m3/s [32]. The multi-year average suspended sediment load at the Shijiao Station is 525 million tons per year. However, this value has decreased to 464 million tons per year over the last decade [30]. The landscape pattern of the LBR has undergone significant changes due to the combined effects of reduced sediment inflow and human activities, mainly sand mining and channel dredging.

3. Methods and Data Sources

A study on river channel topographic changes was conducted using a combination of GIS spatial analysis and mathematical statistics. The measured river topographic data in 1998, 2012, and 2020 were collected from the Department of Water Resources of Guangdong Province, and the scale of the data is 1:5000. River channel topographic data from different periods were registered and unified using the same geographical and projection coordinate systems. An irregular triangular mesh and the Kriging interpolation method were employed to convert scattered measured topographic points into 30 m resolution raster data (the same as Landsat images). The Kriging interpolation method is a sophisticated geostatistical technique used for interpolation, particularly in spatial data analysis [33]. It utilizes the statistical properties of spatial correlation to predict unobserved positions based on known values of nearby locations. The main limitations of the Kriging interpolation method include local estimation and smooth processing. The former inadequately considers the overall spatial correlation of the estimates, ensuring local optima but not overall optima. The latter smooths the discreteness of real observed data, potentially obscuring meaningful anomalies. Digital elevation models (DEMs) for different periods were established and used as foundational data to study the changes in river topography and landscape patterns.
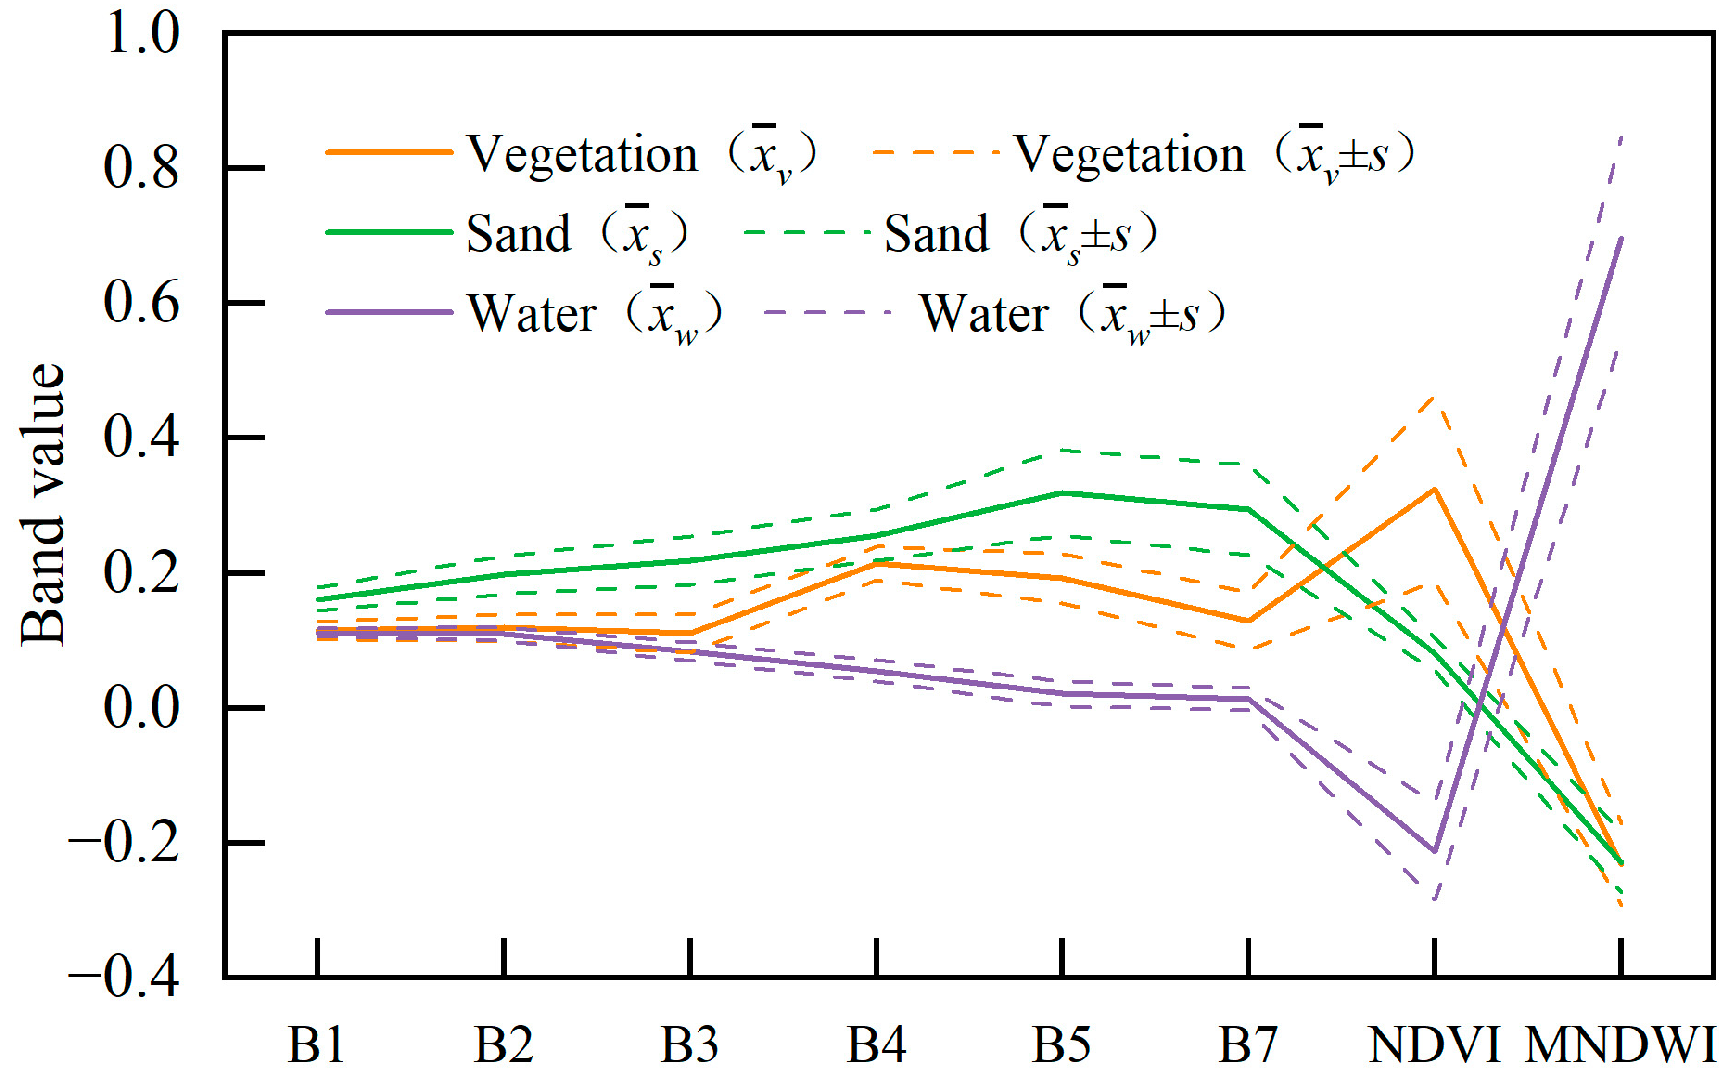
Spectral reflectance curves are essential for interpreting different land-cover types from RS images. Using the Landsat image from 22 December 1998 as an example, Figure 2 displays the average spectral reflectance curves of different land-cover types in the image. Bands B1–B5 and B7 represent the blue, green, red, near-infrared, shortwave infrared 1, and shortwave infrared 2 bands, and their values indicate the actual surface reflectance. For increased differentiation of the spectral curves of different land-cover types, additional bands B8 and B9 were included: the normalized difference vegetation index (NDVI) and modified normalized difference water index (MNDWI) [34,35], both unitless. Water bodies exhibit strong absorption in the near-infrared band, evident as B4 < B3 and NDVI < 0, and the MNDWI typically has a large positive value, facilitating the differentiation of water bodies from other land-cover types. Conversely, vegetation typically reflects strongly in the near-infrared band; however, due to the strong absorption characteristics of chlorophyll, its reflectance is lower in the red band. Therefore, healthy vegetation shows significant differences in reflectance between the B4 and B3 bands, enabling the effective differentiation of vegetation from sandy areas, where NDVI values typically range from 0 to 0.2.
This study utilized a support vector machine classifier for supervised classification to categorize land-cover types in the study area [36,37]. Errors in supervised classification may arise from biased training samples, class overlap, irrelevant features, data quality issues, and algorithm sensitivity. Therefore, selection of appropriate features and algorithms, rigorous preprocessing, and model evaluation are necessary for enhancing the reliability and accuracy of classification results. Field observations and manual interpretations were combined with Google Earth imagery to discern the land-cover types. The training samples were divided into three categories: vegetation, sandy areas, and water bodies. ENVI 5.3 software was used to calculate the separability indices for the samples, with an index exceeding 1.9 indicating good separability. In total, 600 validation sample points were selected (200 for each type). Plenty of previous studies have used tens to hundreds of validation points [36,37]. Therefore, 200 validation points could be sufficient in some cases, especially when the number of classes is small and the differences between classes are significant. The classification accuracy was calculated by constructing a confusion matrix for the validation samples. The results indicated an overall classification accuracy of 94.0%, demonstrating its adequacy for the research requirements.
In this study, actual topographic data of the Beijiang River in 1998, 2010, and 2020, and series data on average flow, water level, sediment concentration, and sediment load at Shijiao Station from 1991 to 2020, were collected. In addition, Landsat series RS images of the study area, ranging from 1991 to 2023, were acquired at a spatial resolution of 30 m. A spatial resolution of 30 m may result in the loss of certain detailed information, subsequently failing to capture finer-scale changes and affecting the accuracy of the classification results. This is particularly evident when distinguishing between different types of vegetation, soil types, or artificial structures. When utilizing Landsat imagery for temporal studies, it is important to consider potential issues related to temporal data consistency between different years. In this study, the acquisition dates were scheduled for the dry season (November or December) of each year to reduce the differences in spectral reflectance values caused by seasonal changes in vegetation and land cover. Remote sensing images with no clouds or minimal cloud coverage were selected to ensure that only reliable data were compared. Finally, atmospheric correction was utilized to eliminate the influence of atmospheric and lighting factors on ground reflection, which was crucial for ensuring temporal data consistency. Details of the RS images are presented in Table 1.

4. Results

4.1. Topographic Evolution

4.1.1. Spatial Distribution of Topography and Changes in Erosion and Deposition

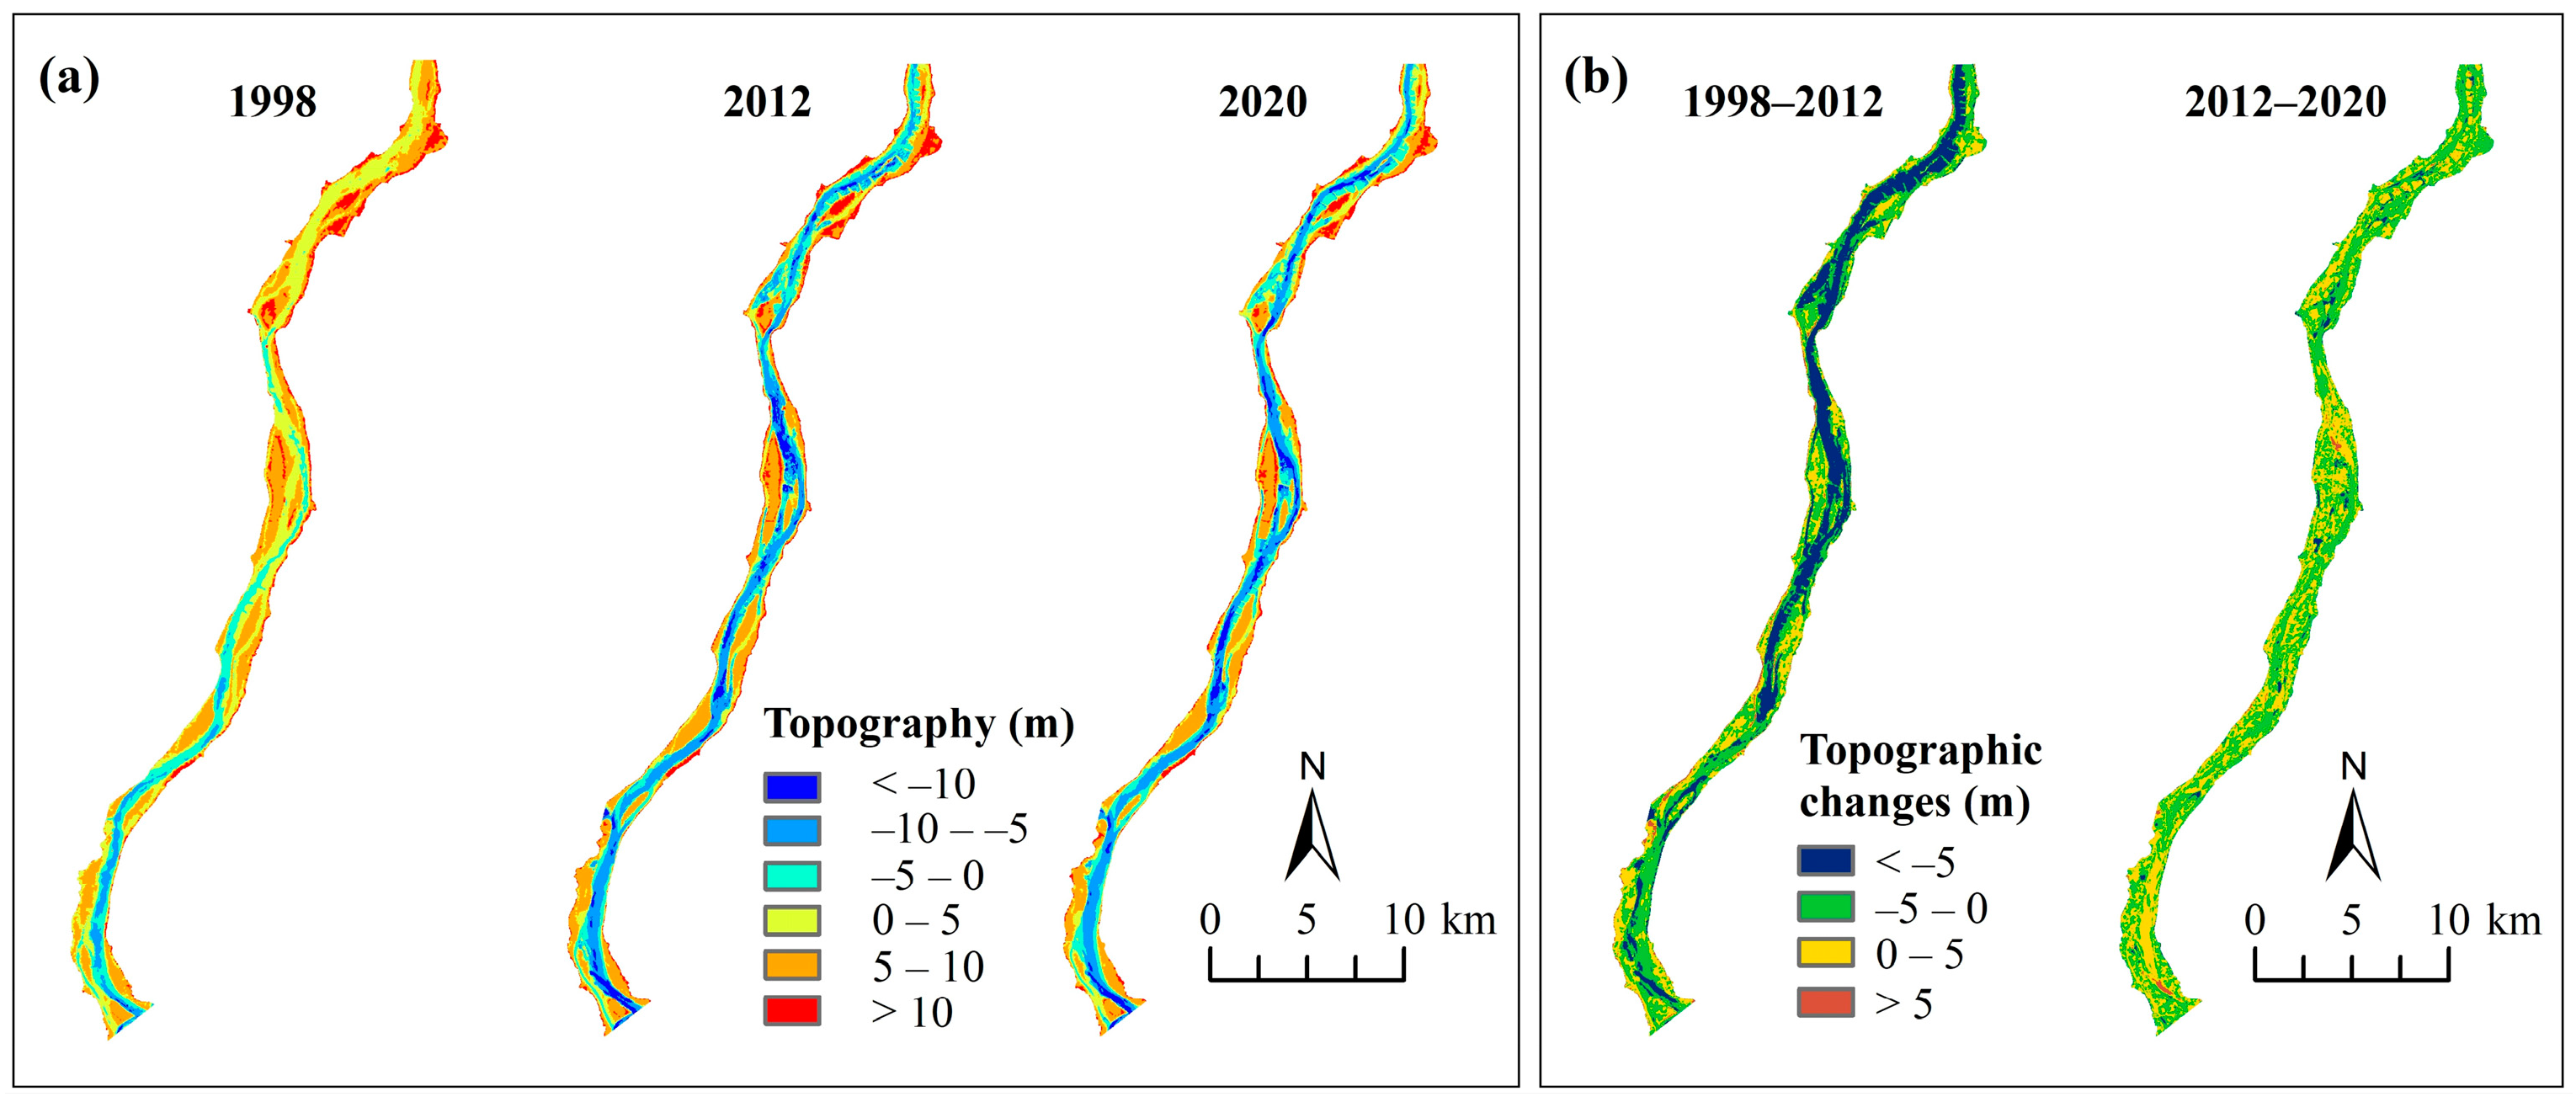
Figure 3a presents the DEM models for the Shijiao–Sanshui river section of the LBR for 1998, 2012, and 2020. The average elevation of the study area was 4.2 m in 1998. In the upstream Shijiao–Datang section, the main channel elevation ranged from 0 to 5 m, whereas the elevation of the river islands mainly exceeded 5 m. In the Datang–Huangtang section, the main channel elevation was mainly between −5 and 0 m, and the river islands were mostly between 5 and 10 m. In the Huangtang–Sanshui section, the main channel elevation ranged from −10 to 0 m, with river islands mostly between 5 and 10 m. In 2012 and 2020, the average elevations of the study area were 1.3 m and 0.6 m, respectively. The main channel elevation was primarily between −10 and 5 m, with localized areas below −10 m, whereas the river islands were mainly between 5 and 10 m.
Figure 3b shows the spatiotemporal distributions of sedimentation (positive value) and erosion (negative value) in different years. From the changes in river channel topography from 1998 to 2012, evident erosion was observed, with erosion depths in the Shijiao–Huangtang section generally exceeding 5 m and those in the Huangtang–Sanshui section mainly between 0 and 5 m. The elevations of the river islands varied within ±5 m. From 2012 to 2020, the overall river segment showed erosion and deposition, with changes primarily within ±5 m.

4.1.2. Changes in the Thalweg Line

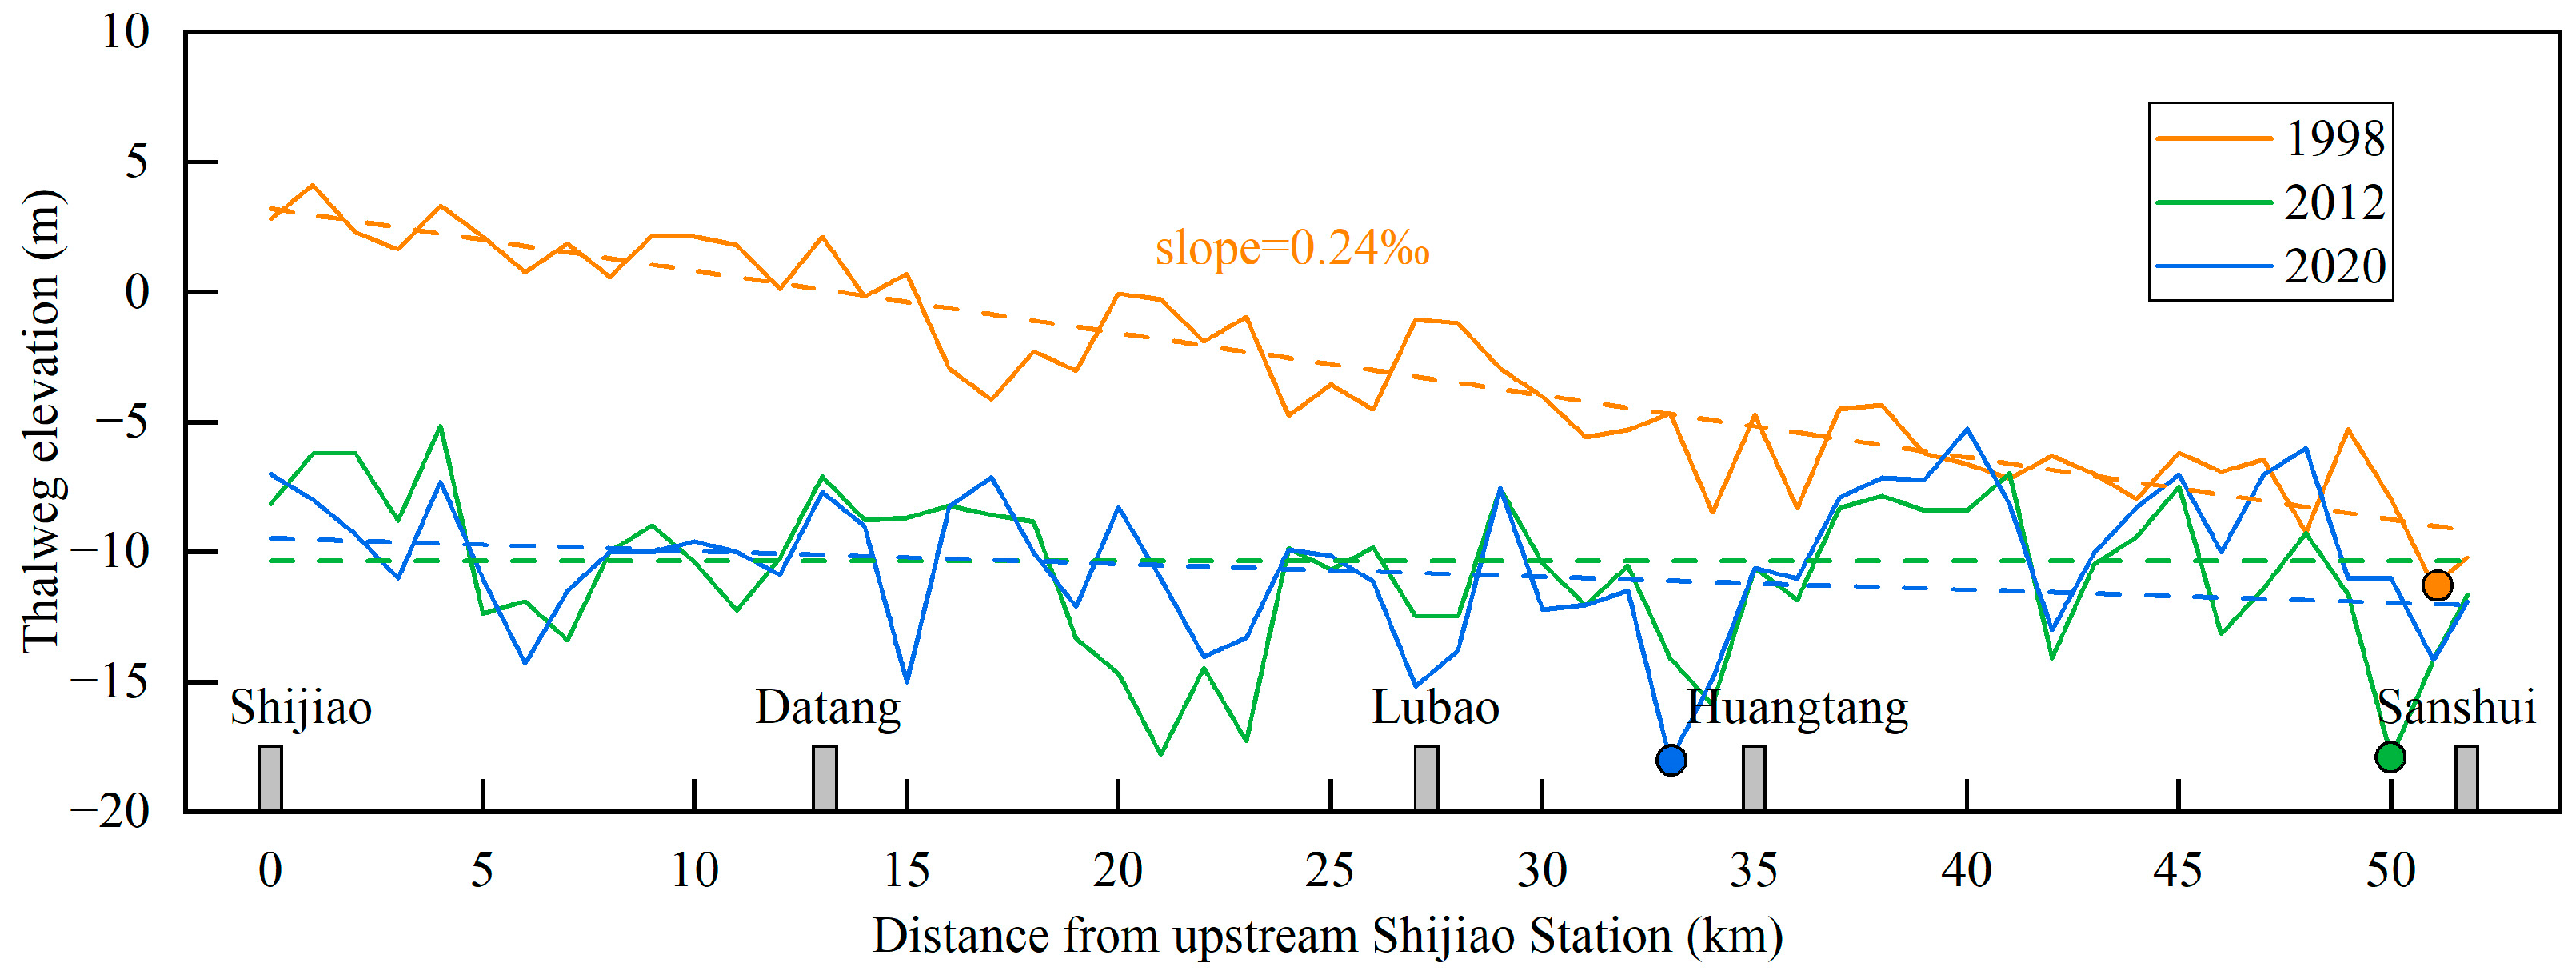
A total of 52 cross-sections were established at 1 km intervals along the study river segment to analyze the longitudinal changes in thalweg elevations (Figure 4). The thalweg elevation exhibited a clear downward trend from upstream to downstream in 1998, decreasing from 4 m at Shijiao to −10 m at Sanshui, with an average channel gradient of approximately 0.24‰. The minimum thalweg elevation was −11.3 m at 51 km downstream of Shijiao. In 2012 and 2020, there were no significant trends in thalweg elevations from upstream to downstream, with the minimum values being −17.9 m at 50 km downstream of Shijiao in 2012, and −18.0 m at 33 km downstream of Shijiao in 2020, respectively.
Analyzing the changes in thalweg elevations of the 52 cross-sections in the study river segment from 1998 to 2012, only one cross-section showed a slight increase, whereas the rest exhibited a decrease, with an average decrease of 7.8 m. The decrease in thalweg elevations gradually lessened from upstream to downstream, with average decreases of 11.4 m, 9.6 m, 7.1 m, and 3.6 m in the Shijiao–Datang, Datang–Lubao, Lubao–Huangtang, and Huangtang–Sanshui river sections, respectively. From 2012 to 2020, 28 cross-sections showed increases in thalweg elevation, whereas 25 exhibited decreases, with an average increase of 0.4 m. The changes in thalweg elevations were mostly within ±1.5 m across all river segments.

4.2. Area Variation in Different Land-Cover Types

Figure 5 shows the spatial distribution of land-cover types in the Shijiao–Sanshui section of the LBR from 1991 to 2023, demonstrating significant spatiotemporal differences. Taking sand as an example, from 1991 to 2001, sandy areas were distributed throughout river sections. From 2003 to 2010, there was a significant increase in the sandy areas near the entrance, whereas the distribution of sandy areas in the middle and lower river sections decreased. After 2013, the sandy areas near the entrance gradually gave way to vegetation, and the distribution of sandy areas in the middle and lower river sections further reduced.
Figure 6 presents the statistical results for the distribution areas of different land-cover types from 1991 to 2023. Considering the construction of the FWCC and QWCC on the main stem of the Beijiang River in 1999 and 2012, respectively, the study period was divided into three periods, 1991–1999, 2000–2012, and 2013–2023, and the respective averages were calculated. The average vegetation areas for 1991–1999, 2000–2012, and 2013–2023 were 28.02 km2, 26.08 km2, and 28.32 km2, respectively, with minor differences over the years, indicating a relatively stable spatial distribution of vegetation in this river section. Except for 2010, when the vegetation area dropped significantly below the average, it fluctuated around the mean in other years. For the area of sand, the average areas for 1991–1999 and 2000–2012 were 16.00 km2 and 15.55 km2, respectively, significantly higher than the 6.55 km2 recorded for 2013–2023. The sandy area showed slight fluctuations around the mean during 1991–1999, maintaining a relatively stable distribution. The inter-annual fluctuation of the sandy area increased significantly in 2000–2012, and the annual fluctuation of the sandy area was relatively small and consistently maintained at a low level in 2013–2023. The area of water exhibited a gradual increasing trend, with average areas for the three periods being 31.48 km2, 33.87 km2, and 40.63 km2.
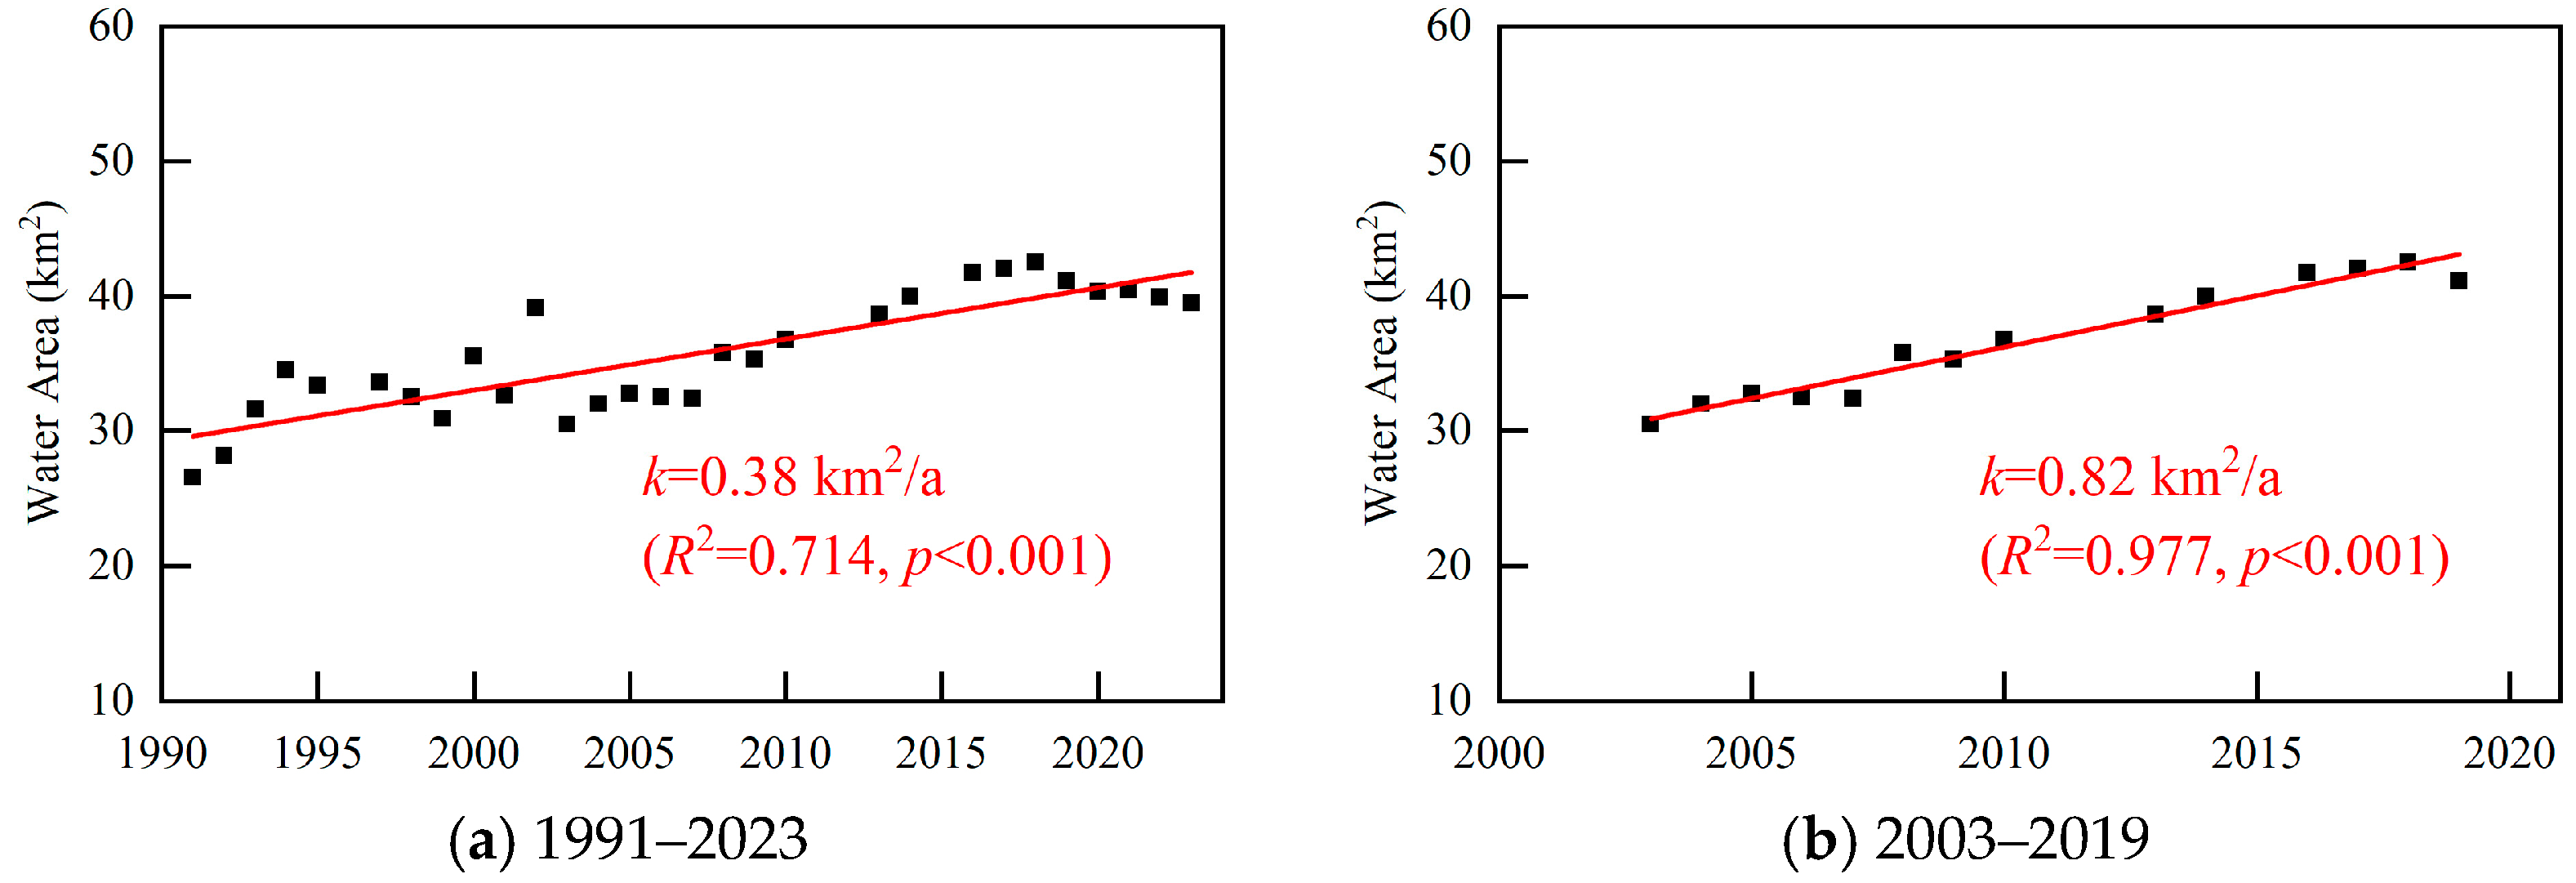
Considering that the area of water showed clear trends, linear regression models were utilized to further confirm the observed trends (Figure 7). From 1991 to 2023, the areas of water showed a decreasing trend every year, with a rate of 0.38 km2/a (R2 = 0.714, p < 0.001). From 2003 to 2019, there was a more significant linear increase in the water area. By fitting the data points with a linear function, the annual increasing rate of water area was determined to be 0.82 km2/year, and the increasing trend was significant (R2 = 0.977, p < 0.001).
The study area was divided into four river sections based on the location of hydrological stations, labeled as I, II, III, and IV (Figure 1c), and the changes in land-cover areas for each segment are shown in Figure 8.
Region I comprises the Shijiao–Datang river section, with average vegetation areas for the periods 1991–1999, 2000–2012, and 2013–2023 being 5.71 km2, 5.15 km2, and 6.96 km2, respectively, indicating an increase in vegetation area over the past decade; the average sandy areas for the three periods were 5.38 km2, 7.25 km2, and 3.07 km2, respectively, showing a significant increasing–decreasing trend. The average water areas for the three periods were 8.43 km2, 7.10 km2, and 9.48 km2, displaying a decreasing–increasing trend opposite to the sandy area changes, where the original sandy areas were gradually replaced by vegetation and water. Region II covers the Datang–Lubao river section, where the vegetation area remained relatively stable, with average values ranging from 8.01 km2 to 8.44 km2. The sandy area gradually decreased from 4.49 km2 to 1.19 km2, whereas the water area increased from 7.59 km2 to 11.32 km2, indicating a transition from sand to water in the Datang–Lubao river section. Region III comprises the Lubao–Huangtang river section, where vegetation and water areas show increasing trends, whereas sandy areas display a decreasing trend. From 2013 to 2023, the average sandy area in this section was only 0.65 km2, with vegetated riverbanks and a sandy area of <6%. Region IV spans the Huangtang–Sanshui river section, with vegetation areas of 9.55 km2, 8.27 km2, and 8.58 km2 for the three periods, initially decreasing and then stabilizing. The proportion of sandy areas decreased gradually, from 3.58 km2 (14.7%) in 1991–1999 to 1.64 km2 (6.8%) in 2013–2023, whereas water body areas increased steadily. Overall, the data indicate a transition from vegetation and sand to water in the first two periods, while the vegetation area remained relatively stable in the Huangtang–Sanshui river section over the past decade, with a gradual replacement of sand by water.

4.3. Spatial Distribution Changes in Different Land-Cover Types

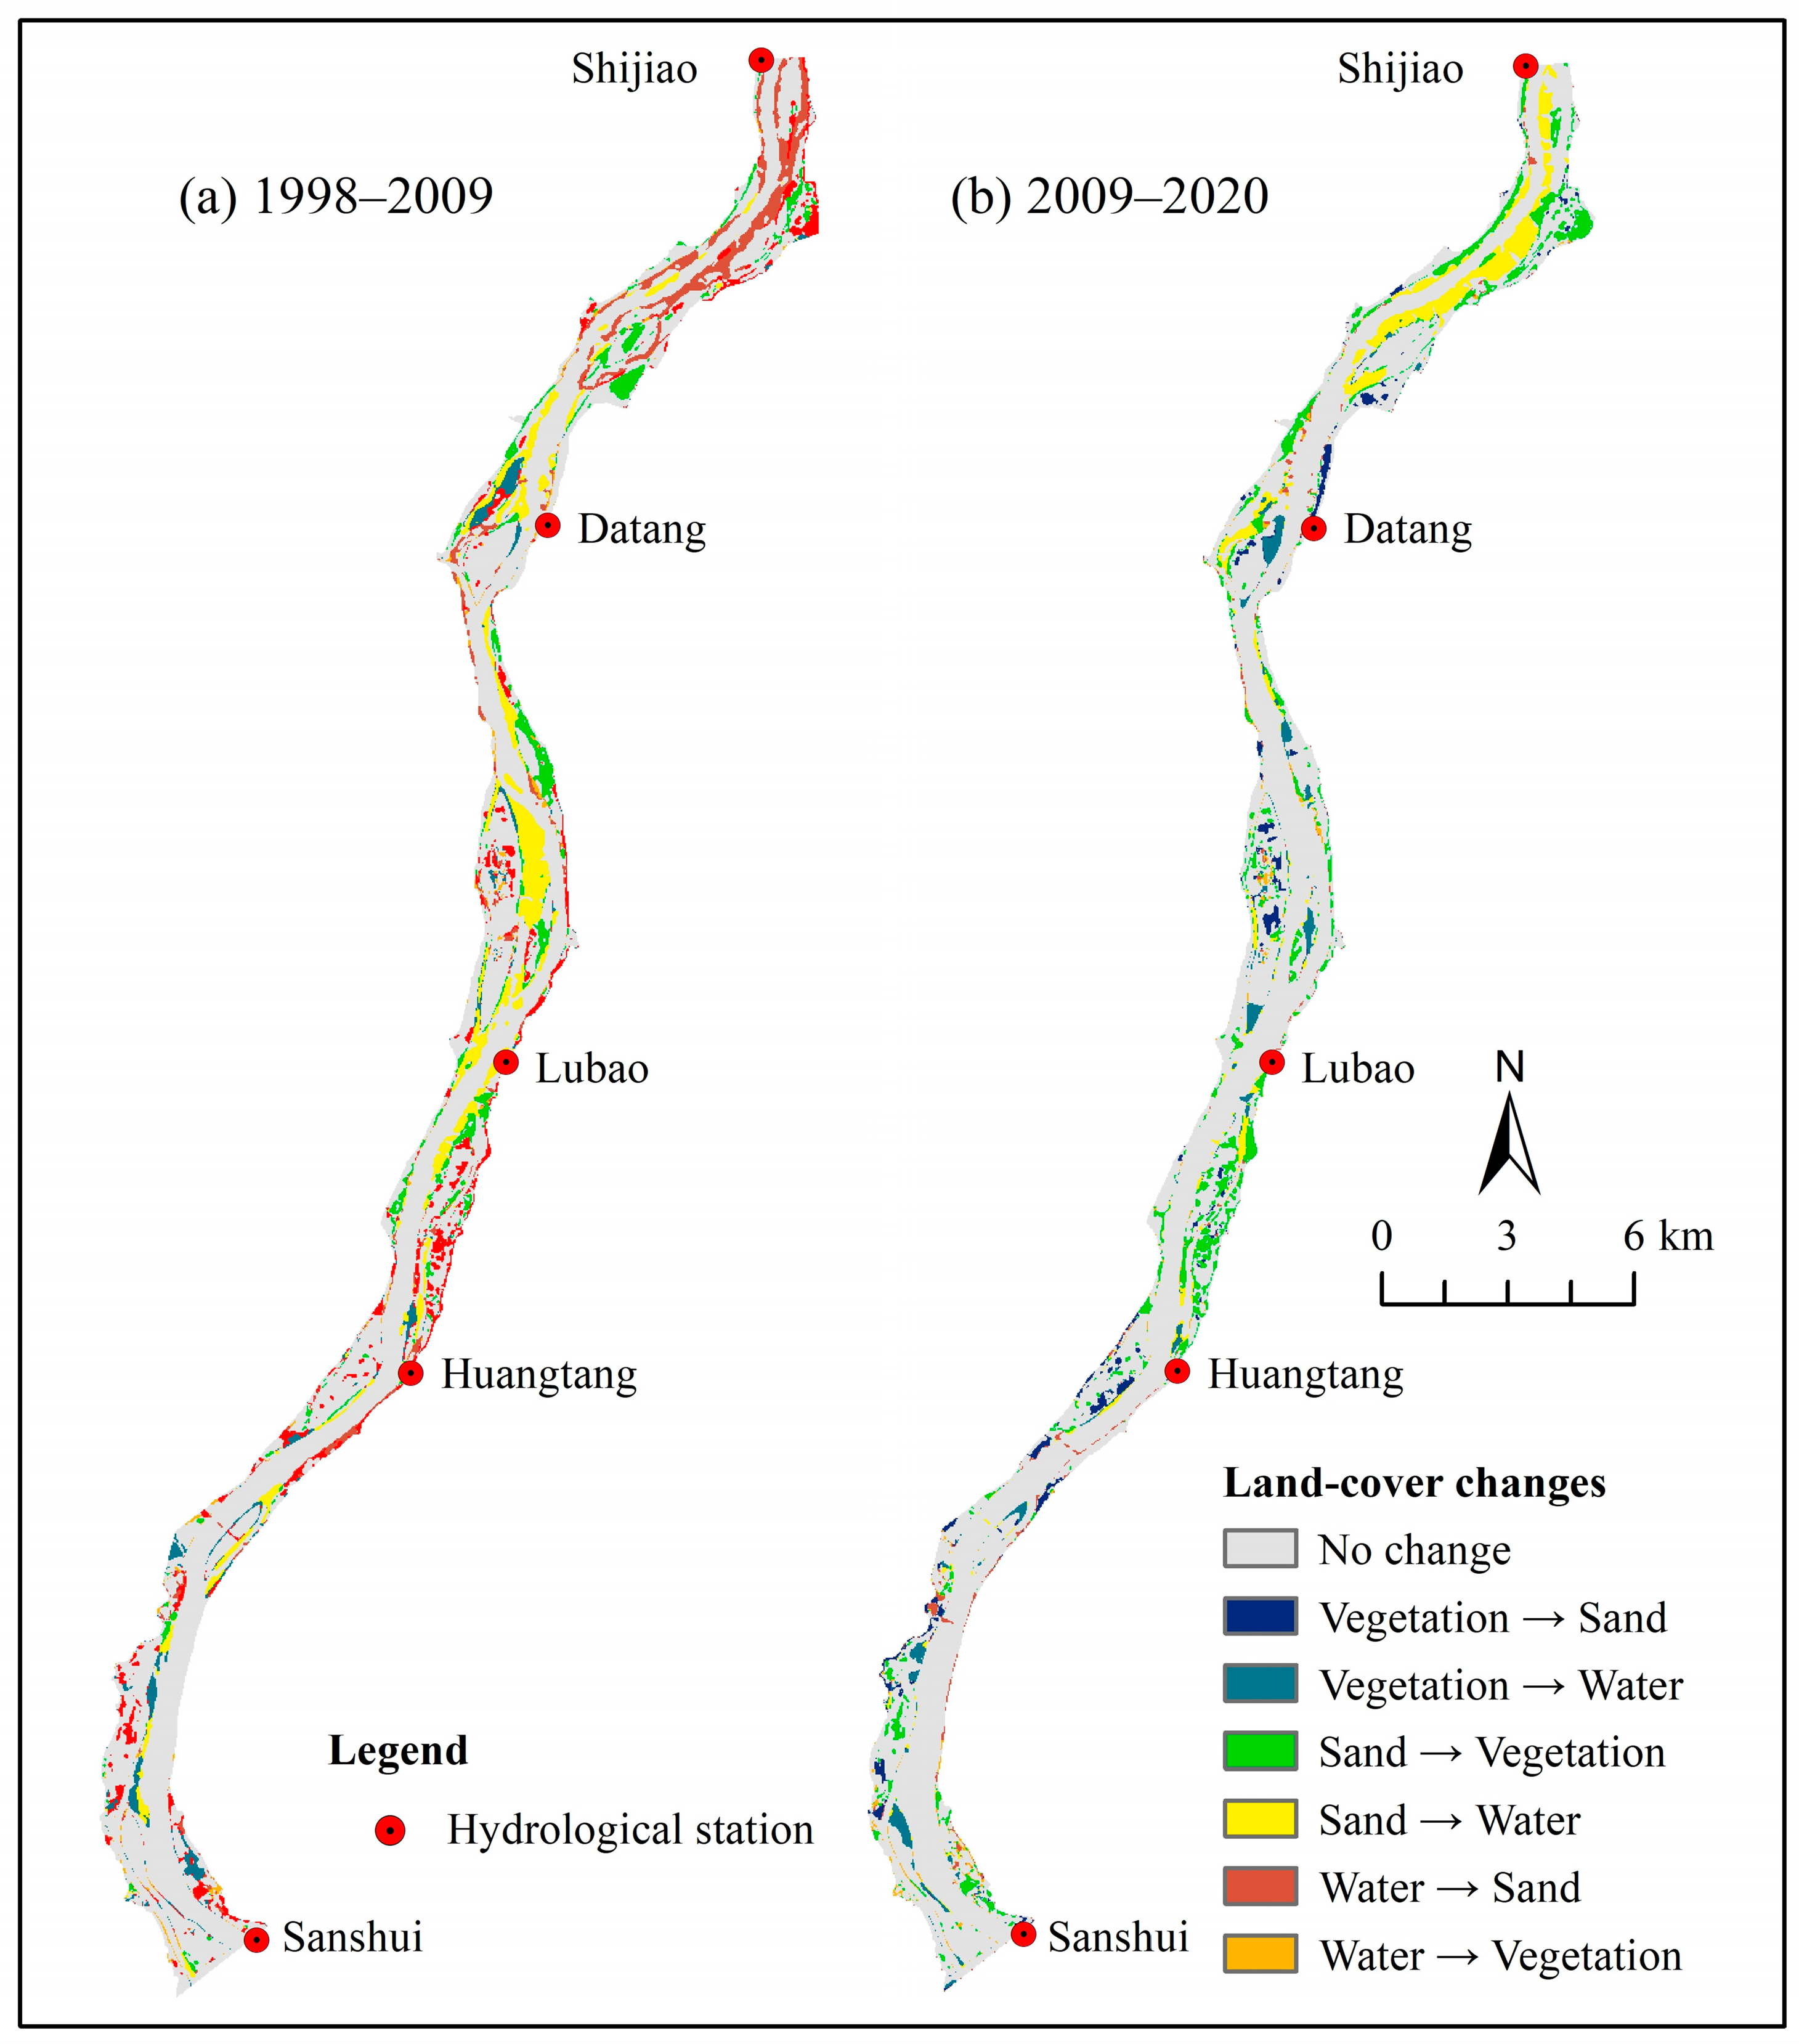
Figure 9 shows the spatial changes in the different land-cover types in the study region. Considering the construction of the mainstem hub projects, data from 1998 (before the construction of the FWCC), 2009 (before the construction of the QWCC), and 2020 (after the construction of the QWCC) were analyzed to understand the spatial transitions of different land-cover types. Between 1998 and 2009, significant changes were observed predominantly in the stretch above Huangtang Station. During this period, the Shijiao–Datang river section witnessed a transition from water to sand, whereas the main changes in the Datang–Huangtang river section were the transformation of sandy beaches into vegetation and water. From 2009 to 2020, the changes were mainly concentrated in the Shijiao–Datang and Lubao–Huangtang river sections, mainly manifested as the transformation of some sandy beaches into vegetation and water, whereas the land-cover changes in other areas were relatively scattered.
The land-cover transition matrices for 1998–2009 and 2009–2020 are presented in Table 2 and Table 3, respectively. In the land-cover transition matrices, the data in the column represent the area of each category in the earlier year, and the data in the row represent the area of each category in the latter year. For example, the value 27.17 in Table 2 means that the total area of vegetation in 1998 was 27.17 km2, while the value 24.37 means the total area of vegetation in 2009 was 24.37 km2. The decrease in vegetation area from 1998 to 2009 corresponds to the value −2.80 in Table 2. The land-cover transition matrices could quantitatively reveal the transition probabilities between different land-cover types, and comprehensively reflect the potential evolution direction of different types, which helps us to better understand the driving and influencing factors of landscape dynamics.
During the dry season from 1998 to 2009, there was an increase in sandy areas by 0.02 km2 and water areas by 2.78 km2, whereas vegetation area decreased by 2.80 km2. Approximately 73.1% (19.87 km2) of the original vegetation remained unchanged, with 5.04 km2 converting into sand and 2.26 km2 converting into water. Approximately 39.6% (6.27 km2) of the original sandy area remained unchanged, with 3.61 km2 converting to vegetation and 5.94 km2 converting to water. Approximately 83.3% (27.09 km2) of the original water remained unchanged, with 0.89 km2 converting to vegetation and 4.53 km2 converting to sand.
During the dry season from 2009 to 2020, the vegetation and water areas in the study region increased by 2.51 km2 and 5.04 km2, respectively, whereas the sandy area decreased by 7.55 km2. Within the region, approximately 82.1% (20.00 km2) of the vegetation cover remained unchanged, with 2.23 km2 converting to beaches and 2.14 km2 converting to water. The sandy beach area covering 32.3% (5.12 km2) of the study region remained stable, with 6.01 km2 converting to vegetation and 4.72 km2 converting to water. Approximately 94.8% (33.46 km2) of the original water remained unchanged, with 0.87 km2 converting to vegetation and 0.95 km2 converting to sand.
By registering this topography with RS images, the correspondence between land-cover types and elevation was established, and the average distribution elevation of different land-cover types was statistically analyzed (Figure 10). The average distribution elevations of vegetation in 1998, 2009, and 2020 were 7.26 m, 7.13 m, and 7.17 m, respectively, showing minimal overall change. The average distribution elevations of sand in the three years were 5.34 m, 4.10 m, and 6.08 m, indicating a trend of initially increasing and then decreasing for low-elevation sandy beaches. The average distribution elevations of water in the three years were 0.50 m, −4.97 m, and −4.97 m. Against the backdrop of no significant changes in water and sediment conditions in the LBR in recent years [30], the average distribution elevation of water decreased by 5.47 m from 1998 to 2009, suggesting significant channel downcutting in the water area. From 2009 to 2020, there was no change in the average distribution elevation of the water, indicating that the riverbed in the water area generally remained stable.

4.4. Landscape Pattern Changes in Different Land-Cover Types

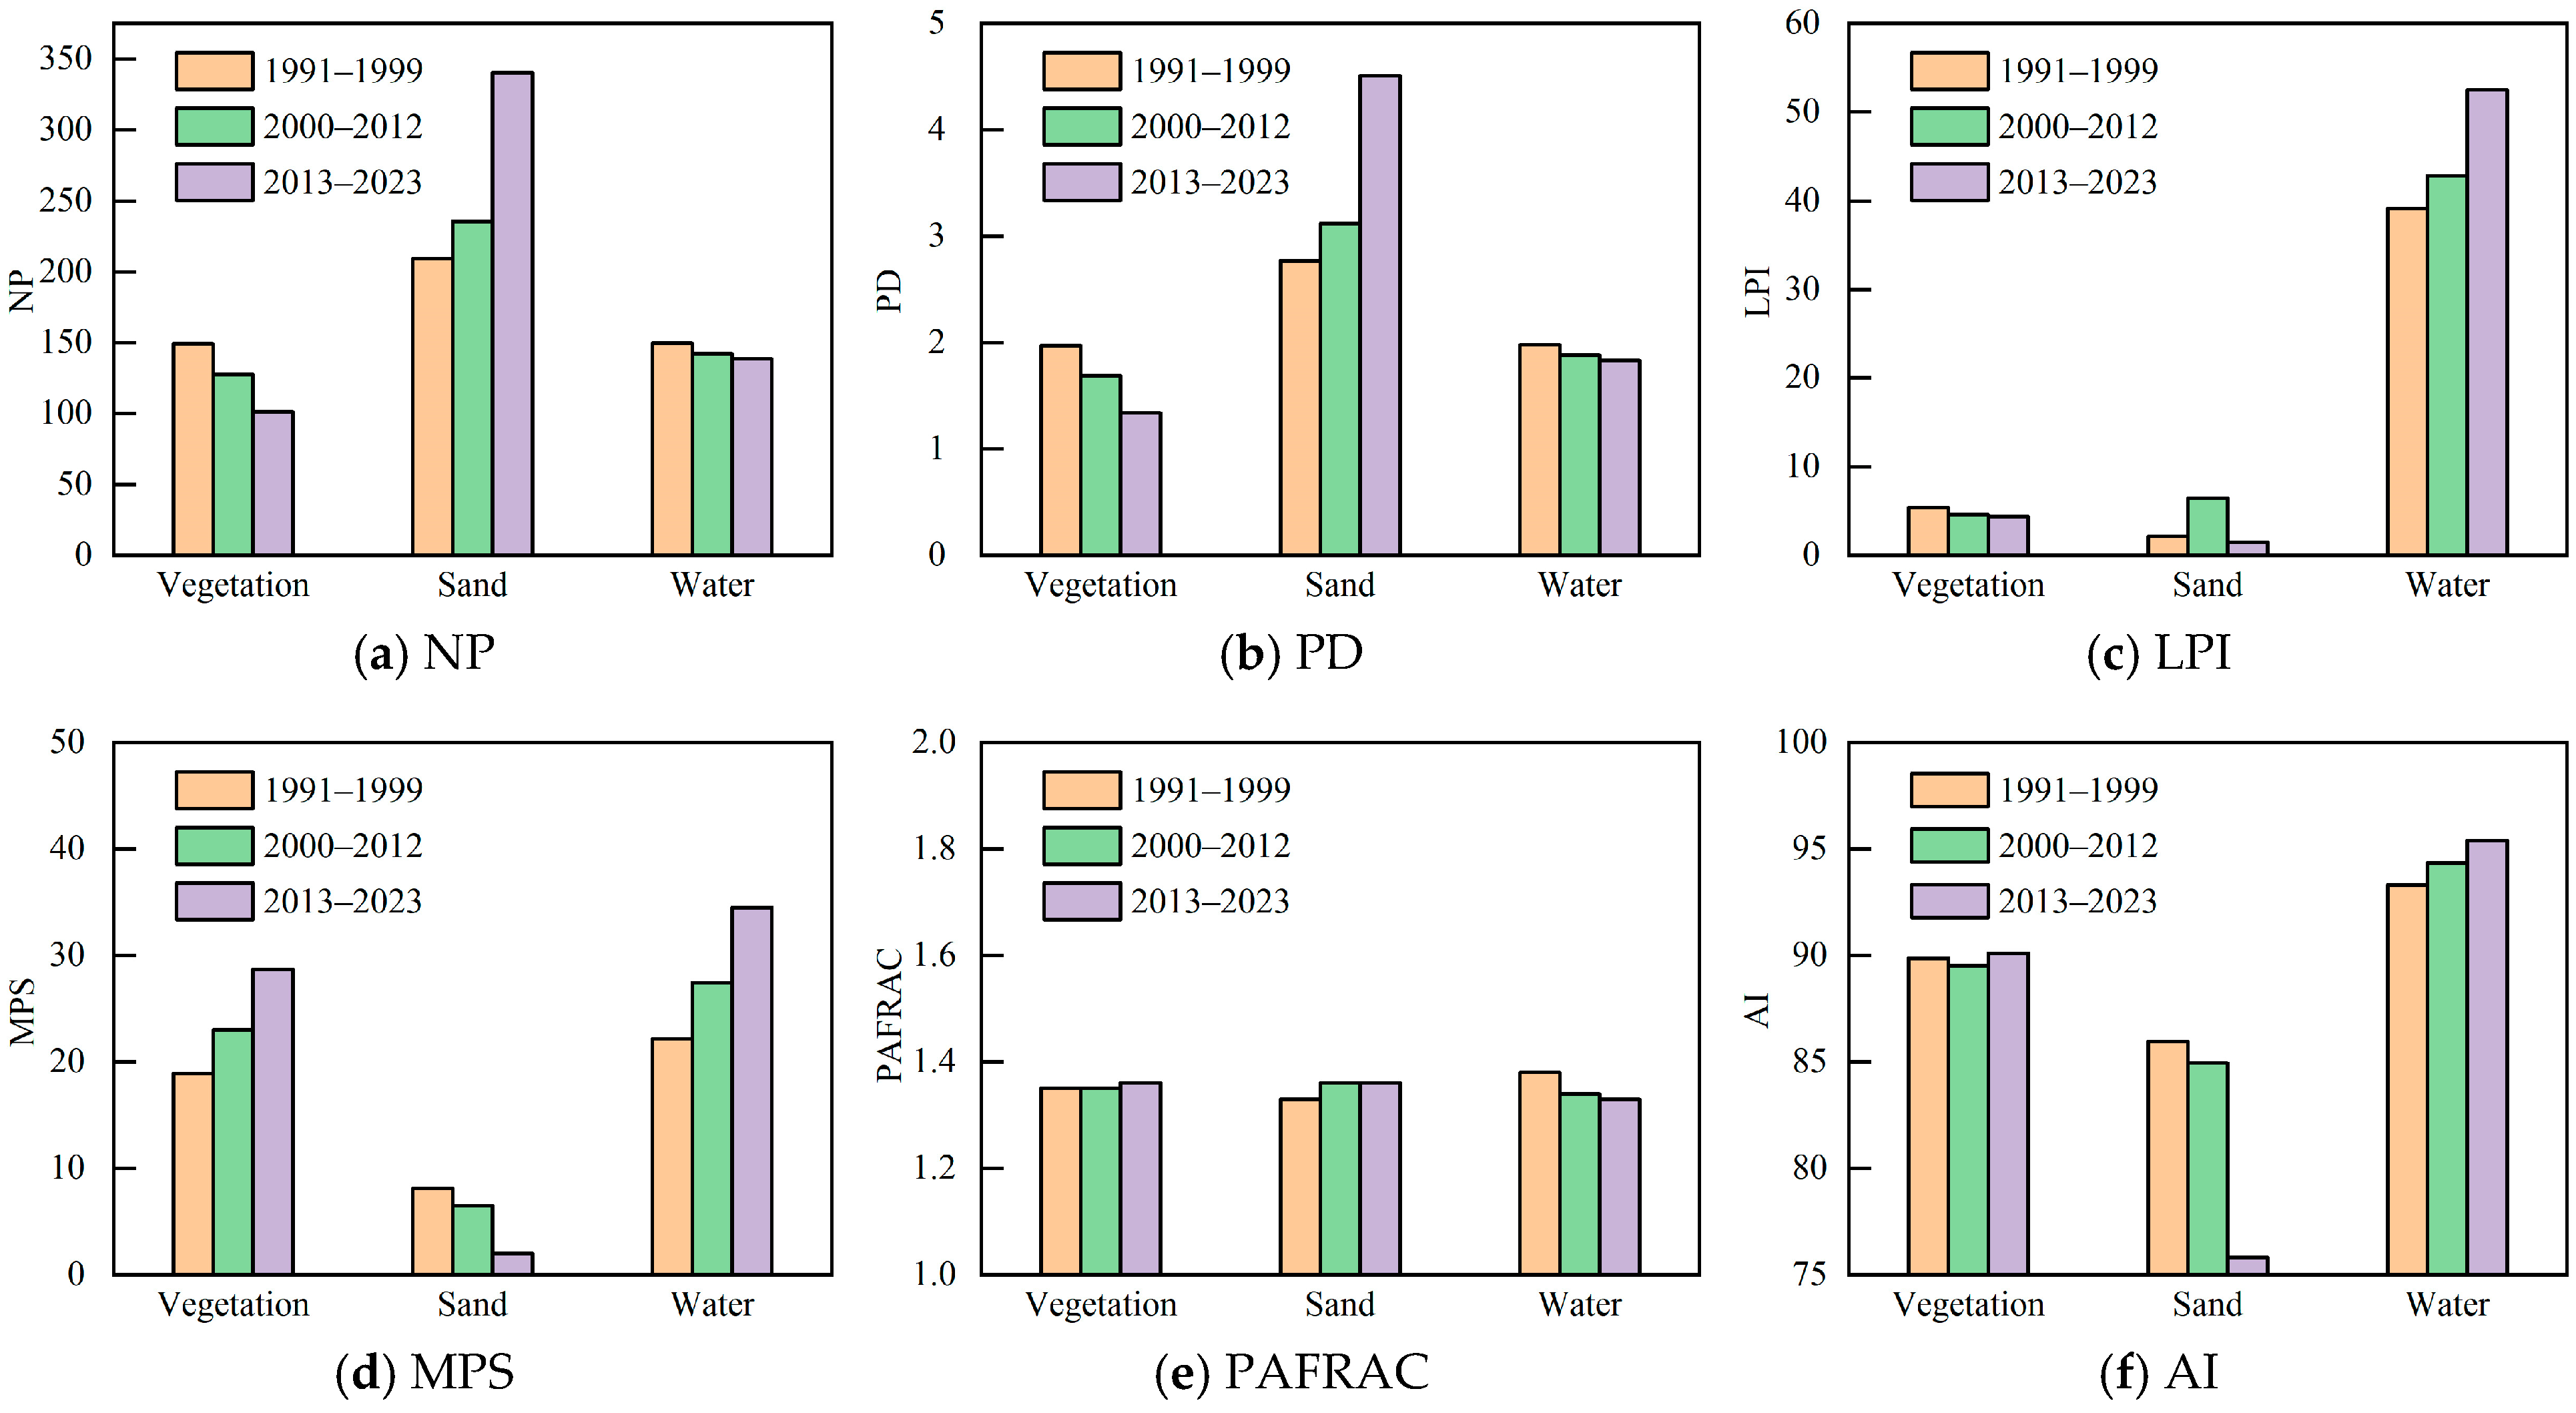
The landscape pattern index is a quantitative indicator that can condense landscape pattern information and reflect characteristics such as the structural composition and spatial configuration of different land-cover types [38]. Six landscape pattern indices were selected: number of patches (NP), patch density (PD), largest patch index (LPI), mean patch size (MPS), fractal dimension (PAFRAC), and aggregation index (AI) [37,39,40]. Details of each landscape index are available in Table 4, and the FRAGSTATS 4.2 software package was used to calculate the indices. The time series was divided into three periods, 1991–1999, 2000–2012, and 2013–2023, with intervals corresponding to the completion times of the FWCC in 1999 and the QWCC in 2012. Figure 11 shows the multi-year average values of the different indices, which were calculated to comprehensively reflect the changes in landscape patterns over the past 30 years.
The NP and PD indices describe the heterogeneity of the overall landscape. During different periods, the NP values of vegetation and water showed a decreasing trend, whereas the NP value of sand showed an increasing trend year by year, consistently higher than that of other land-cover types. The changes in PD values corresponded to those of NP values. However, considering the varying distribution areas of land-cover types, it is impossible to assess the heterogeneity and fragmentation of all land-cover types based solely on changes in NP and PD. The LPI reflects the dominance of different patches, and the LPI values of vegetation and sand were markedly lower than those of water, indicating the absolute dominance of water landscapes in the study area. The LPI values of water showed an increasing trend, highlighting the further dominance of water landscapes, whereas the dominance of sand showed an initial increase followed by a decrease. The changes in vegetation dominance were relatively small. The MPS index is commonly used to represent the degree of fragmentation in various landscape types. The MPS values of vegetation in the three periods were 18.89, 22.98, and 28.67, with increases of 21.7% and 24.8%, whereas the MPS values of water were 22.13, 27.48, and 34.51, with increases of 24.2% and 25.6%, indicating a decrease in the degree of fragmentation of vegetation and water landscapes. The MPS values of sand in the three periods were 8.13, 6.49, and 2.00, with decreases of 20.2% and 69.2%, showing that the sandy region had the highest and increasing degree of fragmentation among all land-cover types.
The PAFRAC index is often used to characterize the complexity of landscape shapes. In the three periods, the PAFRAC values of vegetation, water, and sand ranged from 1.35 to 1.36, 1.33 to 1.36, and 1.33 to 1.38, respectively. The small differences indicate a stable and similar complexity in the shape of patches for different land-cover types. The AI is often used to reflect the degree of connectivity and aggregation between landscape patches. When the land-cover type comprises several large patches, the AI is higher; conversely, when the land-cover type comprises many poorly connected small patches, the AI is lower. For different land-cover types, water had the highest AI values, followed by vegetation, with sand having the lowest, indicating that sandy beach was the most fragmented land-cover type in the study region, whereas the water region exhibited the highest level of connectivity between landscape patches. From 1991 to 2023, the AI values of vegetation ranged from 89.52 to 90.12, showing minimal variation. The AI values of sand ranged from 75.82 to 85.94, with a significant decrease after 2013, indicating a significant increase in the fragmentation of sandy beaches after 2013. The AI values of water increased steadily from 93.31 to 95.41, indicating a continuous increase in spatial aggregation.

5. Discussion

5.1. Landscape Changes Caused by Natural Factors

Gray relational analysis was used to study the impacts of natural factors on landscape pattern changes [9], including five hydrological sediment (X1X5) and five meteorological factors (X6X10). The hydrological sediment factors were obtained from the measured data at Shijiao Station, and the meteorological factors were obtained from the measured data from the nearest meteorological station (Qingyuan Meteorological Station).
Table 5 shows the correlations between various landscape indices and natural factors. The landscape pattern indices of vegetation and sand are closely related to the listed natural factors. For water, only the relational coefficient between PD and the annual average maximum temperature was >0.7. For the distribution areas of different land-cover types, the relational coefficients between the vegetation area and the annual average flow, annual average sediment load, annual average maximum temperature, and annual rainfall days were all >0.7. The relational coefficients between the sand area and annual average water level and annual rainfall days were >0.7.
The relational coefficients between various vegetation landscape pattern indices and hydrological sediment factors were between 0.56 and 0.75, with an average coefficient of 0.64, whereas the relational coefficients concerning meteorological factors were between 0.55 and 0.79, with an average coefficient of 0.67. The annual average temperature, annual average maximum temperature, and annual rainfall days had the highest correlation with the vegetation landscape pattern indices, indicating that these are the most important factors influencing the landscape pattern of the local vegetation. Temperature influences metabolic rates and phenology, affecting species interactions and community composition, while rainfall dictates water availability, which is crucial for plant health and ecosystem productivity. Variations in these factors would lead to changes in vegetation types, biodiversity, and ecosystem dynamics, ultimately reshaping vegetation landscape patterns. The relational coefficients between various sandy landscape pattern indices and hydrological sediment factors were between 0.47 and 0.78, with an average coefficient of 0.61, whereas the relational coefficients concerning meteorological factors were between 0.54 and 0.81, with an average correlation of 0.65. Annual rainfall days showed the highest correlation with the sandy landscape pattern indices. Variations in rainfall patterns may lead to changes in river discharge and sediment transport. Increased rainfall could enhance river discharge, inundating existing sandbars, and larger discharge usually indicates higher sediment transport capacity. This substantial sediment deposition could shape riverbanks and floodplains. Conversely, prolonged drought conditions will reduce river flow, causing previously submerged sand to become exposed.

5.2. Landscape Changes Caused by Human Activities

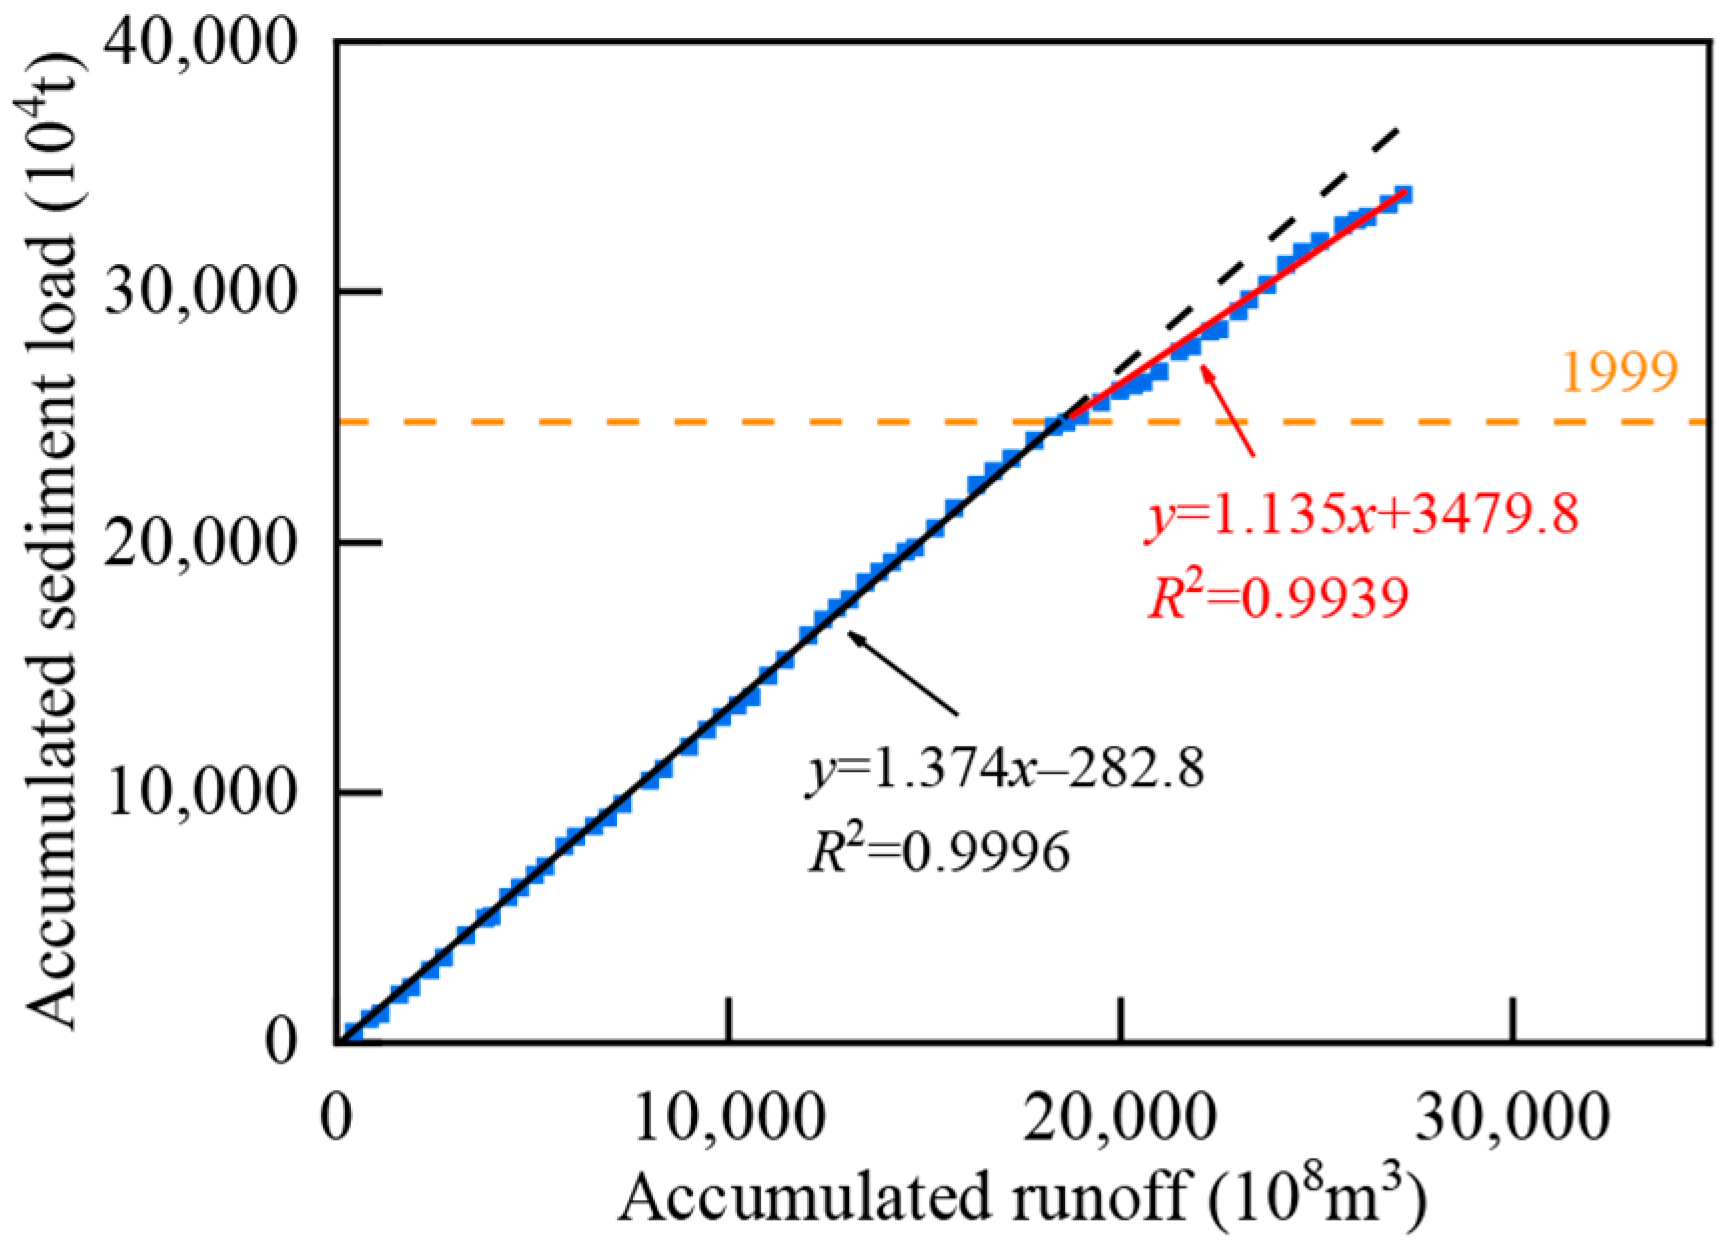
In recent years, human activities have had increasingly significant impacts on river evolution. The construction of cascade reservoirs, sand mining in river channels, and channel regulation are important factors affecting riverbed deformation. Since 1998, five cascade reservoirs have been constructed along the mainstream of the Beijiang River (Figure 1b), and numerous reservoirs and hydropower stations have been built on tributaries for flood control and power generation. Large-scale reservoirs inevitably affect sediment transport in river channels. Figure 12 shows the double cumulative relationship between annual runoff and sediment load at the Shijiao Station. The cumulative sediment load at Shijiao Station decreased significantly after 1999, indicating a noticeable reduction in annual sediment load.
By establishing linear regression equations for cumulative sediment load and runoff for the periods of 1954–1999 and 2000–2020, with the cumulative annual runoff of 27,626 × 108 m3 in 2020 substituted into the equation for 1954–1999, the calculated cumulative annual sediment load was 37,675 × 104 tons, whereas the measured cumulative sediment load was 34,582 × 104 tons, showing a decrease of 3093 × 104 tons (−8.2%). This indicates that the construction of cascade reservoirs is an important factor influencing the sediment transport in the Beijiang River. Changes in flow conditions result in sediment deposition in the reservoir area and a low-sediment-concentration flow downstream, exacerbating erosion laterally and vertically in the river channel below the dam [41]. Meanwhile, because of riverbed downcutting, the water level of the river decreased under the same inflow conditions, exposing the riverbed that was originally located underwater.
Sand mining in river channels is another significant factor affecting the evolution of the downstream Beijiang River channel. Large-scale sand mining significantly altered the natural evolution of riverbeds. Before 1975, the amount of sand mined in the Beijiang River was nearly negligible, and the riverbed in the downstream segment showed minor signs of sedimentation. However, sand mining operations expanded significantly after 1975. It is estimated that from 1999 to 2007, sand mining in the LBR reached 1.49 × 10⁸ m3, equivalent to nearly 300 years of natural sedimentation in the Beijiang levee section of the downstream Beijiang River [42]. Sand mining leads to riverbed downcutting and mined areas cannot be refilled naturally in the short term. Drastic changes in topography also alter the water flow velocity and direction. For river sections mainly controlled by artificial embankments, this energy is partially transformed into a scouring force, further intensifying riverbed scouring.
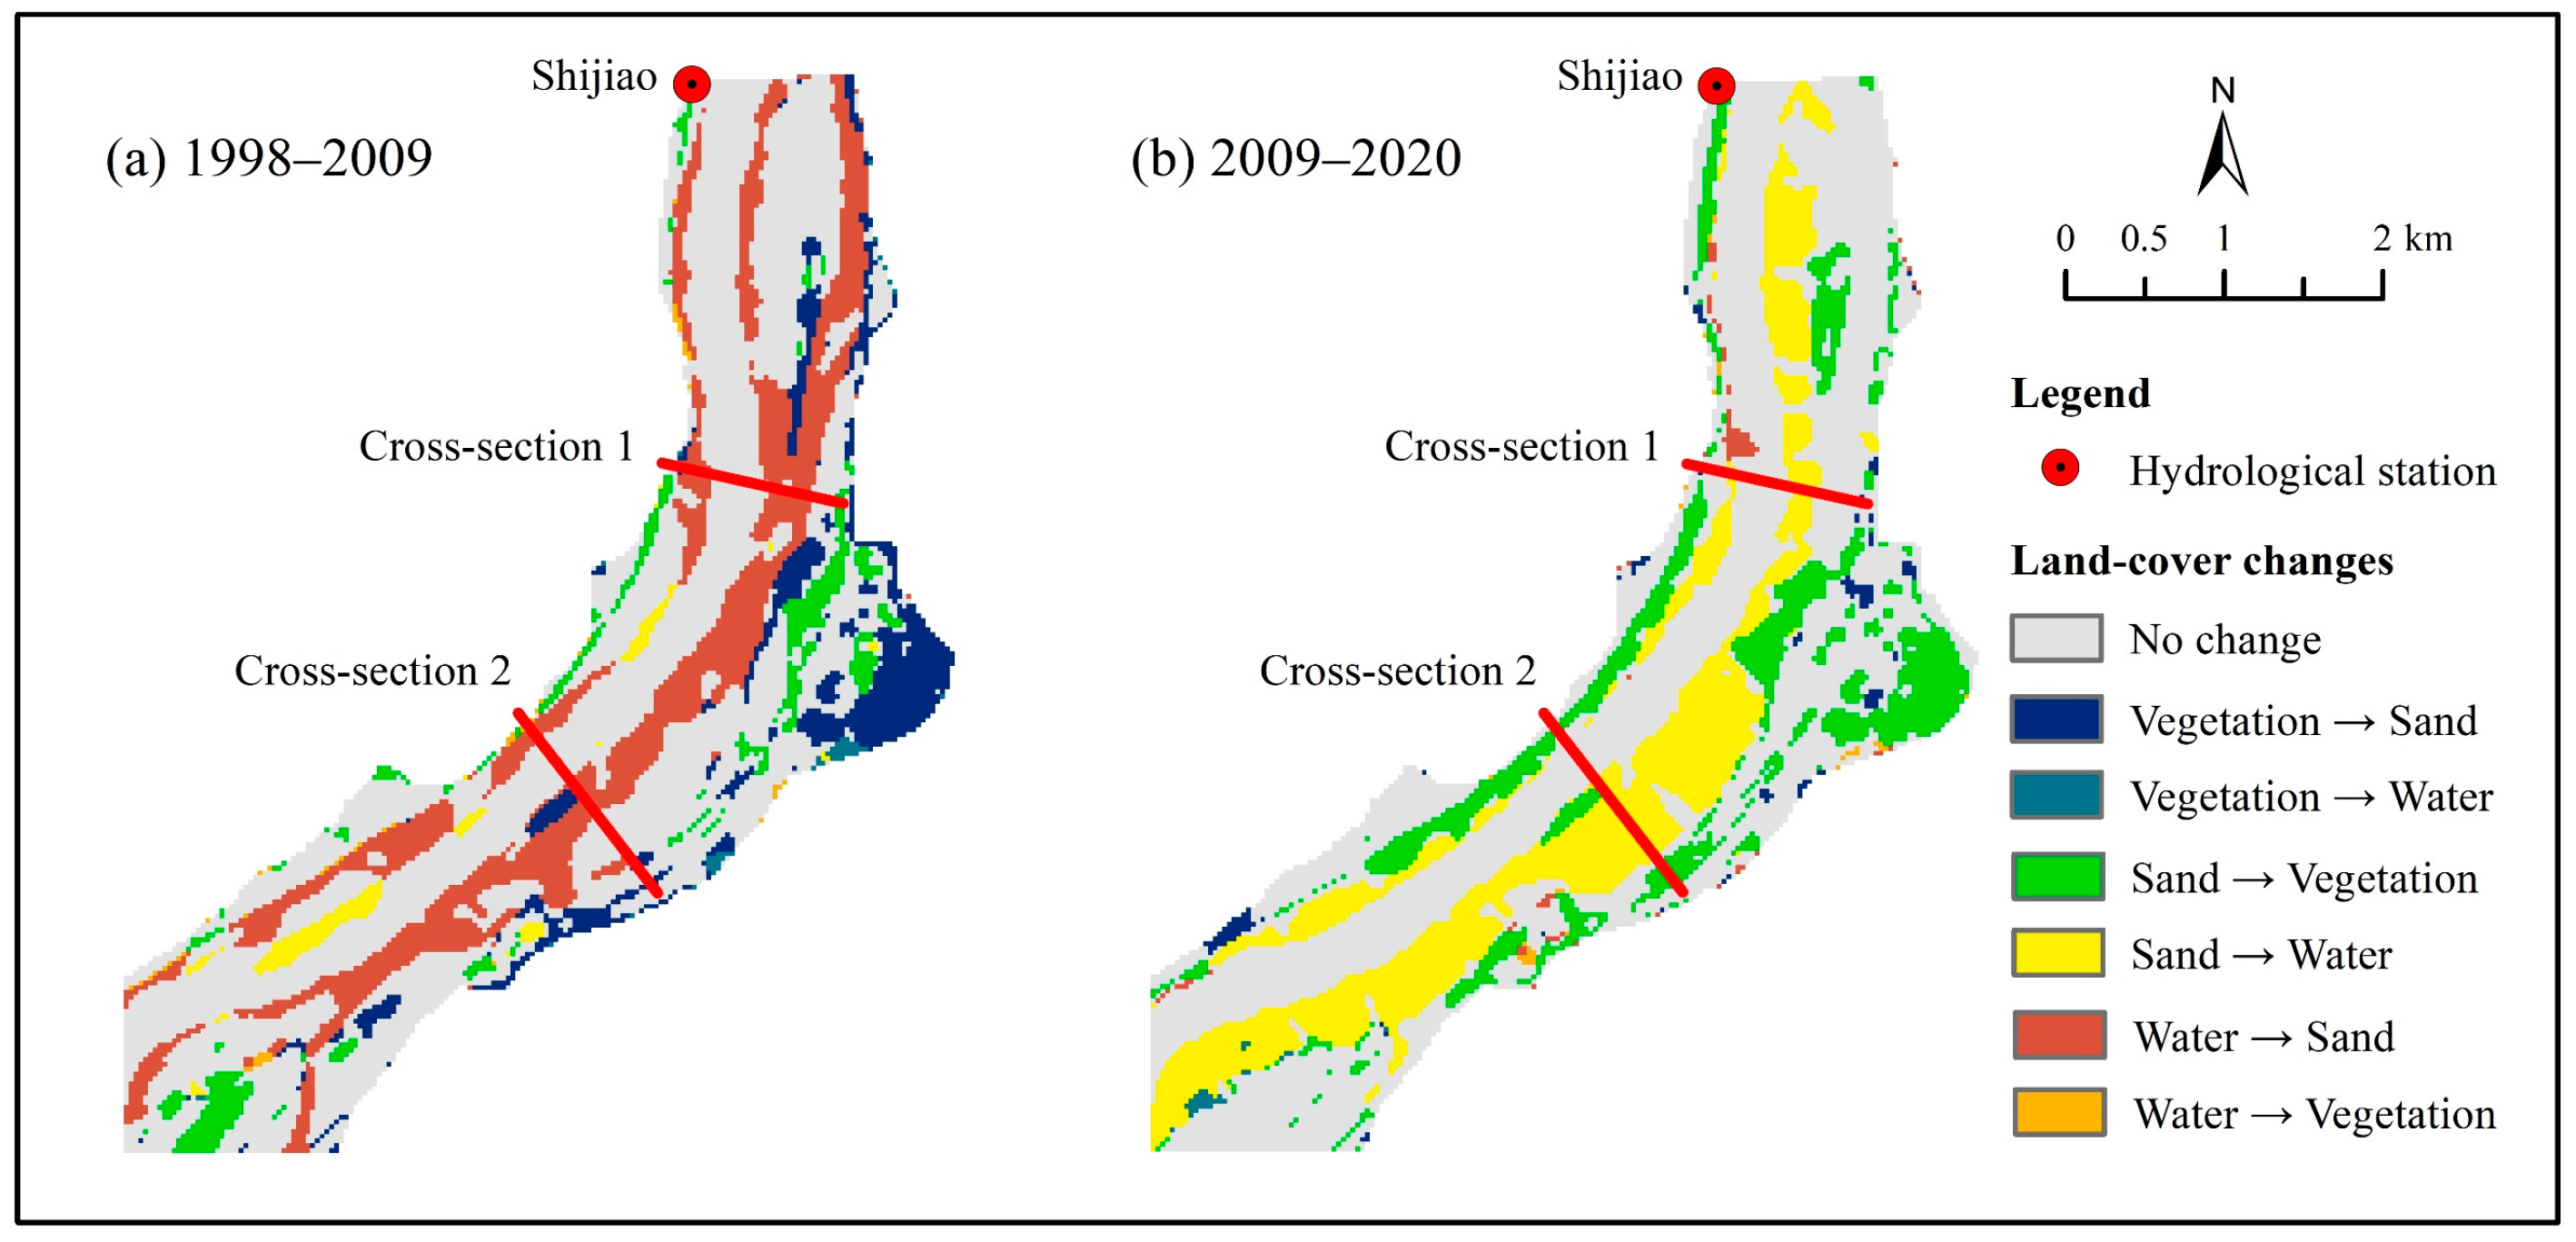
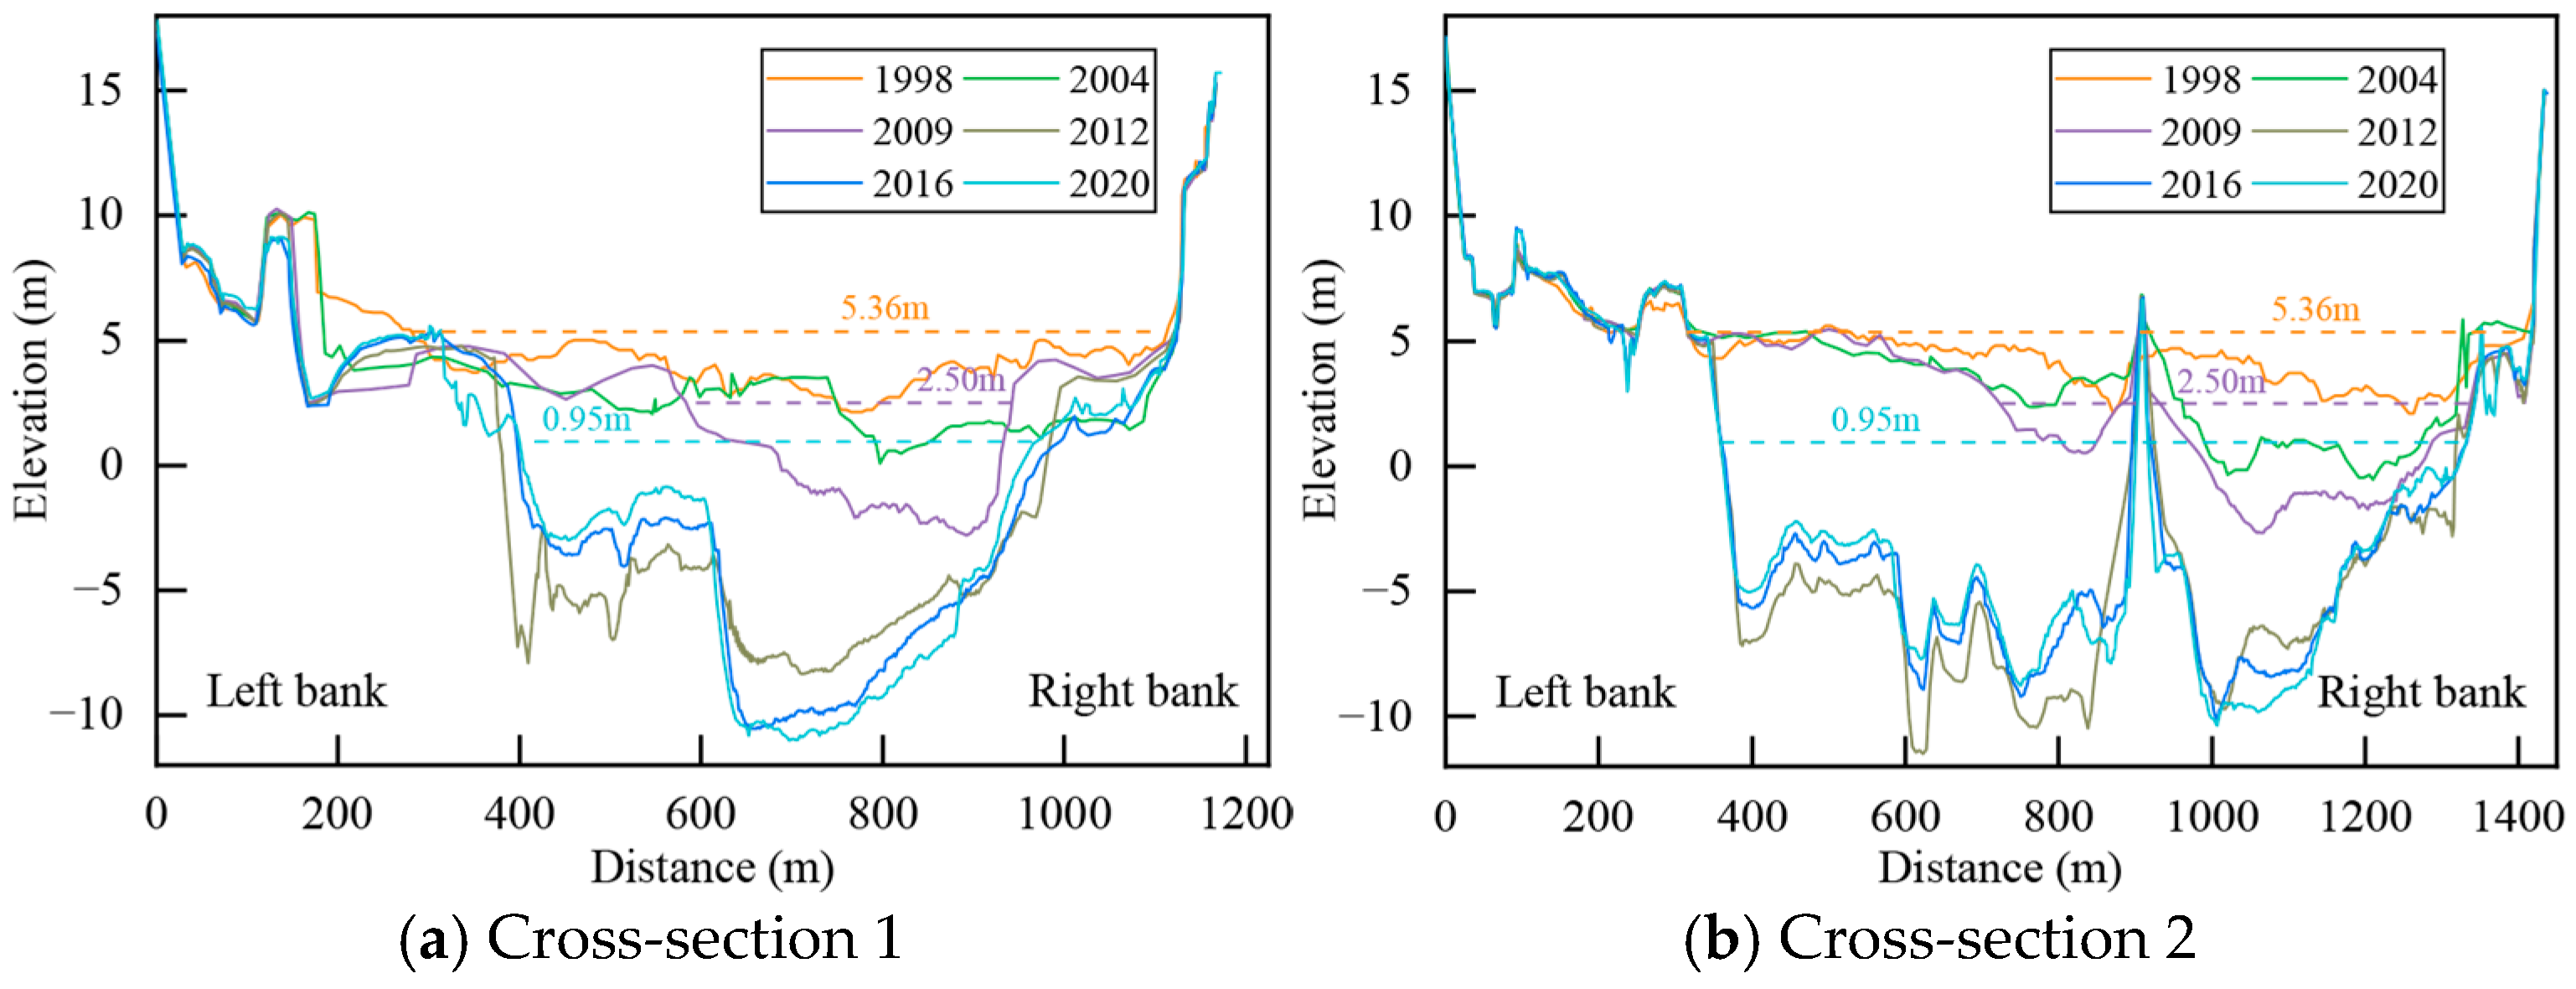
Taking the Shijiao–Datang river section, where land use changes significantly, as an illustration for further discussion (Figure 13), cross-sections 1 and 2 are located approximately 2.5 km and 4.7 km downstream of Shijiao Station, respectively. Figure 14 shows the historical topographic changes in cross-sections 1 and 2 from 1998 to 2020. From 1998 to 2009, both cross-sections primarily showed the transformation of a large amount of water in the middle and right bank areas into sand. The changes in the cross-sectional topography revealed that in 1998, the riverbed was relatively flat with no obvious floodplain; however, in 2004 and 2009, erosion occurred near the right bank, forming a more prominent main channel. Additionally, from 1998 to 2009, the average water level at Shijiao Station during the dry season decreased from 5.36 m to 2.50 m, exposing the floodplain near both banks. Previous studies have shown that reservoirs often generate severe bed incision in their downstream reaches, which will reduce the water surface elevations while not decreasing the flow rate [43,44]. These changes in topography align with the results of the land-cover distribution, further confirming the reliability of the land-cover interpretation.
From 2009 to 2020, cross-section 1 showed a transformation of some sandy beaches in the middle area into water, whereas a substantial portion of the sandy beaches in the middle area turned into water in cross-section 2, with some sandy beaches on both banks transitioning to vegetation cover. From 2009 to 2012, the topographic changes in both cross-sections showed significant overall riverbed downcutting, with an average erosion depth exceeding 4 m and localized maximum depths surpassing 10 m. This rapid and drastic change is related to human activities, such as sand mining and channel regulation. The original floodplain in the middle area recedes below the water level during the dry season, leading to the replacement of existing sandy beaches with water. From 2012 to 2020, there were minor changes in the topography at both cross-sections, with slight sedimentation in the left channel and minor erosion in the right channel. Some scholars have pointed out that in riverbanks without human interference, vegetation coverage shows an exponential increase trend and gradually stabilizes [45,46]. The elevation of the beach on both sides of cross-section 2 remained relatively stable from 2009 to 2020, providing important external conditions for vegetation to colonize and grow steadily in the area.

5.3. Relationship between River Evolution and Landscape Changes

The dynamic interaction between river evolution and landscape changes is a fundamental aspect of geomorphology and ecology. Rivers are complex systems that constantly reshape the surrounding environment through erosion, sediment transport, and deposition. For example, sediment deposits form deltas at their mouths or near lakes, which become fertile agricultural areas due to their abundant organic matter [47]. The lateral scouring leads to the collapse of riverbanks, forming river landscapes such as meandering waterways and oxbow lakes [48].
However, the landscape changes caused by river evolution are not solely driven by natural processes. Human activities like dam construction, artificial dredging, and water resource allocation have significantly altered the evolution of natural rivers. Reservoirs hinder sediment transport, disrupt natural erosion and sedimentation processes, and have a direct impact on downstream sediment scarcity and intensified riverbank erosion [5]. Meanwhile, they also indirectly affect the ecosystem of downstream rivers, such as changes in vegetation evolution processes [49] and loss of species habitats [50].
In addition, climate change poses a significant threat to the relationship between river evolution and landscape changes. Alterations in precipitation patterns and an increased frequency of extreme weather events, such as heavy rainfall and storm surges, may exacerbate erosion and sediment transport, resulting in catastrophic changes in river channels [51], thus fundamentally reshaping the river landscape. These extreme events not only reshape the physical characteristics of rivers but may also have long-term impacts on ecosystems, disrupting the flora and fauna communities that rely on stable river environments [52]. Therefore, in the future protection of river landscapes, it is necessary to consider both the pressure caused by human activities and the variability of natural processes, and adopt comprehensive management methods to effectively mitigate the impact of climate changes.

6. Conclusions

The evolution of river landscape patterns in the LBR over the past 30 years was explored using measured topography and time-series Landsat RS images. There was a significant downcutting in the terrain of the river channel, with the average elevation decreasing by 3.6 m and the minimum thalweg elevation decreasing by 6.7 m. The amplitude of the elevation change gradually decreased from upstream to downstream. Over the past 30 years, the vegetation area fluctuated around the mean in different years, except in 2010, when the vegetation area dropped significantly below the average. The sand area remained relatively stable before 2012, suddenly dropped to <50% of its previous level, and tended to stabilize in the last decade. The water area gradually increases at a rate of 0.82 km2 per year. The spatial variation of different land-cover types indicated that only 39.6% of the sand remained unchanged between 1998 and 2009, and 32.3% between 2009 and 2020. Additionally, >70% of the vegetation and water remained stable during both periods. The corresponding landscape patterns showed that sand had the highest and increasing fragmentation degree among all land-cover types, whereas both vegetation and sand showed a decreasing trend in fragmentation degree. The relationship between landscape patterns of different land-cover types and external driving forces ultimately indicated that the annual average temperature, annual average maximum temperature, and annual rainfall days had the highest correlation with vegetation landscape pattern indices, and that human activities may be the primary drivers behind the landscape pattern evolution of water and sand. After the construction of the reservoir, the downstream riverbed experiences channel incision, leading to a decrease in water level and the emergence of shoals. Consequently, the original water area will be transformed into a sandy landscape. However, human activities such as sand mining and channel dredging may cause the re-establishment of water landscapes from these sandy regions. Concurrently, within stable sandy areas, plant germination occurs, gradually evolving into a stable vegetation landscape. To better protect the river landscape, it is recommended to establish an integrated landscape management framework that considers ecological, social, and economic factors. In terms of ecology, it is required to establish a sustainable monitoring plan, advocate for strong environmental policies, and prioritize protection and sustainable land-use strategies. In terms of socioeconomic aspects, it is required to further regulate human activities within rivers, such as sand mining, channel dredging, and river-related constructions.

Author Contributions

Z.Z.: methodology, software, investigation, writing—original draft. Y.X.: resources, supervision. H.W.: supervision, writing—review and editing, funding acquisition. D.H.: conceptualization, funding acquisition. H.L.: supervision, funding acquisition. X.C.: writing—review and editing. C.D.: conceptualization, supervision. All authors have read and agreed to the published version of the manuscript.

Funding

This research was supported by the National Natural Science Foundation of China (Grant No. 12202150), Science and Technology Innovation Program from Water Resources of Guangdong Province (Grant Nos. 2023-06, 2024-06), Guangzhou Municipal Science and Technology Project (Grant No. 2023A04J2008), and Open Research Fund Program of State key Laboratory of Hydroscience and Engineering (Grant No. sklhse-2023-B-05).

Data Availability Statement

The original contributions presented in the study are included in the article; more detailed datasets will be made available upon request.

Conflicts of Interest

Author Yizhou Xiao was employed by the company CCCC Second Harbor Engineering Co., Ltd. and CCCC Highway Bridge National Engineering Research Centre Co., Ltd. The remaining authors declare that the research was conducted in the absence of any commercial or financial relationships that could be construed as a potential conflict of interest.

References

  1. Grams, P.; Schmidt, J.; Topping, D. The rate and pattern of bed incision and bank adjustment on the Colorado River in Glen Canyon downstream from Glen Canyon Dam, 1956–2000. Geol. Soc. Am. Bull. 2007, 119, 556–575. [Google Scholar] [CrossRef]
  2. Yang, S.; Milliman, J.; Li, P.; Xu, K. 50,000 dams later: Erosion of the Yangtze River and its delta. Glob. Planet. Change 2011, 75, 14–20. [Google Scholar] [CrossRef]
  3. Smith, N.; Morozova, G.; Pérez-Arlucea, M.; Gibling, M. Dam-induced and natural channel changes in the Saskatchewan River below the E.B. Campbell Dam, Canada. Geomorphology 2016, 269, 186–202. [Google Scholar] [CrossRef]
  4. Tian, Q.; Xu, K.; Dong, C.; Yang, S.; He, Y.; Shi, B. Declining sediment discharge in the Yangtze River from 1956 to 2017: Spatial and temporal changes and their causes. Water Resour. Res. 2021, 57, e2020WR028645. [Google Scholar] [CrossRef]
  5. Yang, Y.; Zhou, L.; Zhu, L.; Liu, W.; Wang, J. Impact of upstream reservoirs on geomorphic evolution in the middle and lower reaches of the Yangtze River. Earth Surf. Proc. Land. 2023, 48, 582–595. [Google Scholar] [CrossRef]
  6. Ma, L.; Bo, J.; Li, X.; Fang, F.; Cheng, W. Identifying key landscape pattern indices influencing the ecological security of inland river basin: The middle and lower reaches of Shule River Basin as an example. Sci. Total Environ. 2019, 674, 424–438. [Google Scholar] [CrossRef]
  7. Cheliz, P.; Ladeira, F.; Rodrigues, J.; Giannini, P.; Pupim, F.; Mineli, T.; Rodrigues, R. Landscape evolution and unusual geomorphological-pedological-chronological relations in an alluvial plain associated with early Amerindian settlement in southeastern Brazil. Quat. Int. 2021, 601, 1–14. [Google Scholar] [CrossRef]
  8. Yang, M.; Gong, J.; Zhao, Y.; Wang, H.; Zhao, C.; Yang, Q.; Yin, Y.; Wang, Y.; Tian, B. Landscape pattern evolution processes of wetlands and their driving factors in the Xiong’an New Area of China. Int. J. Environ. Res. Public Health 2021, 18, 4403. [Google Scholar] [CrossRef]
  9. You, M.; Zou, Z.; Zhao, W.; Zhang, W.; Fu, C. Study on land use and landscape pattern change in the Huaihe River Ecological and economic zone from 2000 to 2020. Heliyon 2023, 9, e13430. [Google Scholar] [CrossRef]
  10. Chen, W.; Li, J.; Zeng, J.; Ran, R.; Yang, B. Spatial heterogeneity and formation mechanism of eco-environmental effect of land use change in China. Geogr. Resaust. 2019, 38, 2173–2187. (In Chinese) [Google Scholar] [CrossRef]
  11. Quigley, T.; Haynes, R.; Hann, W. Estimating ecological integrity in the interior Columbia River basin. For. Ecol. Manag. 2001, 153, 161–178. [Google Scholar] [CrossRef]
  12. Dong, L.; Yang, W.; Zhang, K.; Zhen, S.; Cheng, X.; Wu, L. Study of marsh wetland landscape pattern evolution on the Zoige Plateau due to natural/human dual-effects. PeerJ 2020, 8, e9904. [Google Scholar] [CrossRef] [PubMed]
  13. Wu, T.; Zha, P.; Yu, M.; Jiang, G.; Zhang, J.; You, Q.; Xie, X. Landscape pattern evolution and its response to human disturbance in a newly metropolitan area: A case study in Jin-Yi Metropolitan Area. Land 2021, 10, 767. [Google Scholar] [CrossRef]
  14. Chang, G.; Zhang, W. Ecological civilization-based rethinking of large-scale immigration and land development along Shule River. J. Lanzhou Univ. Nat. Sci. 2014, 50, 405–409. (In Chinese) [Google Scholar]
  15. Fang, C.; Li, G.; Wang, S. Changing and differentiated urban landscape in China: Spatiotemporal patterns and driving forces. Environ. Sci. Technol. 2016, 50, 2217–2227. [Google Scholar] [CrossRef] [PubMed]
  16. Zhou, Z.; Wang, J. Evolution of landscape dynamics in the Yangtze River Delta from 2000 to 2020. J. Water Clim. Change 2022, 13, 1241–1256. [Google Scholar] [CrossRef]
  17. Hou, B.; Wei, C.; Liu, X.; Meng, Y.; Li, X. Assessing forest landscape stability through automatic identification of landscape pattern evolution in Shanxi Province of China. Remote Sens. 2023, 15, 545. [Google Scholar] [CrossRef]
  18. Zhu, Z.; Wang, H.; Yang, Z.; Huai, W.; Huang, D.; Chen, X. Landscape pattern changes of aquatic vegetation communities and their response to hydrological processes in Poyang Lake, China. Water 2024, 16, 1482. [Google Scholar] [CrossRef]
  19. Hill, R.; Smith, G. Land cover heterogeneity in Great Britain as identified in Land Cover Map 2000. Int. J. Remote Sens. 2005, 26, 5467–5473. [Google Scholar] [CrossRef]
  20. Niu, H.; Zhao, X.; Xiao, D.; Liu, M.; An, R.; Fan, L. Evolution and influencing factors of landscape pattern in the Yellow River Basin (Henan Section) due to land use changes. Water 2022, 14, 3872. [Google Scholar] [CrossRef]
  21. Fan, W.; Yang, X.; Cai, S.; Ou, H.; Zhou, T.; Wang, D. Land-use/cover change and driving forces in the Pan-Pearl River Basin during the period 1985–2020. Land 2024, 13, 822. [Google Scholar] [CrossRef]
  22. Ye, Y.; Zhang, H.; Liu, K.; Wu, Q. Research on the influence of site factors on the expansion of construction land in the Pearl River Delta, China: By using GIS and remote sensing. Int. J. Appl. Earth Obs. 2013, 21, 366–373. [Google Scholar] [CrossRef]
  23. Liang, J.; Li, X. Landscape patterns in Nansi Lake for 3 periods and their changes. Wetland Sci. 2017, 15, 834–843. (In Chinese) [Google Scholar] [CrossRef]
  24. Jiang, P.; Cheng, L.; Li, M.; Zhao, R.; Huang, Q. Analysis of landscape fragmentation processes and driving forces in wetlands in arid areas: A case study of the middle reaches of the Heihe River, China. Ecol. Indic. 2014, 46, 240–252. [Google Scholar] [CrossRef]
  25. Guo, M.; Zhou, N.; Cai, Y.; Zhao, W.; Lu, S.; Liu, K. Monitoring the landscape pattern dynamics and driving forces in Dongting Lake Wetland in China based on Landsat images. Water 2024, 16, 1273. [Google Scholar] [CrossRef]
  26. Li, M.; Li, X.; Liu, S.; Lyu, X.; Dang, D.; Dou, H.; Wang, K. Analysis of the spatiotemporal variation of landscape patterns and their driving factors in Inner Mongolia from 2000 to 2015. Land 2022, 11, 1410. [Google Scholar] [CrossRef]
  27. Aguiar, F.; Martins, M.; Silva, P.; Fernandes, M. Riverscapes downstream of hydropower dams: Effects of altered flows and historical land-use change. Landsc. Urban Plan. 2016, 153, 83–98. [Google Scholar] [CrossRef]
  28. Lupinacci, C.; da Conceiçao, F.; Simon, A.; Perez, A. Land use changes due to energy policy as a determining factor for morphological processes in fluvial systems in SAo Paulo State, Brazil. Earth Surf. Proc. Land. 2017, 42, 2402–2413. [Google Scholar] [CrossRef]
  29. Lu, D.; Zheng, Y.; Liu, X.; Chang, J. Changes in wetland landscape and inundation patterns in the middle and lower reaches of the Yangtze River Basin from 1990 to 2020. Ecol. Indic. 2024, 161, 111992. [Google Scholar] [CrossRef]
  30. Ding, C.; Huang, D.; Li, H.; Chen, X. River adjustments in response to human activities: A case study of the lower Beijiang River, China. Earth Surf. Proc. Land. 2024, 49, 887–900. [Google Scholar] [CrossRef]
  31. Zhong, K.; Liu, W.; Huang, J. A riverway evolution analysis based on remote sensing technique: A case study of the lower reaches of the Beijiang River. Remote Sens. Land Resour. 2006, 3, 69–73. (In Chinese) [Google Scholar] [CrossRef]
  32. Zhu, Z.; Ding, C.; Huang, D.; Liu, H.; Chen, X. Analysis of the Topographic Evolution of the Lower Beijiang River and its Impact on Material Transport. China Rural Water Hydropower 2024, 7, 85–94. (In Chinese) [Google Scholar] [CrossRef]
  33. Hernandez-Stefanoni, J.; Ponce-Hernandez, R. Mapping the spatial variability of plant diversity in a tropical forest: Comparison of spatial interpolation methods. Environ. Monit. Assess. 2006, 117, 307–334. [Google Scholar] [CrossRef] [PubMed]
  34. Zhao, X.; Liu, J.; Bu, Y. Quantitative analysis of spatial heterogeneity and driving forces of the thermal environment in urban built-up areas: A case study in Xi’an, China. Sustainability 2021, 13, 1870. [Google Scholar] [CrossRef]
  35. Guha, S.; Govil, H. Annual assessment on the relationship between land surface temperature and six remote sensing indices using landsat data from 1988 to 2019. Geocarto Int. 2022, 37, 4292–4311. [Google Scholar] [CrossRef]
  36. Han, X.; Chen, X.; Feng, L. Four decades of winter wetland changes in Poyang Lake based on Landsat observations between 1973 and 2013. Remote Sens. Environ. 2015, 156, 426–437. [Google Scholar] [CrossRef]
  37. Sung, C. Simulation of crane habitat fragmentation in the North and South Korean border region after Korean reunification. Landsc. Urban Plan. 2015, 134, 10–18. [Google Scholar] [CrossRef]
  38. Wang, J.; Ran, Y.; Zhang, Y.; Cao, X.; Yang, F. Land cover and landscape pattern changes in Poyang Lake region of China in 1998–2010. Chin. J. Appl. Ecol. 2013, 24, 1085–1093. (In Chinese) [Google Scholar]
  39. Cui, Y.; Dong, B.; Chen, L.; Gao, X.; Cui, Y. Study on habitat suitability of overwintering cranes based on landscape pattern change—A case study of typical lake wetlands in the middle and lower reaches of the Yangtze River. Environ. Sci. Pollut. Res. 2019, 26, 14962–14975. [Google Scholar] [CrossRef]
  40. Zhu, Z.; Huai, W.; Yang, Z.; Li, D.; Wang, Y. Assessing habitat suitability and habitat fragmentation for endangered Siberian cranes in Poyang Lake region, China. Ecol. Indic. 2021, 125, 107594. [Google Scholar] [CrossRef]
  41. Yang, X.; Zhang, S.; Wu, C.; Zhang, R.; Zhou, Y. Ecological and navigational impact of the construction and operation of the Qingyuan dam. Ecol. Indic. 2023, 154, 110563. [Google Scholar] [CrossRef]
  42. Tan, C.; Huang, B.; Qiu, J. Analysis of recent riverbed evolution characteristics and causes in the Shijiao section of the lower reaches of the Beijiang River. Guangdong Water Resour. Hydropower 2013, 9, 13–17. (In Chinese) [Google Scholar]
  43. van Maren, D.; Yang, S.; He, Q. The impact of silt trapping in large reservoirs on downstream morphology: The Yangtze River. Ocean Dynam. 2013, 63, 691–707. [Google Scholar] [CrossRef]
  44. Mei, X.; Dai, Z.; Du, J.; Darby, S. Mega dam-induced riverbed erosion exacerbates drought effects on river water surface elevation. Hydrol. Process. 2023, 37, e14917. [Google Scholar] [CrossRef]
  45. Kondziolka, J.; Nepf, H. Vegetation wakes and wake interaction shaping aquatic landscape evolution. Limnol. Oceanogr. Fluids Environ. 2014, 4, 106–119. [Google Scholar] [CrossRef]
  46. Yamasaki, T.; de Lima, P.; Silva, D.; Preza, C.; Janzen, J.; Nepf, H. From patch to channel scale: The evolution of emergent vegetation in a channel. Adv. Water Resour. 2019, 129, 131–145. [Google Scholar] [CrossRef]
  47. Syvitski, J.; Vörösmarty, C.; Kettner, A.; Green, P. Impact of humans on the flux of terrestrial sediment to the global coastal ocean. Science 2005, 308, 376–380. [Google Scholar] [CrossRef]
  48. Ishii, Y.; Hori, K. Formation and infilling of oxbow lakes in the Ishikari lowland, northern Japan. Quat. Int. 2016, 397, 134–146. [Google Scholar] [CrossRef]
  49. Benjankar, R.; Egger, G.; Jorde, K.; Goodwin, P.; Glenn, N. Dynamic floodplain vegetation model development for the Kootenai River, USA. J. Environ. Manag. 2011, 92, 3058–3070. [Google Scholar] [CrossRef]
  50. Lan, X.; Zhou, T.; Zeng, T.; Chen, Z.; Duo, J.; Sun, J. Reservoirs alter terrestrial mammal habitat over the Indochina Peninsula. Ecol. Indic. 2024, 166, 112366. [Google Scholar] [CrossRef]
  51. Diodato, N.; Filizola, N.; Borrelli, P.; Panagos, P.; Bellocchi, G. The rise of climate-driven sediment discharge in the Amazonian River Basin. Atmosphere 2020, 11, 208. [Google Scholar] [CrossRef]
  52. Tapia-Palacios, M.; García-Suárez, O.; Sotomayor-Bonilla, J.; Silva-Magaña, M.; Pérez-Ortíz, G.; Espinosa-García, A.; Ortega-Huerta, M.; Díaz-Avalos, C.; Suzán, G.; Mazari-Hiriart, M. Abiotic and biotic changes at the basin scale in a tropical dry forest landscape after Hurricanes Jova and Patricia in Jalisco, Mexico. For. Ecol. Manag. 2018, 426, 18–26. [Google Scholar] [CrossRef]
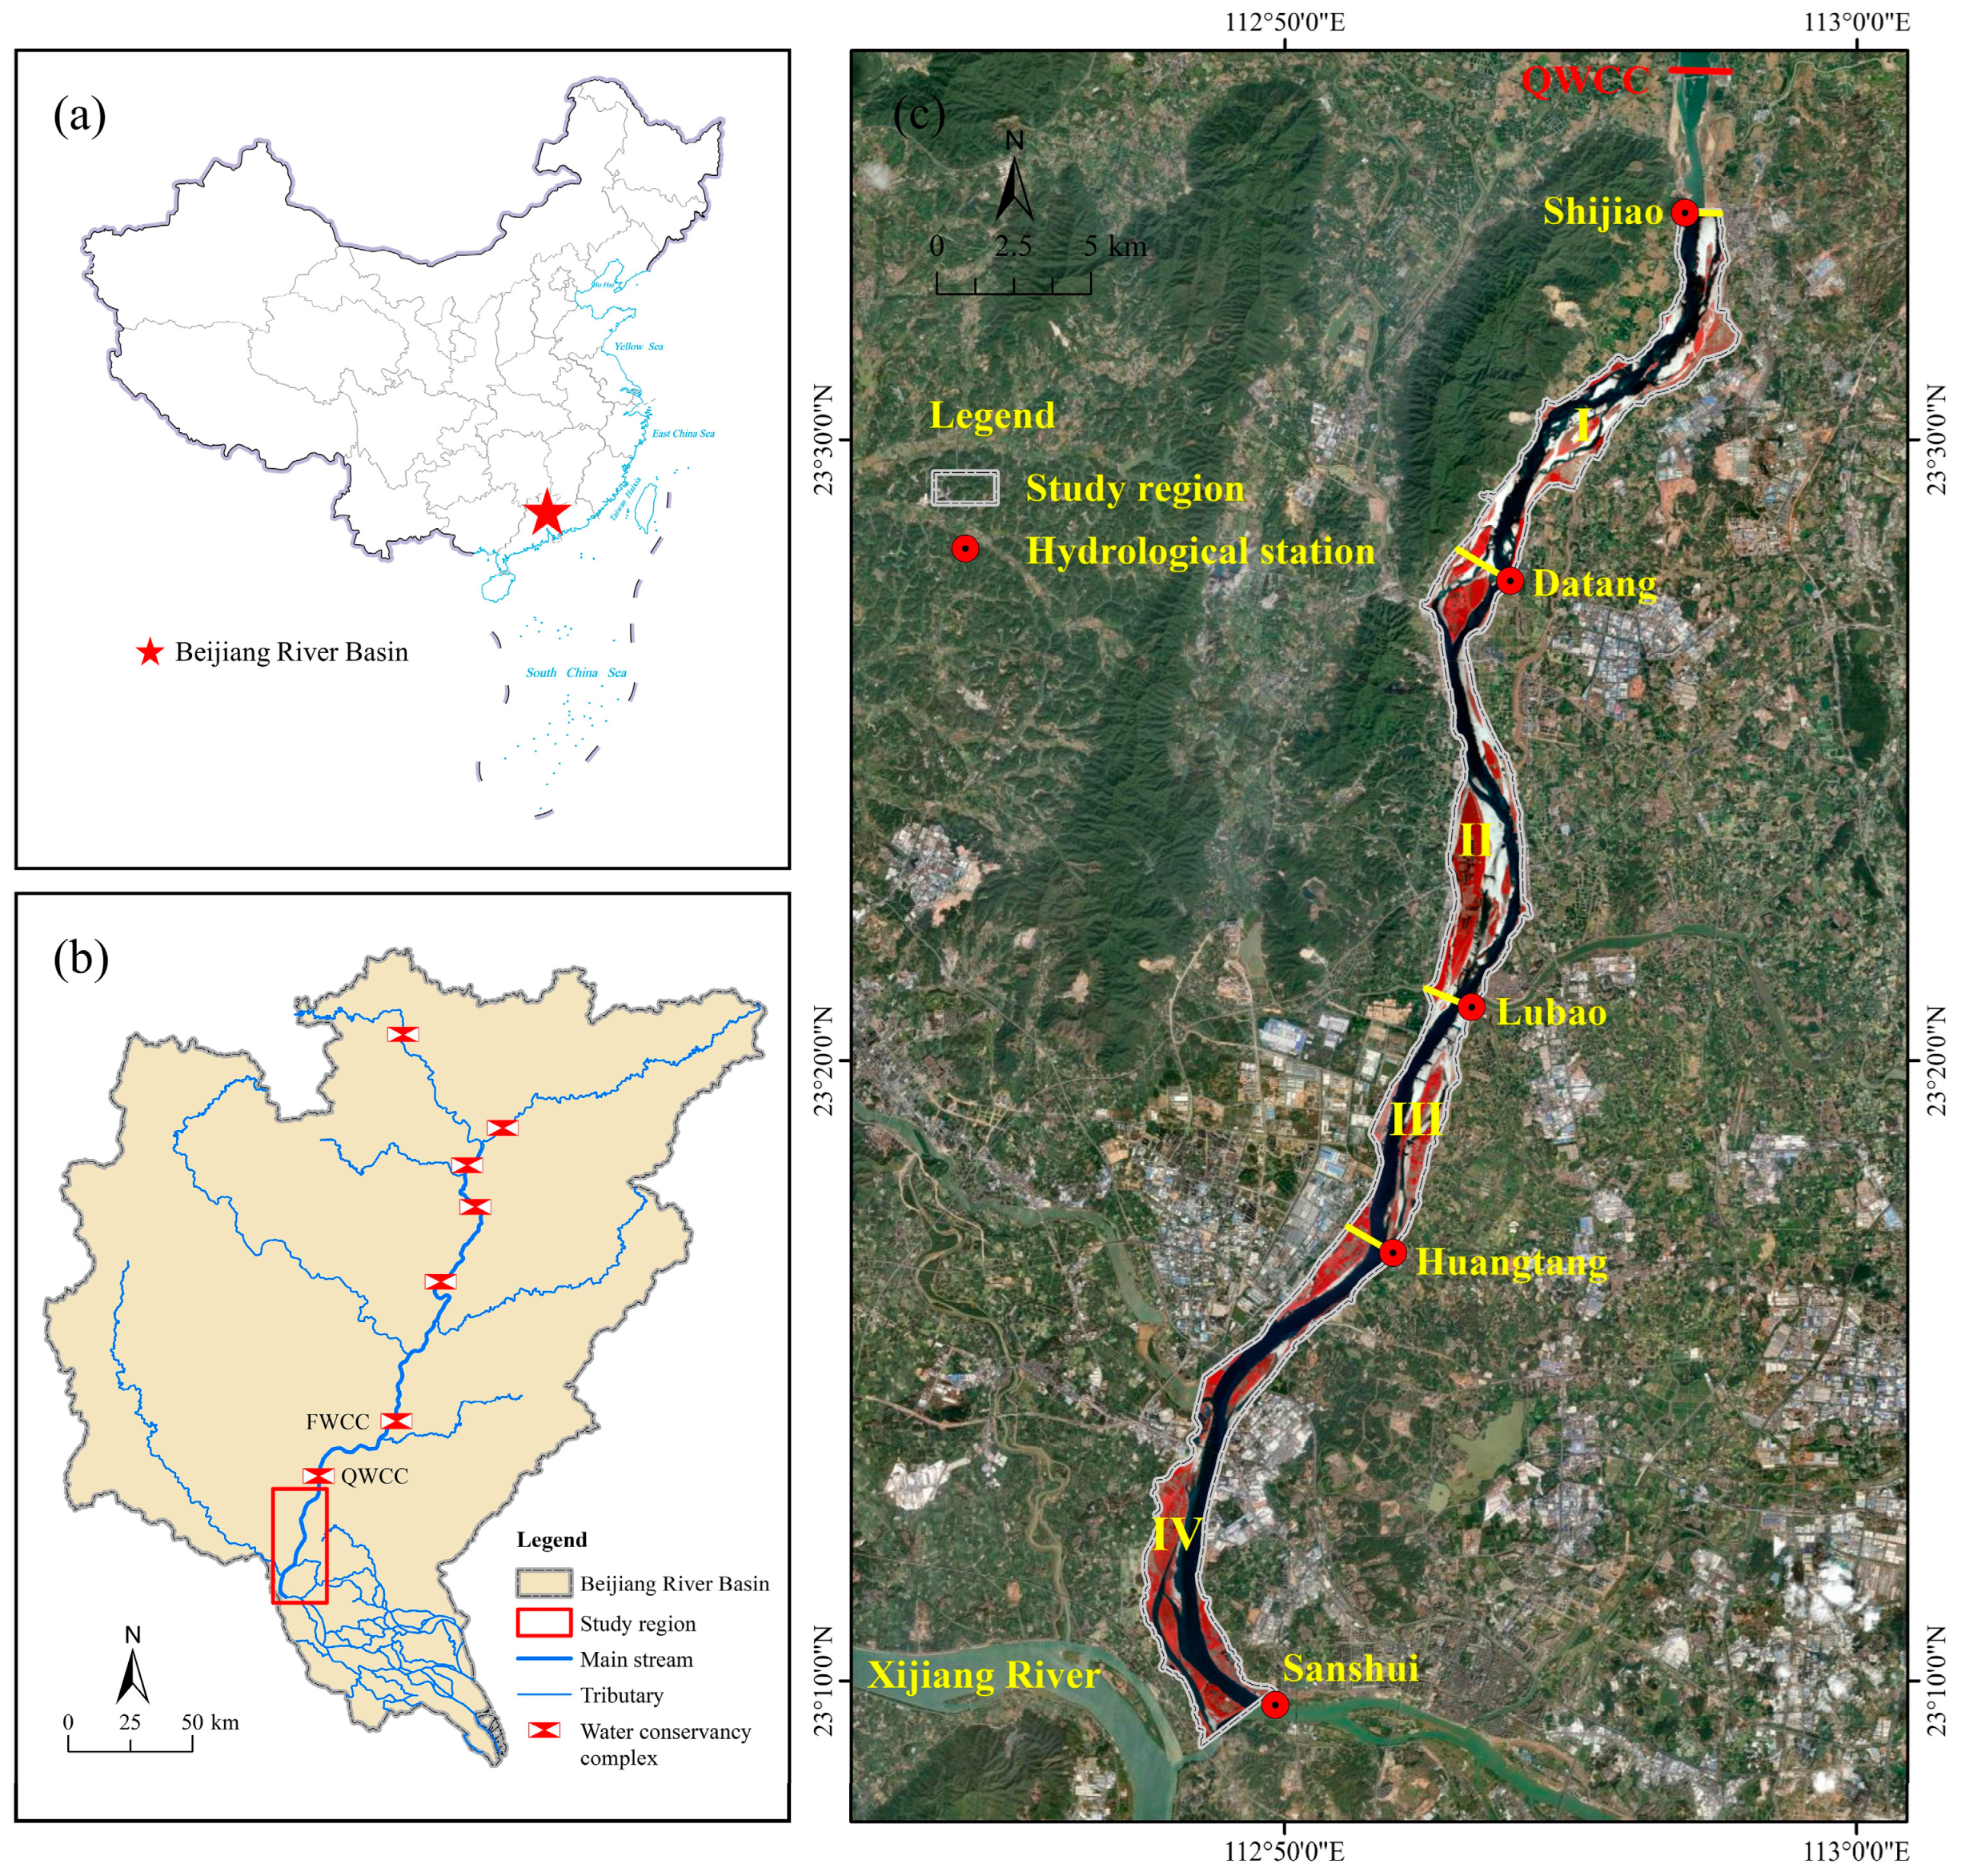
Figure 1. Overview of the study region. (a) Location of Beijiang River Basin on the map of China. (b) Scope of Beijiang River Basin. (c) Introduction to the basic situation of the study region.
Water 16 02875 g001
Figure 2. Average spectral reflectance curves of different land-cover types.
Water 16 02875 g002
Figure 3. (a) Topography of the study region in different years. (b) Spatiotemporal distribution of sedimentation (positive value) and erosion (negative value) in different years.
Water 16 02875 g003
Figure 4. Longitudinal variation of thalweg elevations in different years.
Water 16 02875 g004
Figure 5. Distribution of different land-cover types in the Shijiao–Sanshui section of the LBR from 1991 to 2023.
Water 16 02875 g005
Figure 6. Changes in the distribution area of different land-cover types from 1991 to 2023.
Water 16 02875 g006
Figure 7. Linear regression models of water areas.
Water 16 02875 g007
Figure 8. Changes in the distribution area of different land-cover types in different segments.
Water 16 02875 g008
Figure 9. Spatial variation of different land-cover types in the study area.
Water 16 02875 g009
Figure 10. Difference in average distribution elevation of different land-cover types.
Water 16 02875 g010
Figure 11. Statistical results of landscape pattern indices for different land-cover types.
Water 16 02875 g011
Figure 12. Double cumulative curve of annual runoff and annual sediment load at Shijiao Station.
Water 16 02875 g012
Figure 13. Spatial variation of different land-cover types in the Shijiao–Datang river section and the location of two cross-sections.
Water 16 02875 g013
Figure 14. Historical topographic changes in cross-sections 1 and 2 (dashed lines represent the average water level during the dry season at Shijiao Station in the corresponding years).
Water 16 02875 g014
Table 1. Overview of the selected remote sensing images.
YearDateSensor Type 1YearDateSensor TypeYearDateSensor Type
199117 NovemberL520027 NovemberL7201416 NovemberL8
19925 DecemberL520034 DecemberL520167 DecemberL8
199324 DecemberL520046 DecemberL5201718 DecemberL7
199425 NovemberL5200523 NovemberL520185 DecemberL7
199530 DecemberL5200612 DecemberL5201914 NovemberL8
199717 NovemberL520077 DecemberL720202 DecemberL8
199822 DecemberL520081 DecemberL520215 DecemberL8
19999 DecemberL520094 DecemberL5202224 DecemberL8
20001 NovemberL7201031 DecemberL7202327 DecemberL8
200122 DecemberL7201329 NovemberL8
Notes: 1 L5 represents the Landsat5 TM remote sensing image, L7 represents the Landsat7 ETM+ remote sensing image, and L8 represents the Landsat8 OLI remote sensing image.
Table 2. Transition matrix for land-cover types in the study region between 1998 and 2009 (unit: km2).
Year1998
VegetationSandWaterTotal
2009Vegetation19.873.610.8924.37
Sand5.046.274.5315.84
Water2.265.9427.0935.29
Total27.1715.8232.5175.50
Changes from 1998 to 2009−2.800.022.78
Table 3. Transition matrix for land-cover types in the study region between 2009 and 2020 (unit: km2).
Year2009
VegetationSandWaterTotal
2020Vegetation20.006.010.8726.88
Sand2.235.120.958.30
Water2.144.7233.4640.32
Total24.3715.8535.2875.50
Changes from 2009 to 20202.51−7.555.04
Table 4. Details of each landscape pattern index.
IndexIntroductionEcological Relevance
NPTotal number of patches of a certain land type (NP ≥ 1). NP describes the heterogeneity of the overall landscape.
PDNumber of patches per unit area (PD > 0, number/km2).PD generally has a good correlation with landscape fragmentation.
LPIProportion of the largest patch of a certain land type in the whole landscape (0 < LPI ≤ 100, %). LPI reflects the dominance of patches.
MPSArea of a certain land type divided by the number of the patches (MPS > 0, hm2).MPS reflects the fragmentation degree of different landscapes and indicates the differences among different types of landscapes.
PAFRACPAFRAC equals 2 divided by the slope of the regression line, which is obtained by regressing the logarithm of patch area (m2) against the logarithm of patch perimeter (m) (1 ≤ PAFRAC ≤ 2). PAFRAC reflects the complexity of landscape shape, and higher values usually indicate more convoluted shapes.
AINumber of like adjacencies involving the corresponding class, divided by the maximum possible number of like adjacencies involving the corresponding class (0 < AI ≤ 100, %). AI reflects the connectivity and aggregation degree between landscape patches. A larger AI value indicates a higher aggregation degree.
Table 5. Gray relational coefficients between landscape pattern indices of different land-cover types and natural factors.
Land-Cover TypeLandscape IndexX1 1X2X3X4X5X6X7X8X9X10
VegetationAREA0.640.650.710.690.730.660.720.650.670.71
PD0.630.640.650.670.680.680.630.690.770.78
LPI0.740.750.640.660.680.700.660.660.570.73
MPS0.590.620.580.590.590.770.670.700.650.62
PAFRAC0.560.580.620.600.620.720.700.660.690.62
AI0.640.660.650.640.650.620.790.550.550.66
SandAREA0.700.690.640.630.630.670.690.690.600.76
PD0.470.470.570.570.610.650.570.670.660.54
LPI0.540.540.550.580.590.660.560.700.650.66
MPS0.770.780.660.650.630.630.670.630.660.81
PAFRAC0.540.530.660.640.670.710.690.670.690.68
AI0.740.720.620.650.630.560.650.570.550.70
WaterAREA0.520.510.680.600.640.670.670.670.680.65
PD0.640.650.660.600.600.640.760.590.610.64
LPI0.500.490.650.600.630.680.640.660.650.63
MPS0.490.490.590.620.630.610.530.650.650.59
PAFRAC0.630.620.610.680.650.610.580.630.630.68
AI0.470.470.600.550.570.640.590.660.620.61
Notes: 1 X1, X2, X3, X4, and X5 are five hydrological sediment factors at Shijiao Station, corresponding to the annual average water level, the annual average water level during the dry season, the annual average flow, the annual average sediment concentration, and the annual average sediment load, respectively. X6, X7, X8, X9, and X10 are five meteorological factors at Qingyuan Meteorological Station, corresponding to the annual average temperature, the annual average maximum temperature, the annual average minimum temperature, the annual average rainfall, and the annual rainfall days, respectively.
Disclaimer/Publisher’s Note: The statements, opinions and data contained in all publications are solely those of the individual author(s) and contributor(s) and not of MDPI and/or the editor(s). MDPI and/or the editor(s) disclaim responsibility for any injury to people or property resulting from any ideas, methods, instructions or products referred to in the content.