Abstract
Water resources are severely scarce in desert steppes, and precipitation rarely collects in rivers or is transformed into groundwater. Evapotranspiration (ET) is the primary “export” of precipitation conversion and is the main mechanism for water vapor exchange between the underlying surface and atmosphere. ET changes have certain scale effects. This study focused on the natural grasslands in the Xilamuren Desert Steppe and analyzed and estimated the ET patterns at different scales, including micro-, point-, and surface scales, using observational data from instruments such as a photosynthetic meter, Eddy-covariance system (EC), and large-aperture scintillometer (LAS) from the Ecological Hydrology National Field Science Observation Station in the northern foothills of the Yin Mountains, Inner Mongolia. The spatial scale was extended based on this analysis. The results showed that at the microscale, the diurnal variation in the photosynthetic and transpiration rates of Leymus chinensis followed a bimodal curve. In July and August (high-temperature months), photosynthetic and transpiration rates were almost synchronous. In May and October, when the temperature was moderate, the transpiration rate was delayed compared to the photosynthetic rate at the first peak, and the second peak was significantly smaller than the first peak. At the point-scale, the daily average ET during the growing season was 1.37 mm·d−1 and the total cumulative ET was 251 mm. Transpiration levels exhibited significant seasonal variation in the following order: July > August > June > September > May > October. At the surface-scale, the daily average ET during the growing season was 1.60 mm·d−1 and the total cumulative ET was 294 mm, which was 17% higher than that of the point-scale. The surface-scale ET was estimated using the observed values of the EC and the scale relationship formula and was optimized using different spatial scales of crop coefficients. This well reflected the ET patterns at the surface-scale. Therefore, this study proposes a spatial scale expansion method for a homogeneous underlying surface, verifies its value, and provides methodological support for estimating ET in cases of data scarcity.
1. Introduction
Evapotranspiration (ET), including soil evaporation and plant transpiration, is the process of water vapor returning to the atmosphere from a liquid or solid state after precipitation reaches the ground in the hydrological cycle. It is a prominent part of the surface energy balance and plays a significant role in the energy exchange of the soil-plant-atmosphere continuum [1,2]. The study of ET characteristics not only affects agricultural irrigation and planning but is also an important basis for weather forecasting and meteorological modeling [3,4].
Grasslands are vital ecosystems, and maintaining their normal ecological function is of great significance to regional and global ecological balance. The Xilamuren Desert Grassland is located in the southeast of Damao Banner, Inner Mongolia, and in the hinterland of the Inner Mongolian Plateau, which is one of the six major pastoral areas in China. It is highly sensitive and vulnerable to climate change due to constant drought, minimal rainfall, large and loose soil sand content, low and sparse vegetation, and harsh natural conditions [5]. Consequently, the ecosystem in this region can easily be damaged. Due to the unique vegetation type and climatic conditions of the Xilamuren Desert Grassland, precipitation is rarely converted into groundwater or transported into rivers. Evaporation is the main “outlet” of precipitation transformation and the main mechanism of water vapor exchange between the atmosphere and the underlying surface [6]. Evaporation affects the water and heat balance between the surface and atmosphere in the Xilamuren Desert Grassland and subsequently affects grass growth, which is closely related to the economic development and resident life of the pastoral area. However, at present, most calculation methods or models in ET research are aimed at crops, and there are few studies on the ET rules of natural vegetation, particularly in desert grasslands which have unique underlying surface areas. Therefore, it is of great significance to study the ET characteristics of the Xilamuren Desert Grassland.
Current research on ET includes two methods: actual measurement and model estimation. With continuous scientific and technological progress, various measurement methods have gradually improved, for example, the photosynthetic apparatus for measuring transpiration at the leaf scale, the vorticity covariance method, and the large-aperture laser scintillator method for measuring ET at field and regional scales [7]. Because transpiration and photosynthesis are closely related and mutually coupled processes that jointly dominate the physiological activities and yield formation of crops, researchers often consider them together with photosynthesis when studying leaf-scale transpiration [8]. Yu et al. [9] developed a photosynthetic transpiration coupling model (SMPT-SB model) based on stomatal behavior, which can be used for joint analysis of the two processes, providing an in-depth understanding of the water-carbon coupling relationship and improving water-use efficiency. A large-aperture scintillator (LAS) is the optimal method for ground verification of remote-sensing and monitoring flux because it can monitor the underlying surface over a large range. However, ET parameters obtained at a certain scale are highly scale-dependent. The characteristic values of large-scale basins are not a simple superposition of that for several small-scale values, and small-scale values cannot be obtained through simple interpolation or decomposition [10] in order to meet the needs of current scientific research and understand the ET laws; hence, calculation methods at different scales have become particularly important.
1.1. Advances in ET Research
Domestic and foreign scholars have a long history of research on ET and have made remarkable achievements [11,12]. In 1997, the Food and Agriculture Organization of the United Nations (FAO) recommended the Penman formula to determine crop water demand. To standardize the calculation formula, the reference crop ET was redefined according to the Penman formula. Since the 1970s, with the rise and development of technology, remote sensing has provided a new approach for estimating ET.
Recently, new methods for ET measurement and estimation have emerged, and unique advantages and classical methods have simultaneously been improved. The main methods used for measuring actual ET are based on hydrology, micrometeorology, and plant physiology. The main methods for estimating ET are the one-step method for directly estimating ET (including the single-source P-M, double-source S-W, and multi-source models [13]) and the two-step method for indirectly estimating ET through reference crop ET (including the crop coefficient method).
1.2. Advances in the Relationship between LAS and EC Scales
Since Pasquill proposed the footprint concept [14], footprint theory has been continuously developed, and domestic and foreign scholars have conducted relevant calculations and studies [15,16]. Meijninger et al. [17] first applied a footprint model to the flux analysis of an LAS. Zheng et al. [18] studied the flux source area of an LAS in the artificial mixed forest of Jiyuan City, Henan Province, North China, and the results showed that the diurnal variation trend of the flux source area was basically consistent with that of turbulent exchange under stable atmospheric conditions. A preliminary analysis of the spatial representativeness of observed fluxes at Miyun Station in Beijing, using the footprint model, found that wind direction, Monin–Obukhov length, aerodynamic roughness, observed height, effective height, and other factors were sensitive to changes in the source area of the Eddy-correlation (EC) instrument and LAS [19,20]. The source distribution characteristics of the observed fluxes at different timescales were discussed in detail using two climatological footprint calculation methods, and the results showed that the climatological footprint with flux weighting at different timescales more reasonably reflected the average condition of the observed flux source area [21]. In addition, the correlation between the observed values of the EC and LAS source areas obtained by different scholars using different source area calculation methods also differs [22,23]. Generally, when the study area terrain is relatively flat with a small topographic relief and high-energy closure of each underlying surface type, the sensible heat flux of a large aperture scintillator (H(LAS)) is slightly less than the sensible heat flux of the Eddy-covariance (H(EC)) [24]. Conversely, when the underlying surface conditions of the study area are complex and the elevation difference is large, the H(LAS) is greater than the H(EC) [25].
Exploring the relationship between the observed ET flux at single-point and regional scales is a newly developing research direction. The basic starting point is to combine the patch flux values of various surface types observed by the EC according to a certain average rule and compare them with the measured LAS value [26]. Therefore, this study took the Xilamuren Desert Grassland as the research area and used observation data from the National Field Scientific Observation and Research Station of Desert Steppe Ecology and Hydrology in the north of Yinshan, Inner Mongolia (hereafter referred to as the “research station”). The main objectives of this study were as follows: carry out ET observations at the micro-, point-, and surface scales; analyze the ET rules at different scales; study the relationship between spatial scales; and establish the scale conversion approach and method. This study has important scientific significance for understanding the ET characteristics of desert grasslands and also provides theoretical guidance for ecosystem restoration of degraded grasslands in this region.
2. Materials and Methods
2.1. Study Area
The observation experiment was conducted at the National Field Scientific Observation and Research Station of Desert Steppe Ecology and Hydrology north of Yinshan, Inner Mongolia (N 42°00′22″; E 109°45′54″) (Figure 1). The research station has an average altitude of 1600 m and covers an area of approximately 1.33 km2. The climate type is a temperate, semi-arid, continental monsoon climate, with an annual average temperature of 3.4 °C and an annual frost-free period of 106 d. The annual average rainfall is 246 mm and the annual average water surface evaporation is 2227 mm. The annual average wind speed at a height of 2 m is 2.47 m·s−1, with 68 d of strong wind annually. The soil texture is mostly sandy and light soils. The dominant grass species in the study area is Leymus chinensis, accompanied by desert grassland species such as Stipeae dumort, Artemisia frigida, and Calystegin hederacea Wall. The main plant growing season is from May to October.
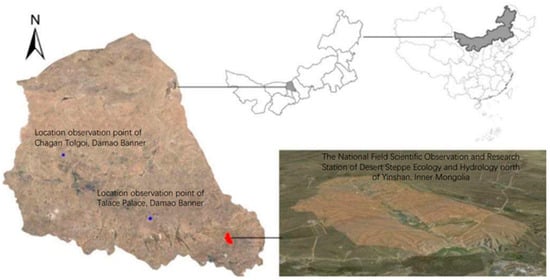
Figure 1.
Geographical location map of research stations and positioning observation points.
2.2. Climate Data
Meteorological data from the ENVIS meteorological station, produced by the IMKO company of Germany, were used to observe basic meteorological data in this study, such as wind direction and speed, total radiation, air temperature, humidity, precipitation, and others. The meteorological data for the growing season in the Xilamuren Desert Grassland in 2021 are shown in Figure 2. The monthly mean rainfall fluctuation range in the entire growth season (May–October) is 8.6–38.1 mm and the total rainfall is 144.3 mm; July accounts for 27% of the total. The monthly mean relative humidity fluctuation ranges from 40.13 to 62.92%, the net radiation ranges from 53.74 to 131.69 W·m−2, and the temperature ranges from 8.61 to 19.72 °C, all of which show a parabolic change from increase to decrease. The maximum rainfall, relative humidity, net radiation, and temperature appear in July and August, whereas, the wind speed in July and August reaches a trough. Extreme gale weather occurs from May to June, with higher wind speeds than those in July and August.
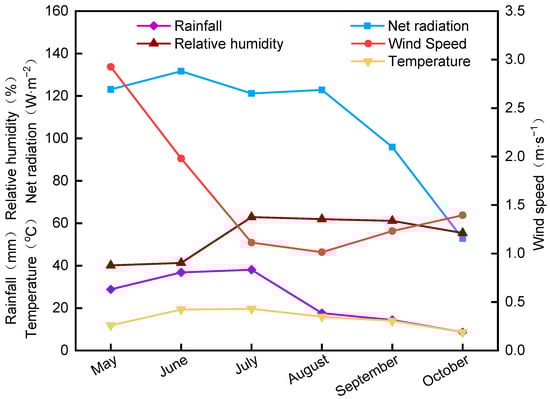
Figure 2.
Meteorological data during herb growing season.
2.3. Method
A photosynthetic apparatus, a Large aperture scintillator (LAS), and an Eddy-covariance system (EC) were used to monitor and calculate the ET at different scales. The instrument locations and detailed information are shown in Figure 3 and Table 1.
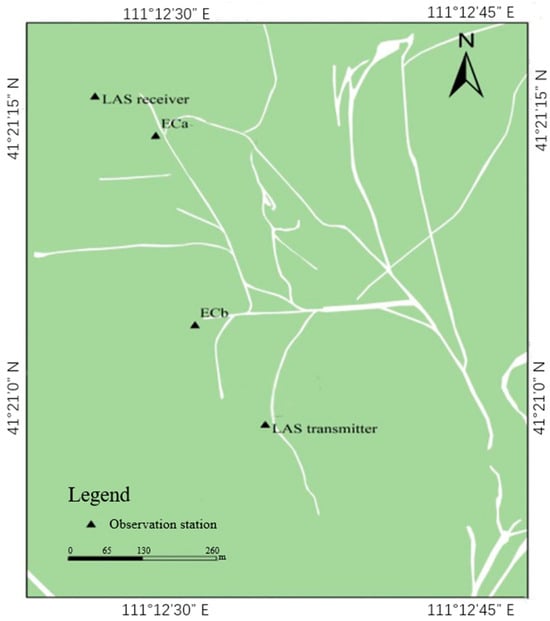
Figure 3.
Instrument locations.

Table 1.
Tools and apparatus used for ET estimation at different scales.
2.3.1. Microscale
The photosynthetic and transpiration of L. chinensis, a dominant grass species in the Xilamuren Desert steppe, was measured during the growing season using an automatic photosynthetic apparatus (LCPro+, made in England) on four typical days at different growth stages from May to October 2021. There were five quadrats in the observation area, and three stable values were observed once an hour from sunrise to sunset. The measurement position was located in the middle of the blade. During the measurement, the target blade was kept perpendicular to the sun to ensure that the blade always remained in a natural state.
2.3.2. Point-Scale
- Measurement
In recent years, the Eddy-covariance system has been considered a precise instrument for measuring ET in a small-scale range and a fixed-point device for measuring meteorological elements, water, and heat flux on uniform and flat underlying surfaces. With the rapid development of Eddy-covariance technology in different fields, measuring the sensible heat flux on a point-scale has become relatively easy, accurate, and reliable. In this experiment, two sets of Eddy-covariance systems were produced by the Licor Company in the United States. The installation height was 2 m, and the sampling frequency was 10 Hz. Each set was equipped with an LI-7500A infrared gas analyzer and an R3-50 ultrasonic three-dimensional anemometer to observe the canopy carbon dioxide and water flux. The Eddy-covariance system obtains the turbulent flux by measuring and calculating the covariance between the fluctuating values of temperature, carbon dioxide, water, other related physical quantities, and vertical wind speed. The average upward flux F of fluid substance S per unit mass in fully developed turbulence is [27]
where F represents the flux of a certain substance, ρa represents the air density, represents the average value of air density, w represents vertical wind speed, s represents physical properties such as density and temperature, (-) represents average value, and (,) represents fluctuating value.
Because the average value of vertical wind speed is small. Vertical advection can be ignored, and only turbulent flux is considered. Then the equation is shown as
Based on the above theoretical formulas, the formula for calculating sensible heat flux (H) and latent heat flux (LE) can be derived as follows [27],
where T’ and w‘ are temperature fluctuation and specific humidity fluctuation respectively; cp is constant pressure specific heat; and ρa is air density. The λ ET is the latent heat flux (W·m−2); ET is evapotranspiration capacity (kg·m−2·s−1); λ is the latent heat of vaporization of water (J·kg−1); q’ is the fluctuation value of specific humidity; and w’q’ represents the correlation between vertical wind speed and specific humidity fluctuations variance.
Based on the above theoretical assumptions, owing to the influence of weather, instrument systems, human activities, and instrument defects, flux observation data will produce certain errors. Therefore, it is necessary to correct and process the flux calculation results after obtaining the original data. Because the vorticity data of the research station were processed and corrected using Eddy Pro 7.0.9, this study only eliminated some abnormal values of the data and analyzed the energy closure problem.
- Energy closure analysis
Surface energy balance is the redistribution of solar radiation in an ecosystem. The degree of energy balance is not only an evaluation of the energy distribution but also a standard for detecting the reliability of turbulent flux data. However, in actual observed vorticity data, owing to the loss of low- and high-frequency signals of the instrument itself, observation errors, unsatisfactory observation conditions, calculation errors of energy storage items, and other problems, the observed values usually exhibit energy nonclosure, resulting in different degrees of errors in the observation indicators. The degree of energy closure of the observed data directly affects the reliability of the data; therefore, the evaluation of the data quality and reliability of the Eddy-covariance system is a common concern in the flux field.
At present, the accuracy of observational data of Eddy-covariance systems according to the closure of the energy balance has been widely used by scholars worldwide. The specific calculation process is as follows [28,29]:
where G is soil heat flux, and downward transport takes a positive value (W∙m−2); Rn is net solar radiation (W∙m−2); H is sensible heat flux, and upward transport takes a positive value (W∙m−2); LE represents the latent heat flux, and upward transport takes a positive value (W∙m−2); and S is the canopy heat storage term, which will greatly affect the energy balance when the canopy height reaches 8 m. The research object was natural grassland, and the canopy height was low. Therefore, this term could be ignored, and Q is the sum of additional energy sources and sinks, which could also be ignored because the value was very small. Therefore, the above equation can be abbreviated as
where (Rn − G) is referred to as effective energy and (LE + H) is referred to as turbulent flux. Energy balance implies that the effective energy is equal to the turbulent flux; otherwise, there is an energy imbalance.
In this experiment, linear regression was used to quantitatively evaluate the energy closure of natural grasslands in the Xilamuren Desert steppe. Turbulent flux (LE + H) and effective energy (Rn − G) were linearly regressed. When the regression slope is 1 and the intercept is 0, the energy is completely closed, i.e., the more accurate the observed sensible and latent heat fluxes. Figure 4 and Table 2 show the energy closure of the 1 h data of the Eddy-covariance system from May to October 2021. The energy closure of ECa was lower than that of ECb, the slope of the linear regression of the two pieces of equipment was <1, and the intercept was slightly greater than 0, indicating that the Eddy-covariance system may have underestimated the turbulent energy. Many scholars have proven this conclusion through the flux analysis of each underlying surface. Li et al. [30] evaluated the energy closures of eight stations in the Chinese flux network. The regression determination coefficient ranged from 0.51 to 0.93 with an average of 0.77, and the regression slope ranged from 0.54 to 0.88 with an average of 0.73. Compared to other studies on vorticity sites, although the energy closure did not reach a perfect level, it was within a reasonable range.
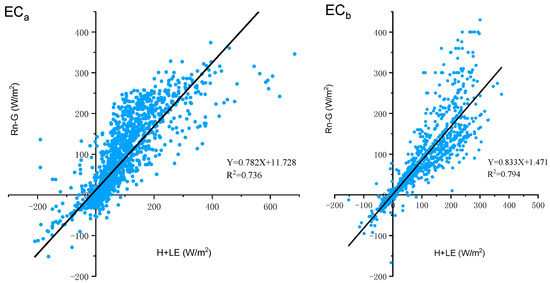
Figure 4.
Correlation between 1 h turbulent energy and effective energy in the growing season.
Table 2.
Energy closure of vorticity-dependent systems.
- Point-scale ET
The measured data of the Eddy-covariance system were energy values. In this study, ET (EC) was calculated by the energy balance residual method, and the specific equations are as follows [31,32]:
where L = 2.454 × 10⁶ (W·m−2·mm−1) and EET is ET (mm).
2.3.3. Surface-Scale
- Measurement
In this experiment, the observed value of an LAS was used to represent the measured area-scale ET value. The LAS used in this study, including the transmitter and receiver, was manufactured by Avalon, USA. Its aperture is 0.15 m, the emission wavelength is 880 nm, the optical path length is 800 m, and the height from the ground is 6 m. The principle is that the transmitter emits a beam with a certain wavelength (near-infrared band) and diameter, and the receiver receives the beam. During this period, the beam propagated through the atmosphere, and its path was affected by temperature, humidity, and pressure fluctuations. The refractive index structure parameter (Cn2) represents the atmospheric turbulence intensity, and the air refractive index structure parameter was calculated after humidity correction. First, the temperature structure parameter (CT2) related to sensible heat flux was determined and then combined with the EC instrument. Meteorological data and underlying surface conditions, the average sensible heat flux along the entire optical path, and the relationship between them were calculated according to the Monin–Obukhov similarity theory [33]. The calculation process involved meteorological data, the observation height of the meteorological station, the vegetation canopy height of the underlying surface, the Bowen ratio, and the vorticity-related system data. The main equations for calculating the sensible heat flux are as follows [34,35]:
where D is the diameter of the emitted beam; L is the optical path length; is the optical path height of the scintillator; is the observation height of the wind speed; is the dynamic roughness; d is zero plane displacement; ρ is the air density; β is the Bowen ratio; P is atmospheric pressure; Cp is specific heat of air at constant pressure; is sensible heat flux; LM is Moning−Obukhov length; k is the Karman constant; T* is the friction temperature; u* is the friction velocity; is the momentum stability correction function; and is the stability universal function.
- Data processing
The brief iteration process of sensible heat flux obtained by LAS was as follows: (1) the effective height was calculated deducting zero plane displacement; (2) atmospheric stability was determined (calculations included parameters such as water vapor pressure, specific humidity, dew point temperature, etc.); (3) temperature and humidity dependent coefficients of the refractive index were calculated; (4) temperature refraction structure parameters of air were calculated; (5) wild points were eliminated; (6) initial stability was calculated; and (7) iterative calculation was started to calculate sensible heat flux (H). When screening the original data, it was necessary to eliminate the time period and daytime oversaturation that significantly impacted the data. For example, the rainfall period has a significant impact on the data. The sensible heat flux iteration process was performed using MATLAB (2014). Data processing and analyses were performed using Excel, Origin, and other software packages. The instrument source area was generated using Surfer software.
2.4. Scale Transformation of ET
Based on the experimental data and considering the influence of the actual climate, terrain, vegetation, and soil moisture in the study area, this study proposes a spatial scale expansion method for applying the “leaf” observation results to the “surface,” which has a theoretical basis and is convenient for application. The transpiration rate observed at the microscale was used to obtain the vegetation transpiration per unit area through unit conversion (Equation (18)). Combined with the measured soil evaporation, the “point” scale ET could be obtained, and the transpiration rate measured at different locations in the study area could be used to obtain the ET of the corresponding area, and the relationship (Equation (19)) could be used to obtain the ET of the “area” scale [36].
The leaf transpiration rate is reported in mmol·m−2·s−1. To apply the “leaf” observation results to the “surface,” the vegetation transpiration per unit area must first be determined, and the unit converted into mm·h−1. The research object of vegetation transpiration is H2 O, and the unit conversion process is as follows.
1 molM (H2O) = 18 g
For H2O 1 mol = 18 g, 1 mmol = 18/1000 g,
1 mmol·m−2·s−1 = 18/1000 g·m−2·s−1
1 g·m−2·s−1/ρH2O = 10−3 mm·s−1
For H2O 1 g·m−2·s−1 = 10−3 mm·s−1
1 g·m−2·s−1 = 3.6 mm·h−1
Combining Equations (15) and (17), the result is:
1 mmol·m−2·s−1 = 0.065 mm·h−1.
Then the spatial scale theoretical enhancement model from the micro- to surface- scale constructed on the Shiramuren Desert Grassland is shown as follows:
where ETsurface is the ET at the surface-scale (mm·h−1); ET0 is the reference crop ET (mm·h−1); Tm is the transpiration rate (mmol·m−2·s−1); E is soil evaporation (mm·h−1); a and b are different positions in the area, and 0.065 is the transformation coefficient; W is the weight coefficient at each position; Wmax is the weight coefficient at the center position in the area; and Kc is the crop coefficient, and 0.065 is the transformation coefficient. It is worth noting that this equation was proposed in the context of the uniform underlying surface of the Xilamuren Desert steppe; hence, the factor of the proportion of the underlying surface of each EC in the LAS source area was ignored. For non-uniform underlying and other surfaces, comprehensive consideration is required.
3. Results and Discussion
3.1. Microscale Variations in Crop Photosynthesis and Transpiration
The daily photosynthetic and transpiration rates under natural conditions for four typical days during the L. chinensis growing season in 2021 are shown in Figure 5. The daily variations of the L. chinensis photosynthetic and transpiration rates in July and August (high-temperature months) were both bimodal curves, and their daily variation trends were similar. The first peaks both occurred before 10:00, and photosynthetic and transpiration rates decreased rapidly to a minimum at 13:00. The peak and valley photosynthetic and transpiration rates were 4.41 and 1.13 µmol·m−2·s−1, and 2.87 and 2.06 mmol·m−2·s−1 in July, and 4.28 and 1.17 µmol·m−2·s−1, and 2.18 and 1.72 mmol·m−2·s−1 in August, respectively. The difference between photosynthetic and transpiration rates is that the photosynthetic rate appears as a big “midday rest” phenomenon at 12:00–14:00, and the decreasing range in the transpiration rate was smaller than that of the net photosynthetic rate. The second peak appeared around 16.00, and the peak photosynthetic and transpiration rates were 3.16 µmol·m−2·s−1 and 2.43 mmol·m−2·s−1 in July and 4.79 µmol·m−2·s−1 and 1.89 mmol·m−2·s−1 in August.
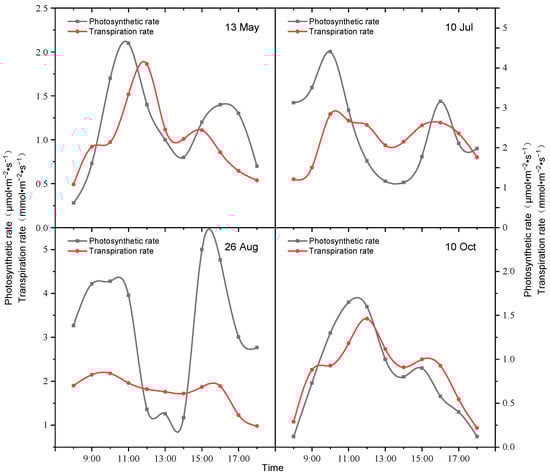
Figure 5.
Diurnal variation trends in photosynthetic and transpiration rates on different typical days during the Leymus chinensis growing season.
In May and October, when the temperature was moderate, the diurnal changes in the photosynthetic and transpiration rates of L. chinensis exhibited bimodal curves. The photosynthetic rate increased rapidly from 08:00 to 11:00 and reached a high peak around 11:00, with peak values of 2.1 µmol·m−2·s−1 in May and 1.65 µmol·m−2·s−1 in October. The transpiration rate reached a maximum at approximately 12:00 and reached peak values of 1.86 mmol·m−2·s−1 in May and 1.16 mmol·m−2·s−1 in October. Subsequently, the photosynthetic and transpiration rates were decreased to their minimum values.
3.2. Point-Scale ET Variation
Based on the measured 1 h data of the Eddy-covariance system, the daily ET at the point-scale in the Xilamuren Desert steppe during the 2021 growing season was calculated (Figure 6). The daily ET fluctuated in the range of 0.38–3.15 mm·d−1 throughout the entire growing season, with a large diurnal variation range. The maximum ET occurred on July 30, and the minimum occurred on 30 June. During the growing season, the daily average ET was 1.366 mm·d−1, and the total ET was 251 mm. ET exhibited clear seasonal variations. The maximum monthly ET occurred in July (47.71 mm m−1), and the daily ET varied slightly in October, ranging from 0.38 to 3.15 mm·d−1. The minimum monthly ET occurred in October (30 mm m−1), and daily ET varied considerably, ranging from 0.12 to 1.73 mm·d−1. Overall, ET varied parabolically from May to October (Figure 7).
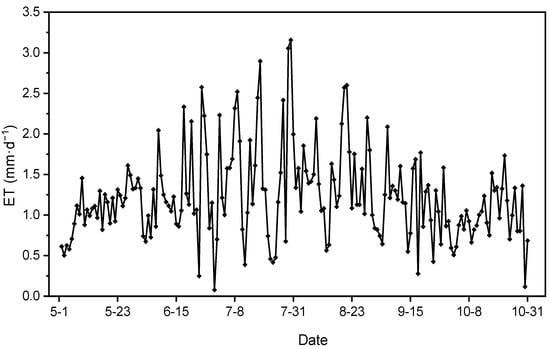
Figure 6.
Daily point-scale evapotranspiration changes.
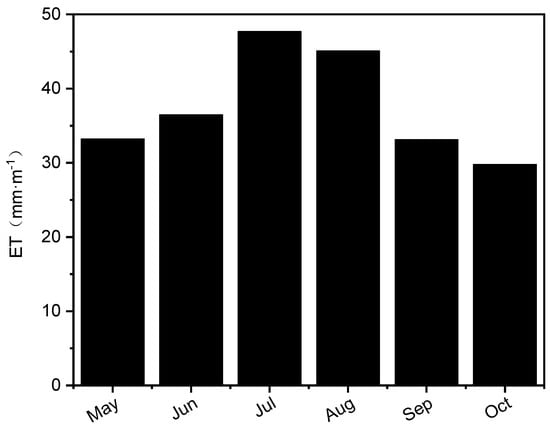
Figure 7.
Monthly point-scale evapotranspiration changes.
3.3. Evaporation Surface-Scale Change Rule
3.3.1. Daily Variation Rule
Surface-scale ET was calculated using the energy balance remainder method (LAS). As shown in Figure 8, except for unusual circumstances such as instrument failures and extreme weather, the daily changes obtained by monitoring LASs were consistent with those of the Eddy-covariance system. The daily ET measured by the LAS during the whole growing season ranged from 0.41 to 3.39 mm·d−1 with large variation amplitude. The maximum ET appeared in July, the daily average ET observed in the growing season was 1.599 mm·d−1, and the total accumulated ET was 294 mm. The daily ET also showed a seasonal change trend, first increasing and then decreasing. However, the accumulated ET measured using the LAS was 17% higher than that measured using the EC.
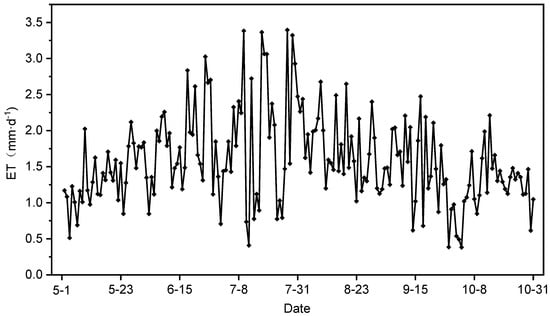
Figure 8.
Daily surface-scale evapotranspiration changes.
3.3.2. 24-h Variation Rule
To explore the rule of 24 h ET, 13 May in the early growth stage, 10 July in the peak growth stage, 26 August in the stable growth stage, and 20 October in the late growth stage were selected as typical days for the study.
Figure 9 shows that the hourly ET on different typical days first increased and then decreased. On each typical day, the ET was relatively low at night, and the peak appeared between 12:00 and 14:00. On 13 May, the ET suddenly occurred at approximately 07:00 and then began to increase. The ET reached a peak of 0.15 mm·h−1 at 12:00, followed by a downward trend, and the daily accumulated ET was 1.57 mm. On 10 July, the ET was the highest and suddenly surged at sunrise (approximately 06:00); the highest value was 0.29 mm·h−1, and the daily accumulated ET was 2.33 mm. The changes on 26 August and 10 July were essentially the same, but the daily ET was lower. On 20 October, the ET change was relatively small, and the ET remained low; the highest ET was 0.14 mm·h−1, and the daily accumulated ET was 1.13 mm.
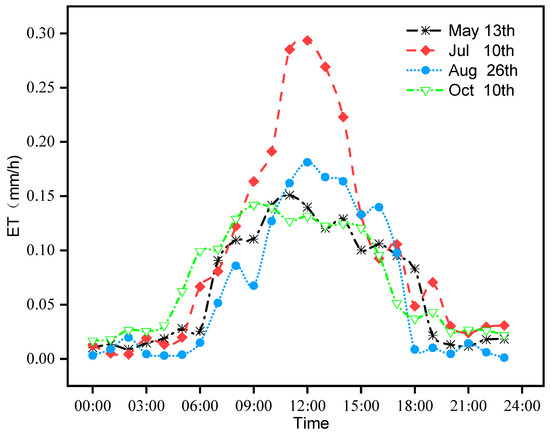
Figure 9.
Comparison of evapotranspiration on different typical days.
3.4. Discussion
3.4.1. Impacting Factors for Microscale ET
At the microscale, the diurnal variation trends in photosynthesis and transpiration of L. chinensis were consistent on different typical days. In July and August, at high temperatures, the diurnal changes in the photosynthetic and transpiration rates of L. chinensis were mainly affected by photosynthetic active radiation [37,38]. Under appropriate temperature and CO2 supply conditions, the photosynthetic rate increased rapidly with an increase in effective radiation [39]. During this period, the photosynthetic rate exhibited a “midday rest” from 12:00 to 14:00. On the one hand, this phenomenon was caused by the rapid temperature increase during this period, which resulted in a high temperature and the transpiration of leaves. To prevent excessive water loss, many leaf stomata close, resulting in an insufficient CO2 supply [40]. On the other hand, as the effective photosynthetic radiation reached its peak at approximately 12:00, photoinhibition occurred and the photosynthetic rate of L. chinensis decreased rapidly [41]. During the phenomenon of a “midday rest”, the transpiration rate was slightly lower than the photosynthetic rate. In July and August, the photosynthetic rate of L. chinensis was higher than the transpiration rate except during the “lunch break” period, indicating that material accumulation occurred in this stage. Diurnal changes in the photosynthetic and transpiration rates of L. chinensis in May and October were mainly affected by effective photosynthetic radiation and temperature. In May, the photosynthetic rate of L. chinensis was higher than the transpiration rate during most periods, indicating that material accumulation occurred during this stage. In October, the photosynthetic rate of L. chinensis was lower than the transpiration rate during most periods, indicating that material consumption occurred during this stage.
3.4.2. Impacting Factors for Point-Scale ET
Similar to the research of Wang et al. [6] and Zhu et al. [42], the characteristics of water consumption in desert steppes were inevitably related to meteorological factors during the growing season. Statistical analysis of the meteorological data showed that rainfall, relative humidity, net radiation, and temperature all peaked in July and August, which directly led to a higher ET than in the other months. If only wind speed is considered, it is positively correlated with ET [43]. Due to the extreme gale weather in May and June 2020, the wind speed was higher than that in July and August; therefore, the ET in June was almost the same as that in August (Figure 10). If only the relative humidity is considered, it is negatively correlated to ET [44]. However, under the combined effect of other meteorological factors, the relative humidity in July and August was higher than that in other months, but the ET was still high.
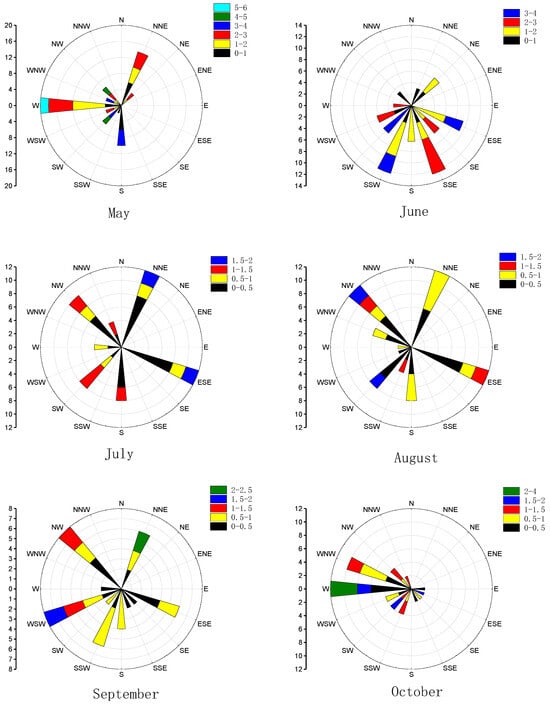
Figure 10.
Wind direction and speed during the natural grassland growing season from May to October.
3.4.3. Micro-to-Surface Spatial Scale Expansion
The scale effect of ET usually refers to the dependence of the ET change on the size of the sampling grid and the length of the sampling timescale. At a certain sampling scale, only the corresponding change rules and characteristics were revealed. In addition, a complex nonlinear relationship exists between multiscale ET. Scale expansion is a process based on the understanding of ET-related processes at different space-time scales to establish the relationship between ET at different space-time scales through appropriate methods and means, and to determine the mutual deduction of multi-scale ET [10,45].
The ET at the surface-scale from the observed transpiration rate of L. chinensis on different typical days was calculated, and the measured values were used to verify the feasibility of the method. Figure 11 and Table 3 present a comparison and statistical analysis of the calculated values on different typical days with the measured LAS results. Figure 11 shows that the calculated ET values were underestimated on different days, i.e., it was approximately 30% lower than the measured value, which was related to the underestimation of the calculated value from the point to the surface. However, the changing trend of both these values was the same overall on different typical days, and the overall trend can better reflect the surface-scale ET change.
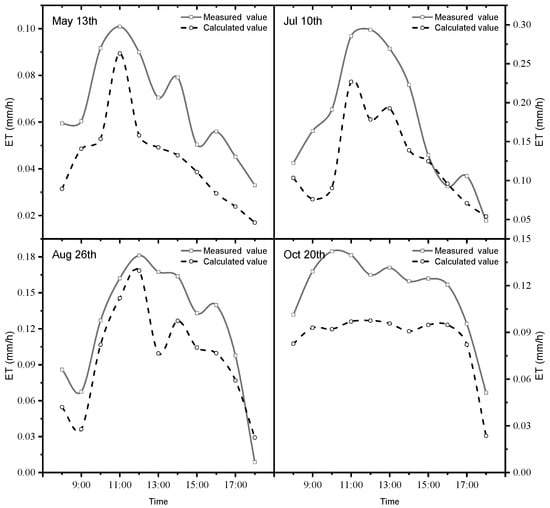
Figure 11.
Calculated values by scaling compared to LAS-measured values.
Table 3.
Statistical analyses of calculated values of scale extension and LAS measured values.
Research on scale conversion plays an important role in evaluating ecosystem service values. Current research on the expansion of ET space-scale applications mainly focuses on the multiscale evaluations of water-use efficiency and the benefits of the underlying surface [46]. The conversion system is gradually becoming a hot topic, and the conclusions of this study are expected to assist industries conducting in-depth research on ecosystem ET.
Some researchers believe that the absolute values of the light scintillation intensity and sensible heat flux at night are small because the sensible heat flux observed by the LAS depends on the calculation of the similarity theory. The measurement error of the LAS is large [47]. The LAS cannot be applied when the atmosphere is in a stable stratification state (typically at night). However, according to our study, the observation result of the LAS was relatively stable during the observation period of May–October, both in the daytime and at night, and the LAS also obtained relatively accurate results under stable atmospheric stratification.
The expansion process of the measured ET from the microscopic to the surface-scale constructed in this study has a reference value, thus, establishing the relationship between the micro-, point-, and surface-scale observations of the natural grassland in the Xilamuren Desert steppe, and determining ET evaluation at different scales.
4. Conclusions
This study focused on the natural grasslands of the Xilamuren Desert steppe in the Inner Mongolia Autonomous Region. Using photosynthetic meters, EC techniques, and LSAs as the primary technical means in conjunction with a meteorological environment monitoring station at the research site, an analysis of ET variation patterns at the micro-, point-, and area scales was conducted. Moreover, a scaling model for ET from micro- to area scales was established.
At the microscale, the daily variations in photosynthesis and transpiration of L. chinensis exhibited a consistent trend on different representative days, while the daily variations in photosynthetic and transpiration rates for alkalium both showed a bimodal curve with peaks around 10:00 and 16:00 and a trough around 13:00 in July and August with a high temperature. Photosynthetic rates exhibit a pronounced “noon break” between 12:00 and 14:00, and transpiration rates experience a slightly less pronounced “noon break.” However, in May and October, with moderate temperatures, transpiration rates for L. chinensis remained relatively high between 8:00 and 18:00, whereas photosynthetic rates were slightly lower than those in other months. L. chinensis was in the material accumulation phase in May, and in the material consumption phase in October.
At the point-scale, the daily ET values fluctuated from 0.38 to 3.15 mm·d−1 during the growing season, with a big interdiurnal variation. The average daily ET value during the growing season was 1.366 mm·d−1 and the total accumulated ET was 251 mm. The ET exhibited obvious seasonality. October had the lowest total ET (<30 mm·mon−1) and the smallest interdiurnal variation, and July had the highest total ET (47.71 mm·mon−1) and significant interdiurnal variation. Due to meteorological factors, seasonal differences in ET were substantial. Overall, they exhibited a parabolic trend characterized by an initial increase followed by a decrease.
The daily variation trends obtained from LSA monitoring and EC systems were generally consistent, indicating that LSAs are highly applicable to natural grasslands in desert steppes. However, the LAS-measured values were slightly higher than those measured by the EC systems. At the surface-scale, the daily ET values measured by the LAS during the entire growing season ranged from 0.41 to 3.39 mm·d−1, with big interdiurnal variation. The average daily ET during the growing season was 1.599 mm·d−1 and the total accumulated ET was 294 mm. The cumulative measured ET at the area scale was 17% larger than that at the point-scale and exhibited a similar parabolic trend of an initial increase followed by a decrease.
Based on the experimental data, and taking into account the influence of various factors in the study area, we propose a theoretically grounded and easily applicable spatial scaling method for extending “leaf” observation results to the “area” level under uniform underlying surface conditions. Specifically, the transpiration rate obtained from “leaf” scale observations is converted into vegetation ET per unit area, and by combining it with soil evaporation values measured by other equipment, the “point” scale ET can be determined. Transpiration rates measured at different locations in the study area can be used to calculate the corresponding regional ET, and the “area” scale ET can then be derived using point-area scaling relationships. Therefore, the results of this study are of great significance for estimating evapotranspiration at different scales in a desert steppe using limited observations. At the same time, this study performs a good conversion relationship by considering the climate, topography, plant, and soil water, which fills the gap in scale conversion of ET estimation in a desert steppe. In the future, various underlying surfaces can be considered to verify the applicability of the conversion method.
Author Contributions
Conceptualization, Conceptualization, P.T. and L.H.; Methodology, J.G.; Formal analysis, Y.Z.; Resources, B.W.; Data curation, L.H.; Writing—original draft, J.G. and X.G.; Writing—review & editing, P.T.; Project administration, J.W. All authors have read and agreed to the published version of the manuscript.
Funding
This research was supported by project from Yinshanbeilu Grassland Eco-hydrology National Observation and Research Station, China Institute of Water Resources and Hydro-power Research (YSS2022007), Technical Demonstration of Collaborative Utilization of Water-Soil-Plant Resources System in Ecological Agriculture and Animal Husbandry Area, Grant No. 2021CG0012. Research and integrated demonstration of key technologies for seedling preservation, rain storage, supplementary irrigation and steam reduction in dryland agriculture in eastern Mongolia, Grant No. 2023YFDZ0075, Nature Science Foundation of Inner Mongolia (2022MS05047) and Higher Education Youth Science and Technology Talent Development Project of Inner Mongolia (NJYT23083). The contributions of the editor and anonymous reviewers whose comments and suggestions significantly improved this article are also appreciated.
Data Availability Statement
Data are contained within the article.
Acknowledgments
The authors would like to thank the editor and all the reviewers for their in-sightful comments and constructive suggestions.
Conflicts of Interest
The authors declare no conflict of interest.
References
- Yang, F.; Ji, Y.Q.; Zhang, Y.C.; Bridge, R.S.; Shen, Y.J. Comparative advantages of Large Aperture Scintillometer and Eddy Covariance instrument for measuring evapotranspiration in irrigated farmlands. Chin. J. Eco-Agric. 2011, 19, 1067–1071. [Google Scholar] [CrossRef]
- Kutikoff, S.; Lin, X.; Evett, S.; Gowda, P.; Moorhead, J.; Marek, G.; Colaizzi, P.; Aiken, R.; Brauer, D. Heat storage and its effect on the surface energy balance closure under advective conditions. Agric. For. Meteorol. 2019, 265, 56–69. [Google Scholar] [CrossRef]
- Koch, S.E.; Aksakal, A.; McQueen, J.T. The influence of mesoscale humidity and evapotranspiration fields on a model forecast of a cold-frontal squall line. Mon. Weather. Rev. 1997, 125, 384–409. [Google Scholar] [CrossRef]
- Bastiaanssen, W. SEBAL-based sensible and latent heat fluxes in the irrigated Gediz Basin, Turkey. J. Hydrol. 2009, 229, 87–100. [Google Scholar] [CrossRef]
- Yin, Y.T.; Hou, X.Y.; Yun, X.J. Advances in the climate change influencing grassland ecosystems in Inner Mongolia. Pratacultural Sci. 2011, 28, 1132–1139. [Google Scholar]
- Wang, J.; Zhang, R.Q.; Ling, H.P.; Lu, H.Y.; Cao, X.S.; Liu, R.C. Relationship between water consumption and meteorology-vegetation parameters in the desert grassland on different time scales. Agric. Res. Arid. Areas 2020, 38, 152–158+167. [Google Scholar]
- Zhang, B.Z.; Xu, D.; Liu, J.; Chen, H. Review of multi-scale evapotranspiration estimation and spatio-temporal scale expansion. Trans. Chin. Soc. Agric. Eng. 2015, 31, 8–16. [Google Scholar]
- Zhang, B.Z.; Liu, J.; Xu, D.; Cai, J.B.; Wei, Z. Water Carbon Coupling Simulation of Leaf and Canopy Scales in Summer Maize. Chin. Sci. Bull. 2013, 58, 1121–1130. [Google Scholar]
- Yu, G.R.; Zhuang, J.; Yu, Z.L. An attempt to establish a synthetic model of photosynthesis-transpiration based on stomatal behavior for maize and soybean plants grown in field. J. Plant Physiol. 2001, 158, 861–874. [Google Scholar] [CrossRef]
- Xu, D. Review on scaling study in irrigation hydrology. J. Hydraul. Eng. 2006, 37, 141–149. [Google Scholar]
- Bowen, I.S. The ratio of heat losses by conduction and by evaporation from any water surface. Phys. Rev. 1926, 27, 77–789. [Google Scholar] [CrossRef]
- Thornthwaite, C.W. An approach toward a rational classification of climate: Geographical Review. Geogr. Rev. 1948, 38, 55–94. [Google Scholar] [CrossRef]
- Yang, Y.T.; Shang, S.H. Comparison of Dual-source Evapotranspiration Models in Estimating Potential Evaporation and Transpiration. In Evapotranspiration over Heterogeneous Vegetated Surfaces; Springer: Berlin/Heidelberg, Germany, 2015; Volume 28, pp. 15–29. [Google Scholar]
- Pasquill, F.; Smith, F.B. Atmospheric Diffusion, 3rd ed.; Wiley: New York, NY, USA, 1983; Volume 437. [Google Scholar]
- Evans, J.G.; Mcneil, D.D.; Finch, J.W.; Murray, T.; Harding, R.J.; Ward, H.C.; Verhoef, A. Determination of turbulent heat fluxes using a large aperture scintillometer over undulating mixed agricultural terrain. Agric. For. Meteorol. 2012, 166, 221–233. [Google Scholar] [CrossRef]
- Chen, J.W.; Zuo, H.C.; Wang, J.M.; Wang, S.J.; Chen, B.L.; Zhuang, S.W. Observation Study in Desert Homogeneous of Arid Region in Northwestern of China Using Large Aperture Scintillometers. Plateau Meteorol. 2013, 32, 8–9. [Google Scholar]
- Meijninger, W.; Beyrich, F.; Ludi, A.; Kohsiek, W. Scintillometer fluxes of sensible and latent heat over a heterogeneous area—A contribution to litfass-2003. Bound. -Layer Meteorol. 2005, 121, 89–110. [Google Scholar] [CrossRef]
- Zheng, N.; Zhang, J.S.; Meng, P.; Huang, H.; Gao, J.; Jia, C.R.; Ren, Y.F. Distribution of Flux Source Area and Footprint for the Scintillation Method over a Mixed Plantation in the Hilly Zone of the North China. Adv. Earth Sci. 2010, 25, 1175–1186. [Google Scholar]
- Gong, L.J.; Liu, S.M.; Shuang, X.; Cai, X.H.; Xu, Z.W. Investigation of Spatial Representativeness for Surface Flux Measurements with Eddy Covariance System and Large Aperture Scintillometer. Plateau Meteorol. 2009, 28, 246–257. [Google Scholar]
- Li, Y.; Jing, Y.S.; Qin, B.B. Characteristics of water and heat fluxes and its footprint climatology on farmland in low hilly region of red soil. Chin. J. Appl. Ecol. 2017, 28, 180–190. [Google Scholar]
- Zhu, M.J.; Zhao, Q.Y.; Liu, S.M.; Xu, Z.W.; Xu, T.R. Analysis of the Characteristics of Turbulent Flux and lts Footprint Climatology at an Agricultural Site. Adv. Earth Sci. 2013, 28, 1313–1325. [Google Scholar]
- Beyrich, F.; Bruin, H.A.R.D.; Meijninger, W.M.L.; Schipper, J.W.; Lohse, H. Results from one-year continuous operation of a large aperture scintillometer over a heterogeneous land surface. Bound.-Layer Meteorol. 2002, 105, 85–97. [Google Scholar] [CrossRef]
- Beyrich, F.; Leps, J.P.; Mauder, M.; Bange, J.; Foken, T.; Huneke, S.; Lohse, H.; Lüdi, A.; Meijninger, W.M.L.; Mironov, D.; et al. Area-Averaged surfacefluxes over the litfass Region Based on Eddy-Covariance Measurements. Bound.-Layer Meteorol. 2006, 121, 33–65. [Google Scholar] [CrossRef]
- Zhang, J.S.; Meng, P.; Zheng, N.; Huang, H.; Gao, J. The Feasibility of Using LAS Measurements of the Sensible Heat Flux from a Mixed Plantation in the Hilly Zone of the North China. Adv. Earth Sci. 2010, 25, 1283–1290. [Google Scholar]
- Lagouarde, J.P.; Bonnefond, J.M.; Kerr, Y.H.; McAneney, K.J.; Irvine, M. Integrated Sensible Heat Flux Measurements of a Two-Surface Composite Landscape using Scintillometry. Bound. -Layer Meteorol. 2002, 105, 5–35. [Google Scholar] [CrossRef]
- Lu, L.; Liu, S.M.; Xu, Z.W.; Bai, J.; Wang, J.M. The Scale Relationship of Sensible Heat Flux Measured by Large Aperture Scintillometer and Eddy Covariance System. Adv. Earth Sci. 2010, 25, 1273–1282. [Google Scholar]
- Swinbank, W.C. Measurement of vertical transfer of heat and water vapor by eddies in the lower atmosphere. J. Meteorol. 1951, 8, 135–145. [Google Scholar] [CrossRef]
- Mahrt, L. Flux sampling errors for aircraft and towers. J. Atmos. Ocean. Technol. 1998, 15, 416–429. [Google Scholar] [CrossRef]
- Gao, H.B.; Shao, M.A. Heat storage fluxes of spring wheat during growth periods in the oasis farmland in Heihe Basin. J. Irrig. Drain. 2015, 34, 33–40, 90. [Google Scholar]
- Li, Z.Q.; Yu, G.R.; Wen, X.F.; Zhang, L.M.; Ren, C.Y.; Fu, Y.L. Evaluation of the Energy Balance Closure of the China Flux Observation Network (ChinaFLUX). Sci. Sin. (Terrae) 2004, 34, 46–56. [Google Scholar]
- Oliphant, A.J.; Grimmond, C.S.B.; Zutter, H.N.; Schmid, H.P.; Su, H.-B.; Scott, S.L.; Offerle, B.; Randolph, J.C.; Ehman, J. Heat storage and energy balance fluxes for a temperate deciduous forest. Agric. For. Meteorol. 2004, 126, 185–201. [Google Scholar] [CrossRef]
- Jaime, A.R.; Philipp, B.; Peter, B. Ground energy balance for borehole heat exchangers: Vertical fluxes, groundwater and storage. Renew. Energy 2015, 83, 1341–1351. [Google Scholar]
- Bai, J.; Liu, S.M.; Ding, X.P.; Lu, L. A study of the processing method of large aperture scintillometer observation data. Adv. Earth Sci. 2010, 25, 1148–1165. [Google Scholar]
- Wang, T.; Ochs, G.R.; Clifford, S.F. A saturation resistant optical Scintillometer to measure Cn2. J. Opt. Soc. Am. 1978, 68, 3334–3338. [Google Scholar] [CrossRef]
- Wesely, M.L. The combined effect of temperature and humidity fluctuation on refractive index. J. Appl. Meteorol. 1976, 15, 43–49. [Google Scholar] [CrossRef]
- Hao, L.; Tang, P.C.; Li, X.Y.; Xu, B.; Hou, C.L.; Li, P.D.; Tian, D.L. Law of evapotranspiration at different scales and optimization of scale relationship in Xilamuren desert steppe. J. Northeast. Agric. Univ. 2022, 53, 17–25. [Google Scholar]
- Yu, L.; Cheng, J.M.; Wan, H.E. Daily Variation of Photosynthetic Rate and lts Influence Factors on Onobrvchis viciaefolia Seedlings. Bull. Soil Water Conserv. 2012, 32, 66–70. [Google Scholar]
- Dong, Z.; Ma, Y.F.; Li, H.L.; Ren, G.Y.; Zhang, H. Analysis on Diurnal Changes of Photosynthesis and Transpiration Rate and Effecting Factors of Four Alfalfa at Branching Stage. Chin. J. Grassl. 2009, 31, 67–71. [Google Scholar]
- Yuan, D.H.; Jin, Z.F.; Jing, Y.S.; Hong, Y. Diurnal Change of Photosynthetic Rate of Myrica Rubra and Relationship with Climate Ecology Factors. Bull. Sci. Technol. 2010, 26, 560–562. [Google Scholar]
- Zhu, W.Z.; Wang, J.X.; Xue, J.H.; Yan, W.X. Studies on the Physiological Characteristics of Photosynthesis of Alnus cremastogyme. J. Southwest For. Univ. (Nat. Sci.) 2001, 21, 196–204. [Google Scholar]
- Huang, G.H.; Liang, K.N.; Zhou, Z.Z.; Ma, H.M. Diurnal and seasonal photosynthetic characteristics and influencing factors in teak clones. J. Cent. South Univ. For. Technol. 2016, 36, 11–16. [Google Scholar]
- Zhu, G.L.; Tong, S.Z.; Zhao, C.Z. Spatio-temporal variation of reference crop evapotranspiration and its climatic mechanism in Nenjiang River Basin, China. Chin. J. Appl. Ecol. 2022, 33, 201–209. [Google Scholar]
- Liu, G.S.; Liu, J.; Cai, J.B.; Xu, D. Study on scale effect of farmland evapotranspiration and relationship with meteorological factors. J. Hydraul. Eng. 2011, 42, 284–289. [Google Scholar]
- Liu, H.; Zhang, Q.L. Characteristics of evapotranspiration in Larix melinii forest during growing seasons. J. Cent. South Univ. For. Technol. 2021, 41, 149–156. [Google Scholar]
- Cui, Y.L.; Dong, B.; Li, Y.H.; Cai, X.L. Assessment indicators and scales of water saving in agricultural irrigation. Trans. Chin. Soc. Agric. Eng. 2007, 23, 1–7. [Google Scholar]
- Sun, B.D.; Cui, L.J.; Li, W.; Kang, X.M.; Zhang, M.Y. A review of spatial-scale transformation in wetland ecosystem service evaluation. Acta Ecol. Sin. 2018, 38, 2607–2615. [Google Scholar]
- Hu, L.Q.; Wu, R.Z.; Fang, Z.Y. Large Aperture Scintillometer and its Application to Surface Energy Balance Monitoring. J. Appl. Meteorol. Sci. 2003, 14, 197–205. [Google Scholar]
Disclaimer/Publisher’s Note: The statements, opinions and data contained in all publications are solely those of the individual author(s) and contributor(s) and not of MDPI and/or the editor(s). MDPI and/or the editor(s) disclaim responsibility for any injury to people or property resulting from any ideas, methods, instructions or products referred to in the content. |
© 2024 by the authors. Licensee MDPI, Basel, Switzerland. This article is an open access article distributed under the terms and conditions of the Creative Commons Attribution (CC BY) license (https://creativecommons.org/licenses/by/4.0/).