


Potential Pollution Loads of the Cikembar Sub-Watershed to the Cicatih River, West Java, Indonesia
 ,
,  ,
,  , and
, and
Abstract
1. Introduction
2. Materials and Methods
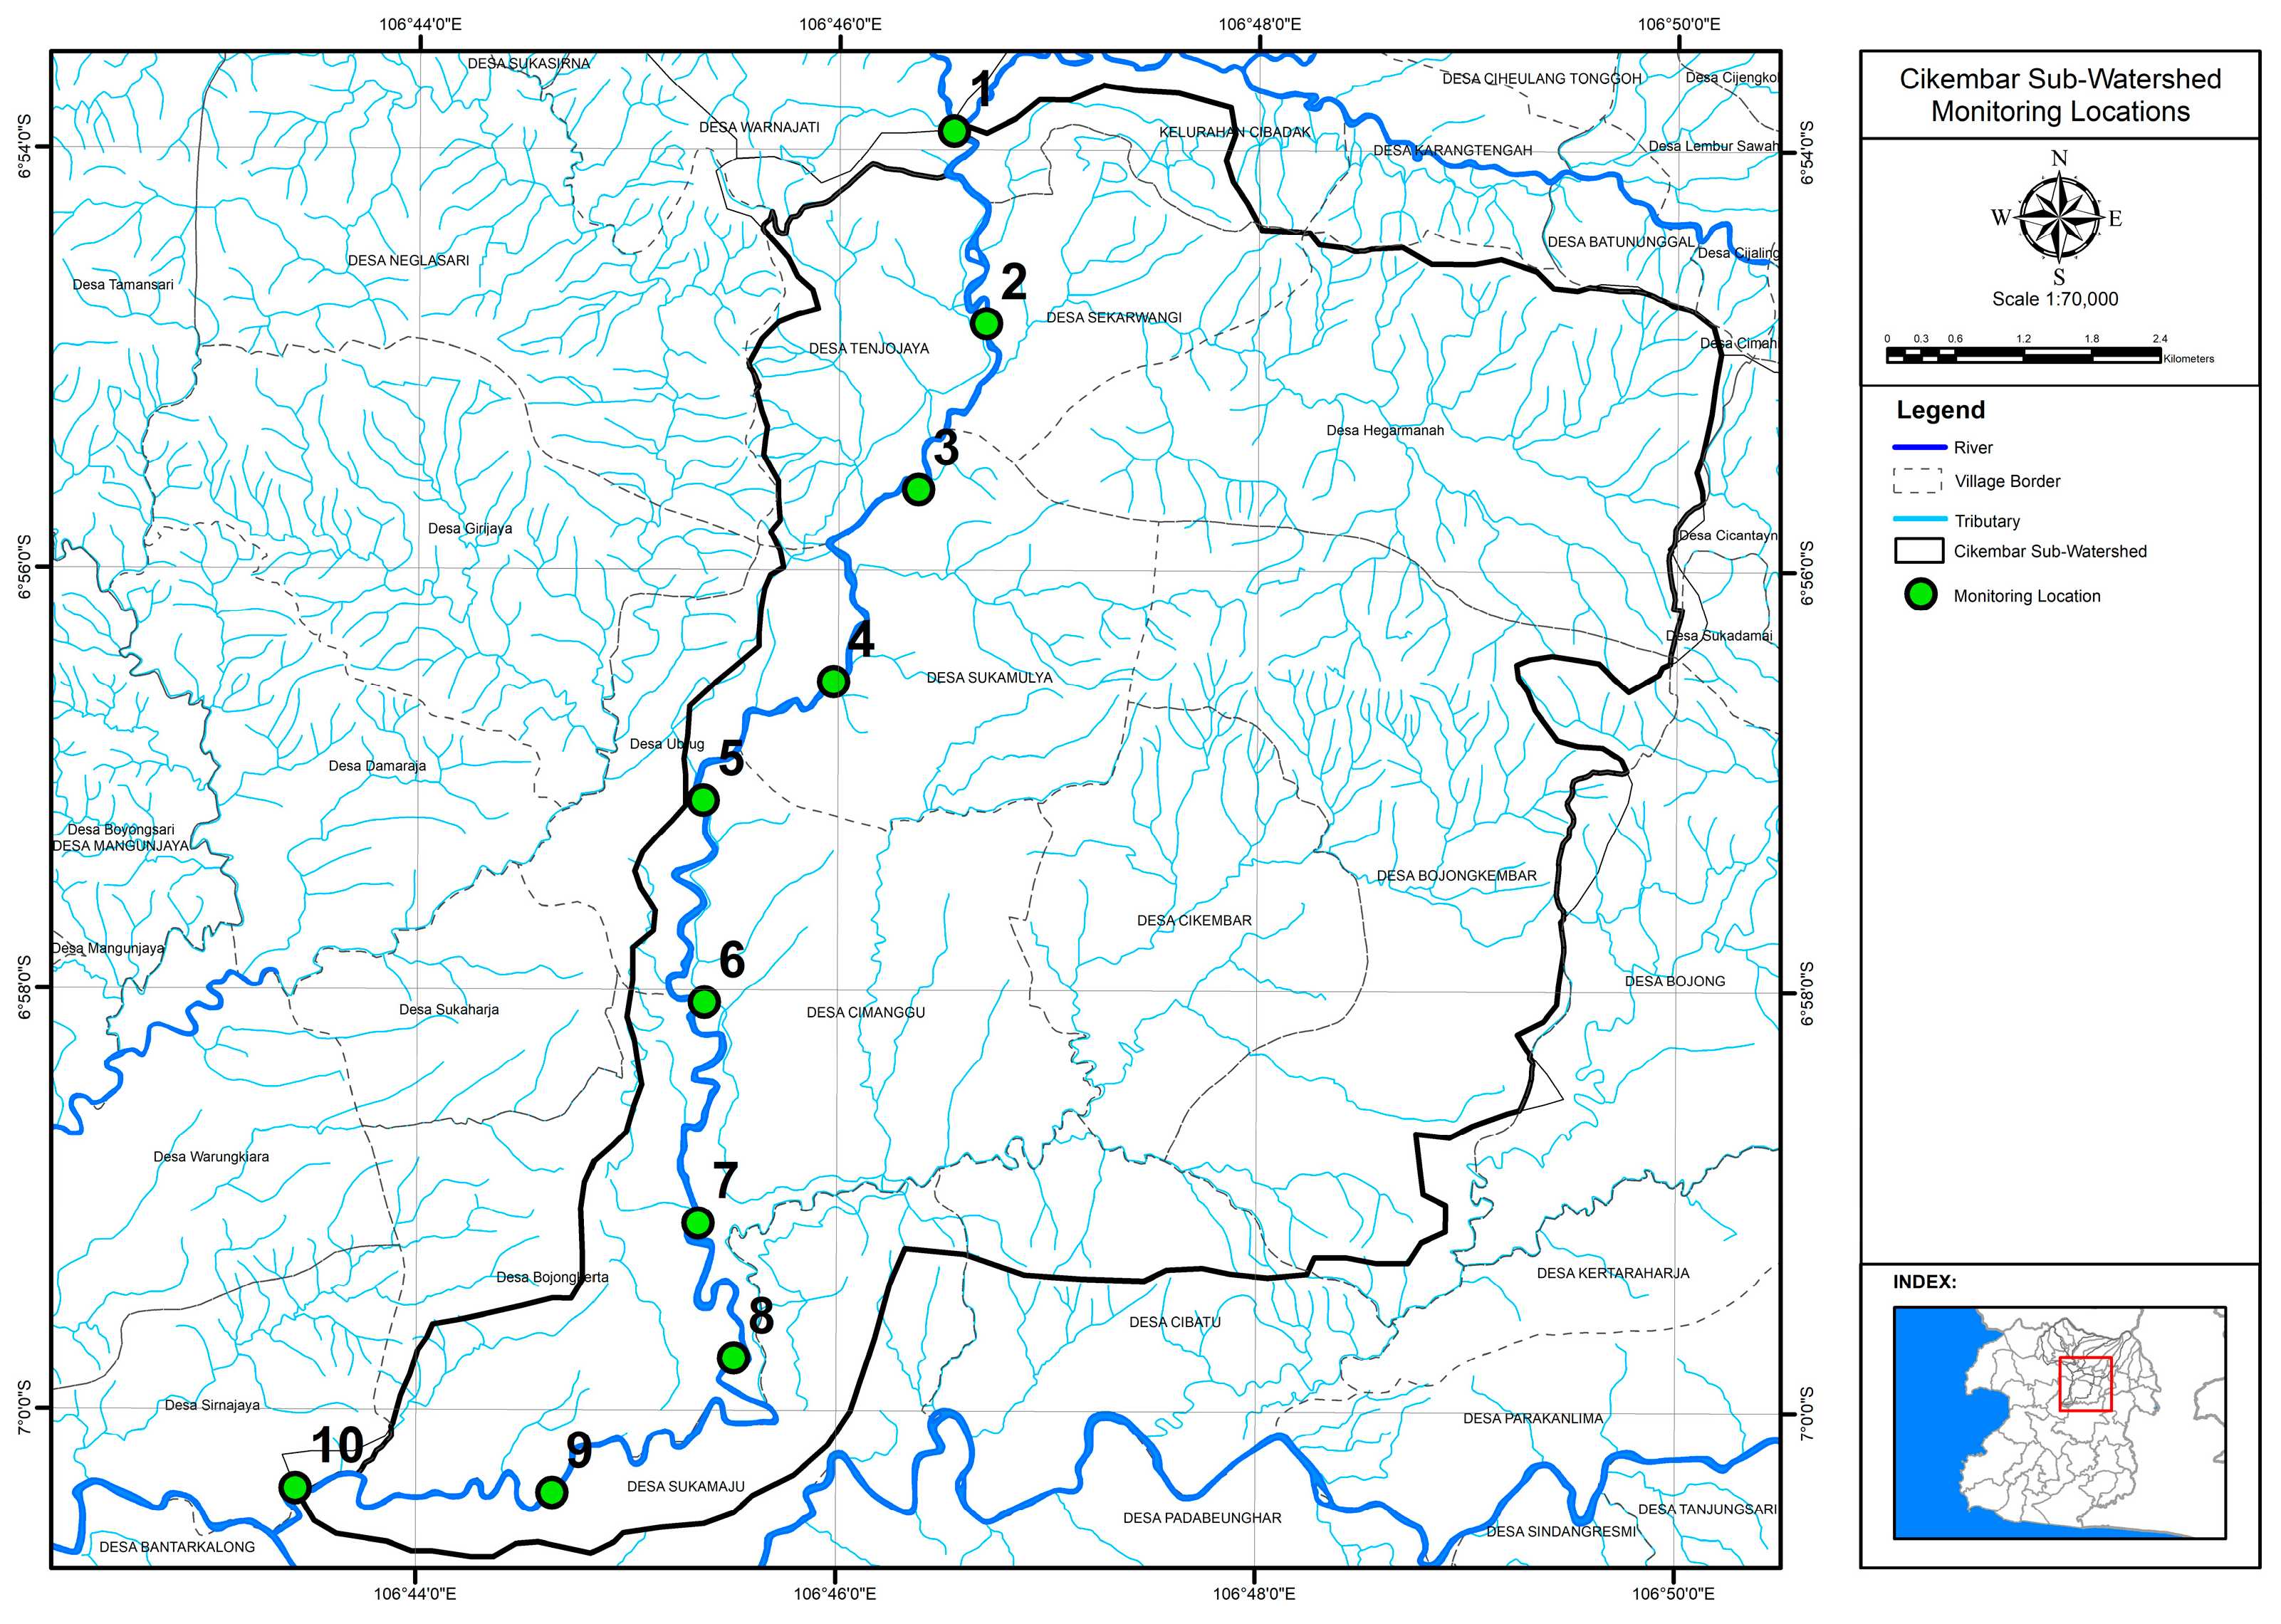
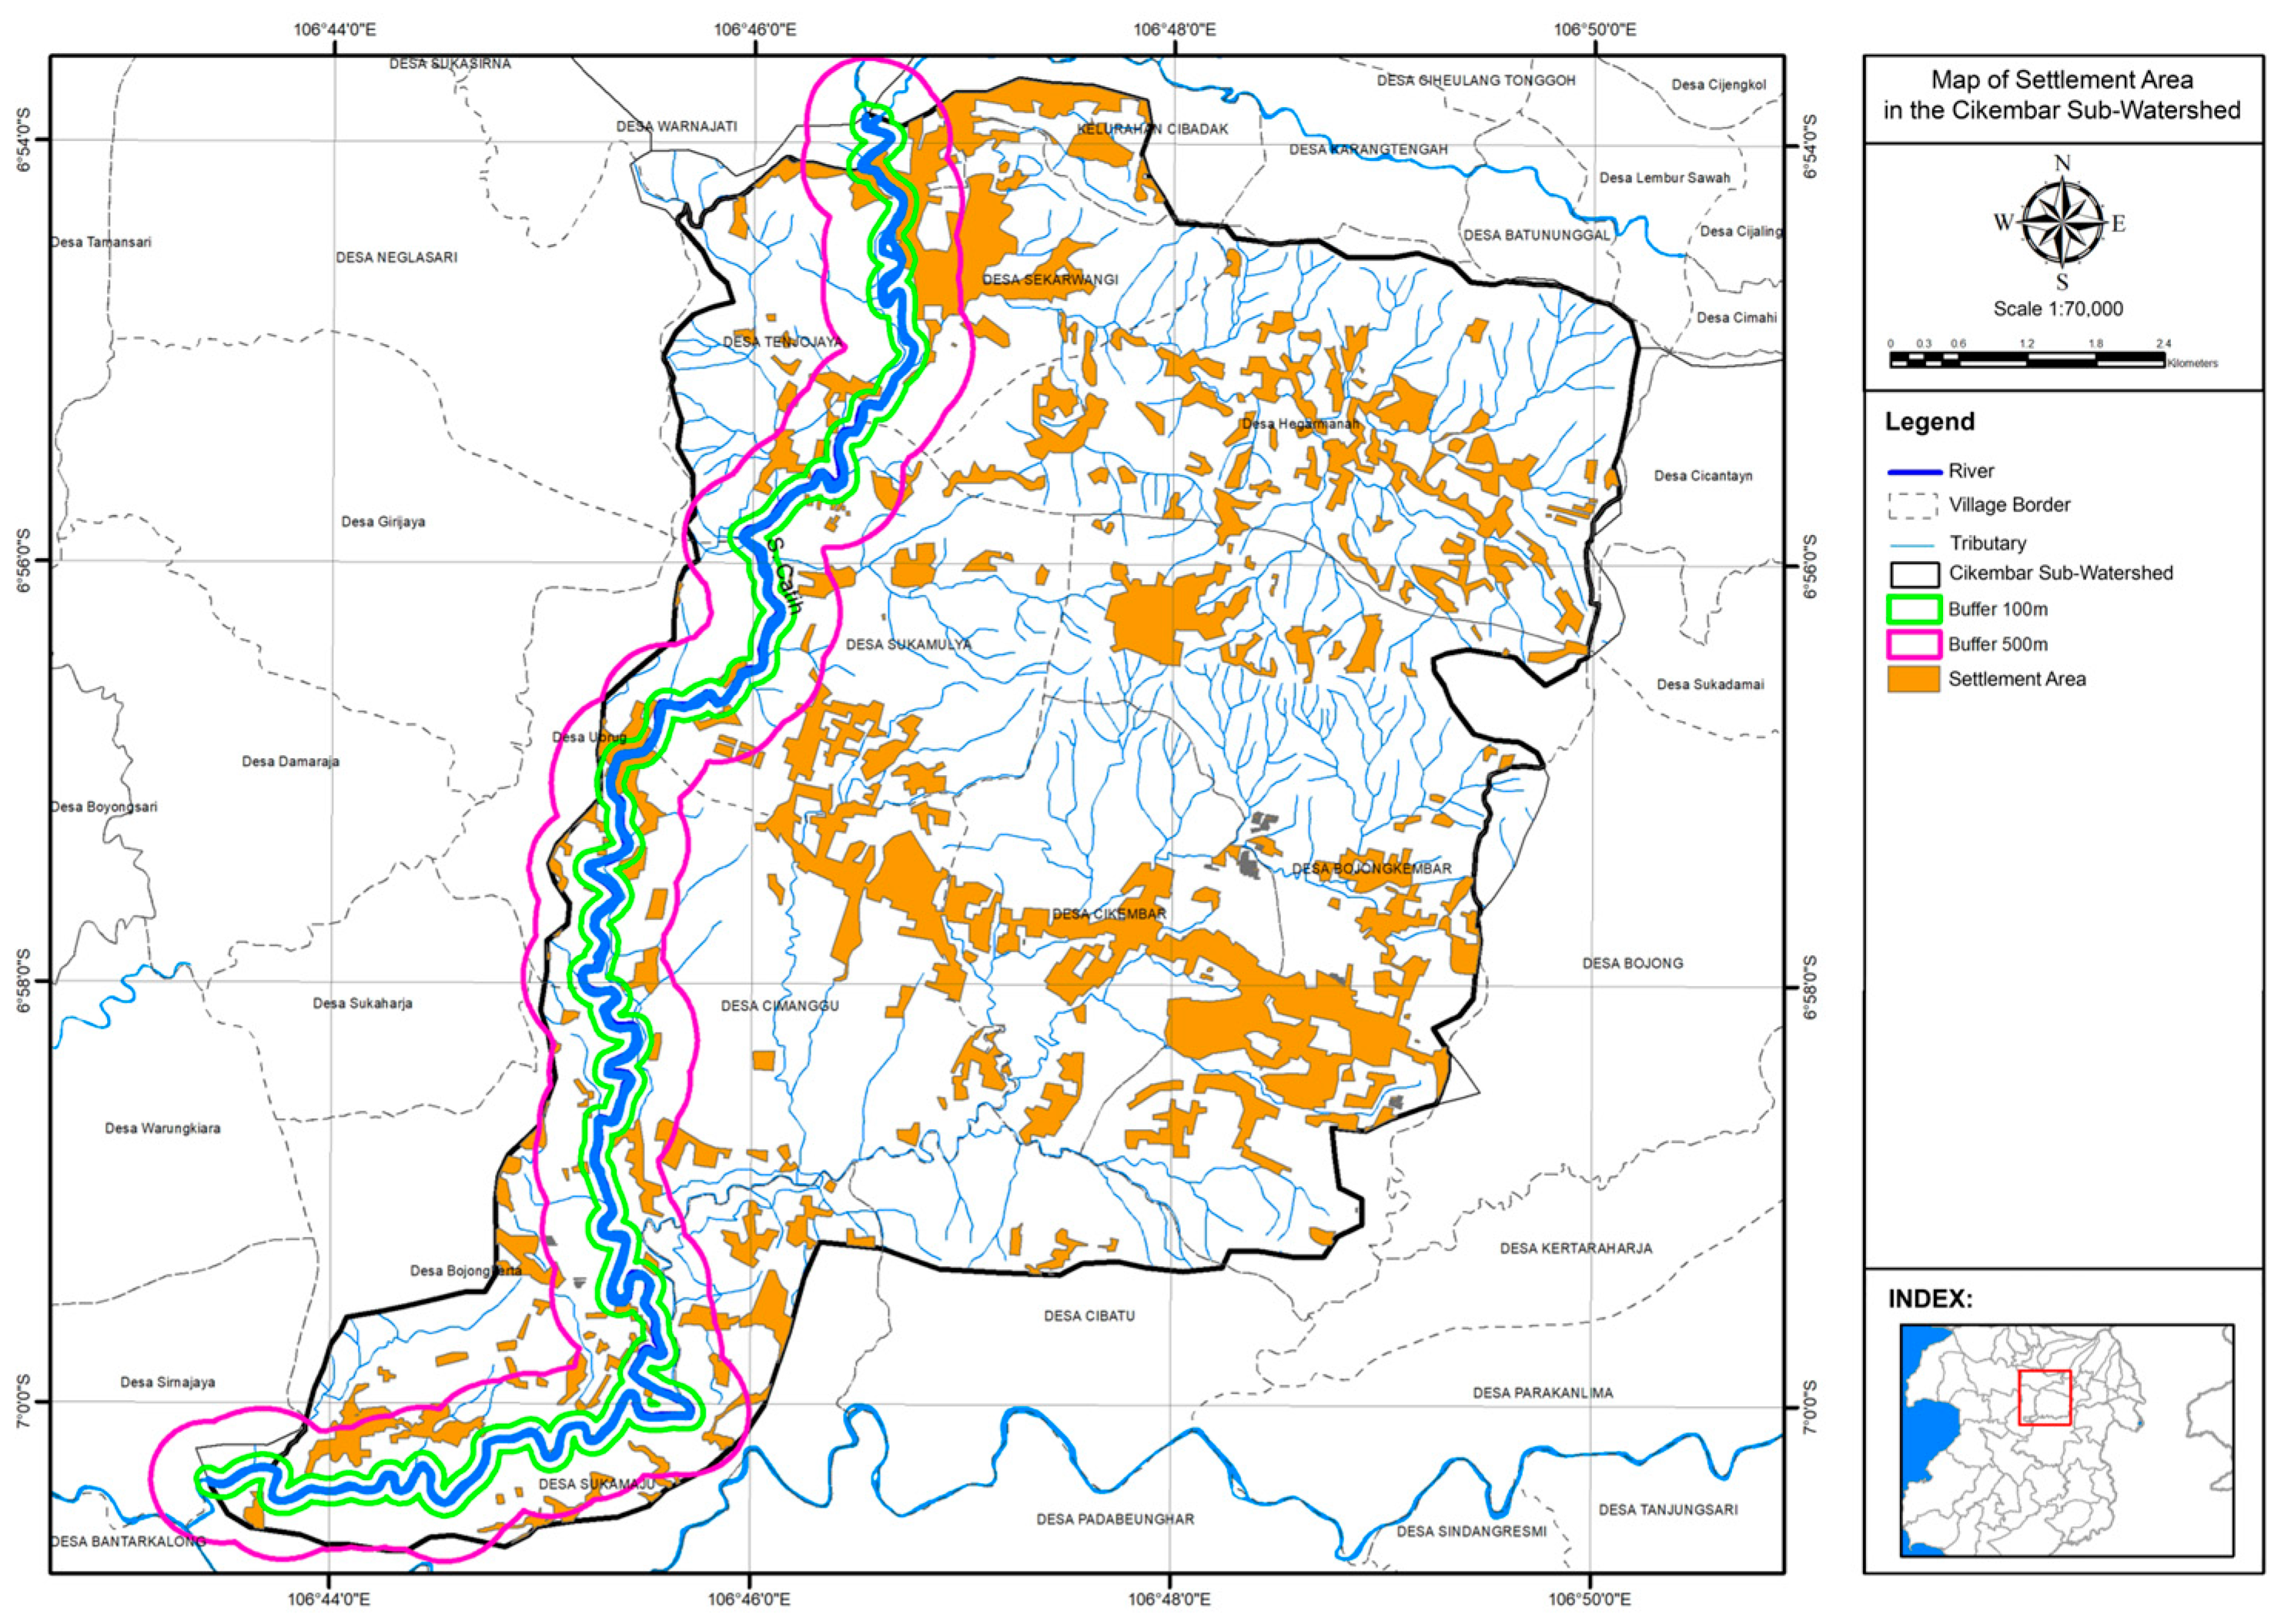
2.1. Study Area Description
2.2. Methodology
2.2.1. Water Quality Status
- = quality of specific parameter (i) based on water quality sampling
- = maximum threshold value for parameter (i)
- = Pollution Index
- = parameter 1, 2, 3…
2.2.2. Potential Pollution Load
Domestic Sector
- Assessment of river water quality across 35 locations for various parameters.
- Analysis of river flow at 25 locations along the Ciliwung River.
- Collection of sludge samples from 10 locations in the Ciliwung River for DO.

| Parameter 1 | Emission Factor (g/Person/Day) |
|---|---|
| TSS | 38 |
| BOD | 40 |
| COD | 55 |
| Total-N | 1.95 |
| Total-P | 0.21 |
Agricultural Sector
Livestock Sector
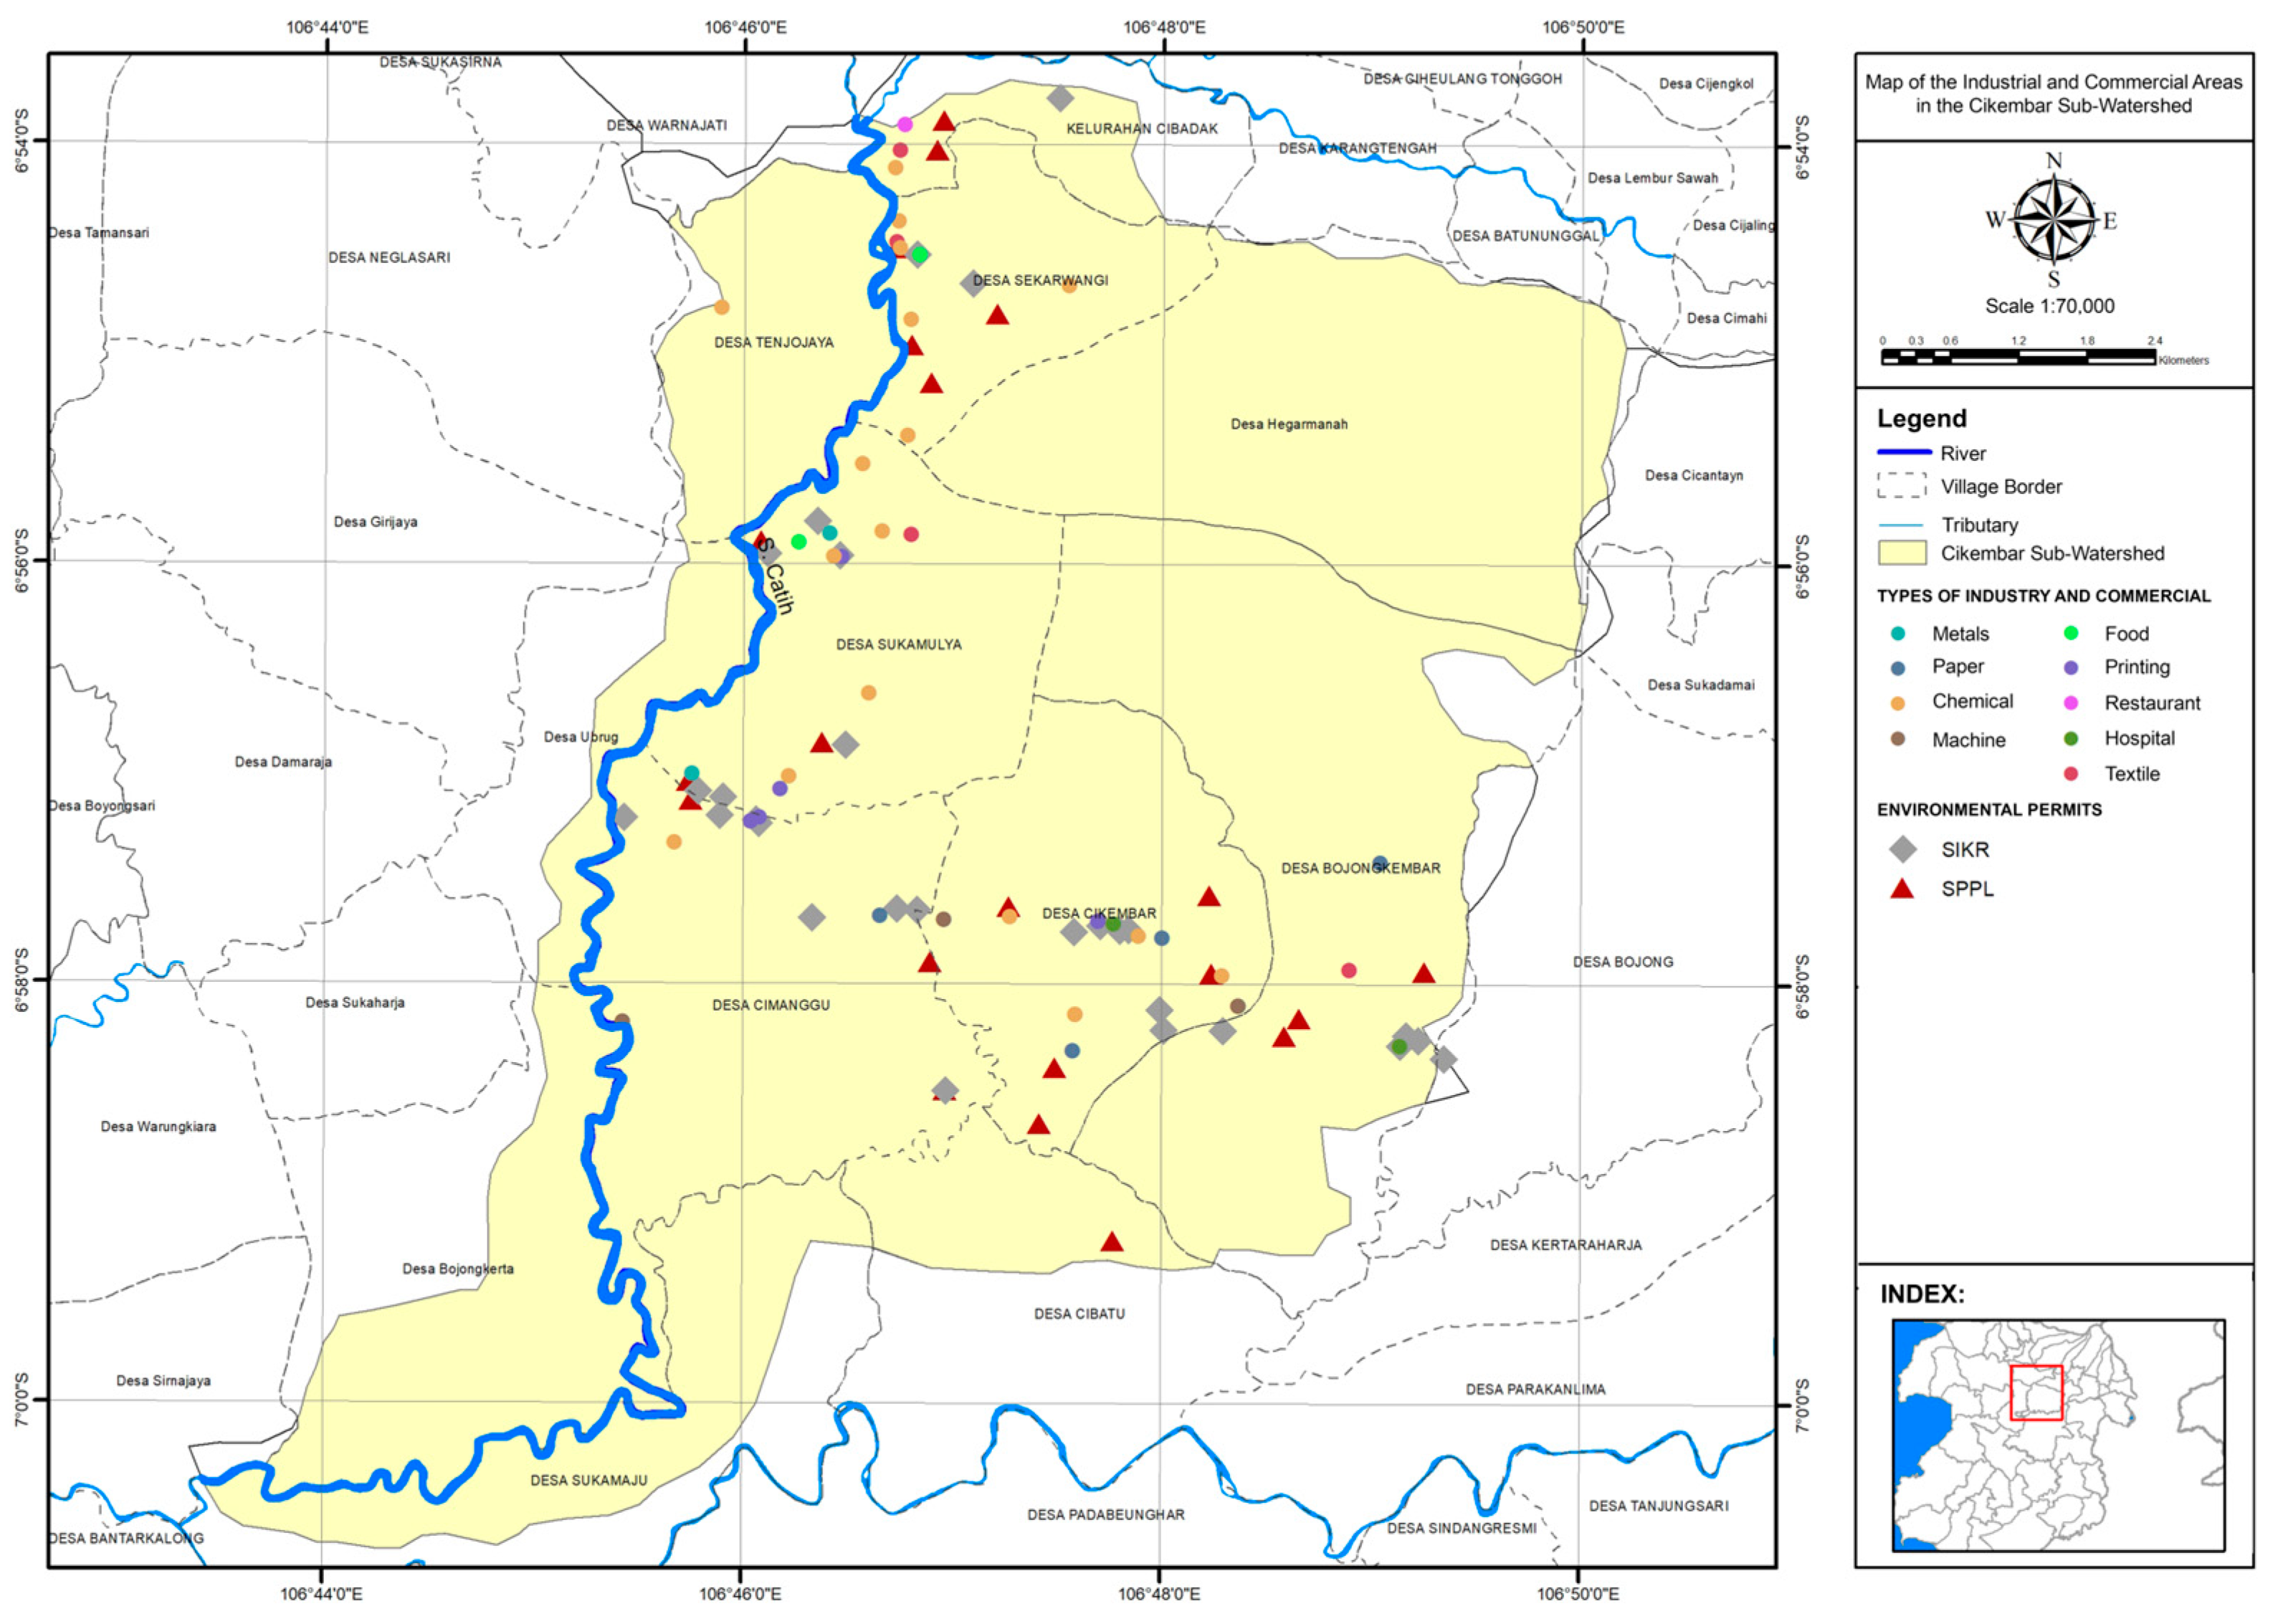
Industrial and Commercial Sector
- Using concentration and discharge of wastewater data to monitor results;
- If concentration data is available, but discharge data is unavailable from the monitoring results, then the maximum wastewater discharge in the permit is used;
- If both concentration and discharge wastewater from the monitoring results is unavailable, then pollution load unit (PLU) or Emission Factor (EF) is used;
- If (1) to (3) is unavailable, the pollution load of the similar sector(s) is used.
- = unit conversion (0.0864)
- = distance load transfer coefficient (0.3–1.0)
- = load transfer coefficient discharge ratio (0.1–1.0)
- Qk = discharge (L/s)
- Ei = pollutant emission (mg/L).
- I,i = load/pollutant emission i (kg/year)
- Ci = industrial waste concentration (mg/L)
- V = wastewater discharge flow rate (L/h)
- OpHrs = number of operating hours per year (h/year)
- 1000000 = conversion factor (mg/kg).
3. Results and Discussion
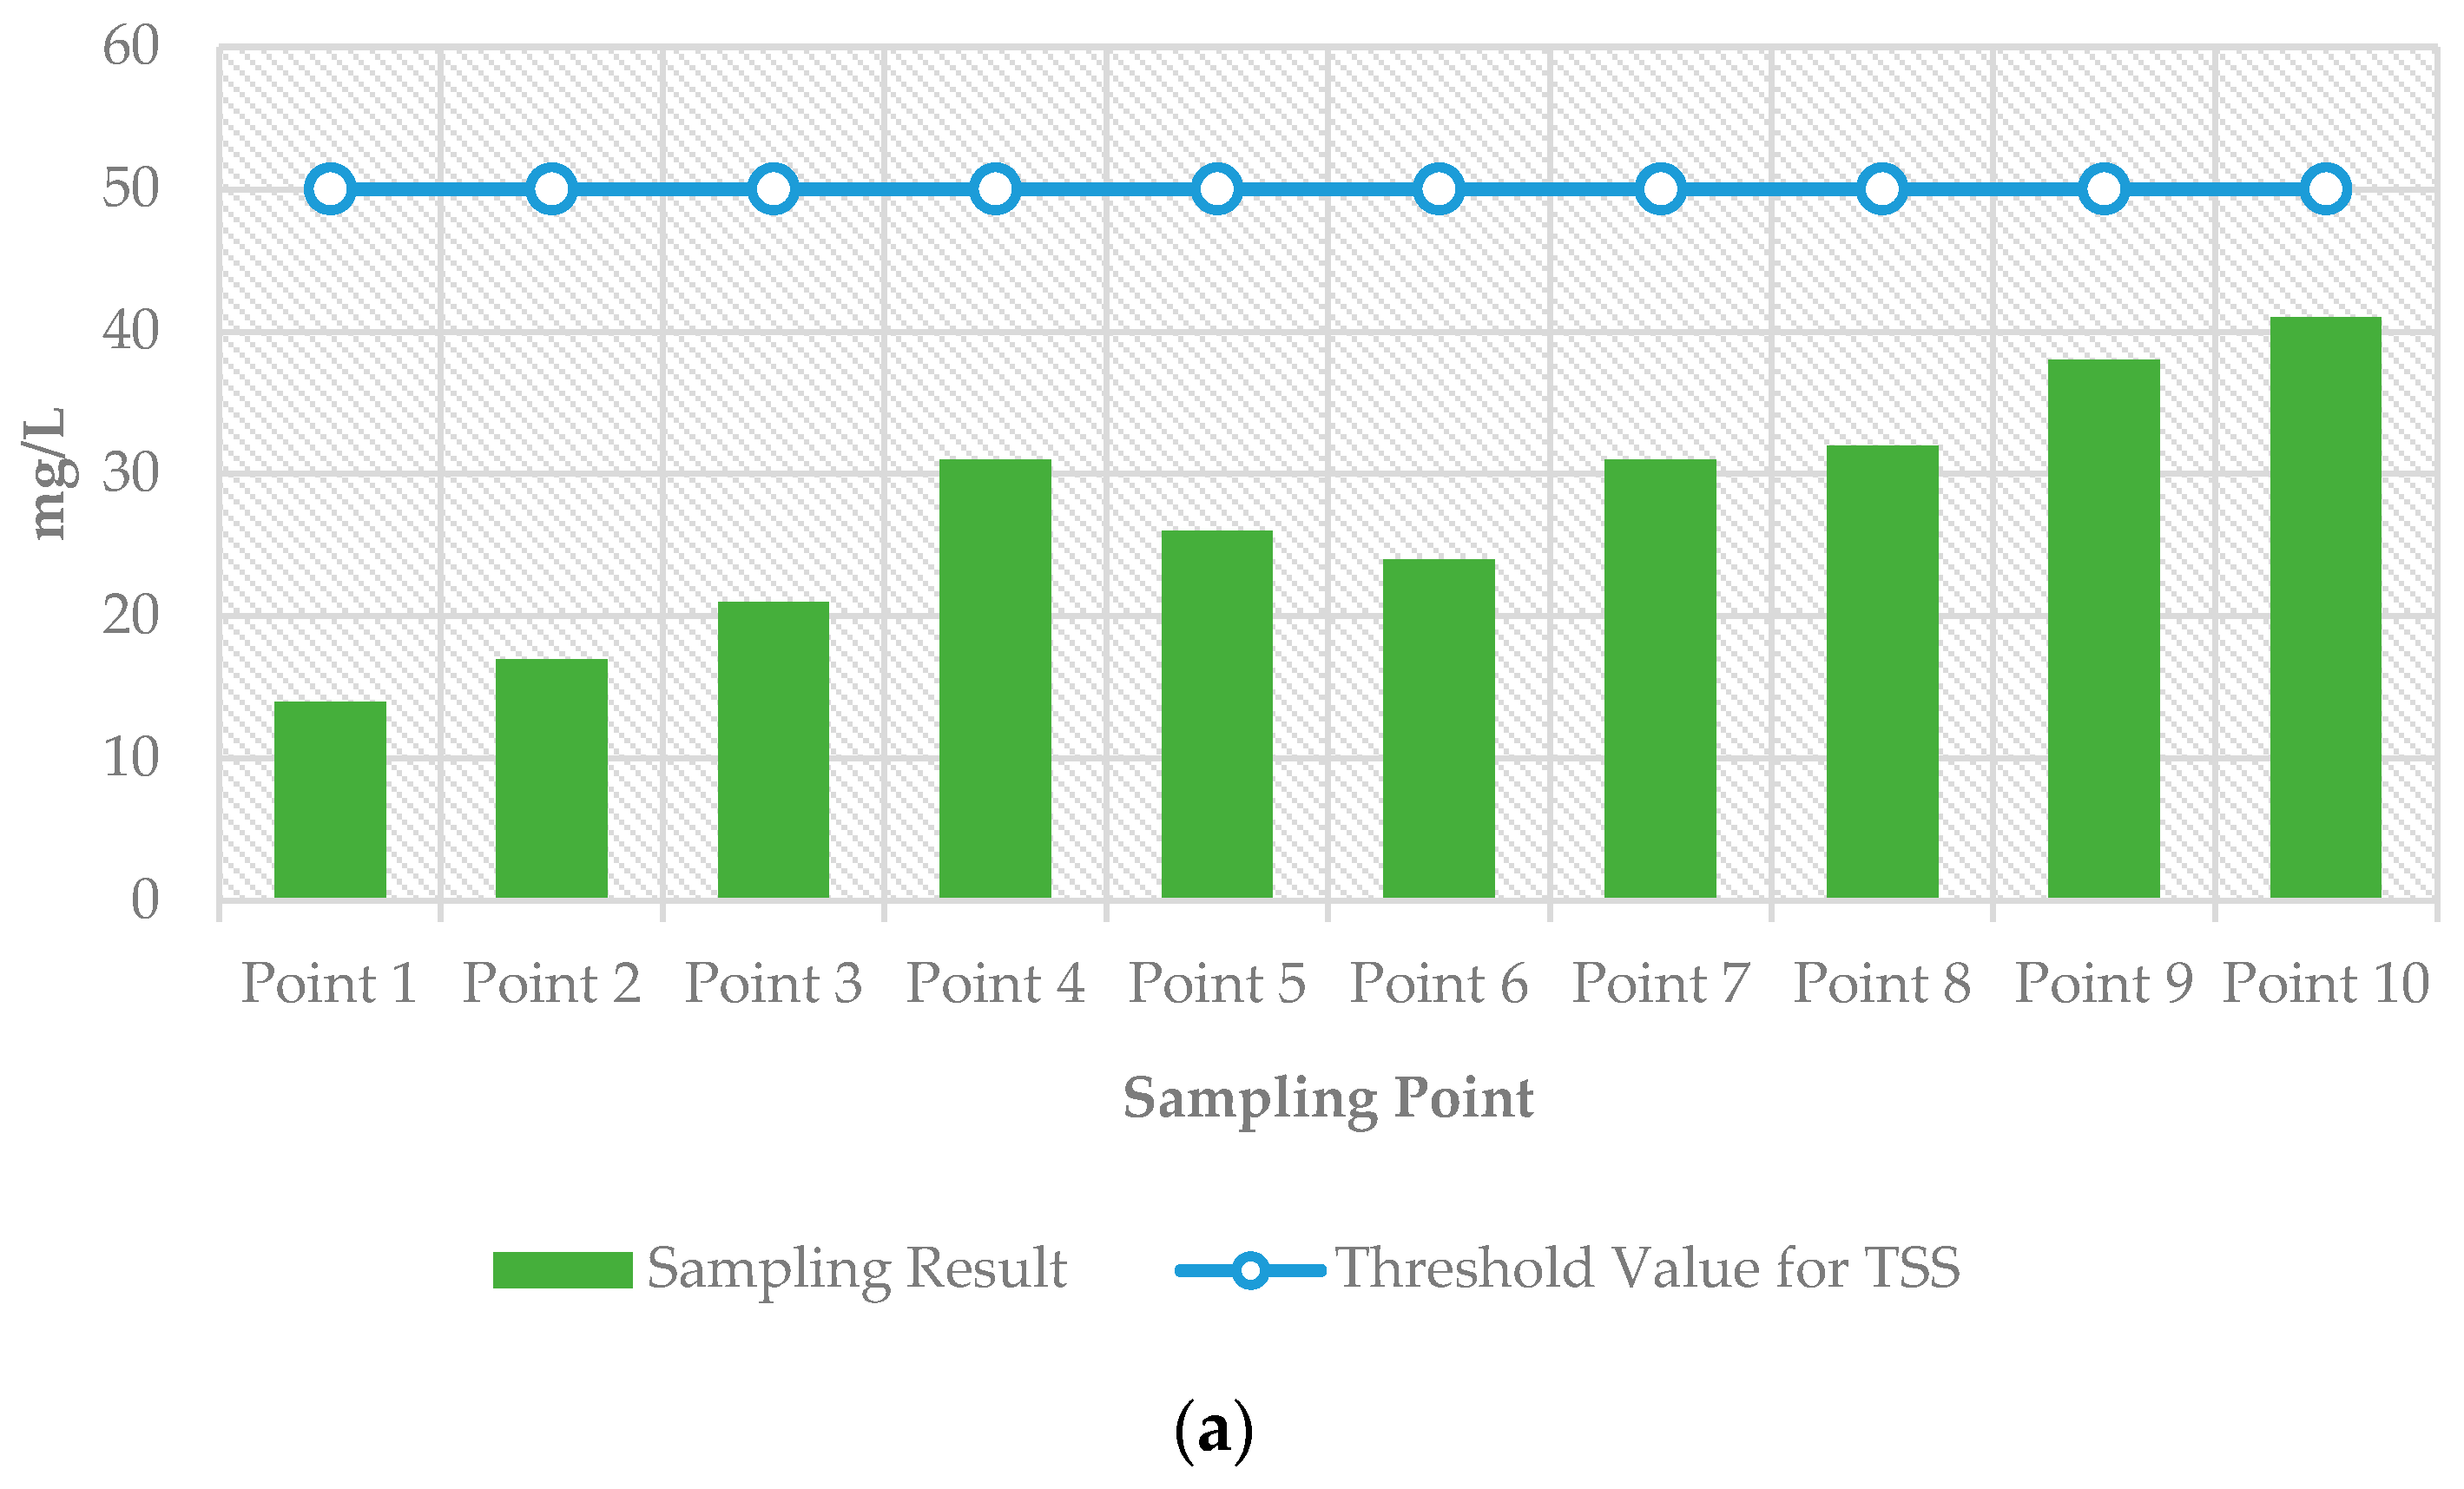
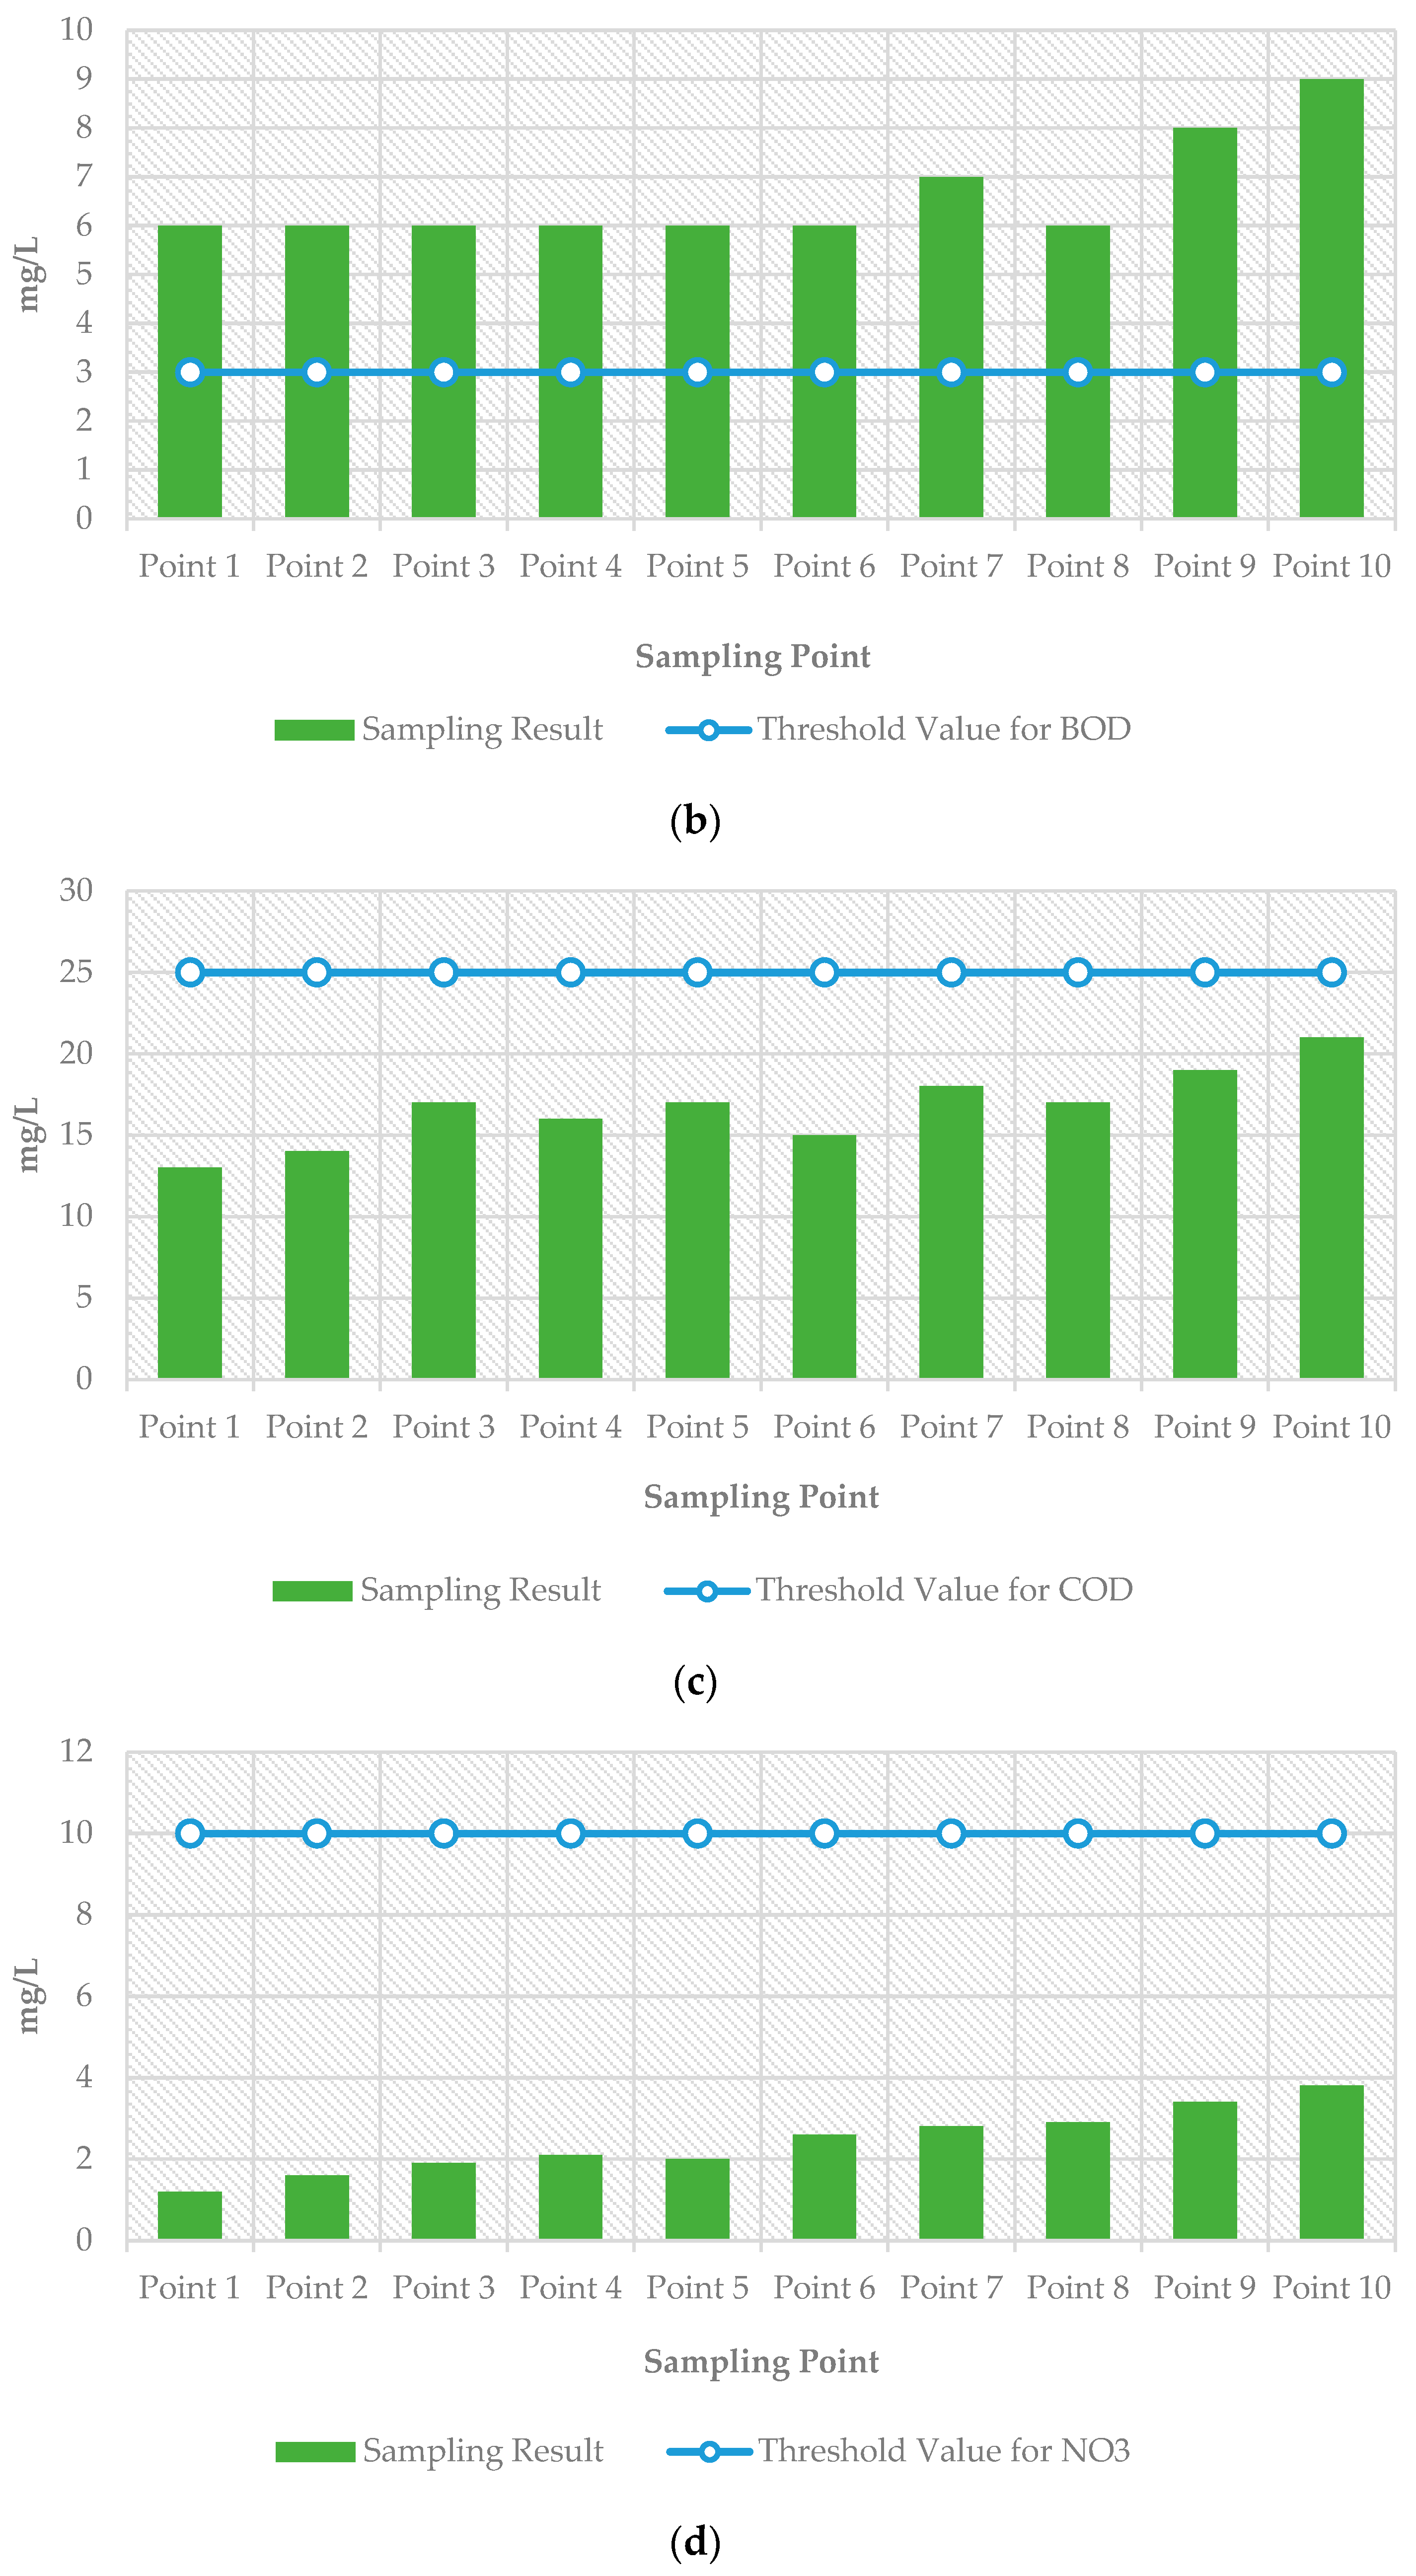
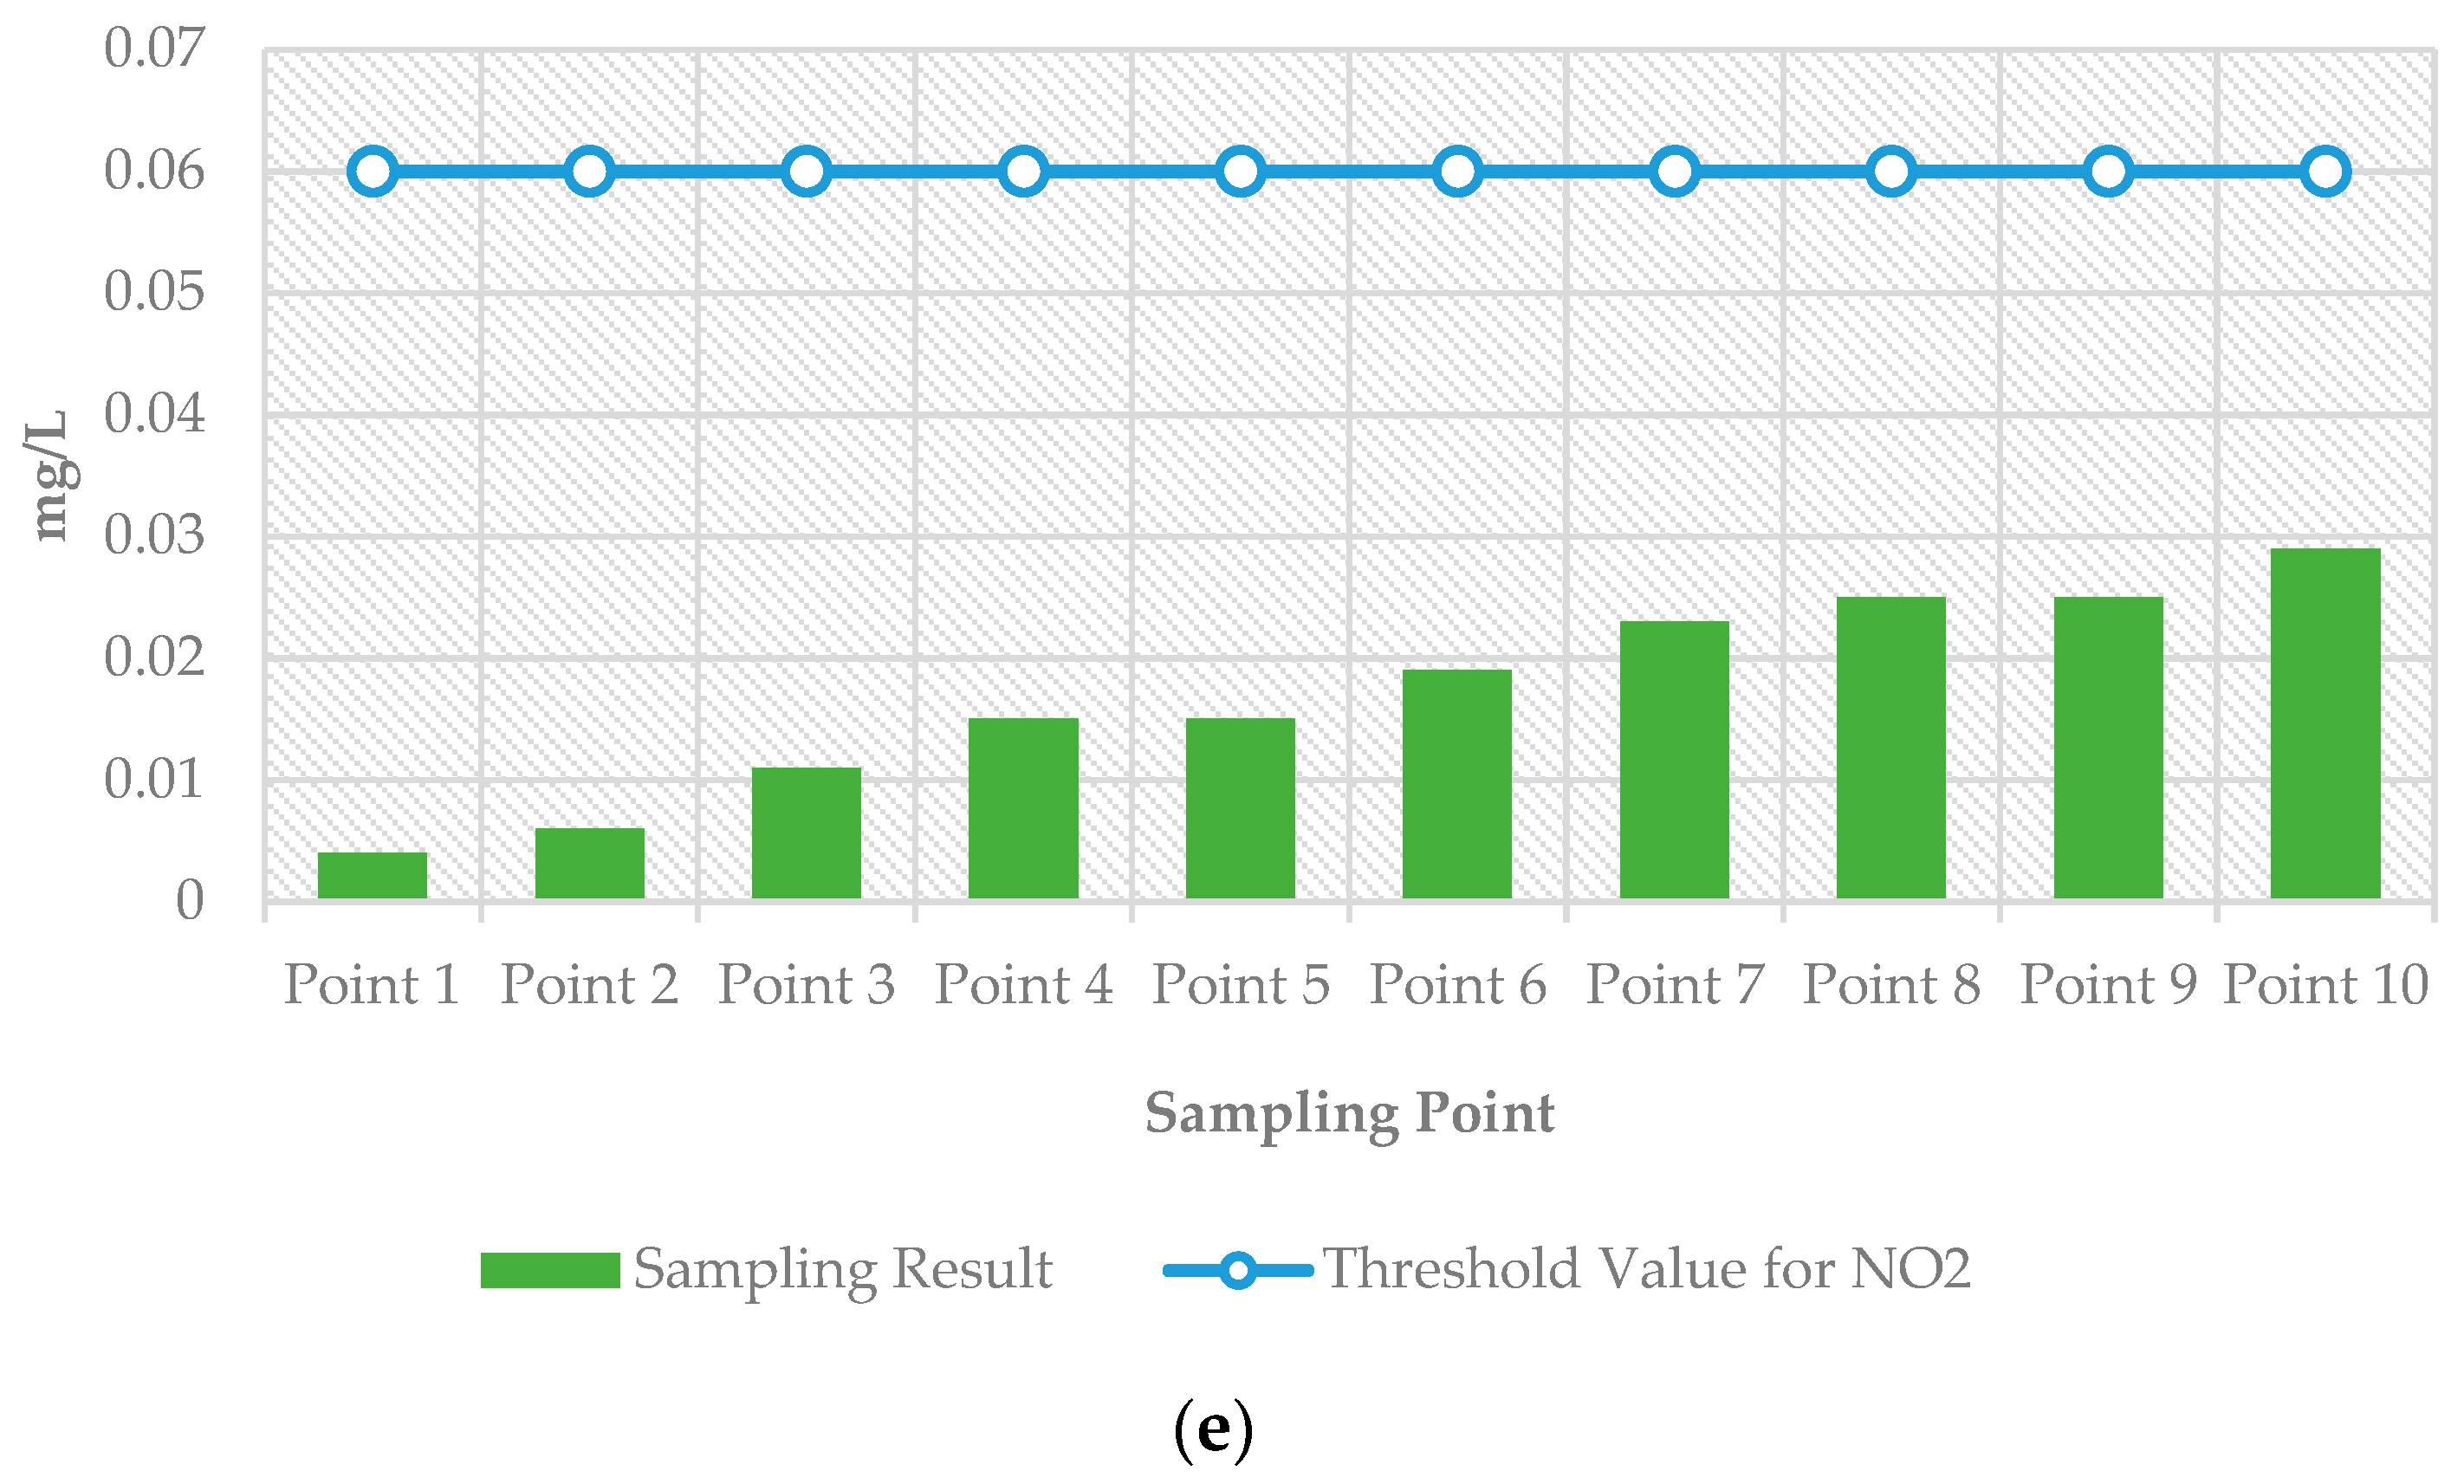
3.1. Water Quality Status
3.2. Potential Pollution Load
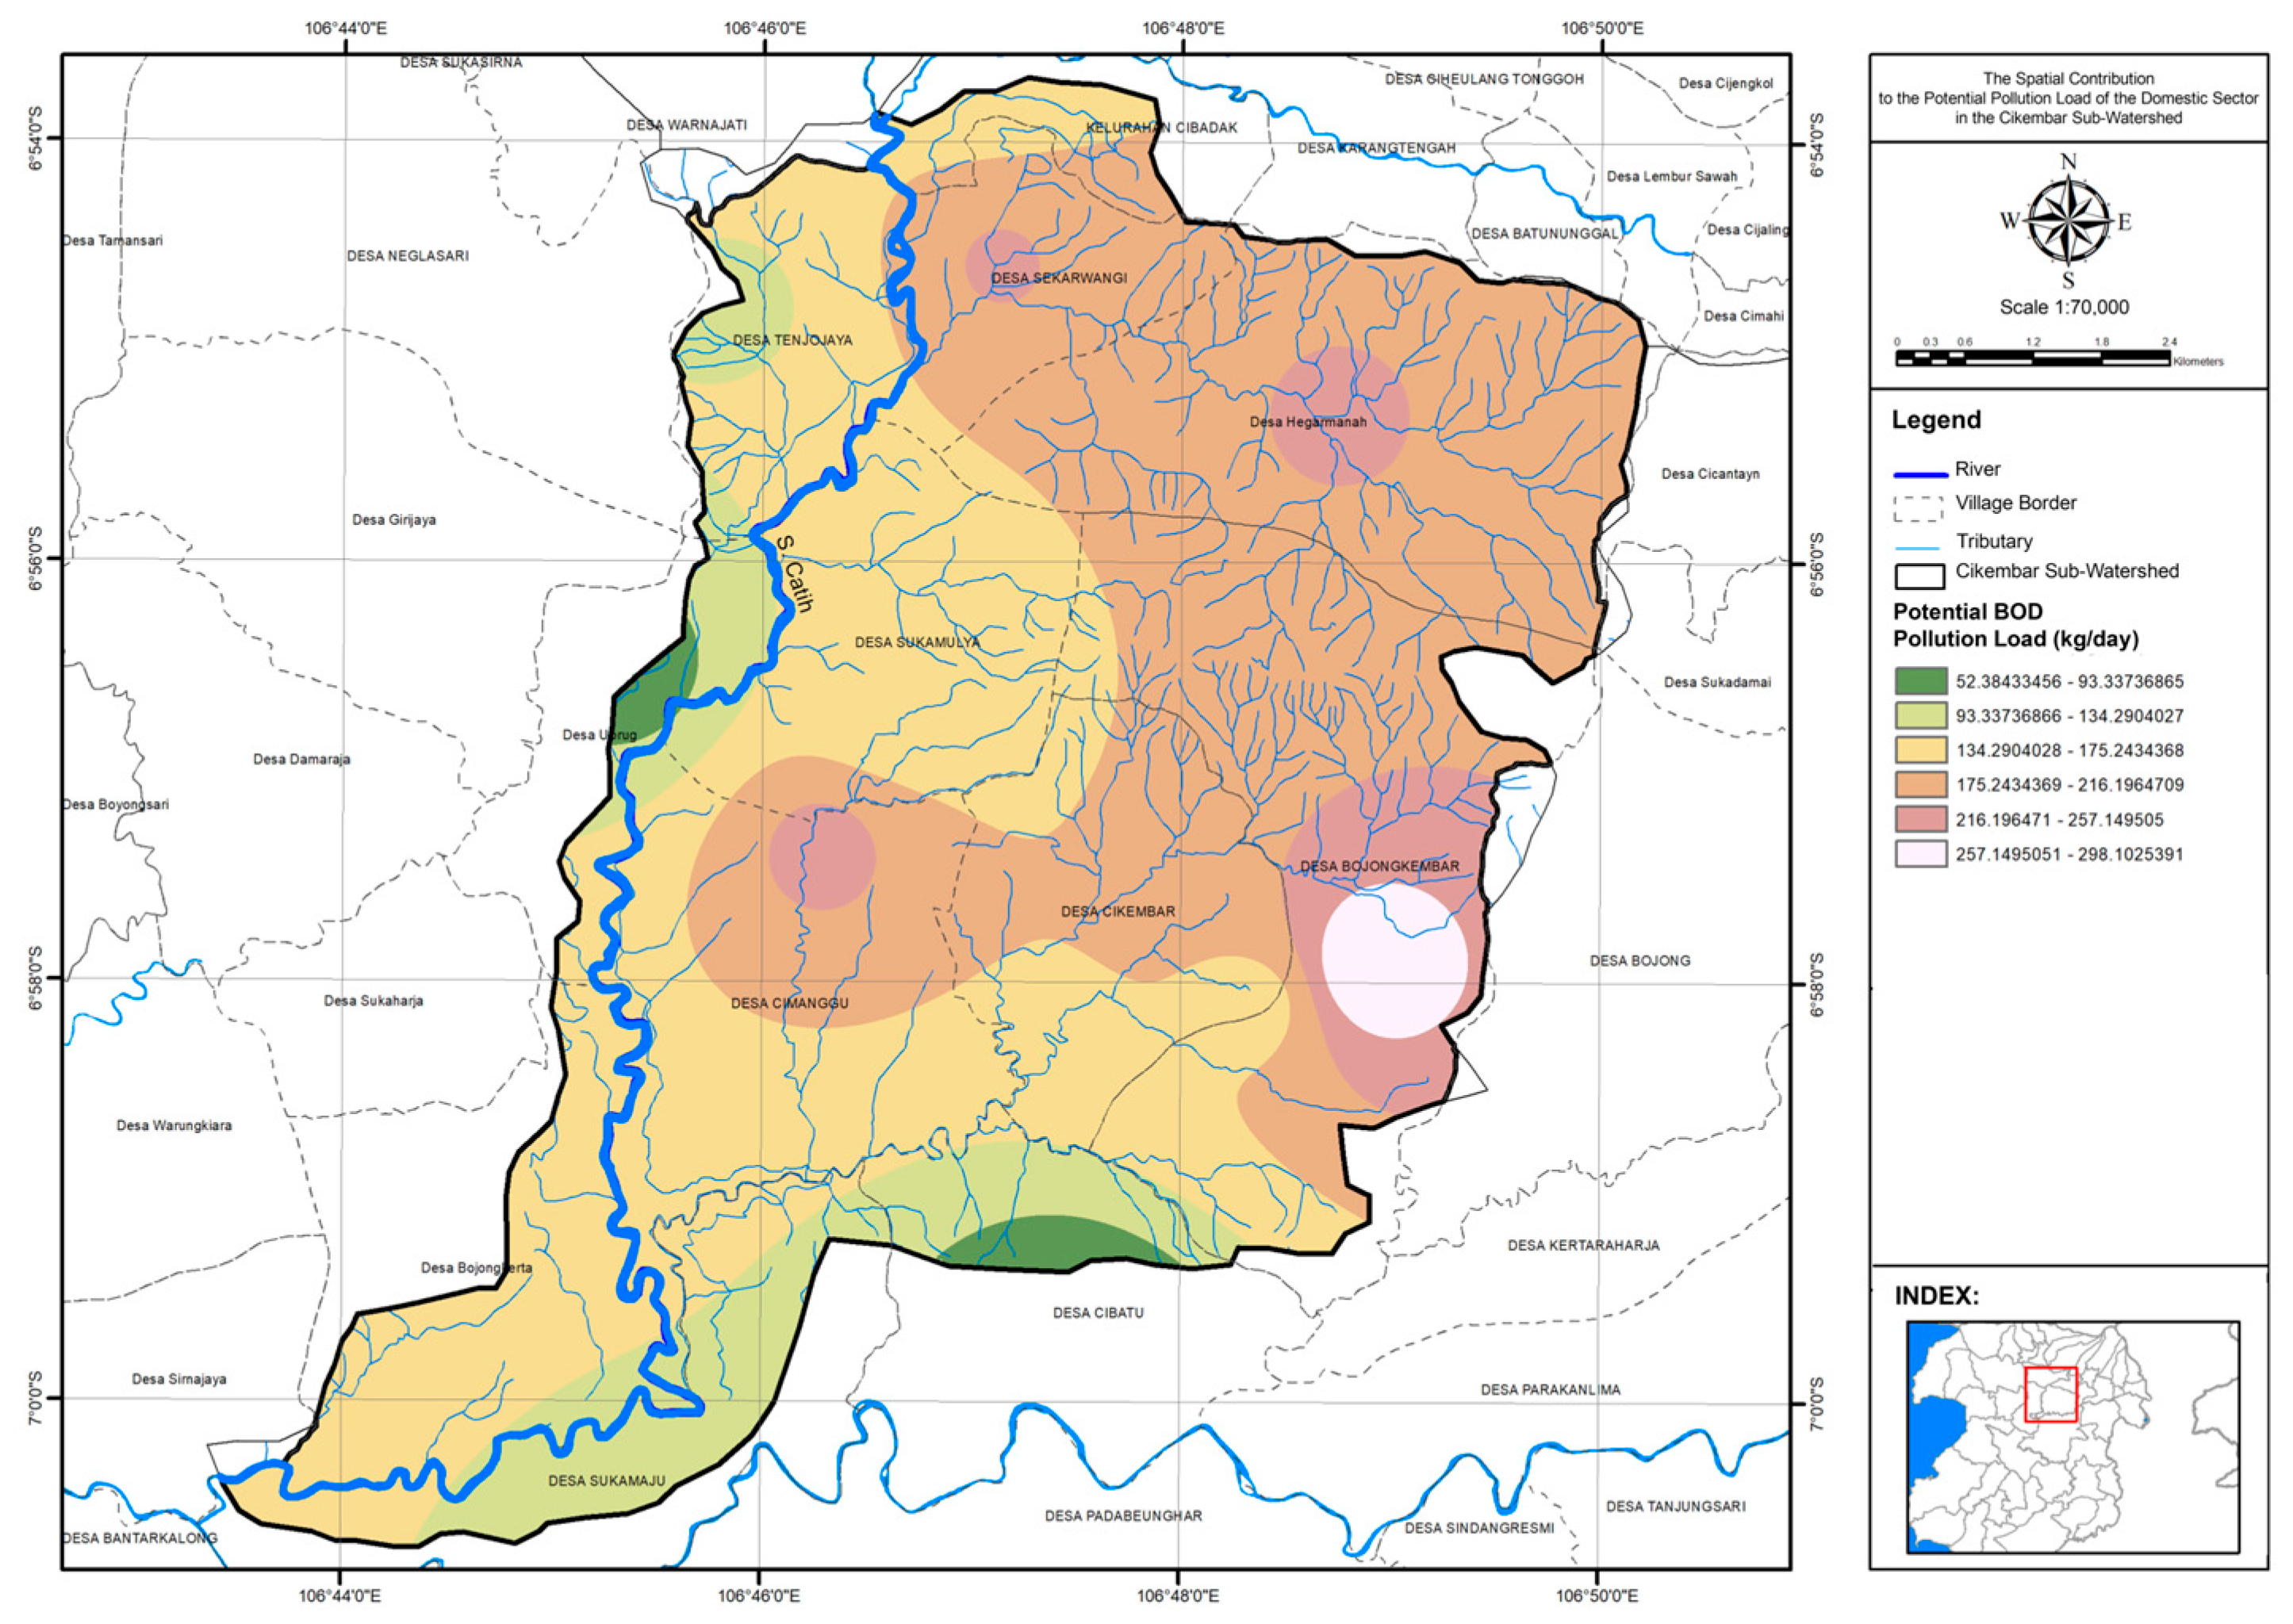
3.2.1. Domestic Sector
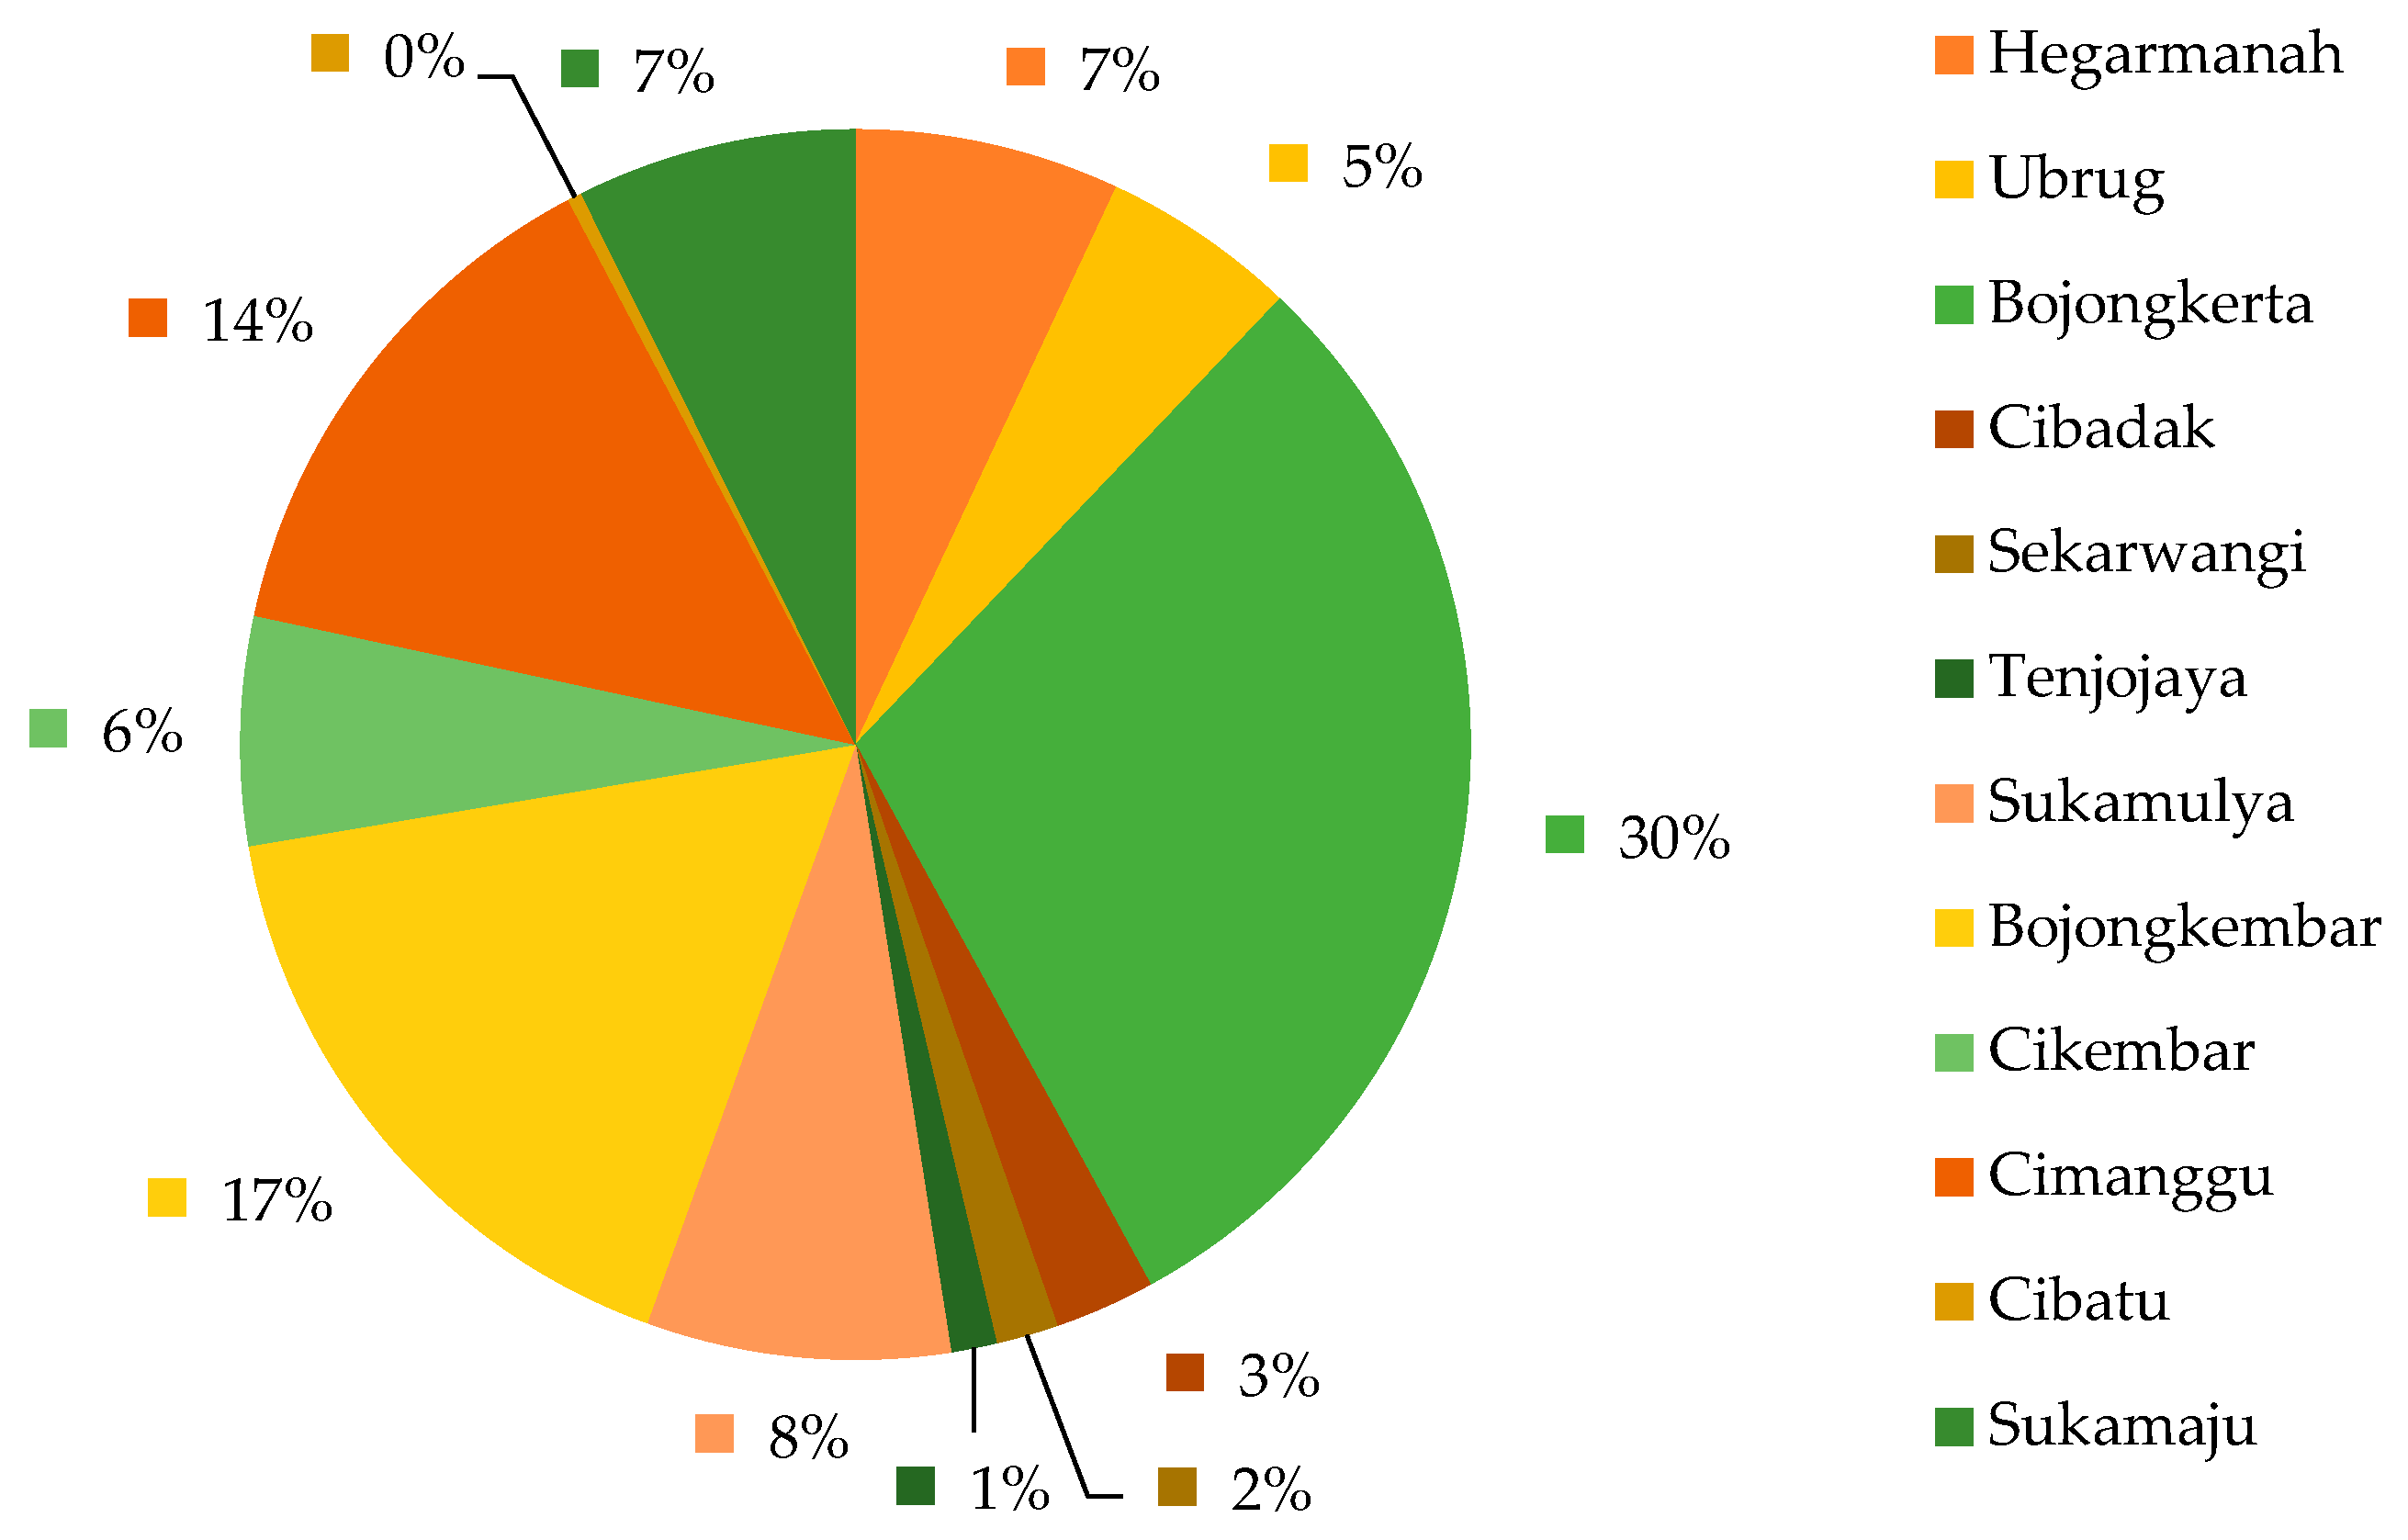
3.2.2. Agricultural Sector
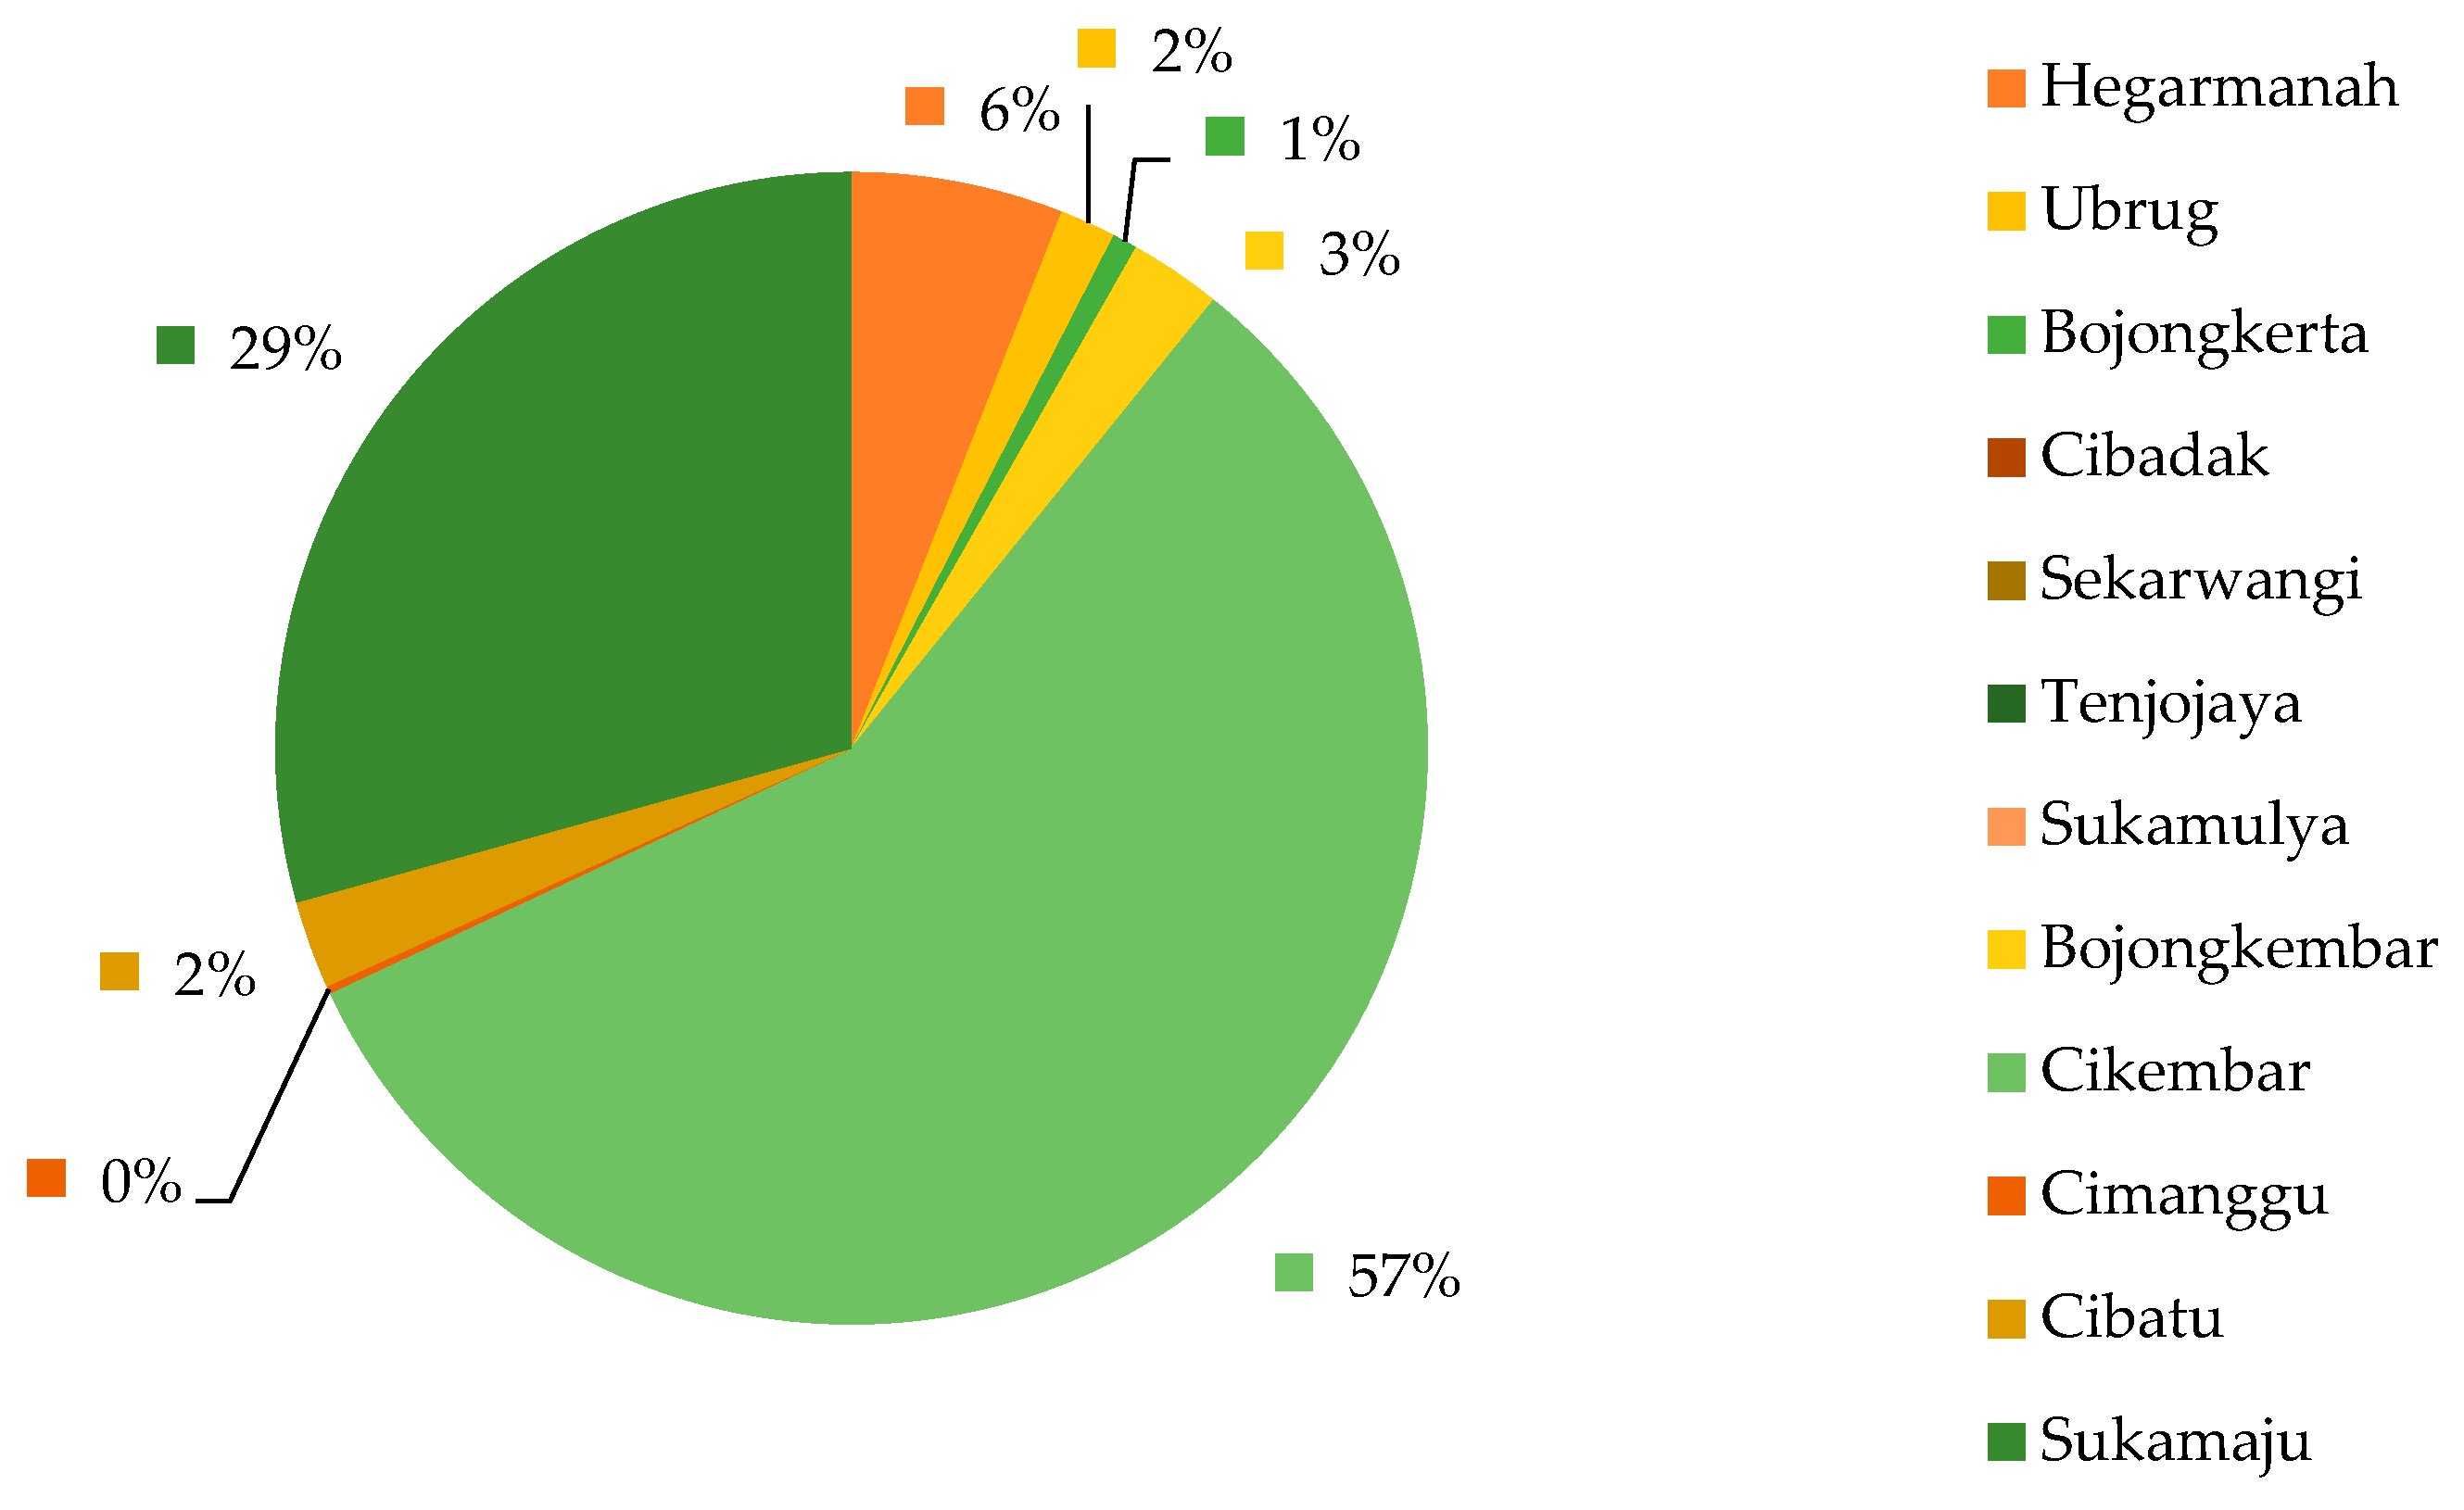
3.2.3. Livestock Sector
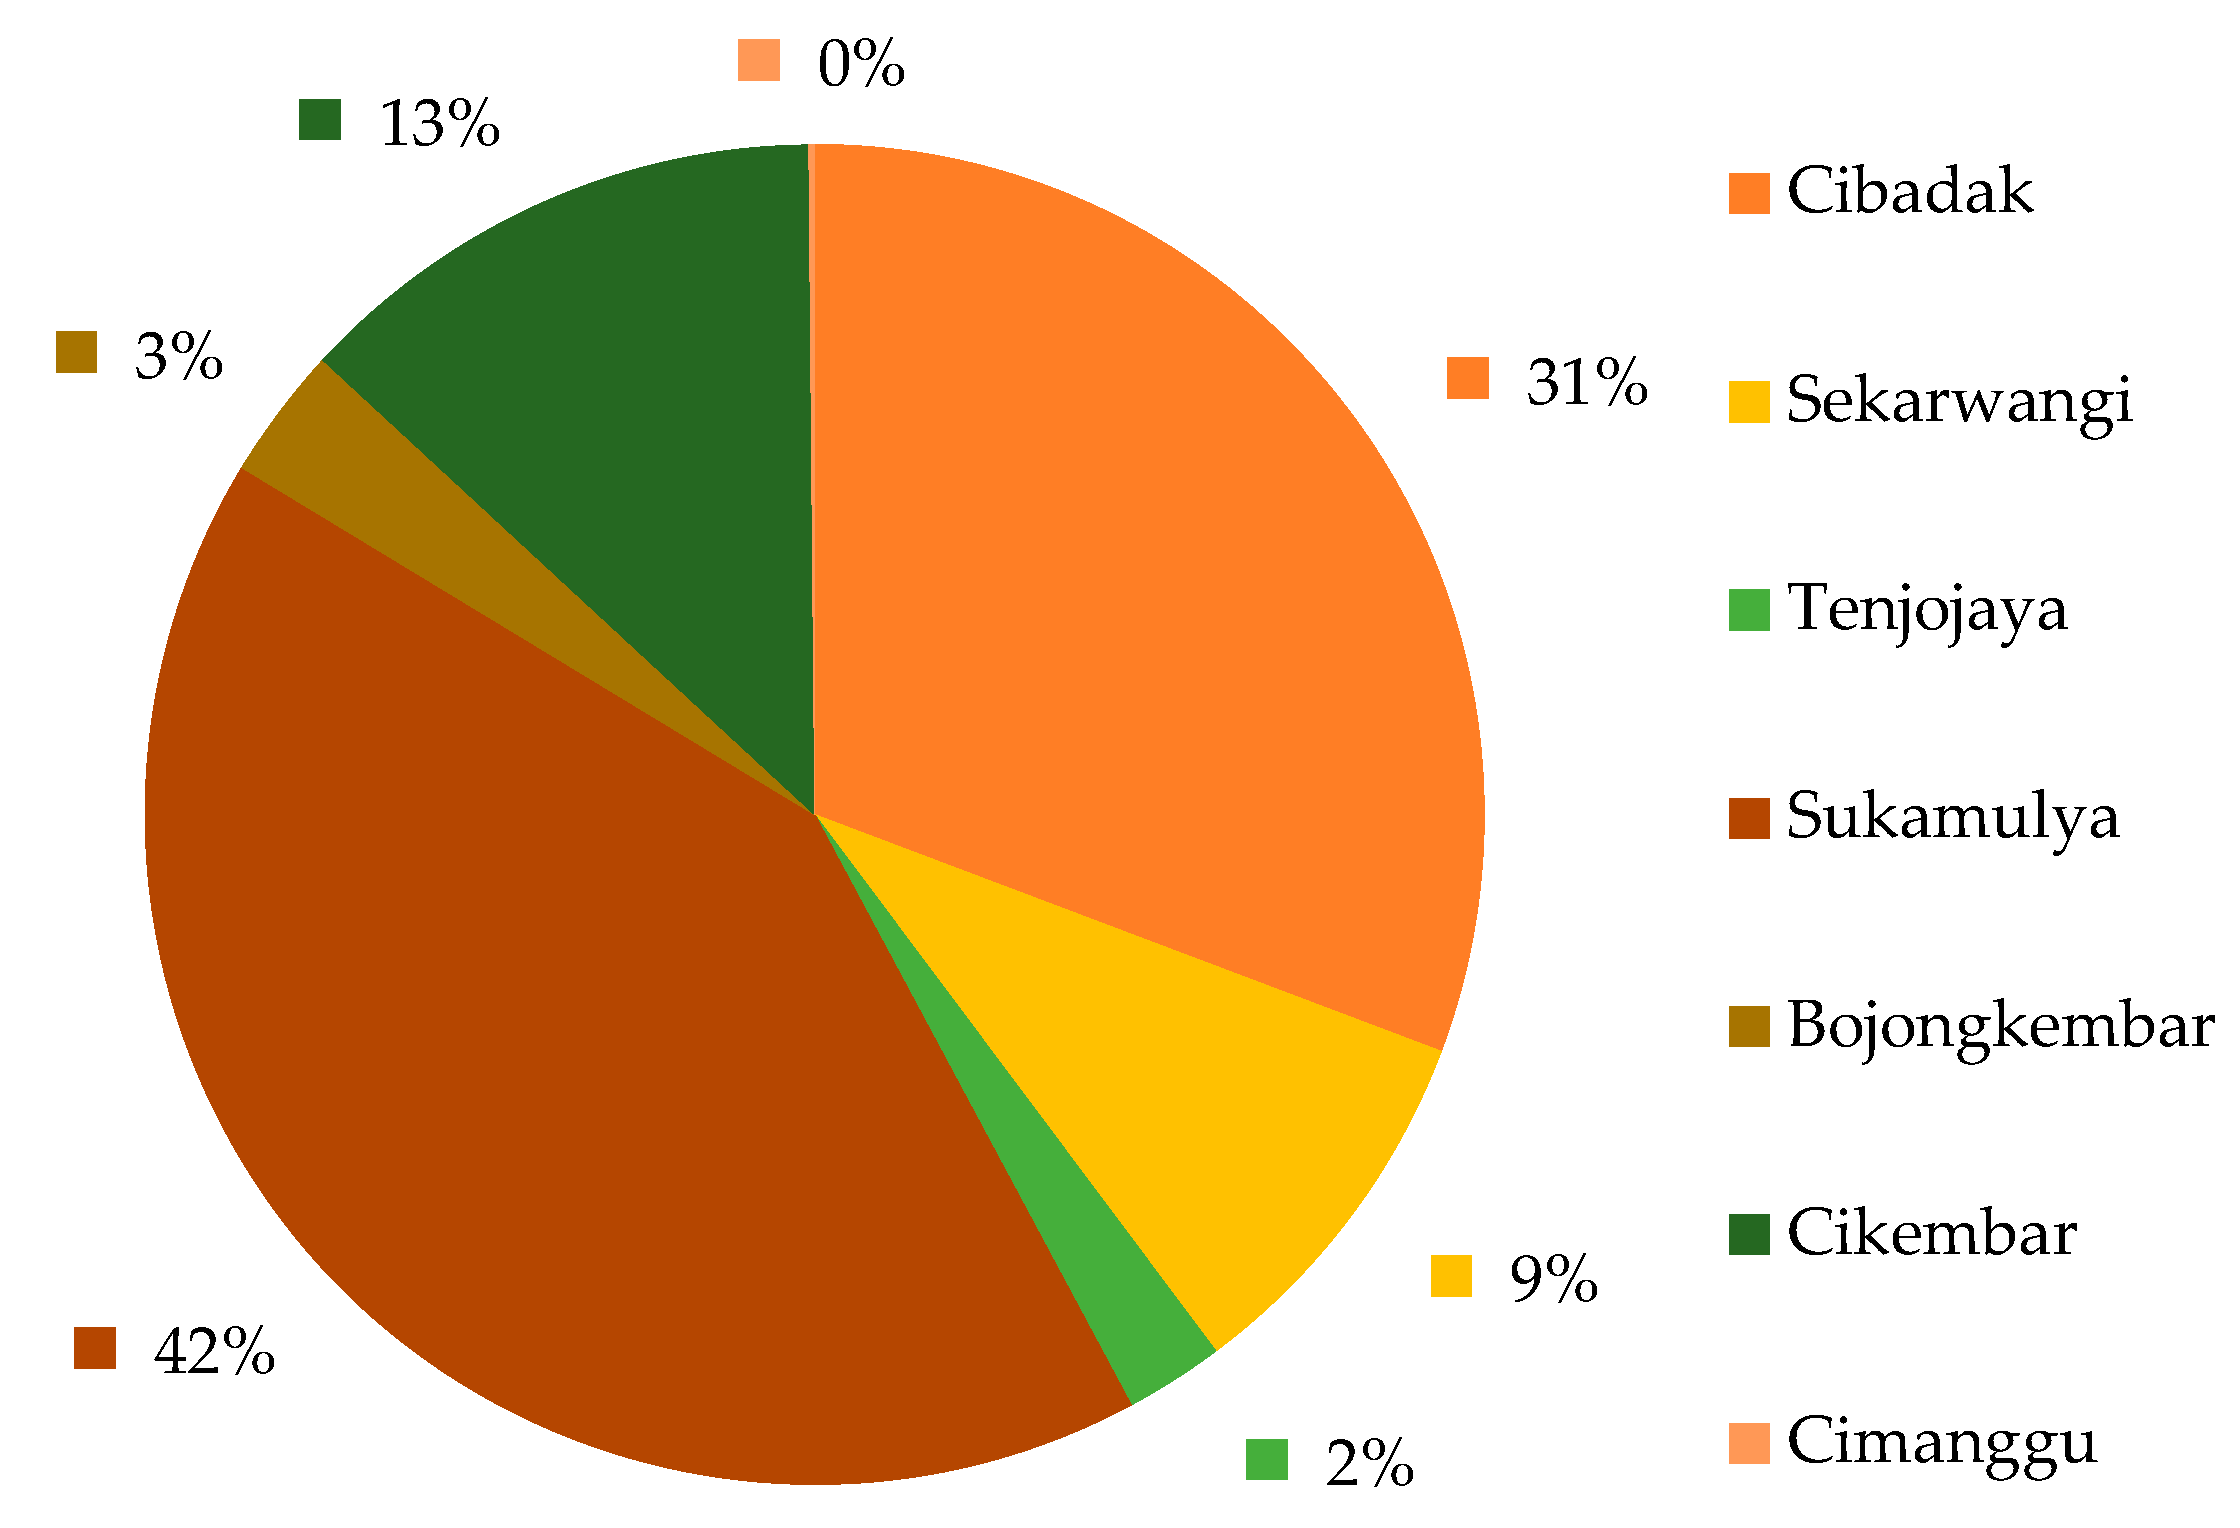
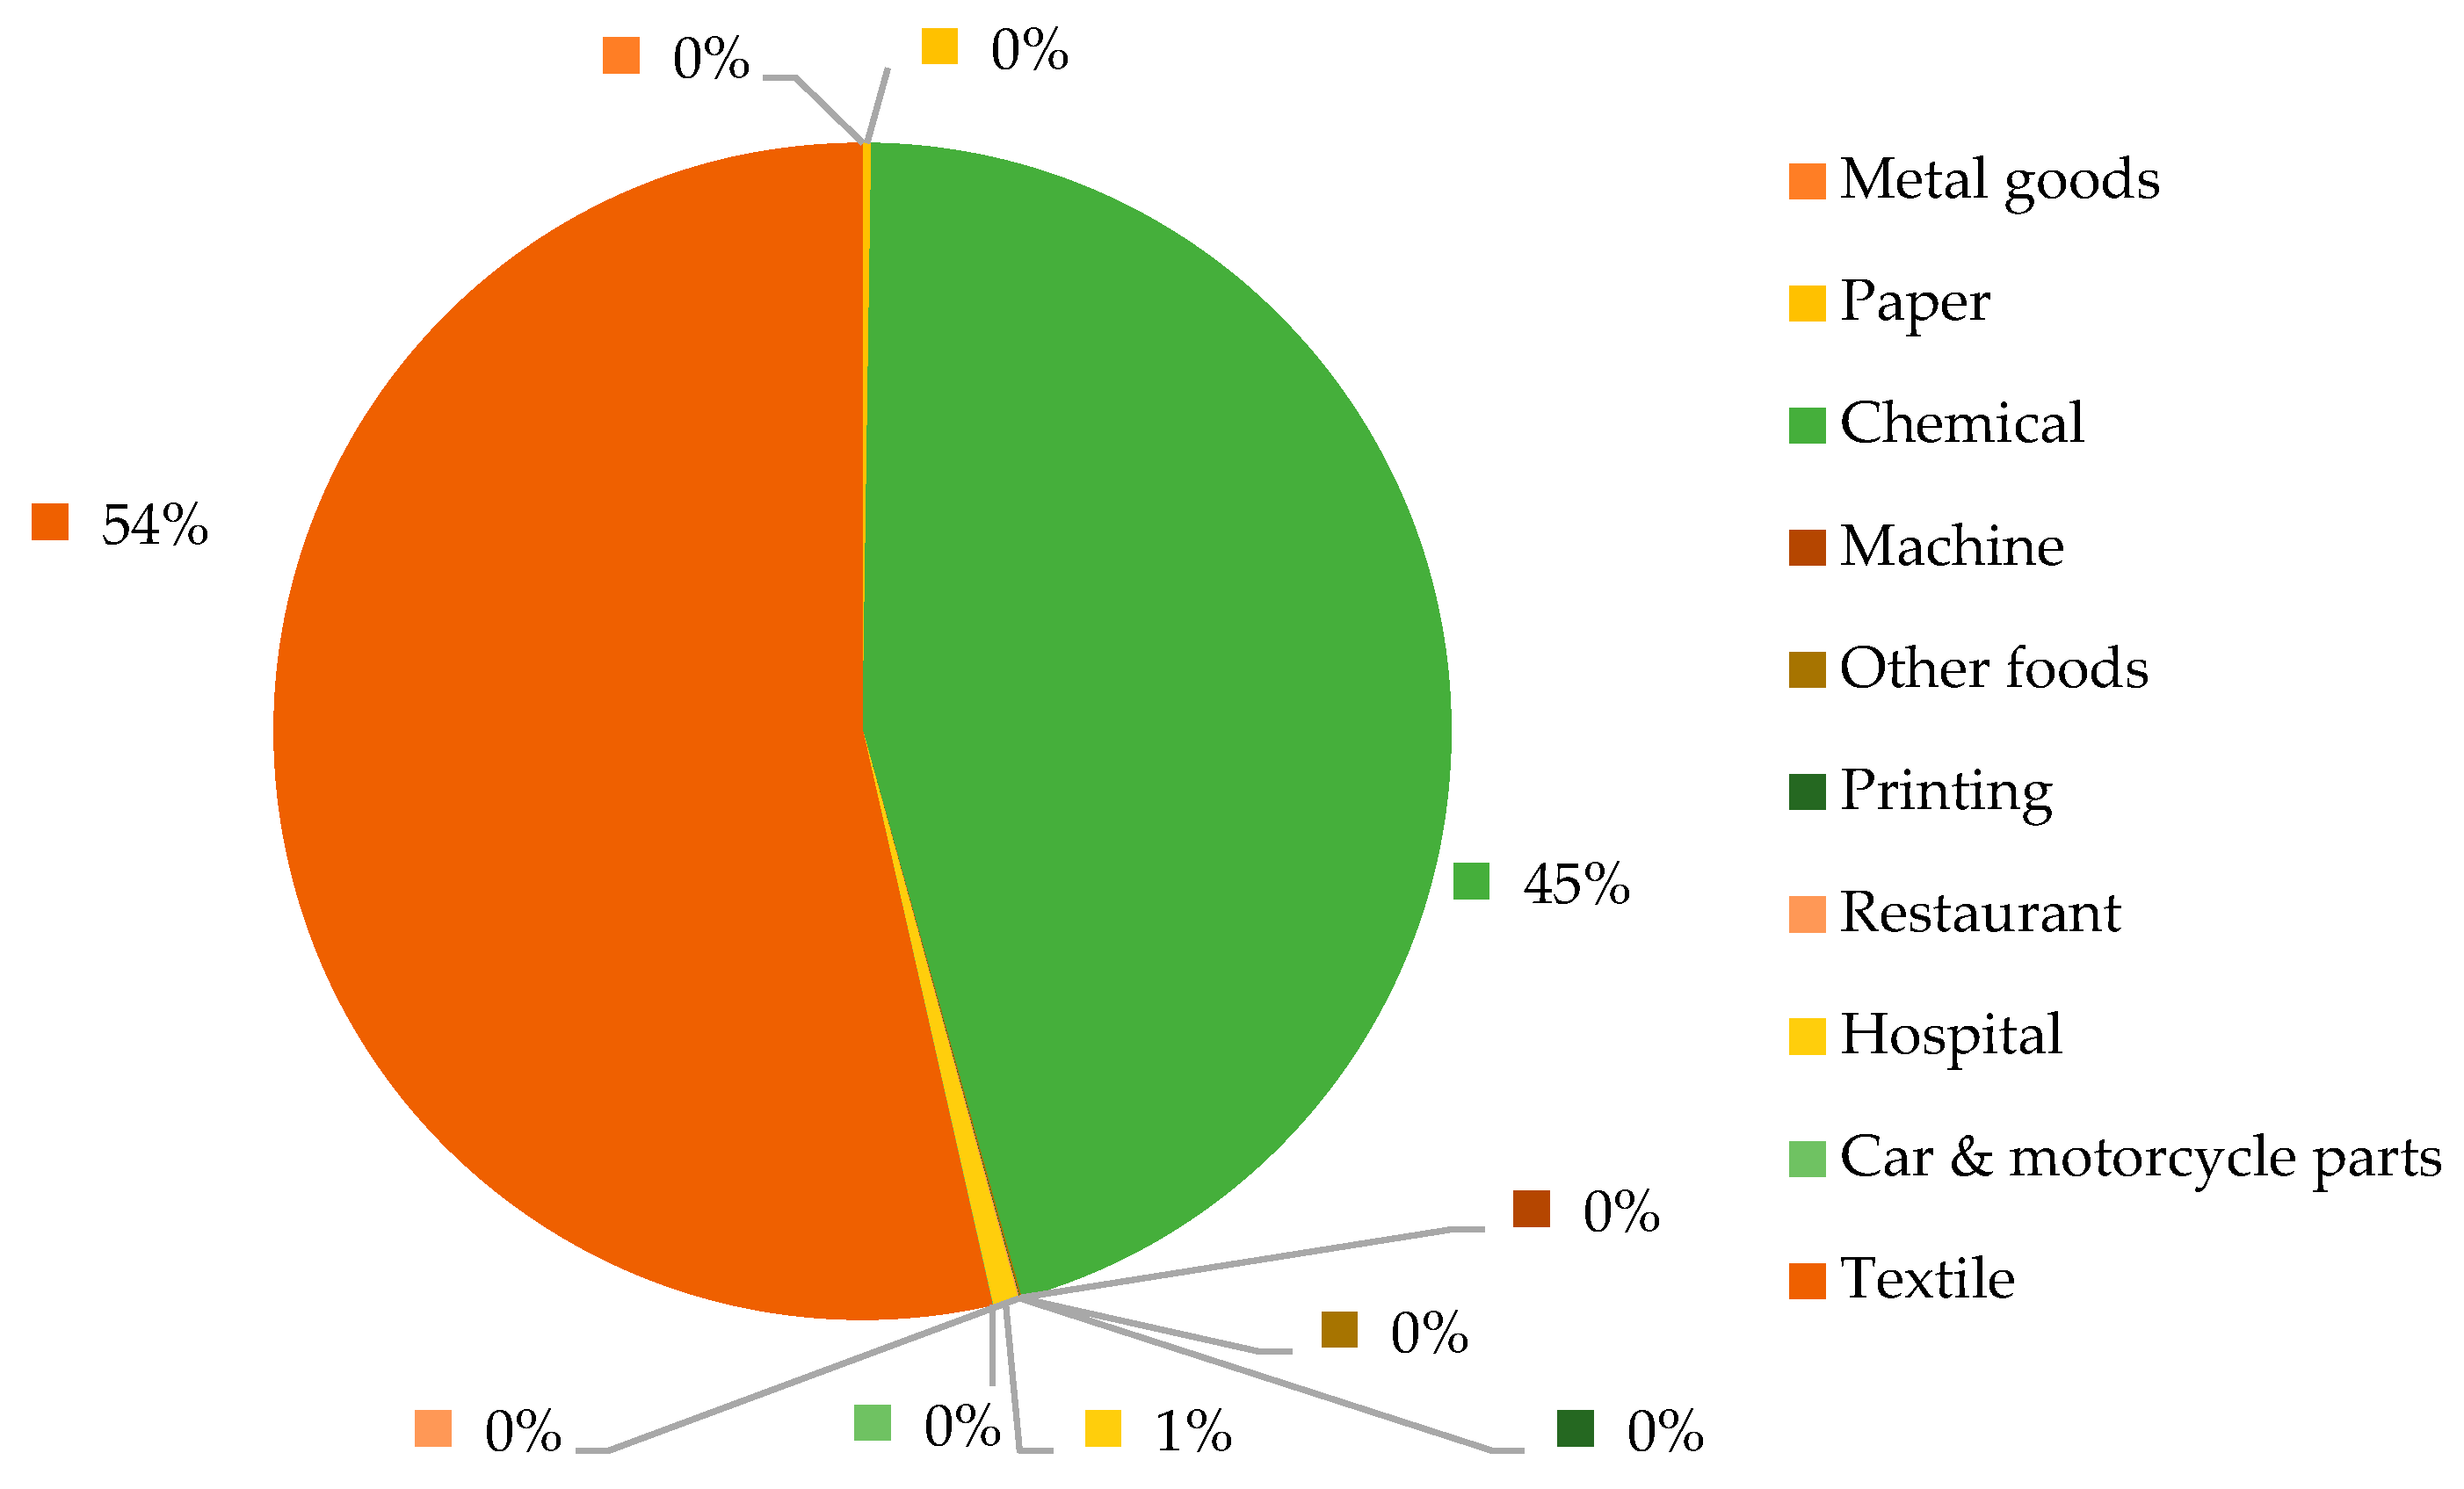
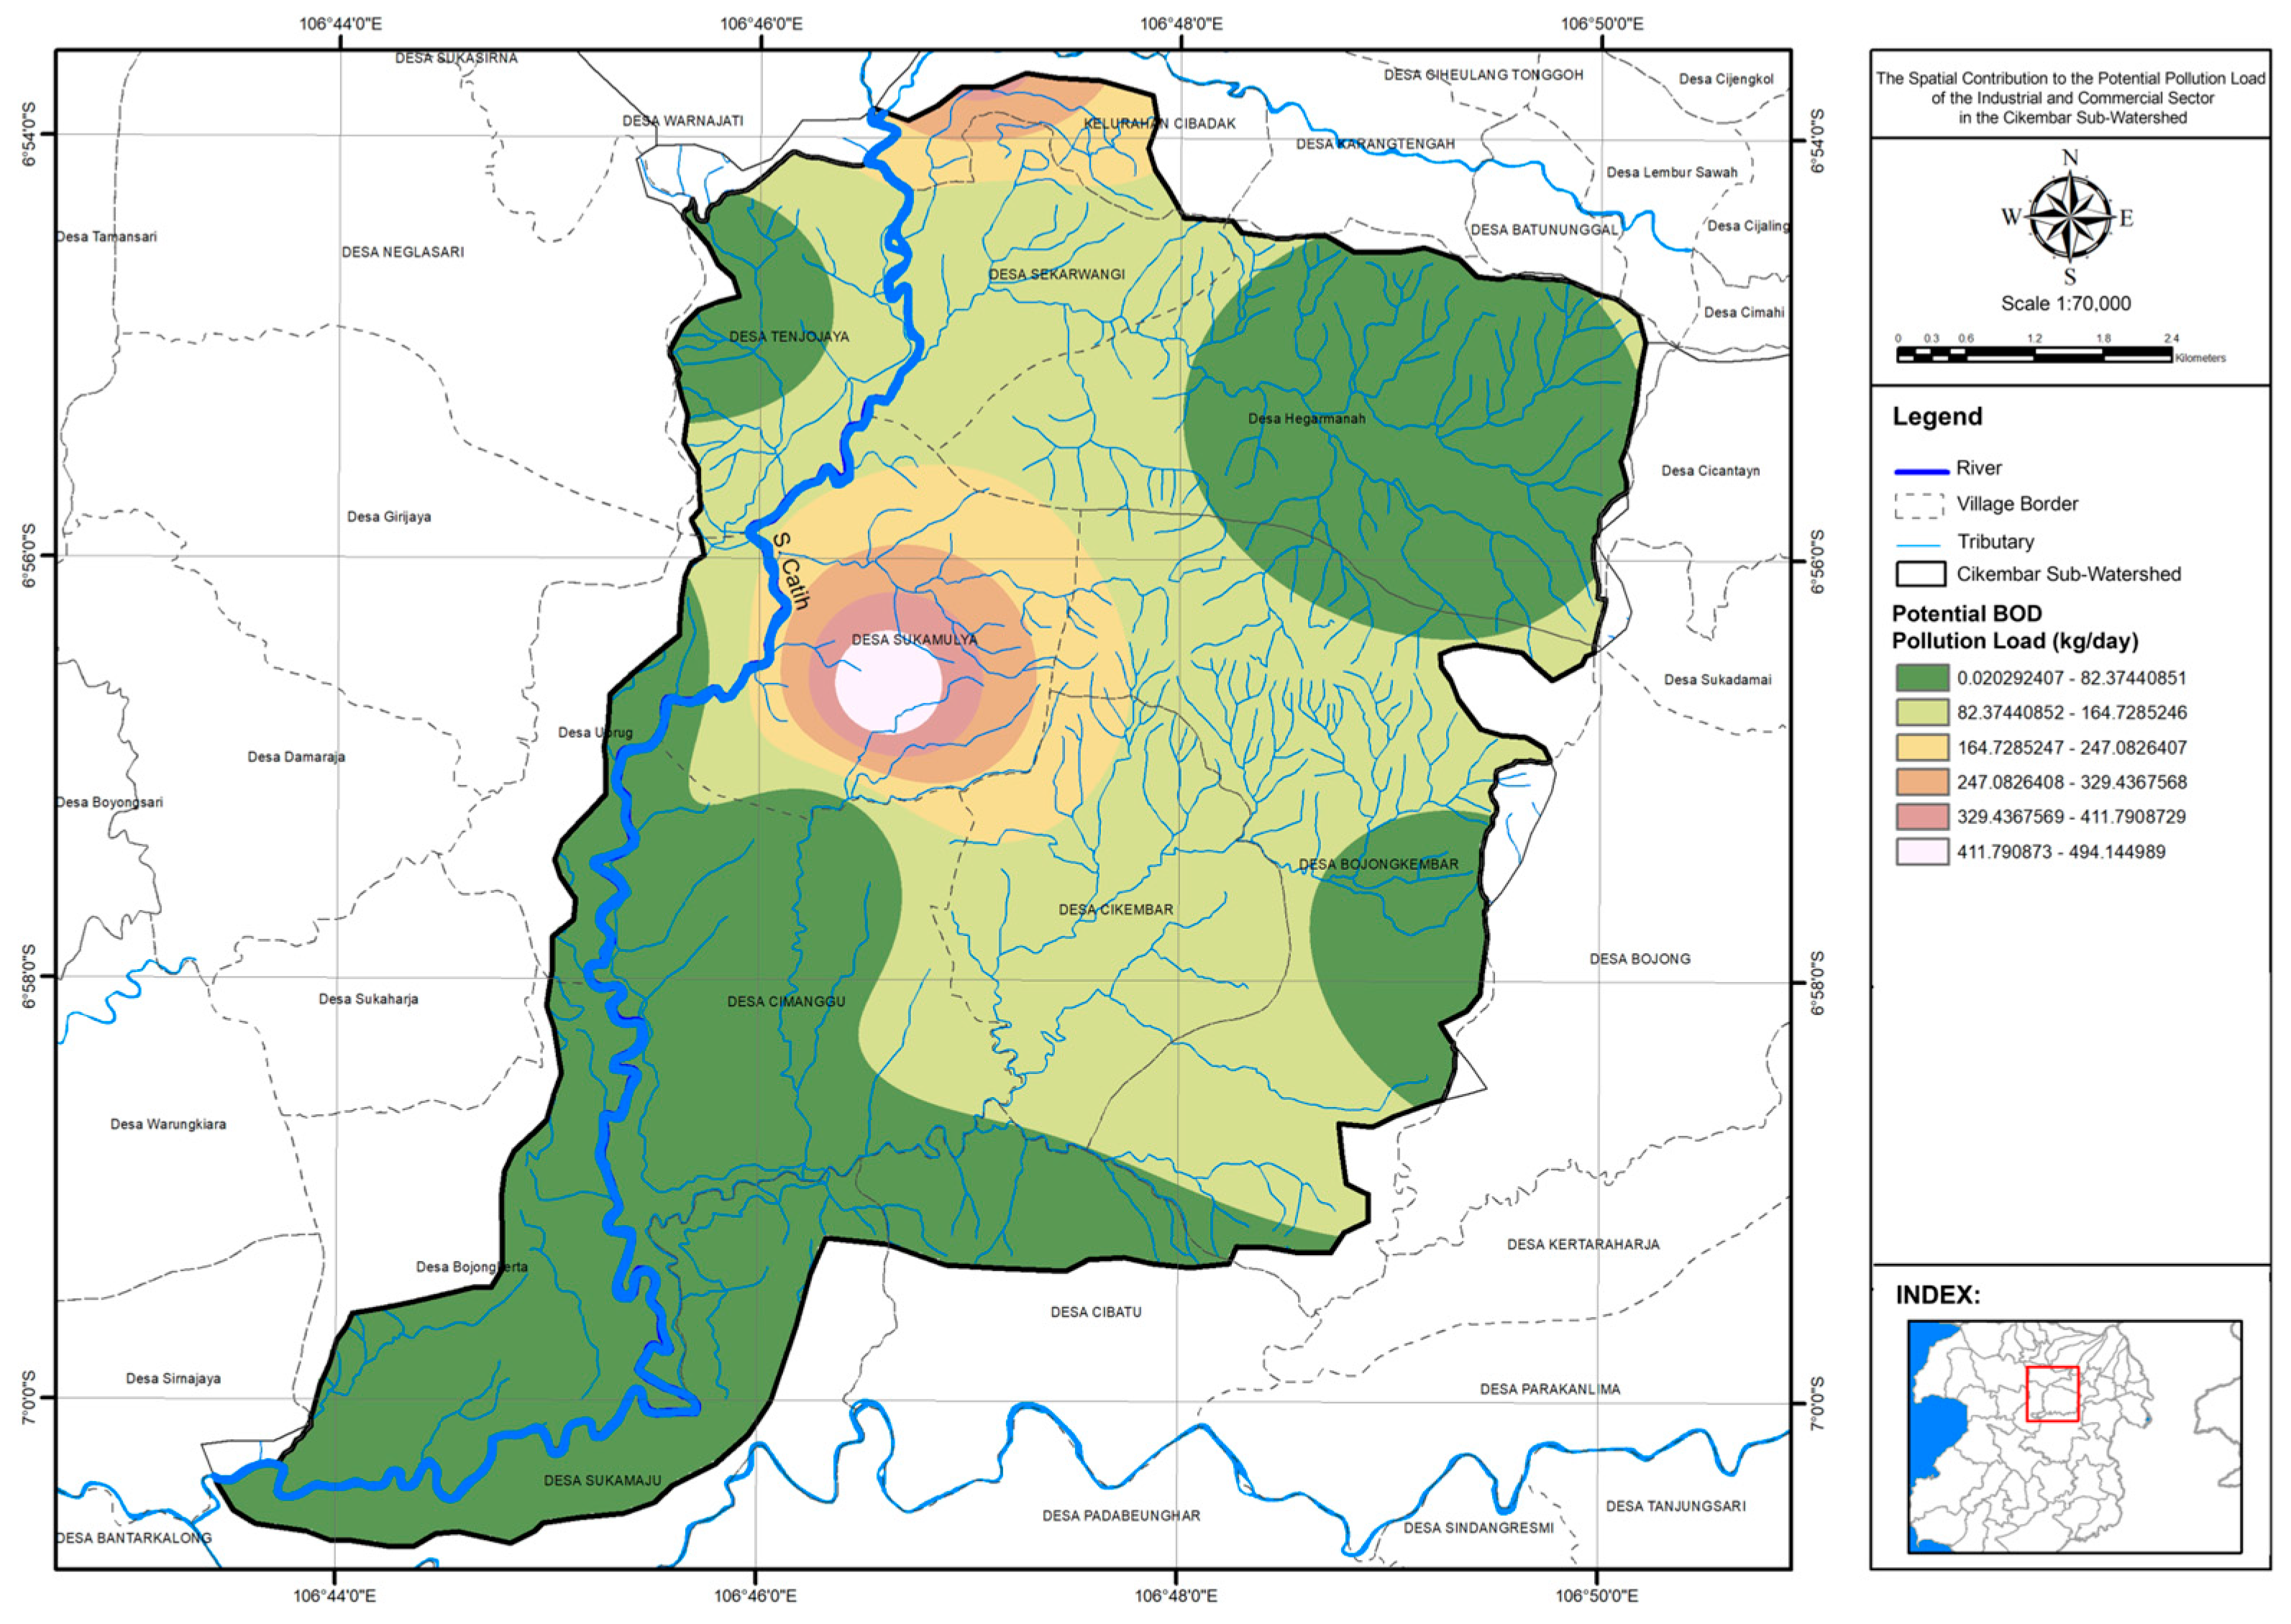
3.2.4. Industrial and Commercial Sector
3.2.5. All Sector
4. Conclusions
Author Contributions
Funding
Data Availability Statement
Conflicts of Interest
References
- Putri, F.K.; Hidayah, E.; Ma’ruf, M.F. Enhancing stormwater management with low impact development (LID): A review of the rain barrel, bioretention, and permeable pavement applicability in Indonesia. Water Sci. Technol. 2023, 87, 2345–2361. [Google Scholar] [CrossRef] [PubMed]
- Capps, K.A.; Bentsen, C.N.; Ramírez, A. Poverty, urbanization, and environmental degradation: Urban streams in the developing world. Freshw. Sci. 2016, 35, 429–435. [Google Scholar] [CrossRef]
- Singh, N.; Poonia, T.; Siwal, S.S.; Srivastav, A.L.; Sharma, H.K.; Mittal, S.K. Challenges of water contamination in urban areas. In Current Directions in Water Scarcity Research; Elsevier: Amsterdam, The Netherlands, 2022; Volume 6, pp. 173–202. [Google Scholar]
- Sutadian, A.D.; Muttil, N.; Yilmaz, A.G.; Perera, B. Development of a water quality index for rivers in West Java Province, Indonesia. Ecol. Indic. 2018, 85, 966–982. [Google Scholar] [CrossRef]
- Aroengbinang, B.W. Driving force analysis of landuse and cover changes in Cimandiri and Cibuni Watersheds. Procedia Environ. Sci. 2015, 24, 184–188. [Google Scholar] [CrossRef]
- Government of Sukabumi Regency. Kajian Lingkungan Hidup Strategis Kabupaten Sukabumi Tahun 2018; Government of Sukabumi Regency: Sukabumi Regency, Indonesia, 2018.
- Khan, M.H.R.B.; Ahsan, A.; Imteaz, M.; Shafiquzzaman, M.; Al-Ansari, N. Evaluation of the surface water quality using global water quality index (WQI) models: Perspective of river water pollution. Sci. Rep. 2023, 13, 20454. [Google Scholar] [CrossRef]
- Varol, M.; Tokatlı, C. Evaluation of the water quality of a highly polluted stream with water quality indices and health risk assessment methods. Chemosphere 2023, 311, 137096. [Google Scholar] [CrossRef]
- Juwana, I.; Rahardyan, N.A.; Permadi, D.A.; Sutadian, A.D. Uncertainty and Sensitivity Analysis of the Effective Implementation of Water Quality Improvement Programs for Citarum River, West Java, Indonesia. Water 2022, 14, 4077. [Google Scholar] [CrossRef]
- Wang, B.; Wang, Y.; Wang, S. Improved water pollution index for determining spatiotemporal water quality dynamics: Case study in the Erdao Songhua River Basin, China. Ecol. Indic. 2021, 129, 107931. [Google Scholar] [CrossRef]
- Lu, J.; Gong, D.; Shen, Y.; Liu, M.; Chen, D. An inversed Bayesian modeling approach for estimating nitrogen export coefficients and uncertainty assessment in an agricultural watershed in eastern China. Agric. Water Manag. 2013, 116, 79–88. [Google Scholar] [CrossRef]
- Li, Y.; Xiao, H.; Zhao, Y.; Zhong, Y.; Fu, G.; Zhou, S.; Xu, Y.; Zhou, K. Study on total phosphorus pollution load estimation and prevention and control countermeasures in Dongting Lake. Energy Rep. 2023, 9, 294–305. [Google Scholar] [CrossRef]
- Zhou, J.; Liu, X.; Liu, X.; Wang, W.; Wang, L. Assessing agricultural non-point source pollution loads in typical basins of upper Yellow River by incorporating critical impacting factors. Process Saf. Environ. Prot. 2023, 177, 17–28. [Google Scholar] [CrossRef]
- Ministry of Environment and Forestry. Guidelines for Determining Water Quality Status; Ministry of Environment and Forestry: Nairobi, Kenya, 2002.
- Herawati, E.Y.; Darmawan, A.; Valina, R.; Rachmanto, P.D.; Arinda, E.S.; Arsyaddirizali, A.; Khasanah, R.I. Analysis of water quality and primary productivity in Welang, Gembong, and Rejoso rivers, Pasuruan East Java, Indonesia. Aquac. Aquar. Conserv. Legis. 2023, 16, 508–522. [Google Scholar]
- Yusuf, I. Inventarisasi dan Identifikasi Sumber dan Beban Pencemaran Air; Pusat Penelitian dan Pengembangan Sumber Daya Air Kementerian Pekerjaan Umum: Jakarta, Indonesia, 2010.
- Kurniawan, B. Inventarisasi dan Identifikasi Sumber Pencemar; Kementerian Lingkungan Hidup dan Kehutanan: Jakarta, Indonesia, 2013.
- Nugraha, W.D.; Hadi, S.P.; Sasongko, S.B.; Istirokhatun, T.; Faradiba, F.; Nopita, A.; Handayani, D.S.; Muhammad, F.I.; Susanto, H.; Budihardjo, M.A. Pollution load capacity assessment by utilizing QUAL2E modelling: A case study of Rambut River, Indonesia. J. Ecol. Eng. 2022, 23, 154–161. [Google Scholar] [CrossRef]
- Djuwita, M.R.; Hartono, D.M.; Mursidik, S.S.; Soesilo, T.E.B. Pollution Load Allocation on Water Pollution Control in the Citarum River. J. Eng. Technol. Sci. 2021, 53, 210112. [Google Scholar] [CrossRef]
- Pradana, H.A.; Novita, E.; Wahyuningsih, S.; Pamungkas, R. Analysis of deoxygenation and reoxygenation rate in the Indonesia River (a case study: Bedadung River East Java). IOP Conf. Ser. Earth Environ. Sci. 2019, 243, 012006. [Google Scholar] [CrossRef]
- Fu, X.; Hou, R.; Yang, P.; Qian, S.; Feng, Z.; Chen, Z.; Wang, F.; Yuan, R.; Chen, H.; Zhou, B. Application of external carbon source in heterotrophic denitrification of domestic sewage: A review. Sci. Total Environ. 2022, 817, 153061. [Google Scholar] [CrossRef] [PubMed]
- Shahid, A.; Khan, A.Z.; Malik, S.; Liu, C.-G.; Mehmood, M.A.; Syafiuddin, A.; Wang, N.; Zhu, H.; Boopathy, R. Advances in green technologies for the removal of effluent organic matter from the urban wastewater. Curr. Pollut. Rep. 2021, 7, 463–475. [Google Scholar] [CrossRef]
- Wurtsbaugh, W.A.; Paerl, H.W.; Dodds, W.K. Nutrients, eutrophication and harmful algal blooms along the freshwater to marine continuum. Wiley Interdiscip. Rev. Water 2019, 6, e1373. [Google Scholar] [CrossRef]
- Tian, M.; He, X.; Feng, Y.; Wang, W.; Chen, H.; Gong, M.; Liu, D.; Clarke, J.L.; van Eerde, A. Pollution by antibiotics and antimicrobial resistance in livestock and poultry manure in China, and countermeasures. Antibiotics 2021, 10, 539. [Google Scholar] [CrossRef]
- Ahmad, K.; Iqhrammullah, M.; Rizki, D.R.; Aulia, A.; Mairizal, A.Q.; Purnama, A.; Qanita, I.; Abdulmadjid, S.; Puspita, K. Heavy metal contamination in aquatic and terrestrial animals resulted from anthropogenic activities in Indonesia: A review. Asian J. Water Environ. Pollut. 2022, 19, 1–8. [Google Scholar] [CrossRef]
- Sarasi, V.; Primiana, I.; Harsanto, B.; Satyakti, Y. Sustainable supply chain of Indonesia’s textile & apparel industry: Opportunities and challenges. Res. J. Text. Appar. 2023. [Google Scholar] [CrossRef]
- Asdak, C. Hidrologi Dan Pengelolaan Daerah Aliran Sungai; UGM Press: Depok, Indonesia, 2023. [Google Scholar]
- Slamet, J.S. Kesehatan Lingkungan; Gajah Mada Universitiy Press: Depok, Indonesia, 1994. [Google Scholar]
- Lestari, H.; Haribowo, R.; Yuliani, E. Determination of pollution load capacity using QUAL2Kw program on The Musi River Palembang. Civ. Environ. Sci. J. (CIVENSE) 2019, 2, 105–116. [Google Scholar] [CrossRef]
- Sawyer, C.N.; McCarty, P.L.; Parkin, G.F. Chemistry for Environmental Engineering and Science; McGraw-Hill: New York, NY, USA, 2003. [Google Scholar]
- Juwana, I.; Perera, B.; Muttil, N. Conceptual framework for the development of West Java water sustainability index. In Proceedings of the 18th World IMACS/MODSIM Congress, Cairns, QLD, Australia, 13–17 July 2009. [Google Scholar]


| No. | Villages | Number of Population (Persons) | Area (ha) | Population Density (Persons/ha) |
|---|---|---|---|---|
| 1 | Hegarmanah | 22,779 | 1328.00 | 17.15 |
| 2 | Ubrug | 2241 | 215.00 | 10.42 |
| 3 | Bojongkerta | 8374 | 637.00 | 13.15 |
| 4 | Cibadak | 7266 | 167.00 | 43.51 |
| 5 | Sekarwangi | 11,232 | 458.00 | 24.52 |
| 6 | Tenjojaya | 4653 | 496.00 | 9.38 |
| 7 | Sukamulya | 10,023 | 795.00 | 12.61 |
| 8 | Bojongkembar | 30,576 | 1522.00 | 20.09 |
| 9 | Cikembar | 16,262 | 795.00 | 20.46 |
| 10 | Cimanggu | 15,736 | 1094.00 | 14.38 |
| 11 | Cibatu | 814 | 269.00 | 3.03 |
| 12 | Sukamaju | 6918 | 515.00 | 13.43 |
| Total | 136,874 | 8291.00 | 16.84 |
| No. | Categories | Area (ha) |
|---|---|---|
| 1 | 2950–3200 mm/year | 375.48 |
| 2 | 3200–3450 mm/year | 6580.79 |
| 3 | 3450–3700 mm/year | 1508.17 |
| No. | Categories | Area (ha) |
|---|---|---|
| 1 | Forest | 58.591 |
| 2 | Industry | 31.292 |
| 3 | Gardens/Plantations | 3891.972 |
| 4 | Settlement Area | 1459.163 |
| 5 | Grass/Empty Land | 89.714 |
| 6 | Irrigation Rice Fields | 314.786 |
| 7 | Rainfed Rice Fields | 695.378 |
| 8 | Shrubs | 201.752 |
| 9 | Moorland/Field | 1631.324 |
| 10 | Body of water | 90.461 |
| Area | Value |
|---|---|
| Urban | 1 |
| Rural | 0.8125 |
| Inland | 0.6250 |
| Value of α | Distance to the River (m) | Sanitary Pattern |
|---|---|---|
| 1 | 0–100 | Direct disposal to the river |
| 0.85 | 100–500 | Open canal |
| 0.3 | >500 | Septic tank |
| Type of Agriculture | Parameters of Agricultural Waste 1 | ||||
|---|---|---|---|---|---|
| TSS | BOD | COD | Total-N | Total-P | |
| Kg/ha/Planting Season | |||||
| Rice field | 0.4 | 225 | 337.5 | 20 | 10 |
| Secondary crops | 2.2 | 125 | 187.5 | 10 | 5 |
| Other agricultures | 0.6 | 32.5 | 48.75 | 3 | 1.5 |
| Type of Livestock | Parameters of Agricultural Waste 1 | |||
|---|---|---|---|---|
| BOD | COD | Total-N | Total-P | |
| Kg/ha/Planting Season | ||||
| Cattle | 292 | 717 | 0.933 | 0.153 |
| Sheep | 55.7 | 136 | 0.278 | 0.063 |
| Chicken | 2.36 | 5.59 | 0.002 | 0.003 |
| Duck | 0.88 | 2.22 | 0.001 | 0.005 |
| Buffalo | 207 | 530 | 2.6 | 0.39 |
| Horse | 226 | 558 | 38.083 | 0.306 |
| Goat | 34.1 | 92.9 | 1.624 | 0.115 |
| Industrial Sector | BOD (g/Day/Employee) |
|---|---|
| Dyeing | 79.1 |
| Other foods | 37.9 |
| Metal | 10.3 |
| Paper | 17.9 |
| Polyester fiber | 47.1 |
| Textile | 219.2 |
| Laundry | 96.4 |
| Machine | 4.7 |
| Plastic goods | 57.3 |
| Car & motorcycle parts | 13.5 |
| Ceramic and tile | 2.0 |
| Tannery | 144.4 |
| Soap and detergent | 50.4 |
| Chemical | 1898.2 |
| Metal goods | 0.2 |
| Printing | 0.6 |
| Glass | 0.3 |
| Hospital | 123 |
| Hotel | 55 |
| Restaurant | 17 |
| Monitoring Location | PI Value | Description |
|---|---|---|
| Cicatih River Point 1 | 1.82 | Slightly polluted |
| Cicatih River Point 2 | 1.81 | Slightly polluted |
| Cicatih River Point 3 | 1.82 | Slightly polluted |
| Cicatih River Point 4 | 1.82 | Slightly polluted |
| Cicatih River Point 5 | 1.82 | Slightly polluted |
| Cicatih River Point 6 | 1.82 | Slightly polluted |
| Cicatih River Point 7 | 2.06 | Slightly polluted |
| Cicatih River Point 8 | 1.83 | Slightly polluted |
| Cicatih River Point 9 | 2.28 | Slightly polluted |
| Cicatih River Point 10 | 2.47 | Slightly polluted |
| District | Village | Potential Pollution Load (kg/Day) | ||||
|---|---|---|---|---|---|---|
| TSS | BOD | COD | Total-N | Total-P | ||
| Cicantayan | Hegarmanah | 210.99 | 222.10 | 305.38 | 10.83 | 1.17 |
| Warung Kiara | Ubrug | 61.18 | 64.40 | 88.55 | 3.14 | 0.34 |
| Bojongkerta | 167.16 | 175.96 | 241.95 | 8.58 | 0.92 | |
| Cibadak | Cibadak | 130.87 | 137.76 | 189.42 | 6.72 | 0.72 |
| Sekarwangi | 210.78 | 221.87 | 305.08 | 10.82 | 1.16 | |
| Tenjojaya | 121.13 | 127.51 | 175.32 | 6.22 | 0.67 | |
| Cikembar | Sukamulya | 129.41 | 136.22 | 187.31 | 6.64 | 0.72 |
| Bojongkembar | 283.21 | 298.12 | 409.91 | 14.53 | 1.57 | |
| Cikembar | 150.63 | 158.56 | 218.02 | 7.73 | 0.83 | |
| Cimanggu | 222.05 | 233.73 | 321.39 | 11.39 | 1.23 | |
| Cibatu | 7.54 | 7.93 | 10.91 | 0.39 | 0.04 | |
| Sukamaju | 107.96 | 113.65 | 156.26 | 5.54 | 0.60 | |
| Total | 1802.93 | 1897.82 | 2609.50 | 92.52 | 9.96 | |
| District | Village | Potential Pollution Load (kg/Day) | ||||
|---|---|---|---|---|---|---|
| TSS | BOD | COD | Total-N | Total-P | ||
| Cicantayan | Hegarmanah | 0.02 | 4.66 | 7.00 | 0.42 | 0.21 |
| Warung Kiara | Ubrug | 0.01 | 3.45 | 5.17 | 0.31 | 0.15 |
| Bojongkerta | 0.04 | 20.03 | 30.05 | 1.78 | 0.89 | |
| Cibadak | Cibadak | 0.00 | 1.77 | 2.65 | 0.16 | 0.08 |
| Sekarwangi | 0.01 | 1.09 | 1.64 | 0.10 | 0.05 | |
| Tenjojaya | 0.01 | 0.80 | 1.20 | 0.07 | 0.04 | |
| Cikembar | Sukamulya | 0.02 | 5.35 | 8.02 | 0.48 | 0.24 |
| Bojongkembar | 0.03 | 11.28 | 16.91 | 1.01 | 0.50 | |
| Cikembar | 0.02 | 4.02 | 6.03 | 0.36 | 0.18 | |
| Cimanggu | 0.03 | 9.31 | 13.97 | 0.83 | 0.41 | |
| Cibatu | 0.00 | 0.25 | 0.37 | 0.02 | 0.01 | |
| Sukamaju | 0.01 | 4.92 | 7.39 | 0.44 | 0.22 | |
| Total | 0.20 | 66.94 | 100.41 | 5.97 | 2.98 | |
| District | Village | Potential Pollution Load (kg/Day) | |||
|---|---|---|---|---|---|
| BOD | COD | Total-N | Total-P | ||
| Cicantayan | Hegarmanah | 26.668 | 64.513 | 0.134 | 0.035 |
| Warung Kiara | Ubrug | 7.072 | 16.998 | 0.030 | 0.010 |
| Bojongkerta | 3.154 | 7.841 | 0.038 | 0.005 | |
| Cibadak | Cibadak | 0 | 0 | 0 | 0 |
| Sekarwangi | 0 | 0 | 0 | 0 | |
| Tenjojaya | 0 | 0 | 0 | 0 | |
| Cikembar | Sukamulya | 0 | 0 | 0 | 0 |
| Bojongkembar | 11.596 | 29.568 | 0.268 | 0.030 | |
| Cikembar | 256.408 | 608.766 | 0.350 | 0.329 | |
| Cimanggu | 0.935 | 2.428 | 0.031 | 0.002 | |
| Cibatu | 11.051 | 27.167 | 0.091 | 0.015 | |
| Sukamaju | 131.370 | 313.807 | 0.317 | 0.169 | |
| Total | 448.253 | 1071.089 | 1.259 | 0.595 | |
| District | Village | Potential Pollution Load (kg/Day) | |
|---|---|---|---|
| BOD | COD | ||
| Cibadak | Cibadak | 366.31 | 549.47 |
| Sekarwangi | 107.62 | 161.43 | |
| Tenjojaya | 28.47 | 42.71 | |
| Cikembar | Sukamulya | 494.35 | 741.52 |
| Bojongkembar | 38.15 | 57.22 | |
| Cikembar | 154.77 | 232.15 | |
| Cimanggu | 1.78 | 2.67 | |
| Total | 1191.45 | 1787.18 | |
| Type of Industry | Potential Pollution Load (kg/Day) | |
|---|---|---|
| BOD | COD | |
| Metal goods | 0.17 | 0.26 |
| Paper | 2.69 | 4.03 |
| Chemical | 540.99 | 811.48 |
| Machine | 0.13 | 0.20 |
| Other foods | 0.53 | 0.80 |
| Printing | 0.14 | 0.20 |
| Restaurant | 0.41 | 0.61 |
| Hospital | 8.36 | 12.55 |
| Car & motorcycle parts | 0.16 | 0.24 |
| Textile | 637.87 | 956.81 |
| Total | 1191.45 | 1787.18 |
| Type of Agriculture | Potential Pollution Load (kg/Day) | ||||
|---|---|---|---|---|---|
| TSS | BOD | COD | Total-N | Total-P | |
| Domestic | 1802.93 | 1897.82 | 2609.50 | 92.52 | 9.96 |
| Agricultural | 0.20 | 66.94 | 100.41 | 5.97 | 2.98 |
| Livestock | - | 448.25 | 1071.09 | 1.26 | 0.60 |
| Industrial and Commercial | - | 1191.45 | 1787.18 | - | - |
| Total | 1803.13 | 3604.46 | 5568.17 | 99.74 | 13.54 |
Disclaimer/Publisher’s Note: The statements, opinions and data contained in all publications are solely those of the individual author(s) and contributor(s) and not of MDPI and/or the editor(s). MDPI and/or the editor(s) disclaim responsibility for any injury to people or property resulting from any ideas, methods, instructions or products referred to in the content. |
© 2024 by the authors. Licensee MDPI, Basel, Switzerland. This article is an open access article distributed under the terms and conditions of the Creative Commons Attribution (CC BY) license (https://creativecommons.org/licenses/by/4.0/).
Share and Cite
Juwana, I.; Sodri, A.; Muttil, N.; Hikmat, R.R.; Indira, A.L.; Sutadian, A.D. Potential Pollution Loads of the Cikembar Sub-Watershed to the Cicatih River, West Java, Indonesia. Water 2024, 16, 256. https://doi.org/10.3390/w16020256
Juwana I, Sodri A, Muttil N, Hikmat RR, Indira AL, Sutadian AD. Potential Pollution Loads of the Cikembar Sub-Watershed to the Cicatih River, West Java, Indonesia. Water. 2024; 16(2):256. https://doi.org/10.3390/w16020256
Chicago/Turabian StyleJuwana, Iwan, Ahyahudin Sodri, Nitin Muttil, Rafid Risandri Hikmat, Adryan Lukman Indira, and Arief Dhany Sutadian. 2024. "Potential Pollution Loads of the Cikembar Sub-Watershed to the Cicatih River, West Java, Indonesia" Water 16, no. 2: 256. https://doi.org/10.3390/w16020256
APA StyleJuwana, I., Sodri, A., Muttil, N., Hikmat, R. R., Indira, A. L., & Sutadian, A. D. (2024). Potential Pollution Loads of the Cikembar Sub-Watershed to the Cicatih River, West Java, Indonesia. Water, 16(2), 256. https://doi.org/10.3390/w16020256