Article

Integrated Use of GIS and USLE Models for LULC Change Analysis and Soil Erosion Risk Assessment in the Hulan River Basin, Northeastern China

1
School of Hydraulic and Electric Power, Heilongjiang University, Harbin 150080, China
2
Institute of Groundwater in Cold Region, Heilongjiang University, Harbin 150080, China
3
Institute of Natural Sciences, North-Eastern Federal University, Yakutsk 677000, Russia
*
Author to whom correspondence should be addressed.
Water 2024, 16(2), 241; https://doi.org/10.3390/w16020241
Submission received: 23 November 2023 / Revised: 22 December 2023 / Accepted: 26 December 2023 / Published: 10 January 2024

Abstract

:
The Hulan River Basin is located in the black soil region of northeast China. This region is an important food-producing area and the susceptibility of black soil to erosion increases the risk of soil erosion, which is a serious environmental problem that affects agricultural productivity, water supply, and other important aspects of the region. In this paper, the changes in LULC (land use and land cover) in the basin between 2001 and 2020 were thoroughly analysed using GIS (geographic information system) and USLE (universal soil loss equation) models. The soil erosion risk in the Hulan River Basin between 2001 and 2020 was also studied and soil erosion hot spots were identified to target those that remained significant even under the implementation of soil conservation measures. Precipitation data were used to obtain the R factor distribution, LULC classification was adopted to assess the C factor distribution, soil data were employed to estimate the K factor distribution, DEM (Digital Elevation Model) data were used to generate an LS factor map, and slope and LULC data were considered to produce a P factor distribution map. These factors were based on the model parameters of the USLE. The findings of LULC change analysis over the last 20 years indicated that, while there have been nonobvious changes, agricultural land has continued to occupy the bulk of the area in the Hulan River Basin. The increase in areas used for human activities was the most notable trend. In 2001, the model-predicted soil erosion rate varied between 0 and 120 t/ha/yr, with an average of 4.63 t/ha/yr. By 2020, the estimated soil erosion rate varied between 0 and 193 t/ha/yr, with an average of 7.34 t/ha/yr. The Hulan River Basin was classified into five soil erosion risk categories. Most categories encompassed extremely low-risk levels and, over the past 20 years, the northeastern hilly regions of the basin have experienced the highest concentration of risk change areas. The northeastern hilly and mountainous regions comprised the risk change area and the regions that are most susceptible to erosion exhibited a high concentration of human production activities. In fact, the combined use of GIS and USLE modelling yielded erosion risk areas for mapping risk classes; these results could further assist local governments in improving soil conservation efforts.

1. Introduction

Soil erosion poses a worldwide challenge because it results in one of the most severe forms of soil degradation. Its origin lies in soil particles being transported by wind or water from one area to another, where they are deposited [1,2]. This process causes soil quality deterioration, crop yield reduction, compaction, drainage issues, and loss of organic matter, which leads to nutrient depletion and results in productivity decline [3,4,5]. Of the total global agricultural soil degradation, soil erosion accounts for 56% of the observable soil degradation [6]. More intuitively, according to area data published by the Food and Agriculture Organization (FAO), the loss of productive agricultural land due to erosion varies between 50,000 and 70,000 hm2/a. Approximately 55% of these losses can be attributed to water erosion and 33% can be attributed to wind erosion. As reported by Biggelaar et al. [7], the average soil erosion ranges from 12 to 15 t/ha/yr worldwide and is a worldwide phenomenon affecting more than 200 million hm2 of land worldwide.
For the purpose of sustainable land use and exploration, several models based on land use, geomorphological, vegetation, and climatic data have been developed with the aim of predicting and quantifying soil erosion, identifying areas susceptible to erosion, estimating the erosion rate, and determining the probable causes behind its occurrence to better manage land. The universal soil loss equation (USLE), an empirical model derived from experimental data and created by Wischmeier and Smith [8], is one example of such a model. The USLE is a popular model that performs best for managing watersheds but may also be applied to broader areas [9,10]. At the watershed scale, this approach is useful for determining geographic patterns of the yearly soil loss. In a large study area, such as this one, measuring soil erosion to determine the regional erosion risk requires additional time and resources [11] and, under conditions where field sampling and surveys cannot be accommodated, the USLE model can more quickly help researchers determine the erosion risk in the study area, among other issues [12,13]. The rainfall erosion (R), soil erodibility (K), slope length and gradient (L and S, respectively), vegetation cover and crop management (C), and supporting practices (P) factors represent a few of the specific characteristics that influence the potential for soil erosion in each watershed [14,15]. To manage land use and land cover changes [16], the algorithms of the USLE model can be implemented using a geographic information system (GIS) [17] in the case of limited datasets and time, which, in turn, can facilitate soil erosion determination.
The Hulan River Basin is located in the black soil area of northeastern China. This region is a high-yield agricultural area and is an important commercial grain base in the fertile Heilongjiang Province, where black soil is known for its high fertility and suitability for agricultural production [18]. However, due to their unique characteristics, the black soils in the northeastern region are brittle and prone to erosion [19]. In addition, rapid socioeconomic development has led to intensified human activities [20], large-scale vegetation destruction, and the reduced erosion resistance of black soils. These processes have rendered black soils vulnerable to erosion; as a result, agricultural production and food security in the region are seriously threatened. Yu et al. [21] stated that approximately 38% of cultivated land in the northeastern black soil region is affected by erosion. Specifically, approximately 25,000 large gullies in the region have caused damage to more than 39,000 hm2 of farmland [22]. Due to these processes, the regional food security and agricultural output are seriously challenged by the increased susceptibility of black soil to erosion. To evaluate the soil erosion risk in the Hulan River Basin between 2001 and 2020, this study aimed to integrate GIS and USLE modelling techniques, considering the aforementioned concerns. This study aimed to (1) classify the model factors and LULC data at two time points, i.e., 2020 and 2001; (2) estimate the soil loss rate in the Hulan River Basin in both years and perform comparative analysis and risk level mapping; and (3) suggest feasible strategies for reducing soil erosion so that planners can better safeguard the watershed and prevent future breakthroughs.

2. Overview of the Study Area and Data Sources

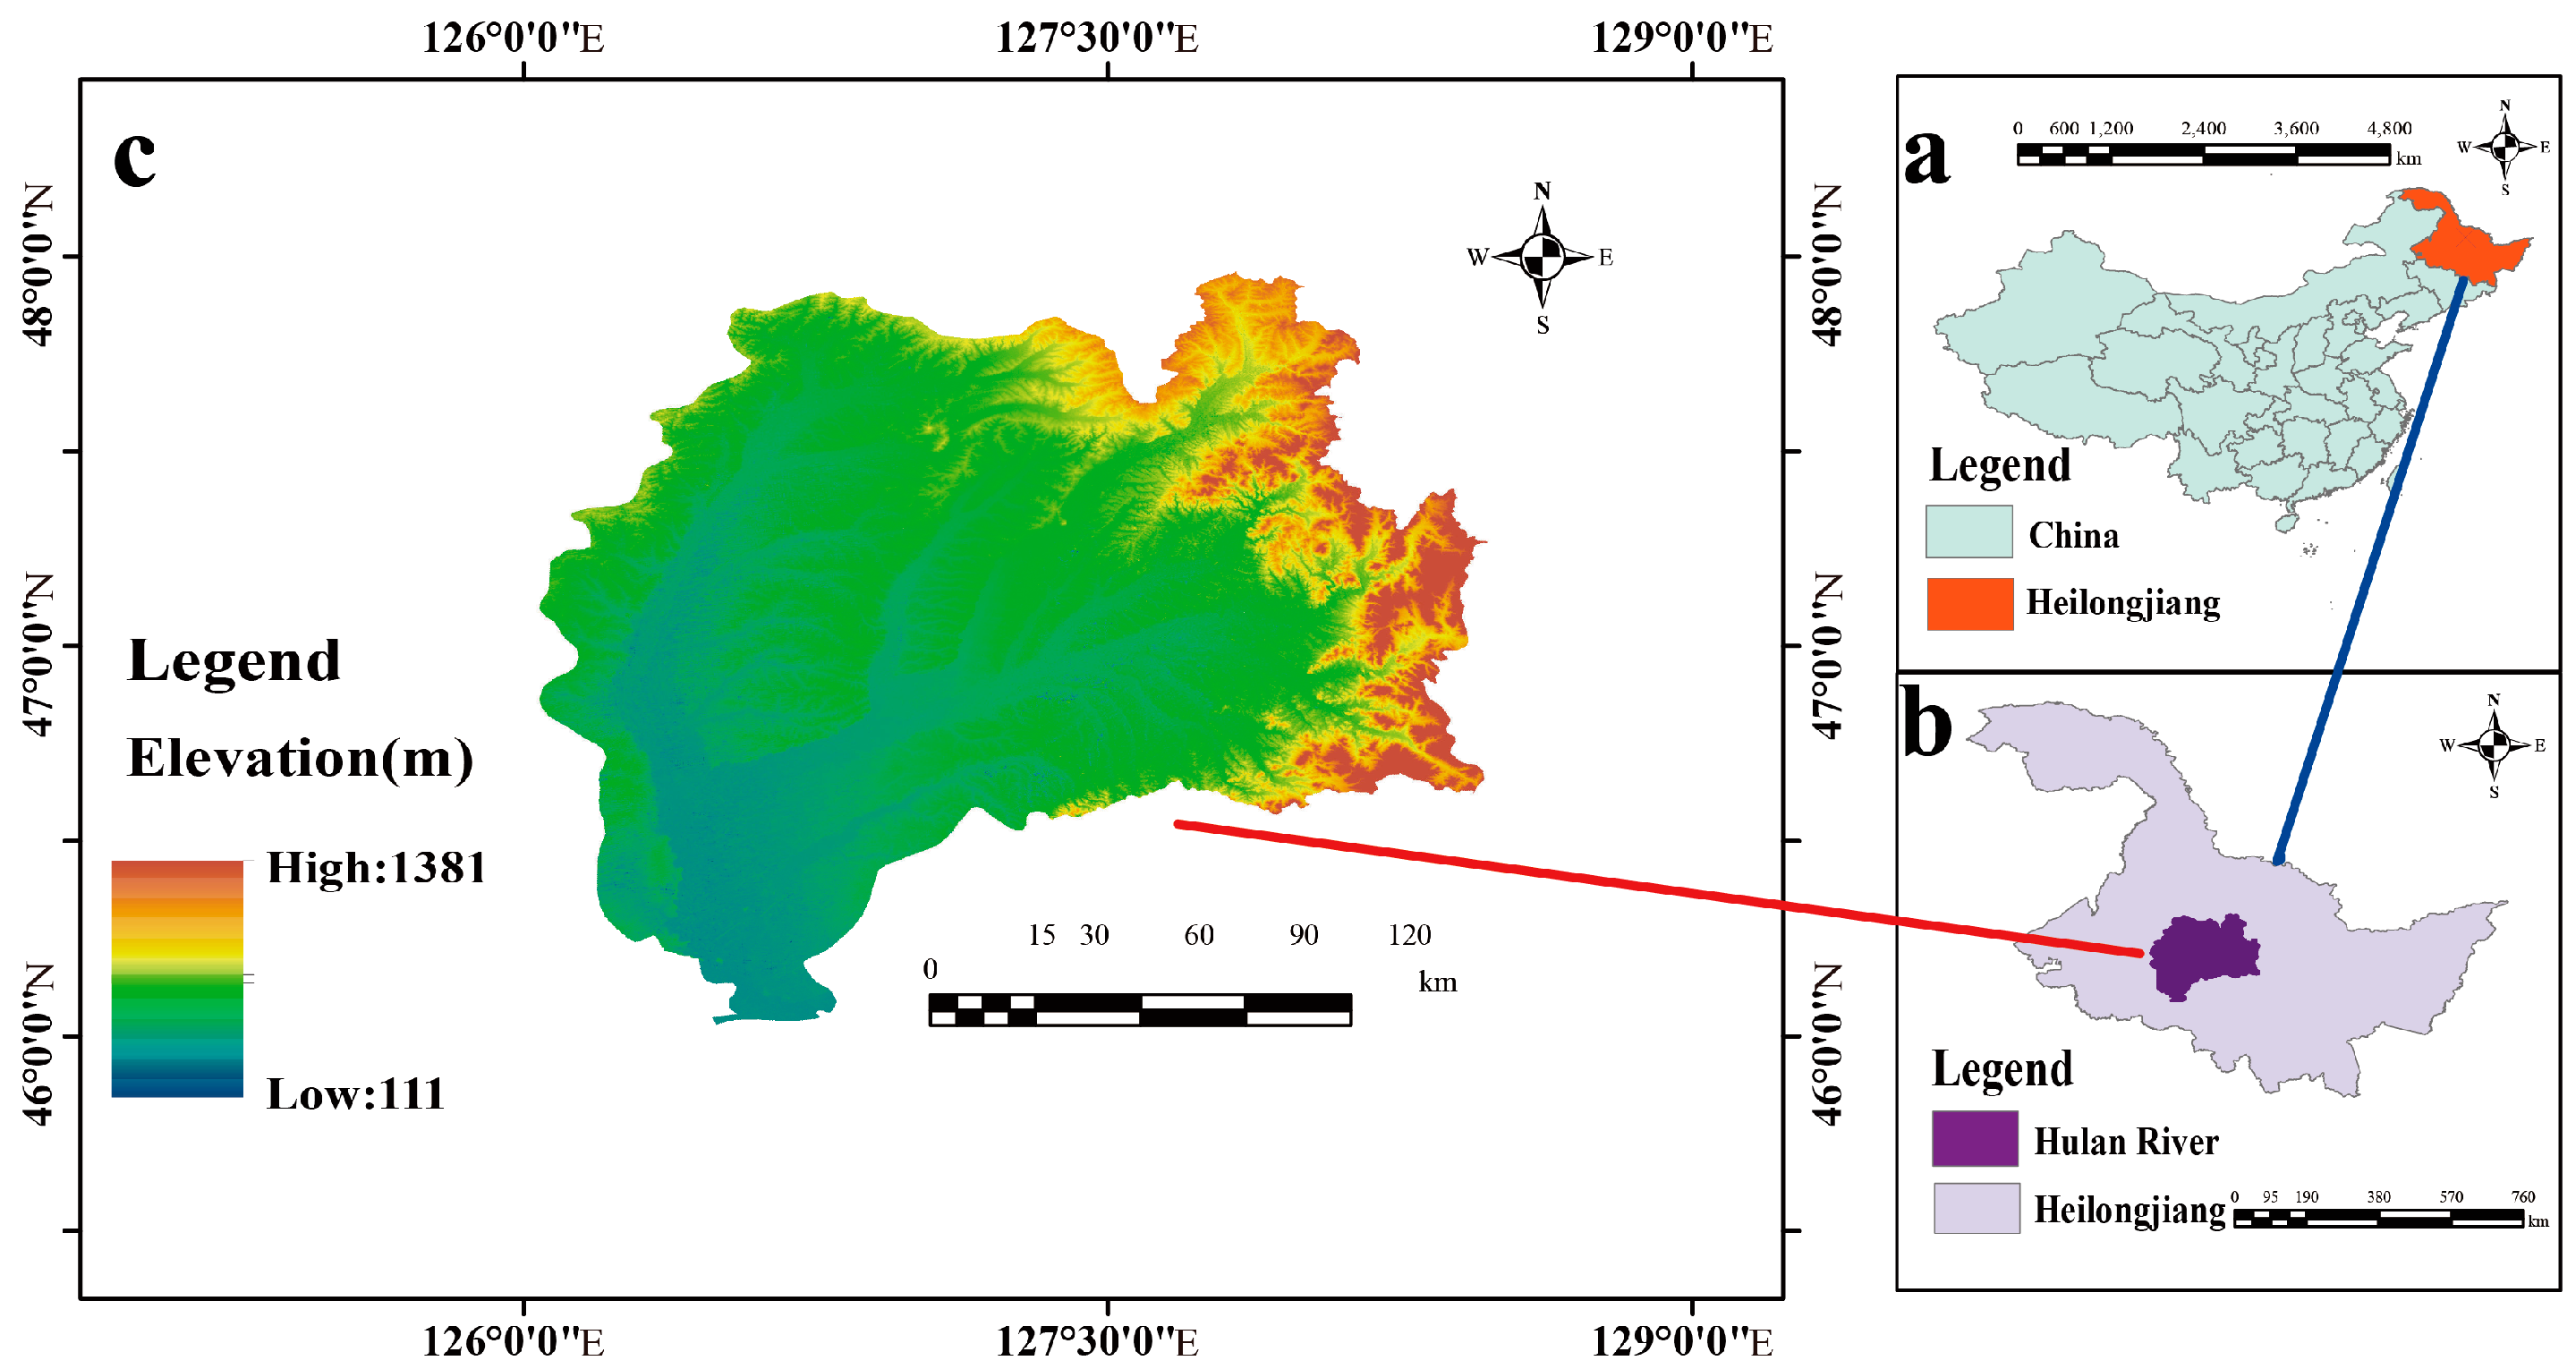
2.1. Overview of the Study Area

A portion of the Songnen Plain is located on the left bank of the Songhua River, which is a significant tributary with a geographic location between 45°52′13″–48°03′21″ north latitude and 125°55′24″–128°43′32″ east longitude (Figure 1). The watershed is approximately 240 km long from north to south and 210 km long from east to west, with a total area of 38,545 km2. Fan-shaped terrains occur in the Hulan River Basin. The mountainous eastern region is part of the thickly forested Xiaoxinganling area, a forestry production base. With a ground slope of approximately 1/20–1/200 and a height of 200–300 m, the western and central regions are hilly terraces. With a ground slope of approximately 1/200–1/3000 and an elevation of 120–200 m, the southern portion is a low-lying area. Figure 1 shows the topography slopes from northeast to southwest. The high latitude of the Hulan River Basin leads to a cold-temperate continental monsoon climate, with an average annual temperature ranging from 0 to 3 °C. July exhibits the highest temperature of 20 to 23 °C and January exhibits the lowest temperature of −21 to −26 °C. The ascent of mountainous air currents causes precipitation to decrease from east to west. With most precipitation occurring between June and September, the average yearly precipitation in the east is approximately 700 mm while, in the west, the value is 500 mm. The average annual runoff depth in the basin is 114.8 mm and the average annual runoff volume is 4.098 billion m3.

2.2. Data Sources

Numerous elements, including topographic knowledge on land use and land cover (LULC), soil type, meteorological conditions, soil and water conservation practices, and interconnections, are involved in the complex processes that lead to soil erosion [23]. In this study, each parameter was determined through different data and a single year was chosen for both sets of data because the topography and soil type do not significantly change within a short period of time. Notably, 30 m resolution topographic data (SRTM DEM) (The Shuttle Radar Topography Mission Digital Elevation Model) were obtained from the China Tibetan Plateau Data Centre [24]. The precipitation data used were month-by-month precipitation data at a 1 km resolution for 2001 and 2020. These data were obtained from the China Tibetan Plateau Data Centre [25]. The important reason for choosing 2001 and 2020 precipitation data is that these two years are more representative of the average level of precipitation over a 20-year period, with no droughts or floods. The source of the soil data was the World Soil Database HWSD, of which the FAO90 Soil Classification System was selected for the SU_SYM90 field (https://www.fao.org/soils-portal/soil-survey/soil-maps-and-databases/harmonized-world-soil-database-v12/en/, accessed on 13 August 2023). LULC data for 2001 and 2020 were selected for the same quarter and the data were cloud-free and did not affect the classification results or data [26].

3. Methodology

3.1. USLE Model

Different models are available for forecasting soil erosion in watersheds and their differences lie in how simple they are to use and what kind of input data they need to forecast soil losses from erosion. Most countries employ the universal soil loss equation (USLE) model, which was proposed by Wischmeier and Smith [8]. The popularity of the USLE model can be attributed to a decent compromise between the applicability of the needed input data and the reasonable dependability of the available soil loss estimates [27]. This model was developed for long-term average soil loss due to gully erosion, considering a number of physical and management variables [8,28], and it has now been integrated with the GIS to achieve faster and more concise modelling for estimating soil erosion in the study catchment. As recommended by Wischmeier and Smith [8,29], the annual soil loss rate was expressed as t/ha/yr by multiplying with the corresponding USLE factor values (R, K, LS, C, and P). Based on data processing in the ArcGIS 10.6 environment using spatial analysis tools, map algebra, and a raster calculator, the flowchart was obtained, as shown below (Figure 2); the soil loss rate in the USLE model can be expressed as follows:
A = L S P K C R
where A is the annual soil loss per unit area int/(hm2·a); LS is the slope length factor and slope gradient factor, respectively, (dimensionless number); K is the soil erodibility factor in t·h/(MJ·mm); P is the support practice factor (dimensionless number); C is the vegetation cover and crop management factor (dimensionless number); and R is the rainfall erosion coefficient in [(MJ·mm)/(h·hm2·a)].

3.2. Rainfall Erosion Factor R

Approximately 80% of the soil loss is caused by rainfall-runoff erosivity, which is one of the primary causes of soil loss [30]. This is the outcome of all kinetic energies. It is the highest value of the product of the 30-min intensity (EI30) and the storm kinetic energy (KE) [8], as determined by Wischmeier and Smith (1978). Nevertheless, considering the size of our study region and the difficulty in obtaining these data, we utilised an empirical method developed by other scholars [31,32] to calculate the erosion rate from rainfall, despite the lack of data on the rainfall kinetic energy and intensity:
R = 0.362 P + 47.6
where P is the average annual precipitation.

3.3. Soil Erodibility Factor K

The intrinsic characteristics of soil determine soil erodibility factor K [33], including the grain size, structural integrity, organic matter content, and cohesiveness; different soil types exhibit varying natural resistances to erosion [34]. The primary soil types used for soil erodibility analysis were retrieved in vector format to determine the K factor (Table 1), which is performed in this study using the method suggested by Wischmeier and Smith [8]:
K USLE = 0.2 + 0.3 e x p 0.0256 S A N 1 S I L 100 × S I L C L A + S I L 0.3
× 1 0.25 C C + e x p 3.27 2.95 C
× 1 0.7 1 S A N 1 S A N + e x p 22.9 1 S A N 5.51
where, among them, according to the soil particle classification standard developed by the United States, SAN is the content of soil sand (particles with a diameter of 0.05–2.00 mm) (%); SIL is the content of soil silt (particles with a diameter of 0.002–0.05 mm) (%); C is the content of organic carbon in the soil (%); and CLA is the content of clay particles in the soil (particles with a diameter of less than 0.002 mm) (%).

3.4. Slope and Slope Length Factor LS

The LS factor, also known as the topographic factor, comprises a slope length component (L), which indicates the effect of the slope length. The S component denotes the gradient of the slope and indicates its influence on erosion [35]. The LS factor is defined as the estimated ratio of the soil loss per unit area of a field slope to the estimated soil loss for a uniform 9% slope over a length of 22.13 m [8]. In recent decades, many methods have been proposed to calculate the combined LS factor for complex terrains [36,37]; a simplified version of the 1978 equation of Wischmeier et al. was adopted herein [38]:
L S = X 22.13 m 0.065 + 0.045 S + 0.0065 S 2
where X is the slope length; m is the slope length index; and S is the slope expressed in percentage, which is 5 or greater when the slope is higher than 5% and, 4.5 when the slope is 3.5–4%; a slope of 0–3% is 1.3 and a slope of less than 0% is 2.1%.

3.5. Vegetation Cover and Crop Management Factor C

The C factor is crucial for controlling soil erosion and is the second most important factor. This indicates the influence of cropping and management techniques on the soil erosion rate [39,40]. This factor ranges from high-vegetation-coverage areas to completely non-erodible conditions, with values ranging from 0 to 1. Due to spatial and temporal changes, numerous studies have focused on using remote sensing data to classify LULC categories for obtaining C values [41]. As shown in Table 2 below, the C factor corresponding to each LULC was assigned according to the literature.

3.6. Support for Practice Factor P

The P factor, which is the soil erosion rate associated with a particular conservation measure (such as contours, strip planting, or terracing measures) relative to the corresponding loss above and below the slope [8], is defined as the impact of land use or farming systems on soil erosion. The P factor ranges from 0 to 1, with lower values indicating superior protection. The p value was estimated using the LULC and slope, as proposed by Wischmeier and Smith [8]. The survey area was divided into two categories, namely, agricultural land and non-agricultural land, with agricultural land divided into several groups based on the slope. The p value for the other land types was set to 1 (Table 3).

4. Results and Discussion

4.1. Accuracy Assessment

Before using the image classification results for further analyses, their accuracy must be assessed to evaluate the percentage of correctly and incorrectly classified pixels in each LULC classification category, providing a basis for the accuracy of the results [43]. The most common method for representing the assessment accuracy is the error matrix, which provides a detailed assessment of the agreement between the sample reference data and the site-specific classification data, as well as a complete description of the misclassifications obtained for each category. The accuracy assessment of the 2001 and 2020 imagery resulted in overall accuracies of 89.79 and 92.83%, respectively, while the kappa statistics of the images were 88.47 and 91.64%, respectively. The producer accuracies (PAs) of the classified maps for 2001 and 2020 were 73–96% and 90–96%, respectively, while the user accuracies (UAs) in 2001 were higher than 80% and 90%, respectively, in 2020. The overall kappa coefficients were all higher than 88% and, according to this study, if the overall result is greater than 85%, the accuracies are all acceptable. Thus, the results indicated close agreement between the classification categories and reference data. Although the accuracy measurements obtained are reasonable, there are still misclassifications. Misclassifications were observed in built-up areas and agricultural land, which could be attributed to classification errors in the satellite-generated maps. The accuracies generated using Erdas Imagine 2014 software are listed in Table 4.

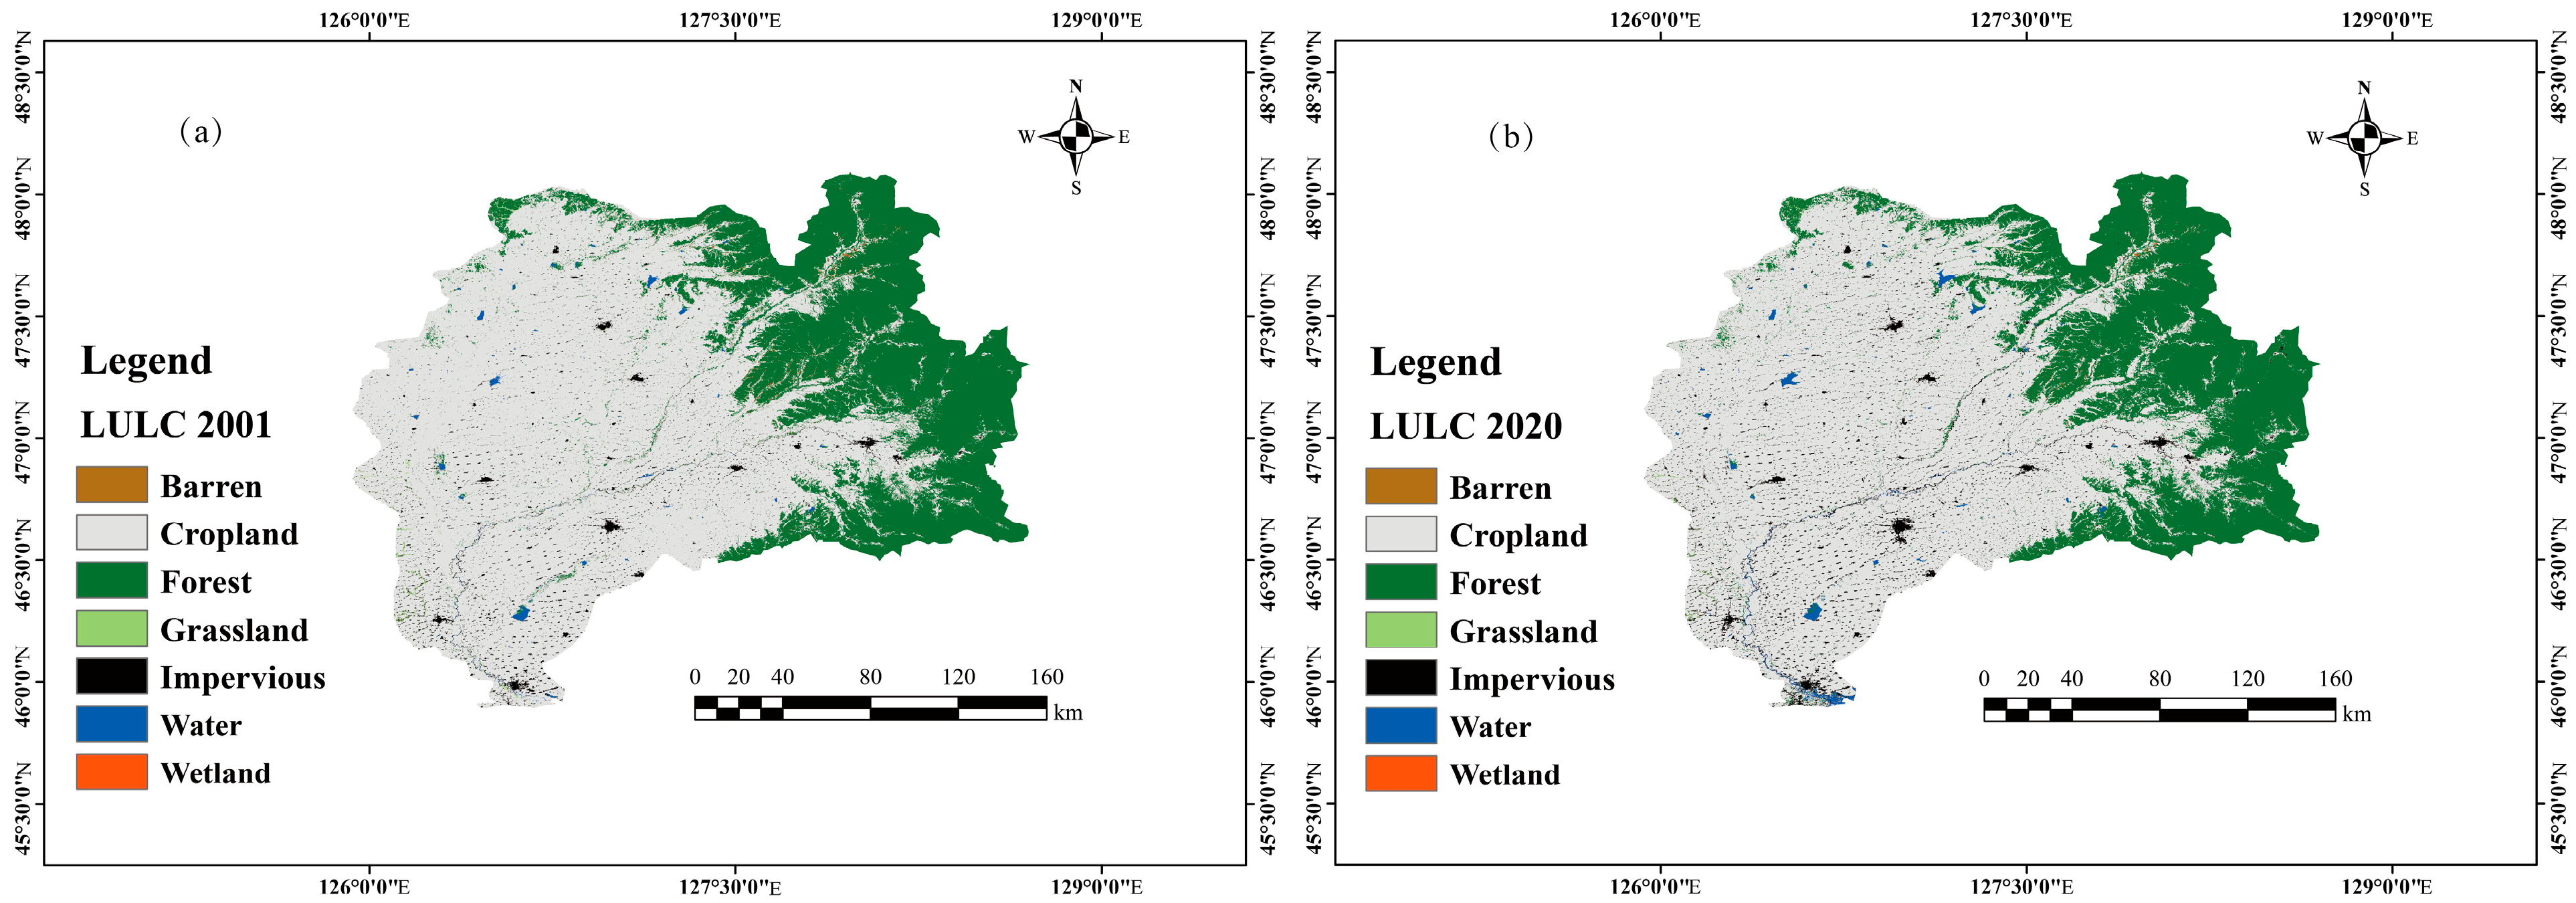
4.2. Analysis of Changes in LULC

LULC classifications of the Hulan River Basin in 2001 and 2020 are shown in Figure 3 and Table 5. The changes in LULC were visualised. The results showed that agricultural land dominated the basin in both 2001 and 2020, with coverage values of 68.4% (26,364.78 km2) and 67.8% (26,133.51 km2), respectively, and an annual decline rate of −0.046%. In terms of the other LULC categories, the forest area decreased by 308.36 km2 from 2001 to 2020, with an annual decline rate of −0.15%; the grassland area decreased by 43.55 km2, with an annual decline rate of −1.98%; the water body area increased by 107.92 km2, with an annual growth rate of 4.06%; the bare ground area decreased by 17.89 km2, with an annual decline rate of −4.07%; the impervious surface area increased by 512.95 km2, with an annual growth rate of 3.78%; and the wetland area decreased by 19.5 km2, with an annual decline rate of −2.11%. Overall, among the seven LULC categories in this watershed, only the water body and impervious surface areas increased, by 77.13% and 71.89%, respectively, all of which increased while the areas of the other LULC categories decreased to different degrees.
A comparison of the various types of LULCs in 2001 and 2020 revealed that the overall land use and land cover did not significantly change in terms of the area. Agricultural land always dominates the watershed and, compared with that in 2001, the agricultural land area in the watershed decreased by only 0.88%. This change is related to the location of the watershed. Notably, the Hulan River watershed is located in the black soil grain production area of northeastern China, which is important for grain production [44]. The increases in the water body and impervious surface areas of 77.13% and 71.89%, respectively, could be attributed to the dramatic population and economic growth over the 20-year period, as well as the large-scale development of the built-up area, with many new housing schemes, farmhouses, and recreational activities, which correspond to the increase in the water demand due to the increase in the population. With these developments, there is a tendency to construct new footpaths, motorways, roads, and other structures for access to these areas [45]. Additionally, population growth and economic development contribute to the degradation in forests, grasslands, wetlands, and barren land. The economic benefits of these land uses decreased compared to those of industry, real estate, and commerce as a result of modernisation. Consequently, they were eventually abandoned for production purposes [46]. People often choose to sacrifice the environment in the face of higher benefits and higher production efficiency. It is hoped that the local government can focus more on this problem and develop feasible proposals, such as providing agricultural subsidies and drawing red lines for arable land.

4.3. USLE Model Factors

4.3.1. Rainfall Erosion Factor R

The R factor is one of the most important factors influencing the process of water erosion and can be obtained via empirical equations. In this study, monthly precipitation data were selected to obtain the annual precipitation, after which the R factor was calculated. Based on the R factor analysis results (Figure 4a,b), the R factor values ranged from 159.75 to 237.786 (MJ·mm)/(h·hm2·a) in 2001 and from 258.972 to 385.925 (MJ·mm)/(h·hm2·a) in 2020; both indicated an increasing trend from the Hulan River Basin in the southwestern plain area to the northeastern hilly and mountainous area. The findings suggest that the present value of rainfall erosion in the designated area is lower than the worldwide average value of 2000 (MJ·mm)/(h·hm2·a) [47]. However, the rainfall erosion value in 2020 was greater than that in 2001.

4.3.2. Soil Erodibility Factor K

The soil texture and amount of organic matter influence the soil erodibility and were calculated in this study. According to the K factor data (Figure 4e), the K factor values ranged from 0.327 to 0.723 t·h/(MJ·mm) and the K factor distribution indicated that the soil erodibility is higher in the northeastern hilly mountainous area than in the other areas [42,48]. Similarly, according to the results of related research, the soil erodibility in the Hulan River Basin is lower. The impact of the soil factor on the soil loss was lower than that of the other factors. Notably, the K factor was the same in 2001 and 2020.

4.3.3. Slope and Slope Length Factor LS

The LS factor was calculated using 30 m resolution SRTM-DEM data in ArcGIS 10.6 via the Map Algebra-Raster Calculator of the Spatial Analyst Tool. According to the LS factor analysis results (Figure 4f), the LS factor values ranged from 0 to 13.02. In the Hulan River Basin, the LS factor value in the flat area, including the river channel, is 0, the LS factor value in the other areas shows fluctuating changes in general, and the overall LS factor value is slightly lower than that reported in other studies at home and abroad [49,50]. These findings are strongly related to the vast plain topography of northeastern China while the majority of the Hulan River Basin is also nearly flat.

4.3.4. Vegetation Cover and Crop Management Factor C

LULC data were obtained from data released by Wuhan University [26] and the LULC classifications for 2001 and 2020 indicated no drastic changes over the 20-year period. As demonstrated (Figure 4c,d), the C factor did not notably change over the 20-year period and the value varied between 0 and 0.6. Moreover, a C factor value of 0.15 accounted for the vast majority of the variance, which is caused by the dominance of agricultural land in the watershed.

4.3.5. Support for Practice Factor P

The LULC classifications in ArcGIS 10.6 were separated into non-agricultural and agricultural land areas. We selected the classification suggested by Gelagay and Minale [51] and the P factor value recommended by Wischmeier and Smith [8] due to the lack of research data on the Hulan River Basin. A P factor of 1 was assigned to non-agricultural land, including water bodies, bare ground, marshes, forests, impervious surfaces, and grasslands, irrespective of the slope. In contrast, agricultural land was categorised into six slope classes and paired with matching p values ranging from 0.1 to 0.33. In 2001 and 2020, P factor values of 1 were primarily concentrated in the northeastern hilly mountain areas (Figure 4g,h). The northeastern hilly mountainous areas account for the majority of the agricultural land area with a P factor value of 1 while the distribution of agricultural land with a P factor value of 0.1 in 2020 was wider than that in 2001. This suggests that as productivity has increased over the past 20 years, agricultural land has further shifted to accommodate mechanised agricultural production.

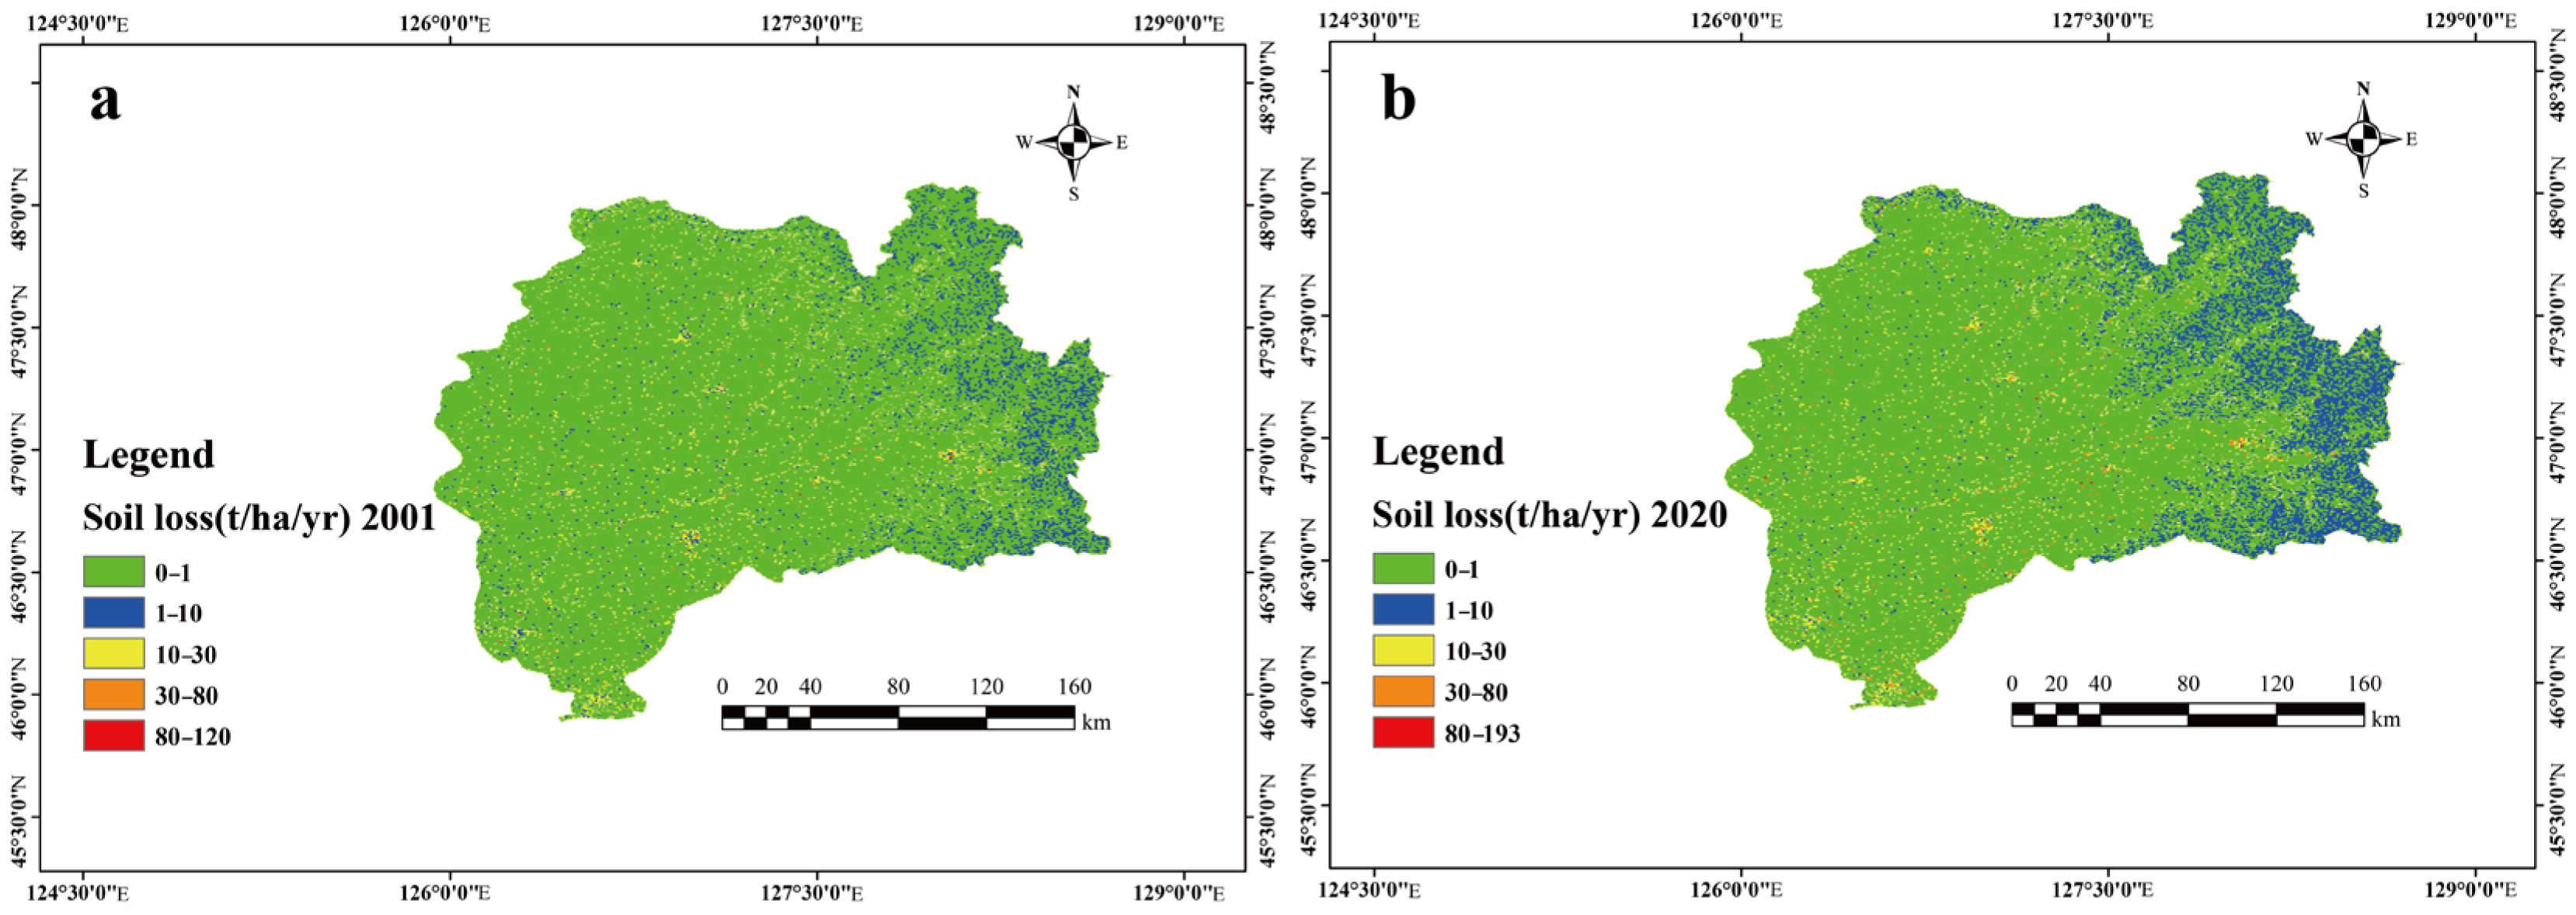
4.4. Estimation of Soil Erosion Rates and Risk Evaluation

After processing all the USLE factors (R, C, K, P, and LS), stacked multiplication was performed using the RasterCalculator of the Spatial Analyst tool in the ArcToolbox, which was used to estimate the average soil loss per hectare per year to determine the level of the erosion risk in the Hulan River Basin. According to the research findings (Figure 5a,b), the average soil erosion rate in the Hulan River Basin was 4.63 (t/ha/yr) within the 0–120 (t/ha/yr) interval in 2001, the average soil erosion rate in the Hulan River Basin was 7.34 (t/ha/yr) within the 0–193 (t/ha/yr) interval in 2020, and the average soil erosion rate in the plain areas and most of the agricultural land mainly ranged from 0 to 1 (t/ha/yr) in 2001 and 2020. Soil erosion in the northeastern hilly areas in 2020 was significantly higher than that in 2001 and further analysis of the changes in the northeastern hilly areas from the perspective of the various factors revealed that rainfall flushing exerted a major influence on soil erosion in the northeastern black soil areas in Jilin Province. These findings also support the study of soil erosion in the northeastern black soil areas in Jilin Province, which showed that rainfall has been the main erosive factor over the past half century at least [52]. Moreover, the soil loss rate was used to classify five levels of soil erosion severity in the basin (Figure 5a,b). The classification standard was based on the soil loss grade proposed by Prasannakumar et al. [34], slightly modified to adapt to the actual situation of the Huran River Basin, and the severity of soil erosion was classified as very weak, low, high, extremely high, and severe. In general, the soil erosion risk in the Hulan River Basin is extremely low and the soil erosion risk increases from the southwest plain area to the northeast hilly area. Moreover, compared with those based on the LULC classification, the areas with extremely high and severe soil erosion grades are mainly concentrated in impervious water surface areas; notably, these areas exhibit a concentration of large-scale human activities. In regard to soil erosion in black soil areas relative to the global scale, climatic factors play an important role. In the Czech Republic, approximately 50% of the arable land is at risk of water erosion, 10% of the arable land is at risk of wind erosion, and the topsoil layer has been reduced by 35–50 cm over the last 25 years [53]. Similarly, in Argentina and South America, pampas grasslands are subject to varying degrees of soil erosion, with the eastern part of the country mainly affected by water erosion and the western part affected by wind erosion [54]. In contrast, weaker surface winds, relatively low erosion rates, and abundant precipitation are the main characteristics of the Hulan River Basin in northeastern China; these findings suggest that water erosion is the main factor influencing erosion in the Hulan River Basin.
Nevertheless, there are uncertainties associated with both modelling and erosion measurements, which may necessitate validation through measurement data. However, the Hulan River Basin research area lacks model validation data, making it impossible to quantitatively validate the model-based conclusions. As a result, there will be differences between the obtained soil erosion rates in this study and those reported in the literature. These variations could stem from a number of factors, such as the choice and input of USLE models and data, modifications to area socioeconomic circumstances and policies, and shifts in the bio-geophysical environment. Despite these differences, the calculated soil loss rates and their spatial distributions provide a high reference value and they are comparable to the observations conducted in the watershed. Unreasonable farming methods, excessive deforestation, the overgrazing of grasslands, development, increased human activity, and climate change continue to be the main causes of soil loss [55].

4.5. Protective Measure

In high-latitude areas of northeastern China, such as the Hulan River Basin, due to the lack of data and other factors, the use of the USLE model helps to identify erosion hot spots for appropriate soil conservation measures [56], including terracing, conservation tillage, and afforestation [57,58]. The results of this research, which provide a comparison of the soil erosion risk between 2001 and 2020, revealed that watersheds are sporadically distributed, mostly in the vicinity of farms, cities, and industrial zones. In these areas, increased greening is typically recommended as a way to reduce soil loss. Presently, research has suggested the application of effective organic mulch as a means of mitigating urban soil erosion [59], offering fresh recommendations for local governments for urban soil preservation. Moreover, the hilly, mountainous, mostly wooded area in the northeast region of the watershed exhibits the majority of the risk changes when comparing the soil erosion risk in 2001 and 2020. Therefore, the primary actions that should be implemented there are afforestation and conservation tillage.
Reducing population migration to areas covered by forests and utilising more rational farming methods, along with improving traditional farming practices that can cause excessive soil erosion, are all possible ways to reduce soil erosion in the Hulan River Basin, which primarily comprises agricultural land. Minimising soil erosion can also be accomplished by preventing overgrazing and vegetation trampling by free-roaming cattle. These actions can eliminate soil erosion caused by the decreased vegetation cover. The impacts of climate change must also be taken into account, especially in areas with predominantly agricultural land, where events such as droughts, floods and extreme precipitation can directly or indirectly cause significant soil erosion. Similar situations have become more serious in recent decades, such as the large-scale heat and drought in the northern hemisphere in the summer of 2022, which will also be a hot topic for further research [60]. Similarly, the Chinese government has implemented the Grain for Green program, which represents a significant step towards sustainable development and aims to increase land cover, aid in reducing soil erosion, and rehabilitate afflicted areas [61].

5. Conclusions

Soil erosion has remained a global concern, threatening food security and the sustainability of agricultural production everywhere. Over the last few decades, advances in GIS technology, coupled with improved big data processing capabilities, have increased the use of more dynamic models. In this study, the GIS-based USLE model was used to analyse the LULC changes in the Hulan River Basin in northeastern China between 2001 and 2020, considering rainfall, soil, LULC, and topographic datasets to quantitatively assess soil loss and identify soil loss hot spots in the basin and to generate a soil loss risk map for the basin. According to the comparison results, the changes in LULC categories were not significant. All changes were dominated by agricultural land and most land use change was due to population and socioeconomic development. In terms of soil erosion in the Hulan River Basin, the soil erosion risk in 2001 and 2020 was low, most of the area exhibited a very low erosion risk, and very few areas with human activity concentration indicated a high erosion risk. These results coincide with the changes in LULC classification. Comparing soil erosion between 2001 and 2020, the average soil erosion rate increased in 2020, the increase in human activity areas led to a slight increase in high-erosion-risk areas, and the overall erosion risk changes were concentrated in the northeastern part of the watershed. The results of soil erosion analysis and the spatial distribution of soil erosion can provide a basis for integrated land management and sustainable development in watersheds and areas with severe soil erosion should be given priority when implementing protective measures. Although the soil erosion data estimated by the USLE model still differ from the actual data, due to the use of empirical equations and the lack of field survey data, the USLE model can undoubtedly provide researchers and practitioners with help in soil erosion management and should be improved in future work.

Author Contributions

J.C., methodology; J.C., software; M.J., validation; Q.S., M.J. and Y.Z., formal analysis; D.K., investigation; J.C., resources; J.C., data curation; J.C., writing—original draft preparation; J.C., writing—review and editing; J.C., visualization; X.Z., supervision; X.Z., project administration; X.Z., funding acquisition. All authors have read and agreed to the published version of the manuscript.

Funding

Supported by the Strategic Priority Research Program of the Chinese Academy of Sciences (Grant No. XDA28100105).

Data Availability Statement

Data are contained within the article.

Conflicts of Interest

The authors declare no conflict of interest.

References

  1. Rahman, M.R.; Shi, Z.; Chongfa, C. Soil erosion hazard evaluation—An integrated use of remote sensing, GIS and statistical approaches with biophysical parameters towards management strategies. Ecol. Model. 2009, 220, 1724–1734. [Google Scholar] [CrossRef]
  2. Panagos, P.; Borrelli, P.; Meusburger, K.; Yu, B.; Klik, A.; Jae Lim, K.; Yang, J.E.; Ni, J.; Miao, C.; Chattopadhyay, N. Global rainfall erosivity assessment based on high-temporal resolution rainfall records. Sci. Rep. 2017, 7, 4175. [Google Scholar] [CrossRef] [PubMed]
  3. AbdelRahman, M.A.; Natarajan, A.; Srinivasamurthy, C.; Hegde, R. Estimating soil fertility status in physically degraded land using GIS and remote sensing techniques in Chamarajanagar district, Karnataka, India. Egypt. J. Remote Sens. Space Sci. 2016, 19, 95–108. [Google Scholar] [CrossRef]
  4. Lal, R. Soil degradation by erosion. Land Degrad. Dev. 2001, 12, 519–539. [Google Scholar] [CrossRef]
  5. Lal, R. Soil erosion and the global carbon budget. Environ. Int. 2003, 29, 437–450. [Google Scholar] [CrossRef]
  6. Gashaw, T.; Tulu, T.; Argaw, M. Erosion risk assessment for prioritization of conservation measures in Geleda watershed, Blue Nile basin, Ethiopia. Environ. Syst. Res. 2018, 6, 1. [Google Scholar] [CrossRef]
  7. Biggelaar, C.d.; Lal, R.; Wiebe, K.; Breneman, V. Global impact of soil erosion on productivity. I. Absolute and relative erosion-induced yield losses. Adv. Agron. 2004, 81, 1–48. [Google Scholar]
  8. Wischmeier, W.H.; Smith, D.D. Predicting Rainfall Erosion Losses: A Guide to Conservation Planning; Department of Agriculture, Science and Education Administration: Washington, DC, USA, 1978. [Google Scholar]
  9. Griffin, M.; Beasley, D.; Fletcher, J.; Foster, G. Estimating soil loss on topographically non-uniform field and farm units. J. Soil Water Conserv. 1988, 43, 326–331. [Google Scholar]
  10. Dickinson, A.; Collins, R. Predicting Erosion and Sediment Yield at the Catchment Scale; CAB International: Wallingford, UK, 1998. [Google Scholar]
  11. Xie, H.; Zhang, Y.; Wu, Z.; Lv, T. A bibliometric analysis on land degradation: Current status, development, and future directions. Land 2020, 9, 28. [Google Scholar] [CrossRef]
  12. Krisnayanti, D.S.; Bunganaen, W.; Frans, J.H.; Seran, Y.A.; Legono, D. Curve number estimation for ungauged watershed in semi-arid region. Civ. Eng. J. 2021, 7, 1070–1083. [Google Scholar] [CrossRef]
  13. van Leeuwen, C.C.; Cammeraat, E.L.; de Vente, J.; Boix-Fayos, C. The evolution of soil conservation policies targeting land abandonment and soil erosion in Spain: A review. Land Use Policy 2019, 83, 174–186. [Google Scholar] [CrossRef]
  14. Bhattacharya, R.K.; Das Chatterjee, N.; Das, K. Land use and land cover change and its resultant erosion susceptible level: An appraisal using RUSLE and Logistic Regression in a tropical plateau basin of West Bengal, India. Environ. Dev. Sustain. 2021, 23, 1411–1446. [Google Scholar] [CrossRef]
  15. Castro, R.M.; dos Santos Alves, W.; de Oliveira Marcionilio, S.M.L.; De Moura, D.M.B.; da Silva Oliveira, D.M. Soil losses related to land use and rainfall seasonality in a watershed in the Brazilian Cerrado. J. South Am. Earth Sci. 2022, 119, 104020. [Google Scholar] [CrossRef]
  16. Petropoulos, G.P.; Kalivas, D.P.; Griffiths, H.M.; Dimou, P.P. Remote sensing and GIS analysis for mapping spatio-temporal changes of erosion and deposition of two Mediterranean river deltas: The case of the Axios and Aliakmonas rivers, Greece. Int. J. Appl. Earth Obs. Geoinf. 2015, 35, 217–228. [Google Scholar] [CrossRef]
  17. Leh, M.; Bajwa, S.; Chaubey, I. Impact of land use change on erosion risk: An integrated remote sensing, geographic information system and modeling methodology. Land Degrad. Dev. 2013, 24, 409–421. [Google Scholar] [CrossRef]
  18. Wang, H.; Yang, S.; Wang, Y.; Gu, Z.; Xiong, S.; Huang, X.; Sun, M.; Zhang, S.; Guo, L.; Cui, J. Rates and causes of black soil erosion in Northeast China. Catena 2022, 214, 106250. [Google Scholar] [CrossRef]
  19. Fan, H.M. Condition of soil erosion in phaeozem region of Northeast China. J. Soil Water Conserv. 2004, 18, 66–70. [Google Scholar]
  20. Mackenzie, L.; Bao, K.; Mao, L.; Klamt, A.-M.; Pratte, S.; Shen, J. Anthropogenic and climate-driven environmental change in the Songnen Plain of northeastern China over the past 200 years. Palaeogeogr. Palaeoclimatol. Palaeoecol. 2018, 511, 208–217. [Google Scholar] [CrossRef]
  21. Yu, D.; Shen, B.; Xie, J. Damages caused by soil and water erosion and their controlling approaches in the black earth area in Northeast China. Bull. Soil Water Conserv. 1992, 12, 25–34. (In Chinese) [Google Scholar]
  22. Li, F.; Li, J.; Xu, Z. The status quo of black soil degradation and water and soil loss in Northeast China. Res. Soil Water Conserv. 2006, 13, 50–54. [Google Scholar]
  23. Yesuph, A.Y.; Dagnew, A.B. Soil erosion mapping and severity analysis based on RUSLE model and local perception in the Beshillo Catchment of the Blue Nile Basin, Ethiopia. Environ. Syst. Res. 2019, 8, 17. [Google Scholar] [CrossRef]
  24. National Tibetan Plateau Data Center. SRTM DEM Dataset in China. 2000. Available online: http://60.245.210.47/en/data/acb49ce8-2bfe-4ab4-97ff-e6e727110703/?q= (accessed on 1 December 2023).
  25. Shouzhang, P. 1-km monthly precipitation dataset for China (1901–2022). Earth Syst. Sci. Data 2020, 11, 1931–1946. [Google Scholar] [CrossRef]
  26. Yang, J.; Huang, X. The 30 m annual land cover dataset and its dynamics in China from 1990 to 2019. Earth Syst. Sci. Data 2021, 13, 3907–3925. [Google Scholar] [CrossRef]
  27. Alewell, C.; Borrelli, P.; Meusburger, K.; Panagos, P. Using the USLE: Chances, challenges and limitations of soil erosion modelling. Int. Soil Water Conserv. Res. 2019, 7, 203–225. [Google Scholar] [CrossRef]
  28. Eisenberg, J.; Muvundja, F.A. Quantification of erosion in selected catchment areas of the Ruzizi River (DRC) using the (R) USLE model. Land 2020, 9, 125. [Google Scholar] [CrossRef]
  29. Hurni, H. Erosion-productivity-conservation systems in Ethiopia. In Proceedings of the IV International Conference on Soil Conservation, Maracay, Venezuela, 3–9 November 1985. [Google Scholar]
  30. Weldu Woldemariam, G.; Edo Harka, A. Effect of land use and land cover change on soil erosion in erer sub-basin, Northeast Wabi Shebelle Basin, Ethiopia. Land 2020, 9, 111. [Google Scholar] [CrossRef]
  31. Bekele, B.; Muluneh, A.; Wondrade, N. Geographic Information System (GIS) based soil loss estimation using Universal Soil Loss Equation Model (USLE) for soil conservation planning in Karesa Watershed, Dawuro Zone, and South West Ethiopia. Int. J. Water Resour. Environ. Eng. 2019, 11, 143–158. [Google Scholar]
  32. Bekele, B.; Gemi, Y. Soil erosion risk and sediment yield assessment with universal soil loss equation and GIS: In Dijo watershed, Rift valley Basin of Ethiopia. Model. Earth Syst. Environ. 2021, 7, 273–291. [Google Scholar] [CrossRef]
  33. Parysow, P.; Wang, G.; Gertner, G.; Anderson, A.B. Spatial uncertainty analysis for mapping soil erodibility based on joint sequential simulation. Catena 2003, 53, 65–78. [Google Scholar] [CrossRef]
  34. Prasannakumar, V.; Vijith, H.; Abinod, S.; Geetha, N. Estimation of soil erosion risk within a small mountainous sub-watershed in Kerala, India, using Revised Universal Soil Loss Equation (RUSLE) and geo-information technology. Geosci. Front. 2012, 3, 209–215. [Google Scholar] [CrossRef]
  35. Kefi, M.; Yoshino, K.; Setiawan, Y. Assessment and mapping of soil erosion risk by water in Tunisia using time series MODIS data. Paddy Water Environ. 2012, 10, 59–73. [Google Scholar] [CrossRef]
  36. Desmet, P.; Govers, G. A GIS procedure for automatically calculating the USLE LS factor on topographically complex landscape units. J. Soil Water Conserv. 1996, 51, 427–433. [Google Scholar]
  37. Zhang, H.; Yang, Q.; Li, R.; Liu, Q.; Moore, D.; He, P.; Ritsema, C.J.; Geissen, V. Extension of a GIS procedure for calculating the RUSLE equation LS factor. Comput. Geosci. 2013, 52, 177–188. [Google Scholar] [CrossRef]
  38. Moore, I.D.; Wilson, J.P. Length-slope factors for the Revised Universal Soil Loss Equation: Simplified method of estimation. J. Soil Water Conserv. 1992, 47, 423–428. [Google Scholar]
  39. Van der Knijff, J.; Jones, R.; Montanarella, L. Soil Erosion Risk Assessment in Europe; European Commission: Brussels, Belgium, 2000. [Google Scholar]
  40. Patil, R.; Sharma, S. Remote Sensing and GIS based modeling of crop/cover management factor (C) of USLE in Shakker river watershed. In Proceedings of the International Conference on Chemical, Agricultural and Medical Sciences (CAMS-2013), Kuala Lumpur, Malaysia, 29–30 December 2013; pp. 29–30. [Google Scholar]
  41. Beskow, S.; Mello, C.R.; Norton, L.D.; Curi, N.; Viola, M.R.; Avanzi, J.C. Soil erosion prediction in the Grande River Basin, Brazil using distributed modeling. Catena 2009, 79, 49–59. [Google Scholar] [CrossRef]
  42. Wondrade, N. Integrated use of GIS, RS and USLE model for LULC change analysis and soil erosion risk mapping in the Lake Hawassa Watershed, Southern Ethiopia. Geocarto Int. 2023, 38, 2210106. [Google Scholar] [CrossRef]
  43. Congalton, R.G. A Review of Assessing the Accuracy of Classifications of Remotely Sensed Data. Remote Sens. Environ. 1991, 37, 35–46. [Google Scholar] [CrossRef]
  44. Xiaozeng, H.; Wenxiu, Z.; Jun, Y.; Na, L.; Yanhua, L.; Jianguo, W.; Lujun, L. Ecology in agriculture and long-term research guide protection of black soil and agricultural sustainable development in Northeast China. Bull. Chin. Acad. Sci. 2019, 34, 362–370. (In Chinese) [Google Scholar]
  45. Butt, A.; Shabbir, R.; Ahmad, S.S.; Aziz, N. Land use change mapping and analysis using Remote Sensing and GIS: A case study of Simly watershed, Islamabad, Pakistan. Egypt. J. Remote Sens. Space Sci. 2015, 18, 251–259. [Google Scholar] [CrossRef]
  46. Qasim, M.; Hubacek, K.; Termansen, M.; Khan, A. Spatial and temporal dynamics of land use pattern in District Swat, Hindu Kush Himalayan region of Pakistan. Appl. Geogr. 2011, 31, 820–828. [Google Scholar] [CrossRef]
  47. Asmamaw, L.B.; Mohammed, A.A. Identification of soil erosion hotspot areas for sustainable land management in the Gerado catchment, North-eastern Ethiopia. Remote Sens. Appl. Soc. Environ. 2019, 13, 306–317. [Google Scholar] [CrossRef]
  48. Selmy, S.A.; Abd Al-Aziz, S.H.; Jiménez-Ballesta, R.; García-Navarro, F.J.; Fadl, M.E. Modeling and assessing potential soil erosion hazards using USLE and wind erosion models in integration with gis techniques: Dakhla oasis, Egypt. Agriculture 2021, 11, 1124. [Google Scholar] [CrossRef]
  49. Prasuhn, V. Experience with the assessment of the USLE cover-management factor for arable land compared with long-term measured soil loss in the Swiss Plateau. Soil Tillage Res. 2022, 215, 105199. [Google Scholar] [CrossRef]
  50. Falcão, C.J.L.M.; Duarte, S.M.d.A.; da Silva Veloso, A. Estimating potential soil sheet Erosion in a Brazilian semiarid county using USLE, GIS, and remote sensing data. Environ. Monit. Assess 2020, 192, 47. [Google Scholar] [CrossRef]
  51. Gelagay, H.S.; Minale, A.S. Soil loss estimation using GIS and Remote sensing techniques: A case of Koga watershed, Northwestern Ethiopia. Int. Soil Water Conserv. Res. 2016, 4, 126–136. [Google Scholar] [CrossRef]
  52. Yang, X.; Zhang, X.; Deng, W.; Fang, H. Black soil degradation by rainfall erosion in Jilin, China. Land Degrad. Dev. 2003, 14, 409–420. [Google Scholar] [CrossRef]
  53. Hladky, J.; Brtnicky, M.; Elbl, J.; Kintl, A.; Kynicky, J. Chernozem degradation in the Czech Republic over the last 50 years. Int. Multidiscip. Sci. GeoConference SGEM 2018, 18, 57–63. [Google Scholar]
  54. Díaz-Zorita, M.n.; Duarte, G.A.; Grove, J.H. A review of no-till systems and soil management for sustainable crop production in the subhumid and semiarid Pampas of Argentina. Soil Tillage Res. 2002, 65, 1–18. [Google Scholar] [CrossRef]
  55. Montanarella, L. The EU thematic strategy on soil protection. In Proceedings of the Contributions International Workshop “Land Degradation”, Ispra, Italy, 5–6 December 2002; pp. 15–29. [Google Scholar]
  56. Chen, J.; Xiao, H.; Li, Z.; Liu, C.; Ning, K.; Tang, C. How effective are soil and water conservation measures (SWCMs) in reducing soil and water losses in the red soil hilly region of China? A meta-analysis of field plot data. Sci. Total Environ. 2020, 735, 139517. [Google Scholar] [CrossRef]
  57. Chen, L.; Wei, W.; Fu, B.; Lü, Y. Soil and water conservation on the Loess Plateau in China: Review and perspective. Prog. Phys. Geogr. 2007, 31, 389–403. [Google Scholar] [CrossRef]
  58. Xiong, M.; Sun, R.; Chen, L. Effects of soil conservation techniques on water erosion control: A global analysis. Sci. Total Environ. 2018, 645, 753–760. [Google Scholar] [CrossRef] [PubMed]
  59. Wang, B.; Niu, J.; Berndtsson, R.; Zhang, L.; Chen, X.; Li, X.; Zhu, Z. Efficient organic mulch thickness for soil and water conservation in urban areas. Sci. Rep. 2021, 11, 6259. [Google Scholar] [CrossRef]
  60. Yin, J.; Slater, L. Understanding heatwave-drought compound hazards and impacts on socio-ecosystems. Innov. Geosci. 2023, 1, 100042. [Google Scholar] [CrossRef]
  61. Deng, L.; Liu, G.B.; Shangguan, Z.P. Land-use conversion and changing soil carbon stocks in China’s ‘Grain-for-Green’ Program: A synthesis. Glob. Chang. Biol. 2014, 20, 3544–3556. [Google Scholar] [CrossRef]
Figure 1. Hulan River Basin elevation and location map, where (a) is the location of Heilongjiang Province in China, (b) is the location of the Hulan River Basin in Heilongjiang Province, and (c) is the elevation map of the Hulan River Basin.
Water 16 00241 g001
Figure 2. USLE model flowchart.
Water 16 00241 g002
Figure 3. LULC categories for 2001 and 2020. Where (a) is the 2001 LULC classification map and (b) is the 2020 LULC classification map, the catchment contains seven categories and they are all filled with different colours.
Water 16 00241 g003
Figure 4. USLE model factors. Where (a) is the 2001 rainfall erosion R factor map, (b) is the 2020 rainfall erosion R factor map, (c) is the 2001 vegetation cover and crop management C factor map, (d) is the 2020 vegetation cover and crop management C factor map, (e) is the soil erodibility K factor map, (f) is the watershed topography LS factor map, (g) is the 2001 support practices P factor map, and (h) is the 2020 holding practices P factor map.
Water 16 00241 g004
Figure 5. Soil erosion risk map of the Hulan River Basin. Where (a) is the soil erosion map for 2001, (b) is the soil erosion map for 2020.
Water 16 00241 g005
Table 1. Major soil types, area, and corresponding K factor values in the Hulan River Basin.
Soil Unit Name SYM90 K Factor Area (km3) Proportion (%)
Dystric Planosols PLd 0.256 43 0.112
Gleyic Cambisols CMg 0.271 1661 4.309
Haplic Greyzems GRh 0.280 2396 6.216
Luvic Chernozems CHl 0.250 1310 3.399
Eutric Cambisols CMe 0.324 7613 19.751
Calcaric Regosols RGc 0.266 120 0.311
Eutric Fluvisols FLe 0.271 158 0.41
Cambic Arenosols ARb 0.285 4023 10.437
Haplic Podzols PZh 0.247 18 0.047
Chromic Luvisols LVx 0.256 9816 25.466
Haplic Luvisols LVh 0.296 712 1.847
Umbric Leptosols LPu 0.325 389 1.009
Mollic Gleysols GLm 0.249 588 1.525
Calcaric Cambisols CMc 0.277 8069 20.934
Calcic Chernozems CHk 0.281 1105 2.867
Haplic Phaeozems PHh 0.242 225 0.584
Stagnic Phaeozems PHj 0.233 296 0.768
Haplic Chernozems CHh 0.293 3 0.008
Total 38,545 100
Table 2. LULC classification, C factor values, and sources of classification in the Hulan River Basin.
LULC C Factor Source
Cropland 0.15 [42]
Forest 0.003
Grassland 0.05
Water 0
Barren 0.6
Impervious 0.09
Wetland 0.001
Table 3. Slope class of agricultural land and the value of the P factor.
LULC Classes Slope % P Factor
Agricultural land 0–5 0.1
5–10 0.12
10–20 0.14
20–30 0.19
30–50 0.25
50–100 0.33
Other LULC classes all 1
Table 4. Accuracy assessment results of the classified images.
LULC Class 2001 2020
PAa (%) UAa (%) PAa (%) UAa (%)
Cropland 88.98 82.76 93.51 90.53
Water 94.56 95 96.45 91.59
Wetland 96.54 89.29 90.32 93.33
Impervious 73.12 93.14 96.04 95.04
Barren 91.3 93.33 94.28 94.87
Forest 92.34 96.15 92.86 90.7
Grassland 80 80 90.38 94.35
Overall accuracy (%) - 89.79 - 92.83
Overall kappa statistics (%) - 88.47 - 91.64
Table 5. Changes in LULC classification between 2001 and 2020.
LULC Category 2001 2020 LULC Change Time Rate of Change Annual Rate of Change
km2 % km2 % km2 % %
Cropland 26,364.78 68.4 26,133.51 67.8 −231.27 −0.88 −0.046
Forest 11,139.51 28.9 10,831.15 28.1 −308.36 −2.77 −0.15
Grassland 116.02 0.301 72.47 0.188 −43.55 −37.54 −1.98
Water 139.92 0.363 247.84 0.643 107.92 77.13 4.06
Barren 23.13 0.06 5.24 0.0136 −17.89 −77.35 −4.07
Impervious 713.08 1.85 1225.73 3.18 512.65 71.89 3.78
Wetland 48.56 0.126 29.06 0.0754 −19.5 −40.16 −2.11
Total 38,545 100 38,545 100 - - -
Disclaimer/Publisher’s Note: The statements, opinions and data contained in all publications are solely those of the individual author(s) and contributor(s) and not of MDPI and/or the editor(s). MDPI and/or the editor(s) disclaim responsibility for any injury to people or property resulting from any ideas, methods, instructions or products referred to in the content.

