Article

Thermal Effects on the Soil Water Retention Curves and Hydraulic Properties of Benggang Soil in Southern China

College of Resources and Environment, Fujian Agriculture and Forestry University, Fuzhou 350002, China
*
Author to whom correspondence should be addressed.
Water 2024, 16(2), 238; https://doi.org/10.3390/w16020238
Submission received: 12 December 2023 / Revised: 30 December 2023 / Accepted: 8 January 2024 / Published: 10 January 2024
(This article belongs to the Section Hydrology)

Abstract

:
Soil hydraulic properties significantly affect the occurrence and development of collapsing gully walls. The effect of temperature on the hydraulic properties of soil in collapsing gully walls remains unclear. In this study, the hydraulic properties of the red soil layer, the sandy soil layer and the detritus layer in a collapsing gully wall were investigated using the filter paper method, and the soil water retention curves of the different soil layers at 25 and 40 °C were determined. The aim of this study was to investigate the impact of temperature on the soil hydraulic properties of different soil layers in collapsing gully walls. The study found that when the water content in the red soil layer and sandy soil layer exceeded 20% and in the detritus layer exceeded 10%, the soil’s matric suction significantly decreased as the temperature increased from 25 to 40 °C. Additionally, the parameters of θ s , α , n and m all exhibited a decreasing trend, and the soil water content in the detritus layer was primarily influenced by the temperature change, which resulted in a decrease of 38.10%. The unsaturated hydraulic conductivity of the detritus layer exhibited higher values than that of the sandy layer and red soil layer under identical temperature conditions. Moreover, the unsaturated hydraulic conductivity of the red soil layer, sandy soil layer and detritus layer increased with increasing temperature. It was observed that the unsaturated hydraulic conductivity of the detritus layer increased by 0.18 cm h−1 at a soil water content of 44%. This increase in conductivity was more pronounced than the corresponding changes in the red soil layer and sandy soil layer. An elevated temperature caused the water-holding capacity of the different soil layers of the collapsing gully wall to decrease and the unsaturated hydraulic conductivity to increase. However, the influence of the clay particle content within the soil of the collapsing gully wall rendered the temperature effect more distinct. Therefore, the destabilizing deformation of the soil in the collapsing gully wall during the summer under high temperatures and precipitation may have played a key role in its collapse.

1. Introduction

Benggang is a unique type of soil erosion in the red-soil hilly areas of southern China and is an erosion occurrence in which the soil on the slope collapses and forms a broken landform under the combined influence of water scouring and gravity [1,2]. Benggang primarily appears on granite weathering crust, with the weathering process of the parent rock being accelerated by the high-temperature and rainy weather conditions of the summer [3,4]. Based on a 2005 survey on erosion, there were 239,100 Benggang in the hilly granite-red-soil region of southern China, covering a total area of 1220.05 km2 [5]. It was concentrated in the seven provinces of Jiangxi, Guangdong, Hunan, Hubei, Anhui, Fujian and Guangxi, and the vast majority of Benggang was in the peak period of development [6]. Benggang causes serious damage to land resources, farmlands, houses, roads, and bridges; silts up rivers, lakes, ponds, and reservoirs; and aggravates natural disasters. Consequently, it poses serious threats to the economy and human society [7].
The most active component of Benggang is a collapsing gully wall, which is also the most crucial phase in its formation. Its stability is directly associated with the area of the Benggang and the degree of development of the colluvial soil, which is the determinant of the severity of Benggang erosion. Water changes in the soil affect the stability of the collapsing gully wall, leading to the development of erosion [8]. When soil is submerged in water, the volume of air within the surface pores compresses, and the pore air pressure increases, which leads to the disintegration of the soil structure [9]. For instance, Duan et al. [7] showed that the water-holding capacity and shear strength of the red soil layer and topsoil layer of a collapsing gully wall were higher than those of the sandy soil layer and that the collapse of the gully wall was caused by an increase in its water content. Therefore, it is crucial to study the laws of soil water movement and investigate the destabilization mechanism of Benggang to reveal its development process.
A soil water retention curve (SWRC) demonstrates the relationship between matric suction and the water content, which can assess directly or indirectly the stress state, soil permeability, shear strength, and many other properties of unsaturated soil [10,11,12]. A SWRC is influenced by soil texture, density, and temperature, with temperature being the most significant determinant in its variation [13]. According to the STVF theory, temperature affects the surface tension and viscosity of soil water, resulting in alterations to the hydraulic properties of soil [14,15]. However, it does not provide a complete explanation of the temperature-influence mechanism of the SWRC. Numerous studies have demonstrated that as soil temperature increases, additional variables, including soil air retention, the thermal expansion of water, alterations in the soil–water contact angle, and modifications to the soil pore distribution, also contribute to variations in soil hydraulic properties [16,17,18,19]. However, the investigation of temperature on soil hydraulic characteristics in the Benggang area is limited. The influence of temperature fluctuations on soil water potential and the SWRC has been the subject of numerous studies. Philip and De Vires [20,21] first reported the effect of temperature on SWRCs. Zhang et al. [22] investigated the effect of temperature on SWRCs and demonstrated that the water-holding capacity of the sandy soil layer decreased as the temperature increased. Ye et al. [23] found that the water-holding capacity of bentonite increased as the temperature increased, but the effect was not significant under high suction conditions. Gao and Shao [24] demonstrated the variations in soil hydraulic properties under different temperature conditions, with a decreased soil water-holding capacity at elevated temperatures. Roshani and Sedano [25] compared the SWRCs of two soils at different temperatures and concluded that changes in soil water movement parameters (unsaturated hydraulic conductivity, equivalent pore diameter, and so on) are closely related to the temperature and soil type. During the summer, elevated temperatures can cause the ground temperature in the Benggang area to increase by up to 60 °C. This increase in temperature induces alterations in the movement and distribution of soil water. Nevertheless, the exact mechanism by which temperature affects variations in soil water across the different soil layers of collapsing gully walls remains unknown. For this reason, it is of great importance to study the effect of temperature on the SWRCs of the different soil layers in collapsing gully walls.
The different soil layers of Benggang were the focus of this study, and the filter paper method was used to explore a SWRC at 25 and 40 °C. The aim of this study was to investigate the differences in the SWRCs of the different soil layers in the collapsing gully wall, as well as the influence of temperature on the SWRCs. The study was carried out using a Van Genuchten (VG) model; the soil equivalent pore diameter and soil unsaturated hydraulic conductivity were determined; and the characteristics and laws of the changes in these parameters under the different temperature conditions were analyzed. This study will establish a basis for investigating the impact of temperature on Benggang stability and understanding the mechanism underlying Benggang formation.

2. Materials and Methods

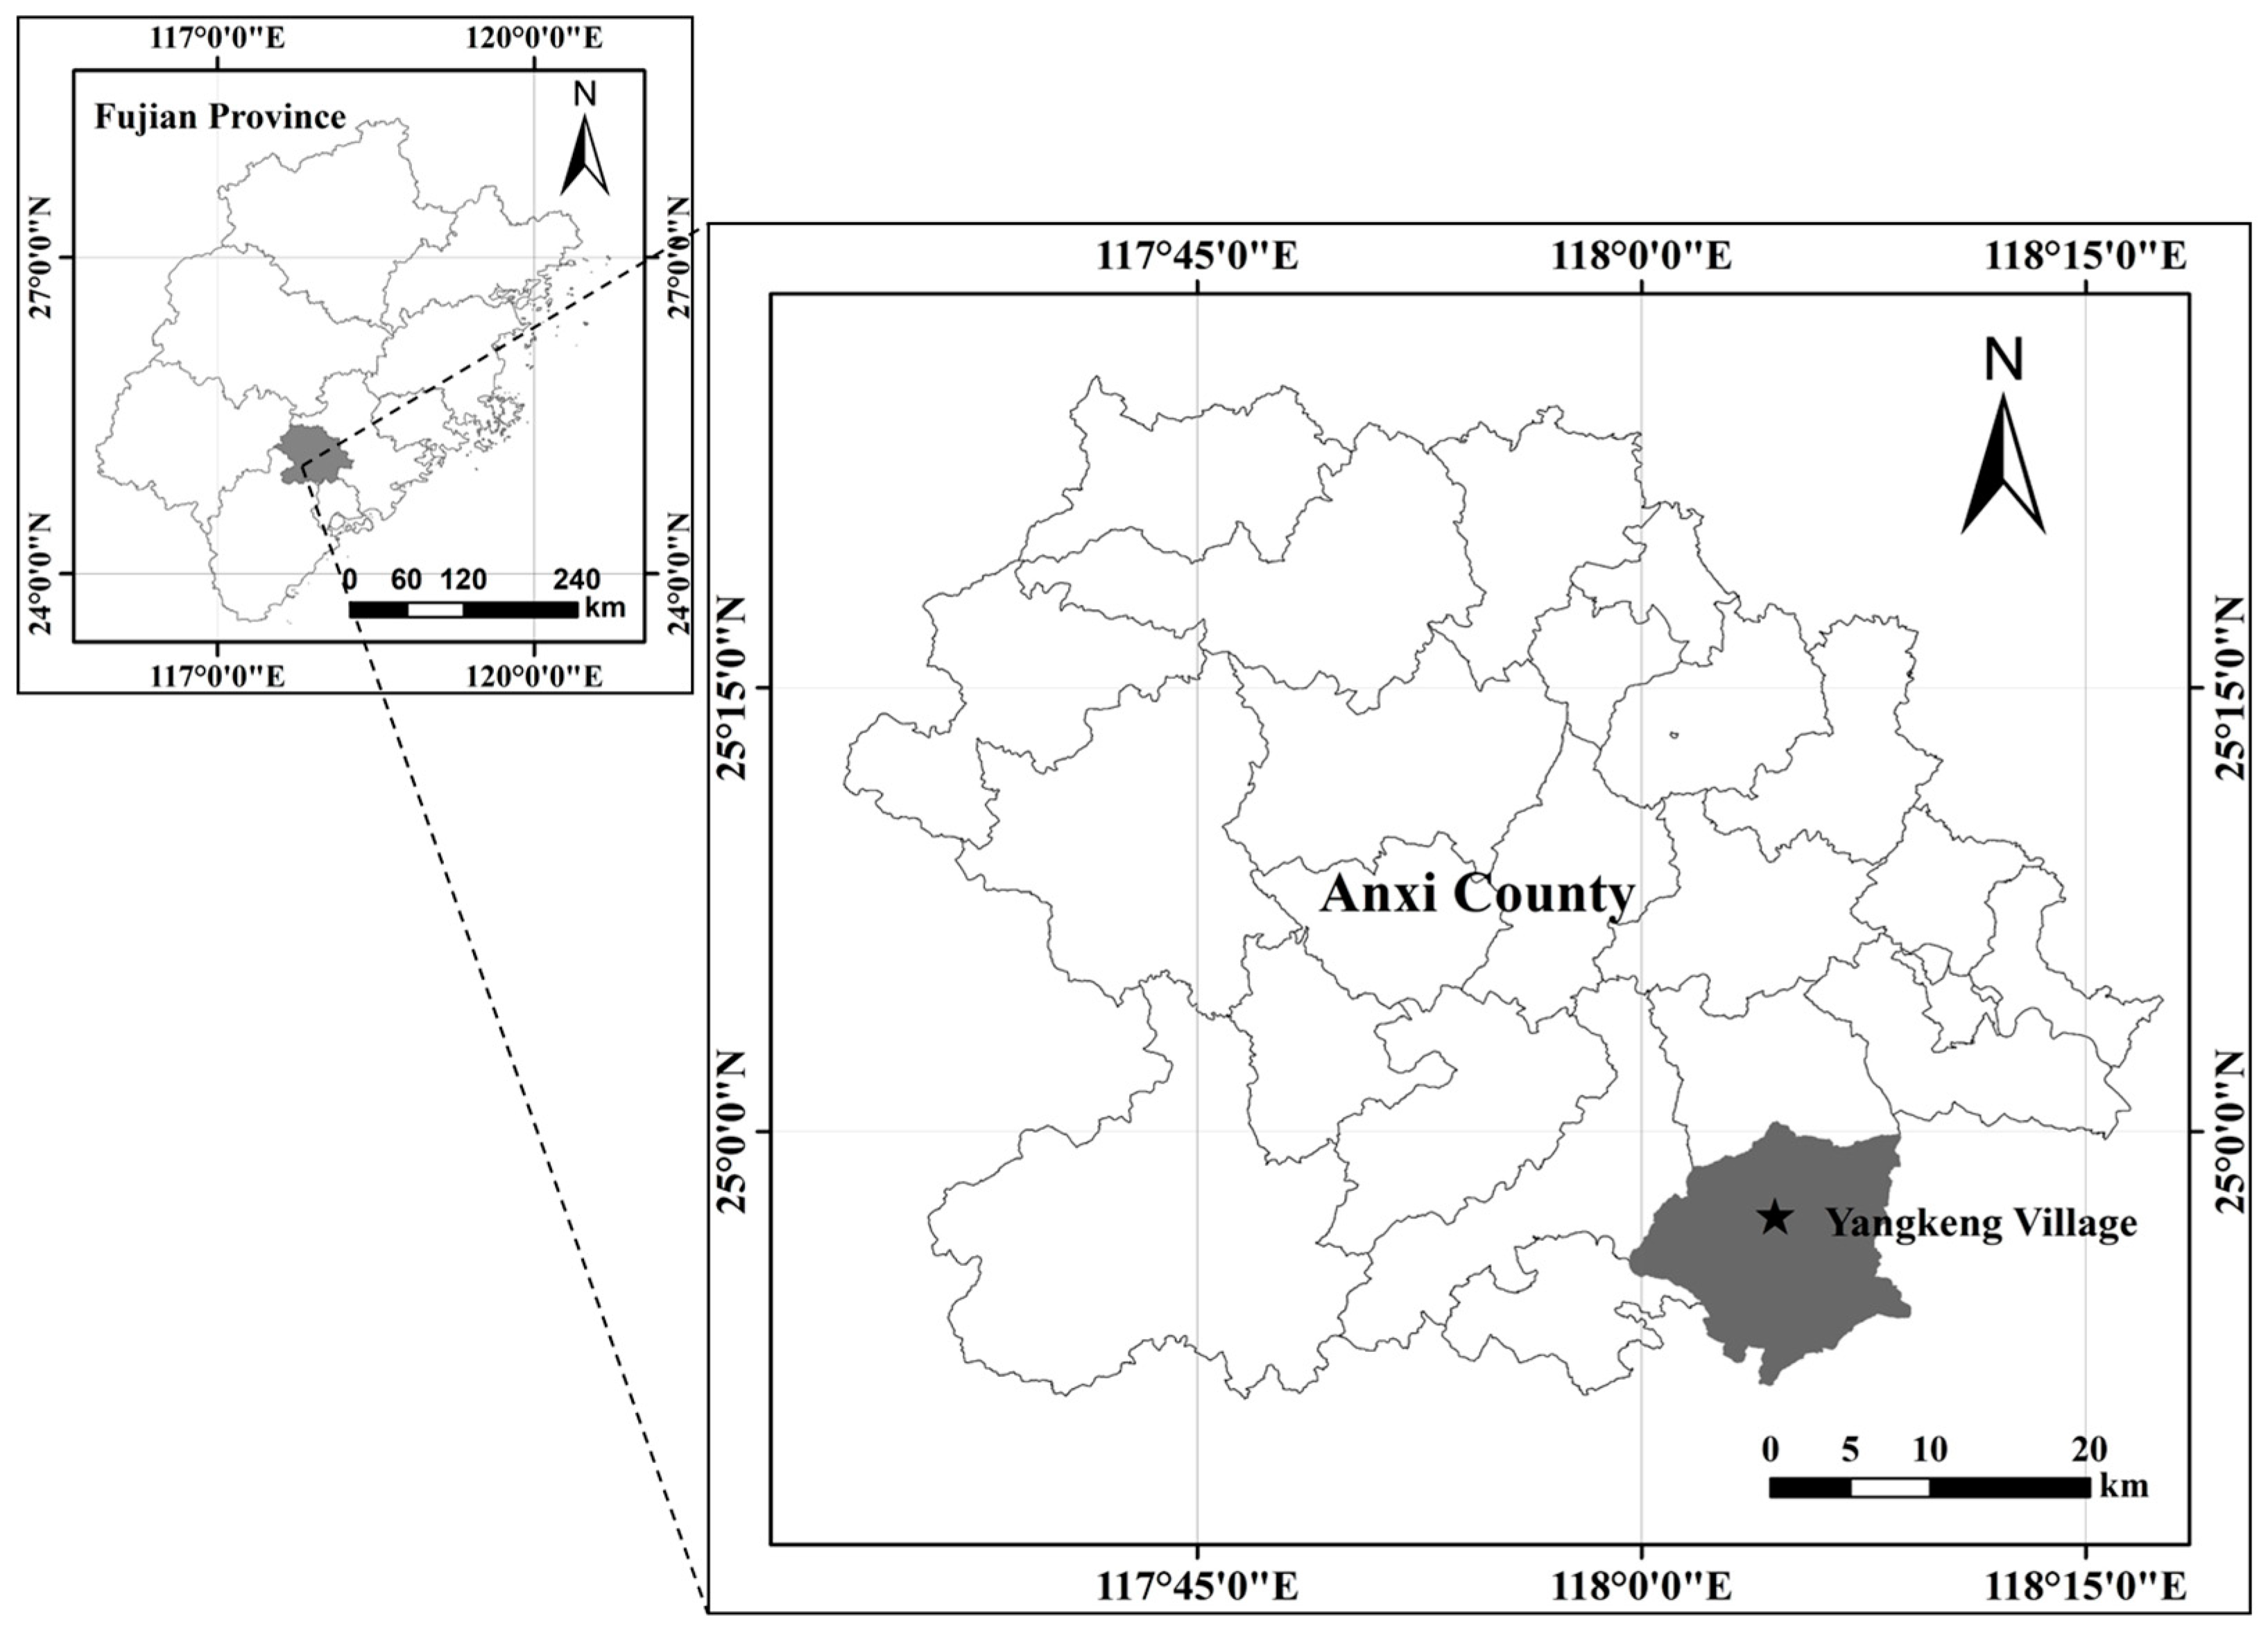
2.1. Study Area Overview
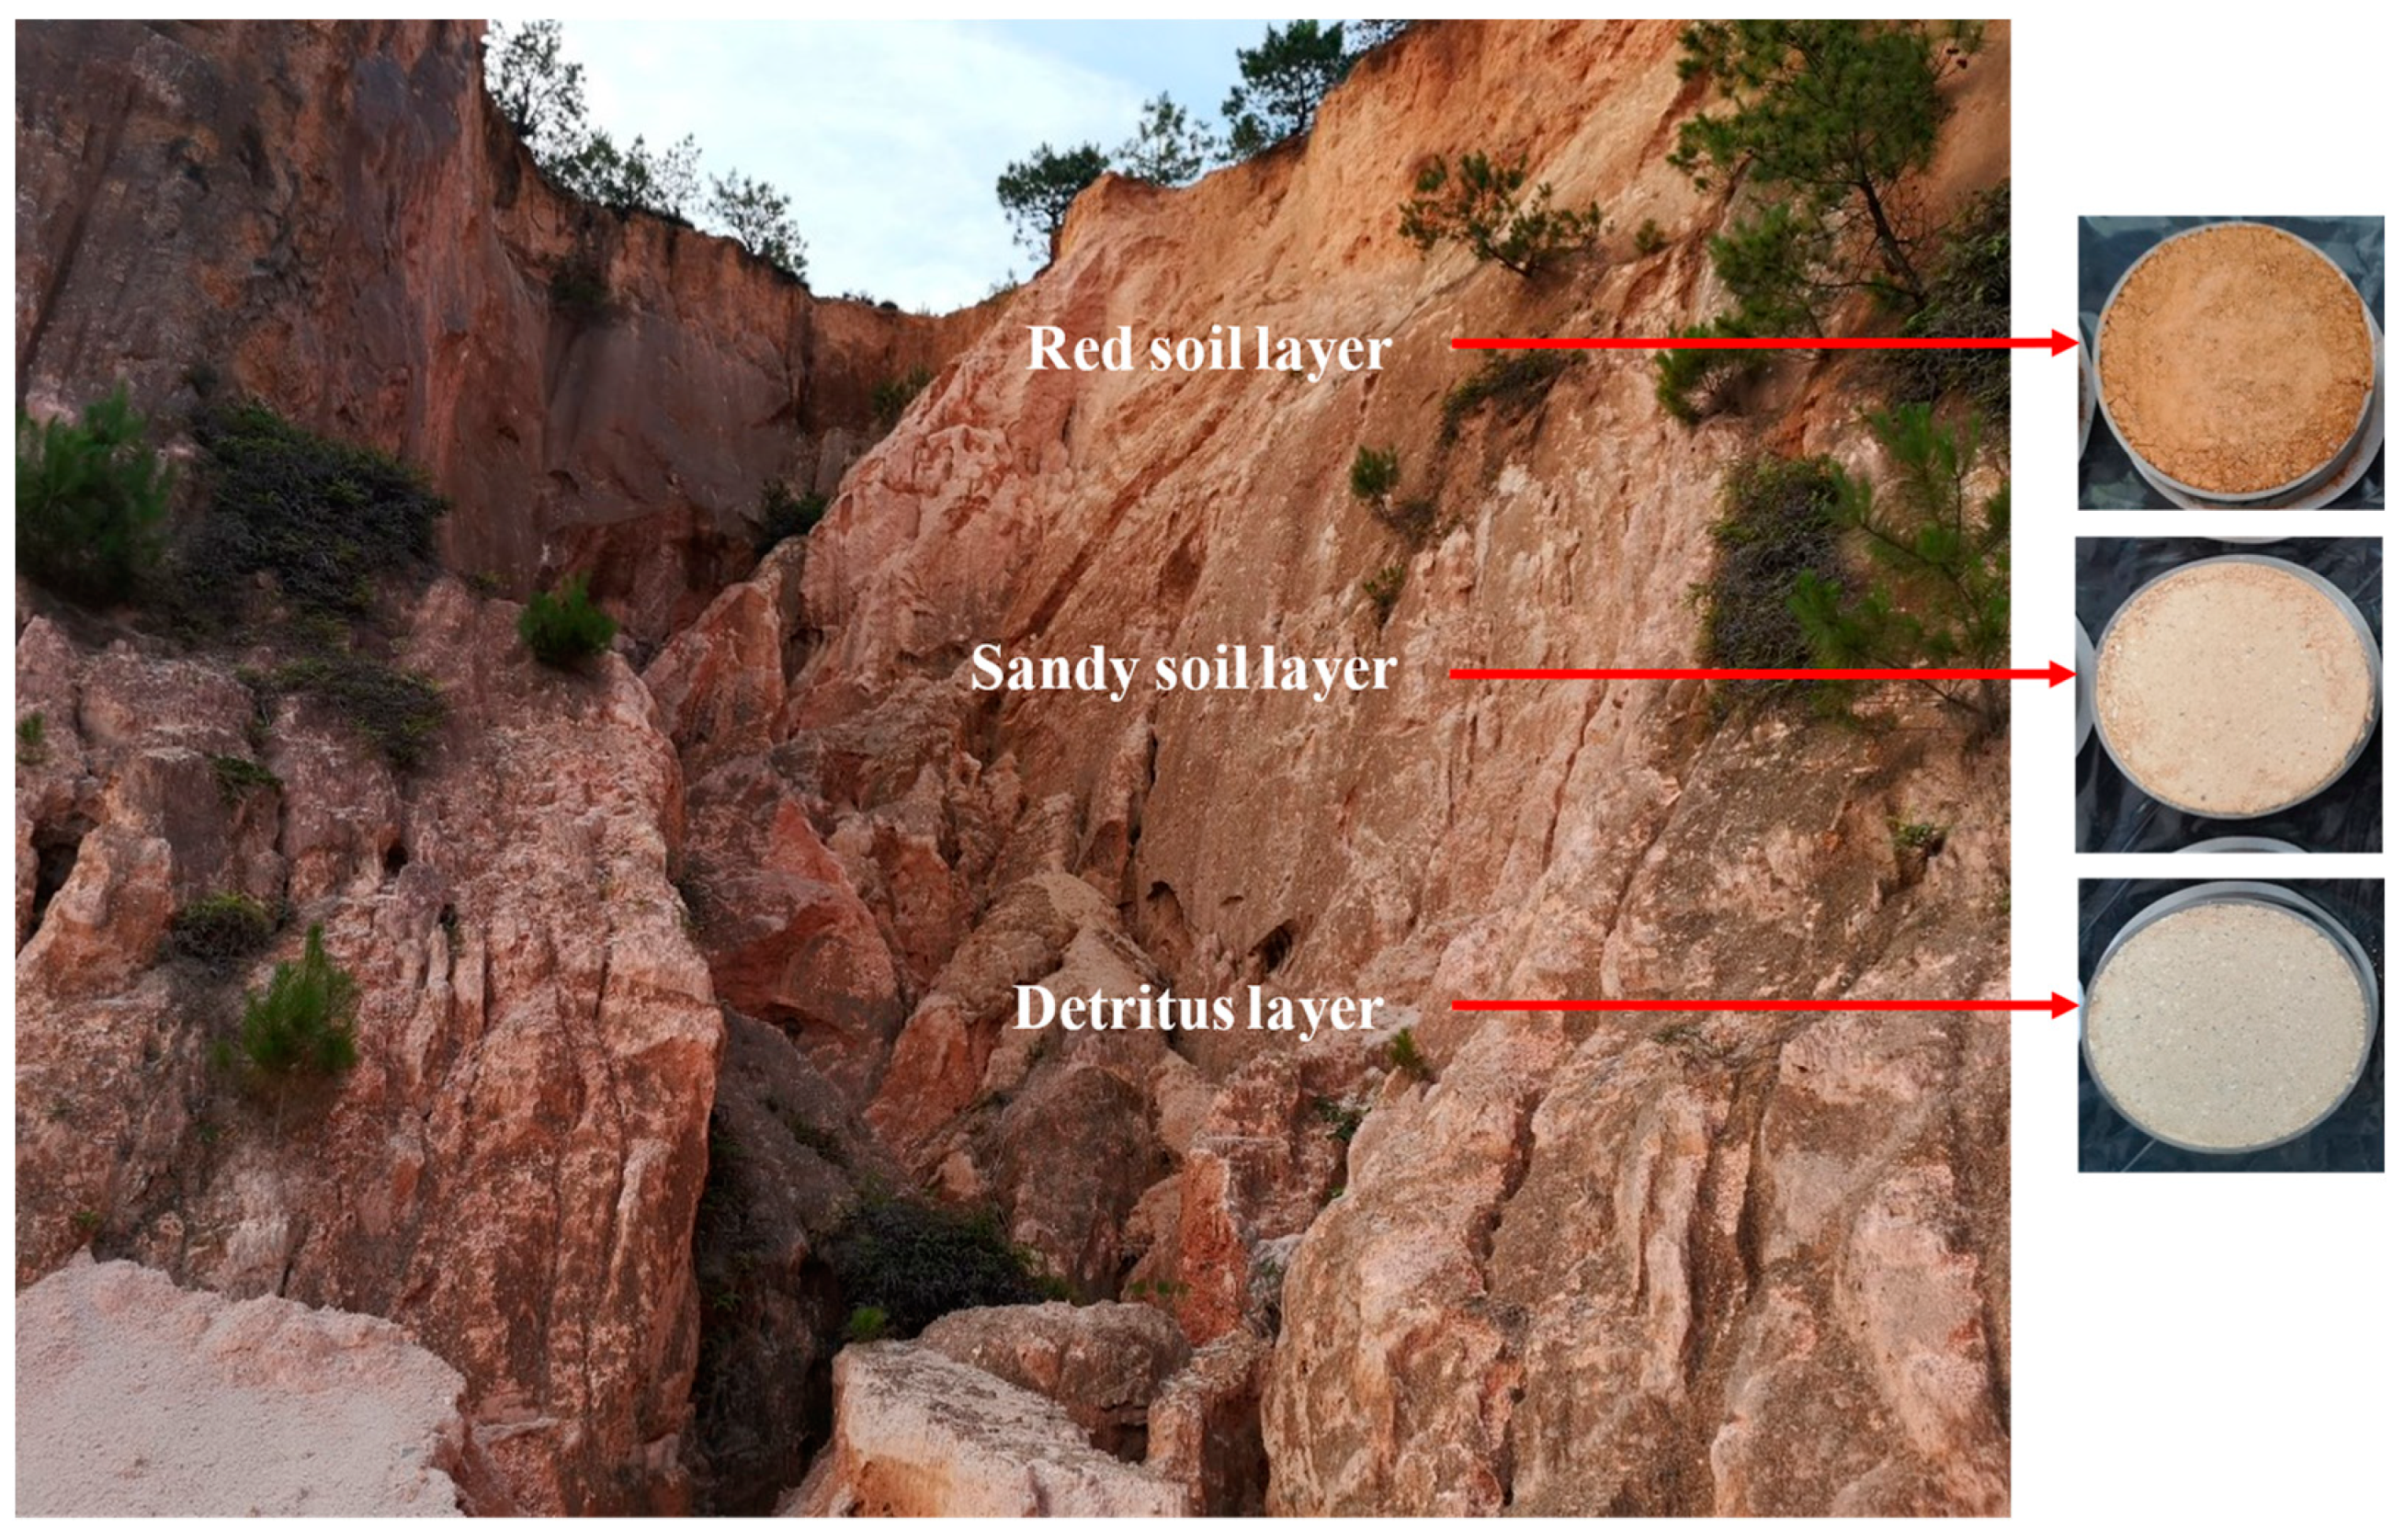
The study area was located in the village of Yangkeng, Longmen, Anxi County, central Fujian Province (Figure 1), with a geographical location of 24°57’ N and 118°05’ E, where the climate is subtropical and monsoonal, with an 18 °C average annual temperature, a maximum surface temperature that can reach 40 °C in summer, and an average annual rainfall of up to 1800 mm, with the highest concentration occurring from May to September. Anxi County is a hilly region with ferrosol soil, and the soil structure is loose [26]. The plant diversity in this region is low, and the dominant plant is Dicranopteris pedate (Houtt.) Nakaike. Anxi County has 12,828 Benggangs [5] and is one of the most severely affected areas by Benggang erosion in China.

2.2. Soil Samples

In this study, three typical active Benggangs were selected in Yangkeng Village, Longmen. A composite soil sample (randomly collected at 5 points) was collected from the red soil layer, sandy soil layer and detritus layer in one Benggang (Figure 2). The soil samples collected at different Benggangs of the same soil layer were mixed evenly for the analysis. Meanwhile, a cutting ring was used to take three undisturbed soil samples from each layer (100 cm3, 5.02 cm diameter and 5.05 cm height) for the bulk density measurement. A small amount of each air-dried soil sample was weighed, a dispersant was added to form a suspension, and a laser particle sizer was used to determine the composition of the soil particles (BT-9300ST, Bettersize Instruments Ltd., Dandong, China). A liquid–plastic limit combined device was used to measure the liquid and plastic limits (Shanghai Luda Experimental Instrumental Company, Shanghai, China), and the plastic index was calculated [27]. The constant head method was used to measure the saturated hydraulic conductivity, Ks [28]. A thermostatic incubator was used to regulate the temperature of Ks. The main physicochemical properties of the soil in the Benggang profile are shown in Table 1:

2.3. Test Methods of Calibration Curves of Filter Paper and SWRC

The filter paper method of the American Society for Testing and Materials (ASTM) D5298-94 [29] was used to determine the SWRC, which was divided into two steps. The first step was to establish the association between the total suction of the filter paper and the water content. The second step was to carry out the determination of the total suction of the soil with the filter paper. As a porous material, filter paper can retain water. When filter paper and soil are equilibrated in a closed container, the suction of the filter paper is equal to the suction of the soil. Both the matric suction generated by the soil and the osmotic suction generated by the salts in the soil increase the vapor pressure of the soil water when the filter paper is suspended on the soil (non-contact method). This will increase the relative humidity in the air. Hence, at equilibrium, the water content of the filter paper is the result of the flow of water vapor, which reflects the total suction of the soil (the sum of the matric suction and solute suction). Since the salinity of the soil in this experiment was very low (electrical conductivity < 10 μs cm−1), the conclusion is that the total suction will be similar to the matric suction.

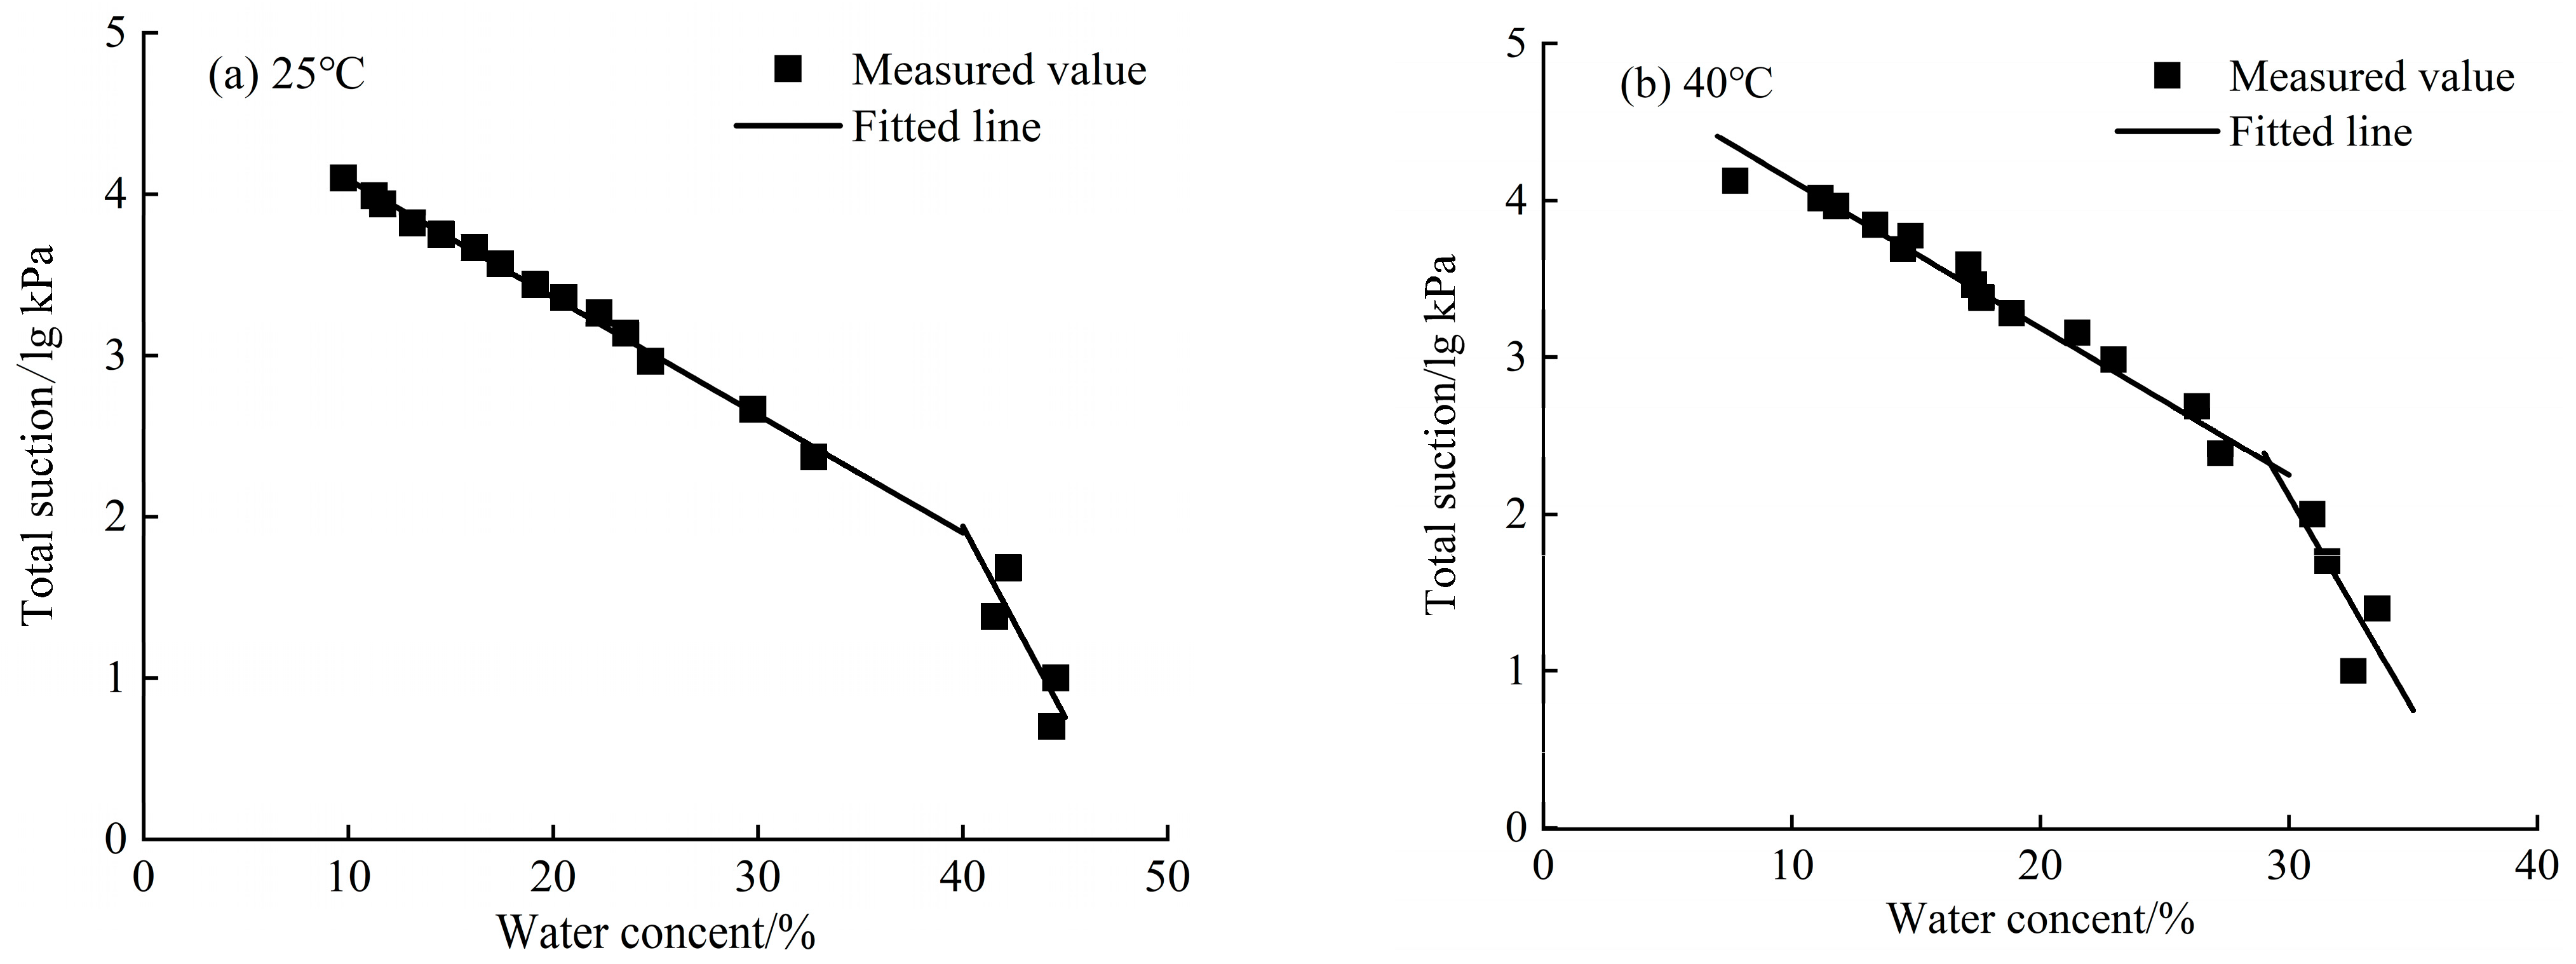
2.3.1. Filter Paper Suction Calibration Test

Low-speed quantitative filter paper, measuring 7 cm in diameter (Double-circle No. 402, Cytiva Bio-technology Co., Ltd., Hangzhou, China), was utilized in this experiment due to the potential variation in calibration curves among batches of filter paper. The total suction determination test was carried out using 0.001–2.5 mol L−1 NaCl solution, and the corresponding total suction values at 25 and 40 °C are shown in Table S1:
  • Specimen preparation
The steps of specimen preparation were as follows: (1) 200 mL of different molar concentrations of NaCl solution were poured into different sealed canisters; (2) two pieces of dried quantitative filter paper were placed in the sealed canister; (3) the sealed canisters were placed in a sealed bag (which was sprayed with an appropriate amount of water); (4) the sealed canister within the sealed bag was placed in a high and low temperature–humidity alternating test chamber to reach water equilibrium (BPHJS-250A, Shanghai Bluepard Instruments Co., Ltd., Shanghai, China). The incubator was adjusted to the designated test temperatures of 25 and 40 °C.
2.
Sampling and testing process
A temperature equilibrium was maintained for 10 days on the filter paper samples. Then, the equilibrium water content of the filter paper in the sealed canister was investigated as follows: (1) the sealed canister was removed, two pieces of filter paper were extracted using tweezers, and the filter paper was immediately placed onto the electronic balance for weighing (the procedure required approximately 10 s to complete); (2) after weighing, the filter paper was placed in the oven to dry for 12 h and then weighed; (3) the water content of the filter paper was determined by comparing the masses of the wet and dried papers; (4) A calibration curve was fitted using the water content of the paper and the total suction [30].
3.
Calibration curve of filter paper
The total suction value and the corresponding equilibrium water content of the filter paper were plotted (Figure 3). Formulas (1) and (2) represent the calibration equations for the filter paper at temperatures of 25 and 40 °C, respectively:
lg Ψ = 0.0625 W f p + 4.7259        W f p 41 % lg Ψ = 0.3105 W f p + 14.899        W f p > 41 %
lg Ψ = 7.4842 W f p + 4.7739        W f p 23.54 % lg Ψ = 25.159 W f p + 8.9354        W f p > 23.54 %
where Ψ represents the total suction value, and Wfp represents the water content of the filter paper.

2.3.2. Soil Sample Suction Test

The operational details and laboratory protocols utilized to determine the soil suction were in accordance with the ASTM Standard for Geotechnical Testing [29]. The air-dried soil was sieved through a 2 mm sieve and prepared into test samples of 61.8 mm diameter and 20.0 mm height, based on the actual bulk density of the soil in each soil layer (Table 1).
The soil water content was adjusted to the target water content (38, 36, 33, 30, 27, 24, 20, 15, 10, 7 or 5%) by changing the mass water content of the soil samples. Then, the soil samples were placed in a sealed canister, and using a piece of filter paper, they were positioned at the bottom of the canister. The canister was then covered tightly with a lid and left to stand for 24 h to ensure an even distribution of water in the soil samples. The soil sample test procedure was identical to the filter paper calibration test, with the exception that the soil sample was used instead of the salt solution in the sealed canister. The water content of the filter paper in the soil samples with varying water contents at the two temperatures was determined using the same procedure as the filter paper calibration test. The water content measurement for each soil sample was performed four times. The suction value corresponding to soil samples with varying water contents was derived from the calibration equation of the filter paper using the measured water content of the filter paper. The SWRC was then fitted using the suction values of the soil samples and their respective water contents.

2.4. SWRC Model

The VG model can better characterize the SWRC of different textured soils and has high simulation accuracy [31]. The curve simulation used the VG model in the RETC software 6.02 [32]. The Van Genuchten–Burdine model is as follows [33]:
θ = θ r + θ s θ r 1 1 + α Ψ n m
where
θ s represents the soil saturated water content (cm cm−3); θ r represents the soil residual water content (cm cm−3); Ψ represents the matric suction (kPa); n, m and α are the fitting coefficients determining the shape of the water retention curve; and m = 1 − 2/n.
The thermal effects on the saturated hydraulic conductivity (Ks) can be calculated by the following formula [23]:
K s T = K s ρ s T / η s T ) / ( ρ s / η s
where η is the dynamic viscosity coefficient; ρ is the density of water; and the subscripts s and sT represent the parameters obtained at a reference temperature and any soil temperature, T, respectively.
The unsaturated hydraulic conductivity (Kθ) was calculated using the Burdine model [33]:
K θ = K s 1 ( a Ψ ) n 2 [ 1 + ( a Ψ ) n ] m [ 1 + ( a Ψ ) n ] 2 m
The accuracy between the predicted water content (θi(p), cm cm−3) and the measured water content (θi(m), cm cm−3) was evaluated by the root-mean-square error (RMSE) and the coefficient of determination (R2):
R M S E = 1 n i = 1 n θ i p θ i m 2
R 2 = c o v θ i ( m ) , θ i ( p ) v a r ( θ i ( m ) ) v a r ( θ i ( p ) )
where cov represents the covariance of two variables; var represents the variance of a random variable; and n is the total number of measurements.
The relationship between the soil equivalent pore diameter and the matric suction was calculated using the following formula:
s = 4 τ / d
where τ represents the surface tension coefficient of the water (N cm−1), which is mainly affected by the temperature; s represents the matric suction (Pa); and d represents the equivalent pore diameter (mm). This formula can be used to obtain the proportion of any range of equivalent pore diameter. The suction is equivalent to the water content of the soil (θ1) and the equivalent pore diameter is d1. The additional suction is equivalent to the water content of the soil (θ2), and the equivalent pore diameter is d2. Then, (θ1θ2)/θs is the ratio of the volume occupied by the equivalent pore diameter between d1 and d2 to the total volume of the pore space (θ1 > θ2) [34]. Here, a matric suction >1500 kPa is equivalent to a pore diameter of d < 0.2 μm, i.e., micropores; a matric suction of 33–1500 kPa is equivalent to a pore diameter of d = 0.2–8.7 μm, i.e., effective pores; and a matric suction <33 kPa is equivalent to a pore diameter of d > 8.7 μm, i.e., macropores.

2.5. Data Processing and Statistics

The parameters were fitted to the SWRC using the RETC software 6.02, and Excel 2007 was employed to process and present the data.

3. Results

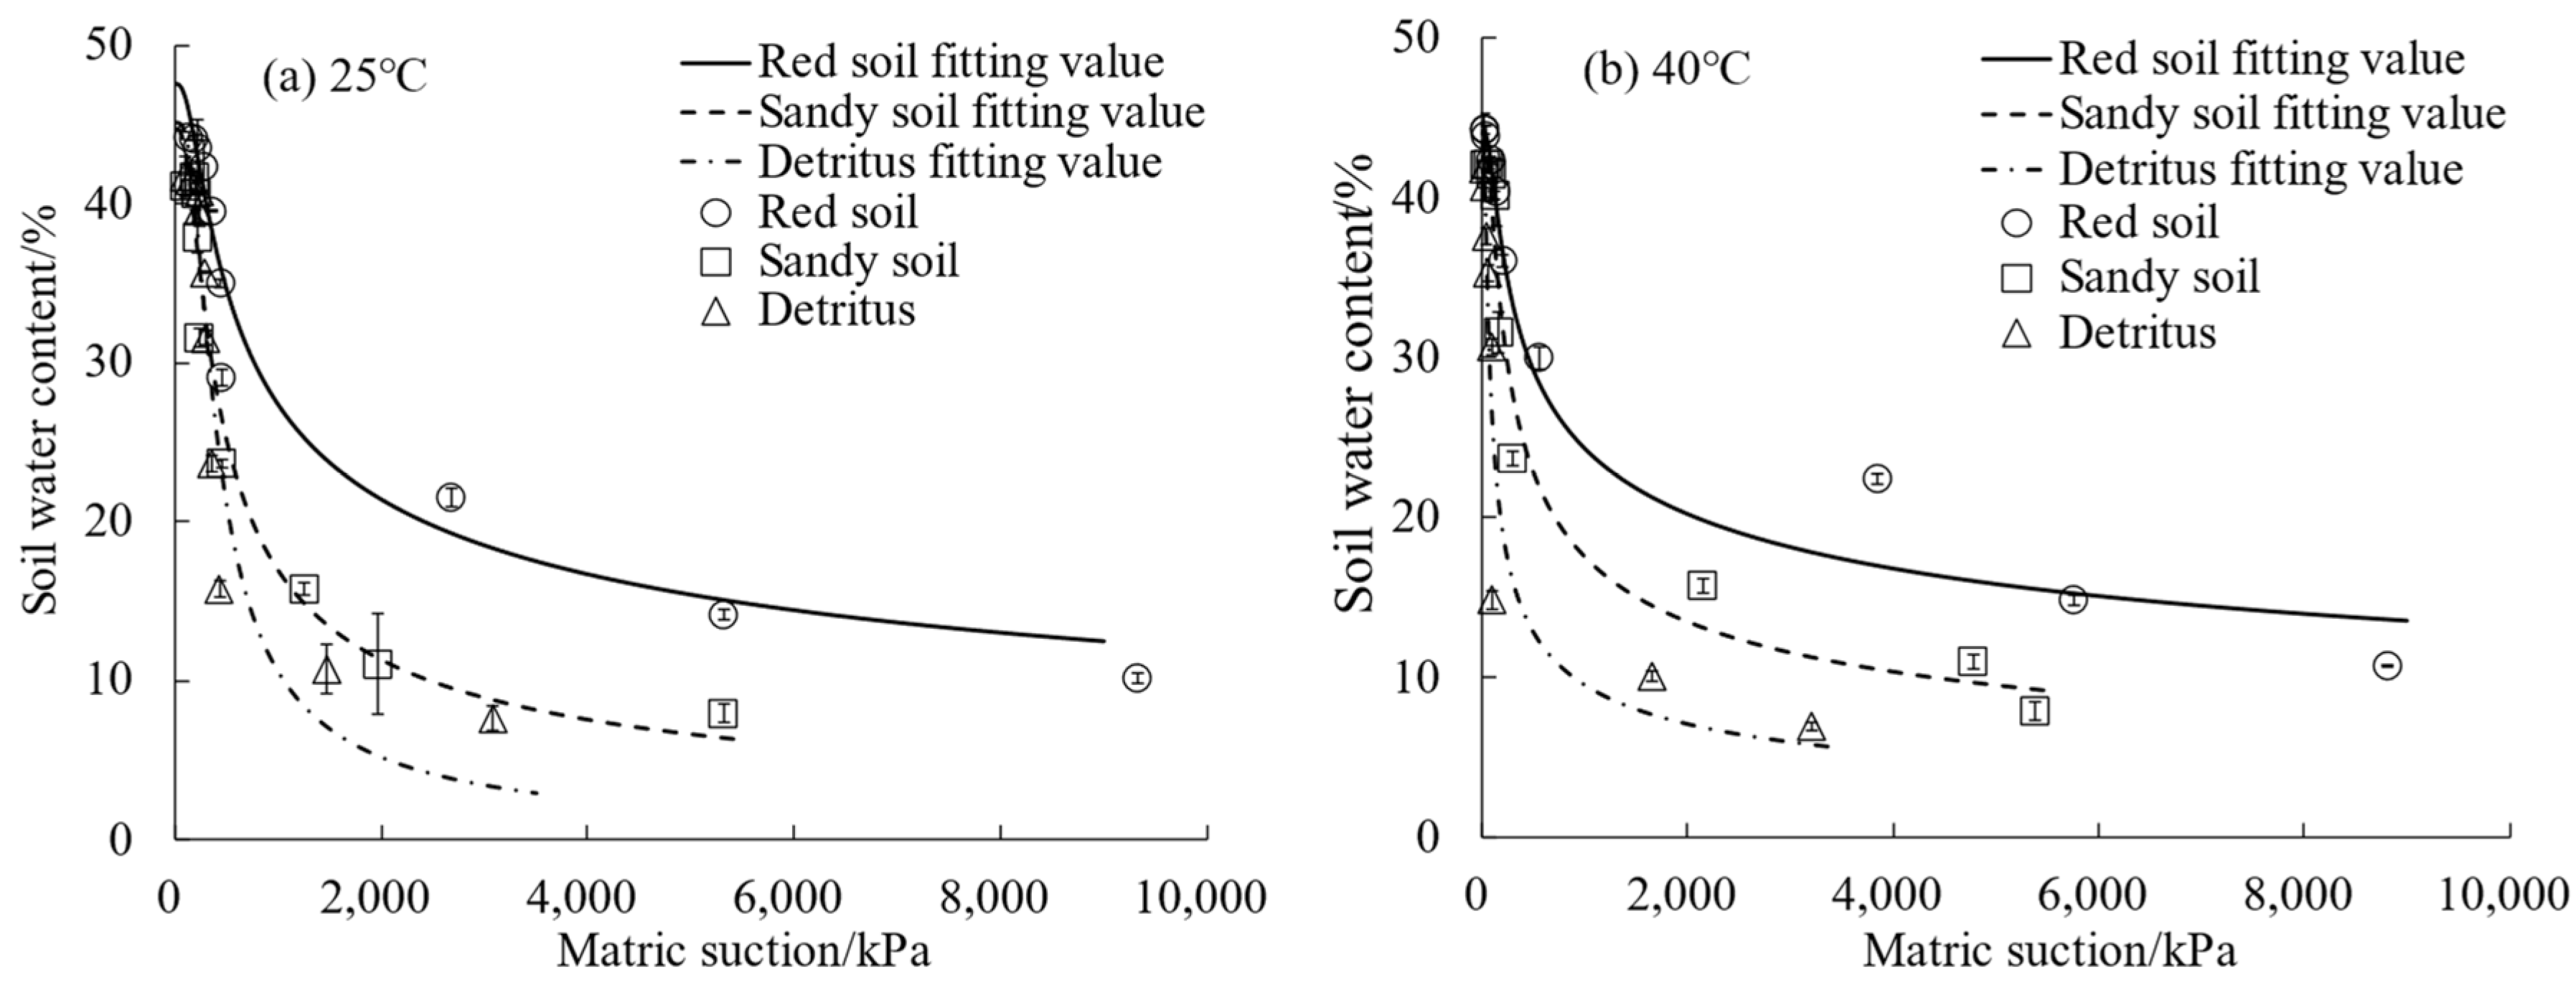
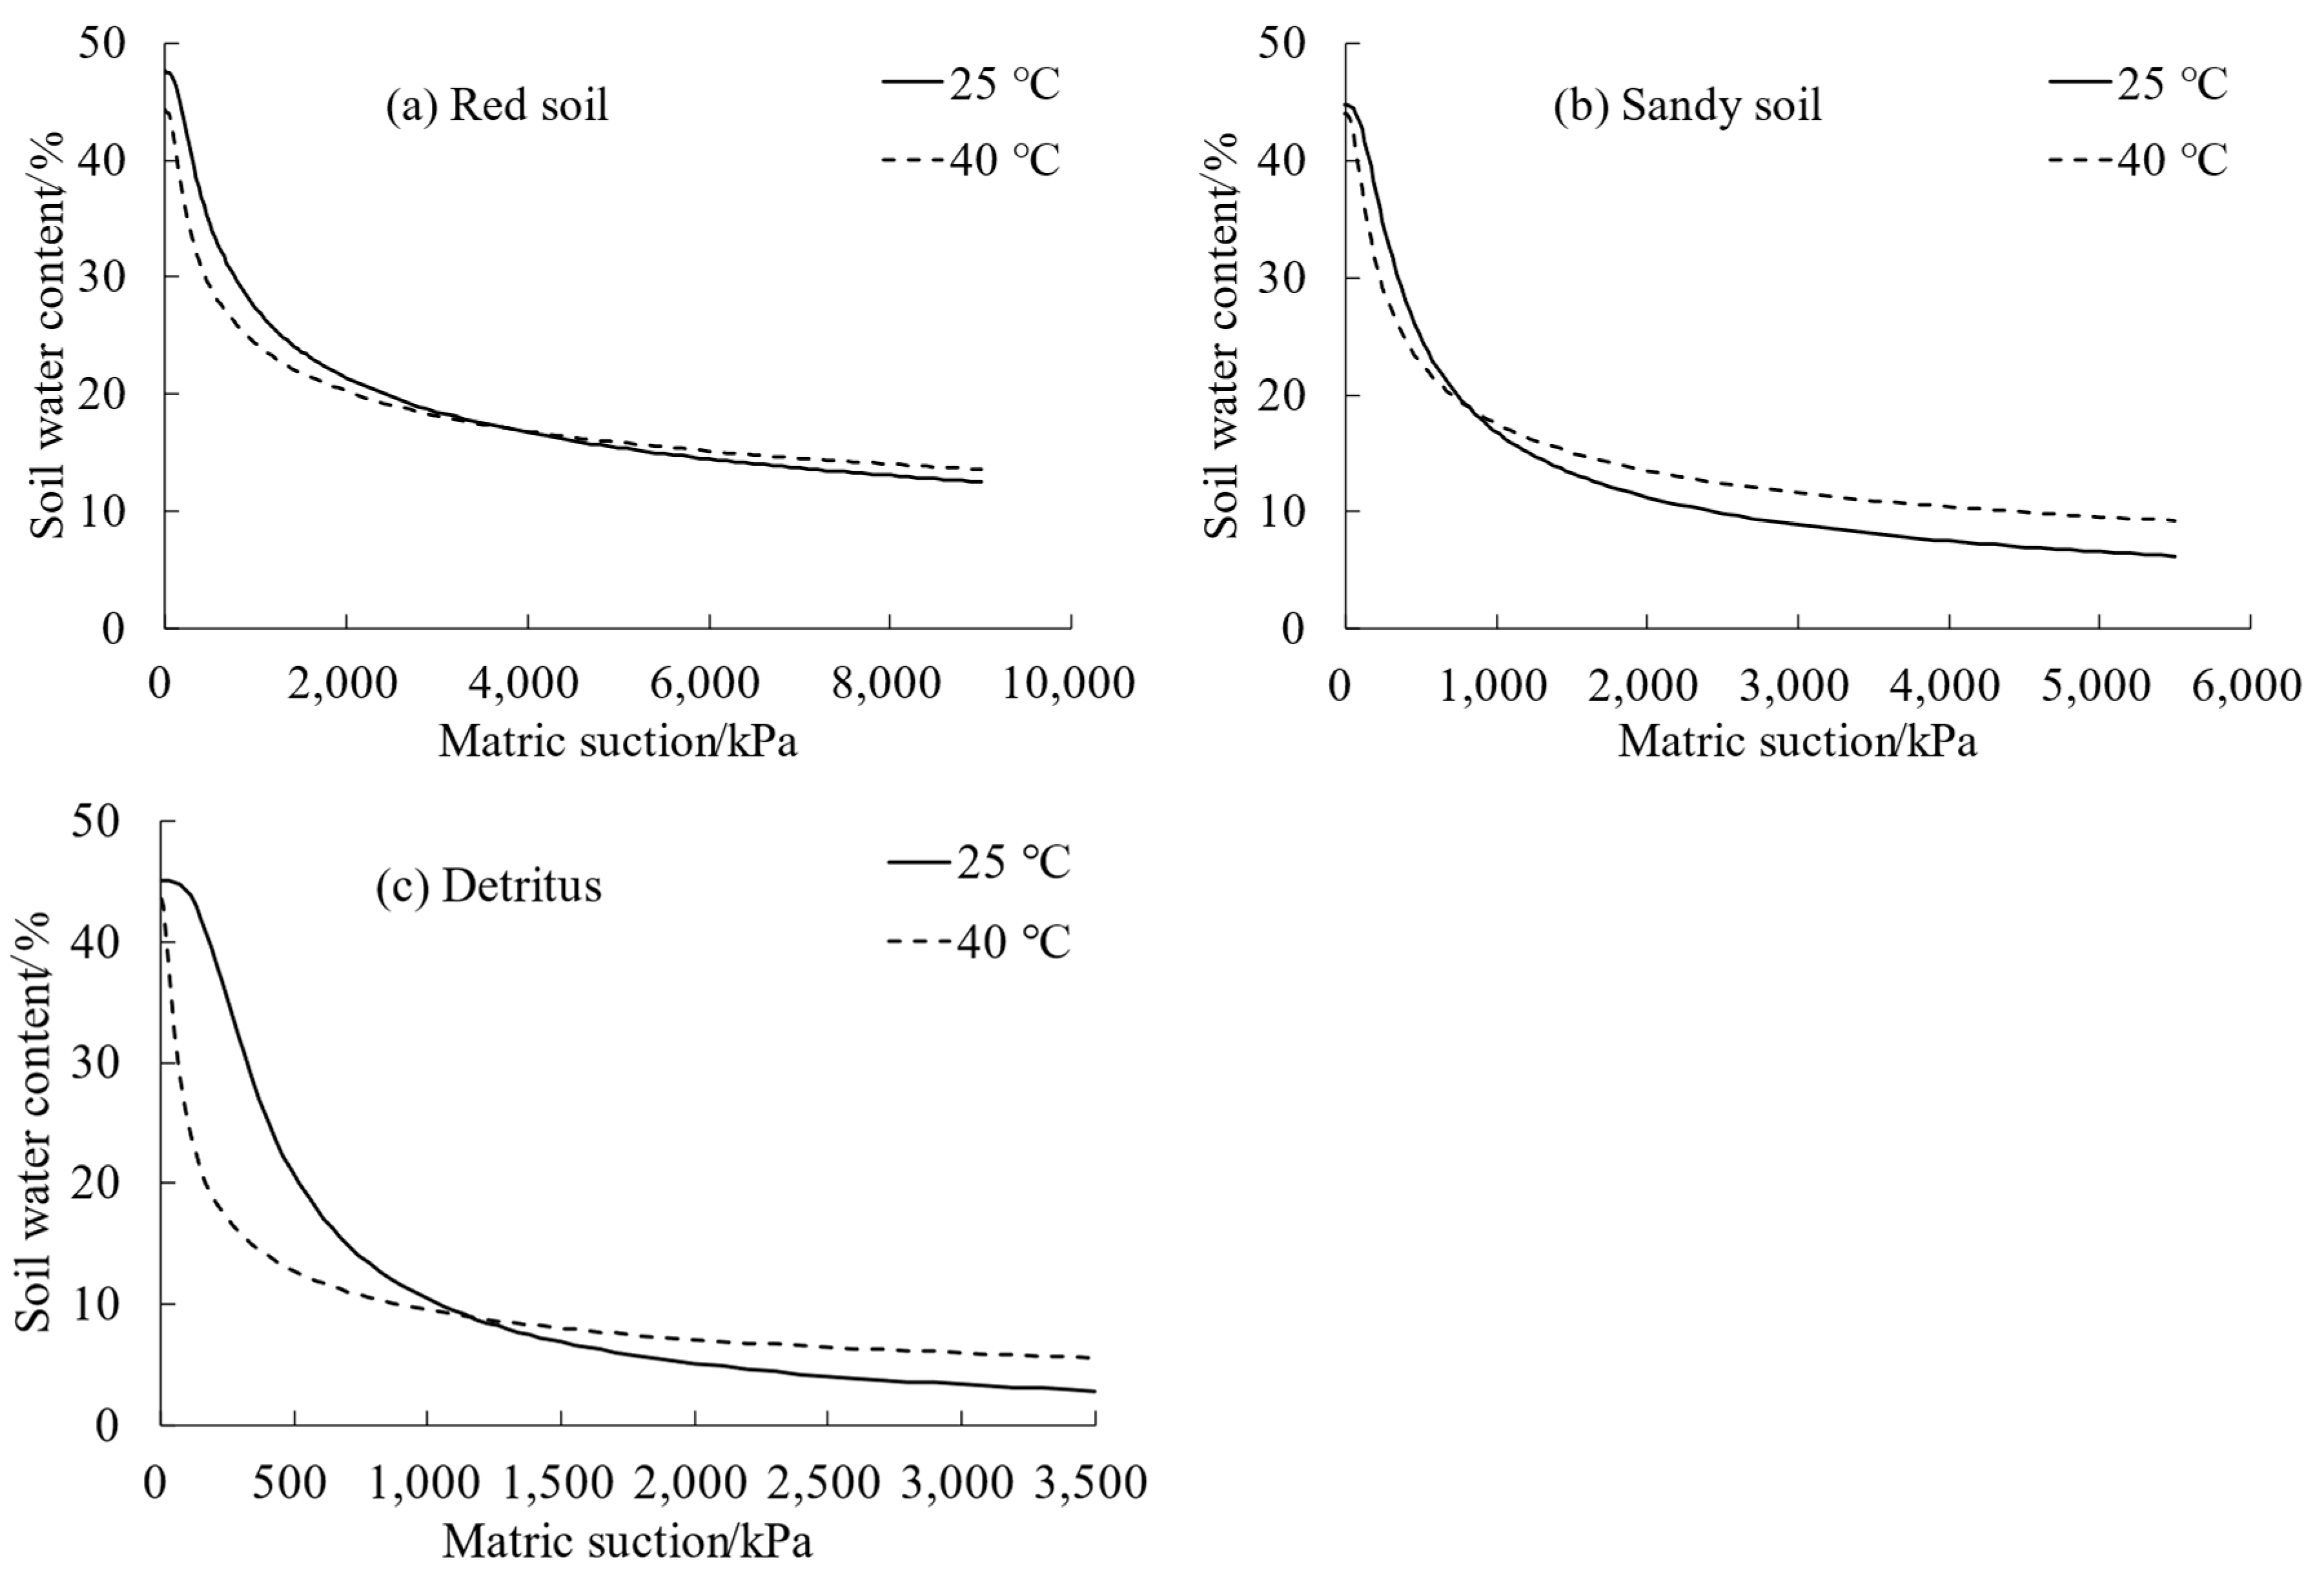
3.1. Effect of Temperature on the SWRCs of the Different Soil Layers

3.1.1. Differences in the SWRCs of the Different Soil Layers

The matric suctions of the red soil layer, sand soil layer, and detritus layer are 0–10,000, 0–5500, and 0–3500 kPa, respectively. At 25 °C, the SWRCs of the detritus layer, red soil layer, and sandy soil layer of the collapsing gully wall exhibited comparable shapes. Across all three layers, an increase in the matric suction resulted in a decrease in the soil water content (Figure 4). The SWRCs of the three soil layers demonstrated the same pattern at 40 °C. The soil water content of the different soil layers decreased significantly as the matric suction increased during the low suction stage (0–500 kPa). The curves exhibited a “steep and straight” decline, and the rate of decrease in the soil water content of the red soil layer was comparatively lower than that of the sandy soil layer and detritus layer. Specifically, at 25 and 40 °C, the soil water content in the red soil layer decreased from 48% to 35% and 44% to 29%, respectively; the soil water content in the sandy soil layer decreased from 45% to 25% and 44% to 23%, respectively; and the soil water content in the detritus layer decreased from 45% to 21% and 44% to 13%, respectively. This indicated that the soil water-holding capacity in the different soil layers decreased. With an increase in the matric suction, the rate of change in the soil water content of the red soil layer, sandy soil layer, and detritus layer decreased progressively during the medium suction stage (500–2000 kPa), exhibiting a gentle decreasing trend. As the matric suction increased during the high suction stage (2000–3000 kPa), the water content of the red soil, sandy soil, and detritus layer remained relatively constant, and the curves exhibited a stabilizing tendency.

3.1.2. Effect of Temperature on the SWRCs of the Different Soil Layers

The SWRCs of the three soil layers exhibited comparable trends at temperatures of 25 and 40 °C. However, under the same suction conditions, the changes in the SWRCs of the three soil layers were different (Figure 5). In the near-saturated zone, an overlap was observed between the SWRCs of the soil layers at the two temperatures. The impact of temperature on the SWRCs became more apparent as the matric suction increased when the red soil layer matric suction was <2000 kPa and the sandy soil layer and detritus layer matric suctions were <1000 kPa. As the temperature increased, the water-holding capacity of each soil layer decreased; at a suction of 500 kPa, compared to 25 °C, the soil water content was 17.14% lower in the red soil layer, 8% lower in the sandy soil layer and 38.10% lower in the detritus layer at 40 °C. The findings demonstrated that temperature had the most pronounced impact on the alteration of the soil water content in the detritus layer. Under the different temperature conditions, the SWRCs of each soil layer have overlapping parts, where the soil water contents of the red soil layer, sandy soil layer and detritus layer were found to be 17, 19 and 9%, respectively. As the matric suction increased further, the temperature effect on the three soil layers progressively diminished. At temperatures of 25 and 40 °C, the soil water content of the red soil layer was stabilized at 13 and 14%, respectively, whereas it was 6 and 9% for the sandy soil layer and 3 and 6% for the detritus layer, respectively.

3.1.3. Influence of Temperature on the Parameters of the SWRCs

The relevant parameters obtained by fitting the VG model to the SWRCs of the three soil layers at the different temperatures are shown in Table 2. According to the R2 and RMSE values, the fitting effect of the SWRCs for the different soil layers at each temperature was exceptionally precise (R2 > 0.89 and RMSE < 0.044), whereas the detritus layer had the least accurate fitting effect. A comparison of the water characteristic parameters of the different soil layers at temperatures of 25 and 40 °C revealed that changes in the temperature had an impact on θ s , α , n and m. The soil-saturated water contents in the red soil layer, sandy soil layer and detritus layer all showed a decreasing trend with increasing soil temperature. Furthermore, it was observed that the soil-saturated water content varied more significantly between the two temperatures in the red soil layer compared to the sandy soil layer and detritus layer. α is the reciprocal of the air entry value of the soil. At 40 °C, the α values of the three soil layers exhibited an increase in comparison to the values recorded at 25 °C. This suggests that as temperature increased, the air entry value of the soil correspondingly diminished. Notably, the sandy soil layer exhibited the highest α value in comparison to the other two soil layers. Thus, temperature had the most pronounced effect on the air entry value. An increase in the soil temperature resulted in a decrease in the soil parameters m and n of the detritus layer, sandy soil layer and red soil layer. These values were also correlated with the slopes of the SWRCs, which indicated that the SWRCs were flatter at 40 °C than at 25 °C. In accordance with the trend of the curves illustrated in Figure 5c, the most significant variation occurred in the slope of the SWRC and the m and n values of the detritus layer in comparison to the red soil layer and sandy soil layer at different temperatures.

3.2. Effect of Temperature on the Distribution of the Soil Equivalent Pore Diameter

The micropores (<0.2 μm), effective pores (0.2–8.7 μm) and macropores (>8.7 μm) of the red soil layer, sandy soil layer and detritus layer changed significantly with an increase in temperature (Figure 6). At 25 and 40 °C, the red soil layer and sandy soil layer exhibited a high ratio of macropores, while the proportions of micropores and effective pores were relatively low. At 25 °C, the detritus layer exhibited the highest proportion of macropores, but the proportions of micropores and effective pores were relatively low, 88.01, 6.43 and 5.27%, respectively. The proportion of effective pores in the detritus layer is the largest at 40 °C, which was 49.01%. When compared with 25 °C, the effective pores and macropores increased in the red soil layer at 40 °C, and the macropores increased and the micropores decreased in the sandy soil layer and detritus layer at 40 °C. With a baseline of 25 °C, the soil macropores in all three soil layers exhibited a decreasing trend with the increase in temperature. Specifically, the detritus layer demonstrated the most substantial reduction of 47.56% in macropores, followed by the sandy soil layer and red soil layer with a decrease of 11.23 and 10.76%, respectively. Meanwhile, the percentage of macropores in the red soil layer was higher in comparison with the other two soil layers under the same temperature conditions. This finding indicates that the water-holding capacity of the red soil layer was significantly higher, which was found to be consistent with the conclusions obtained from the soil SWRCs of the different soil layers in Figure 4.

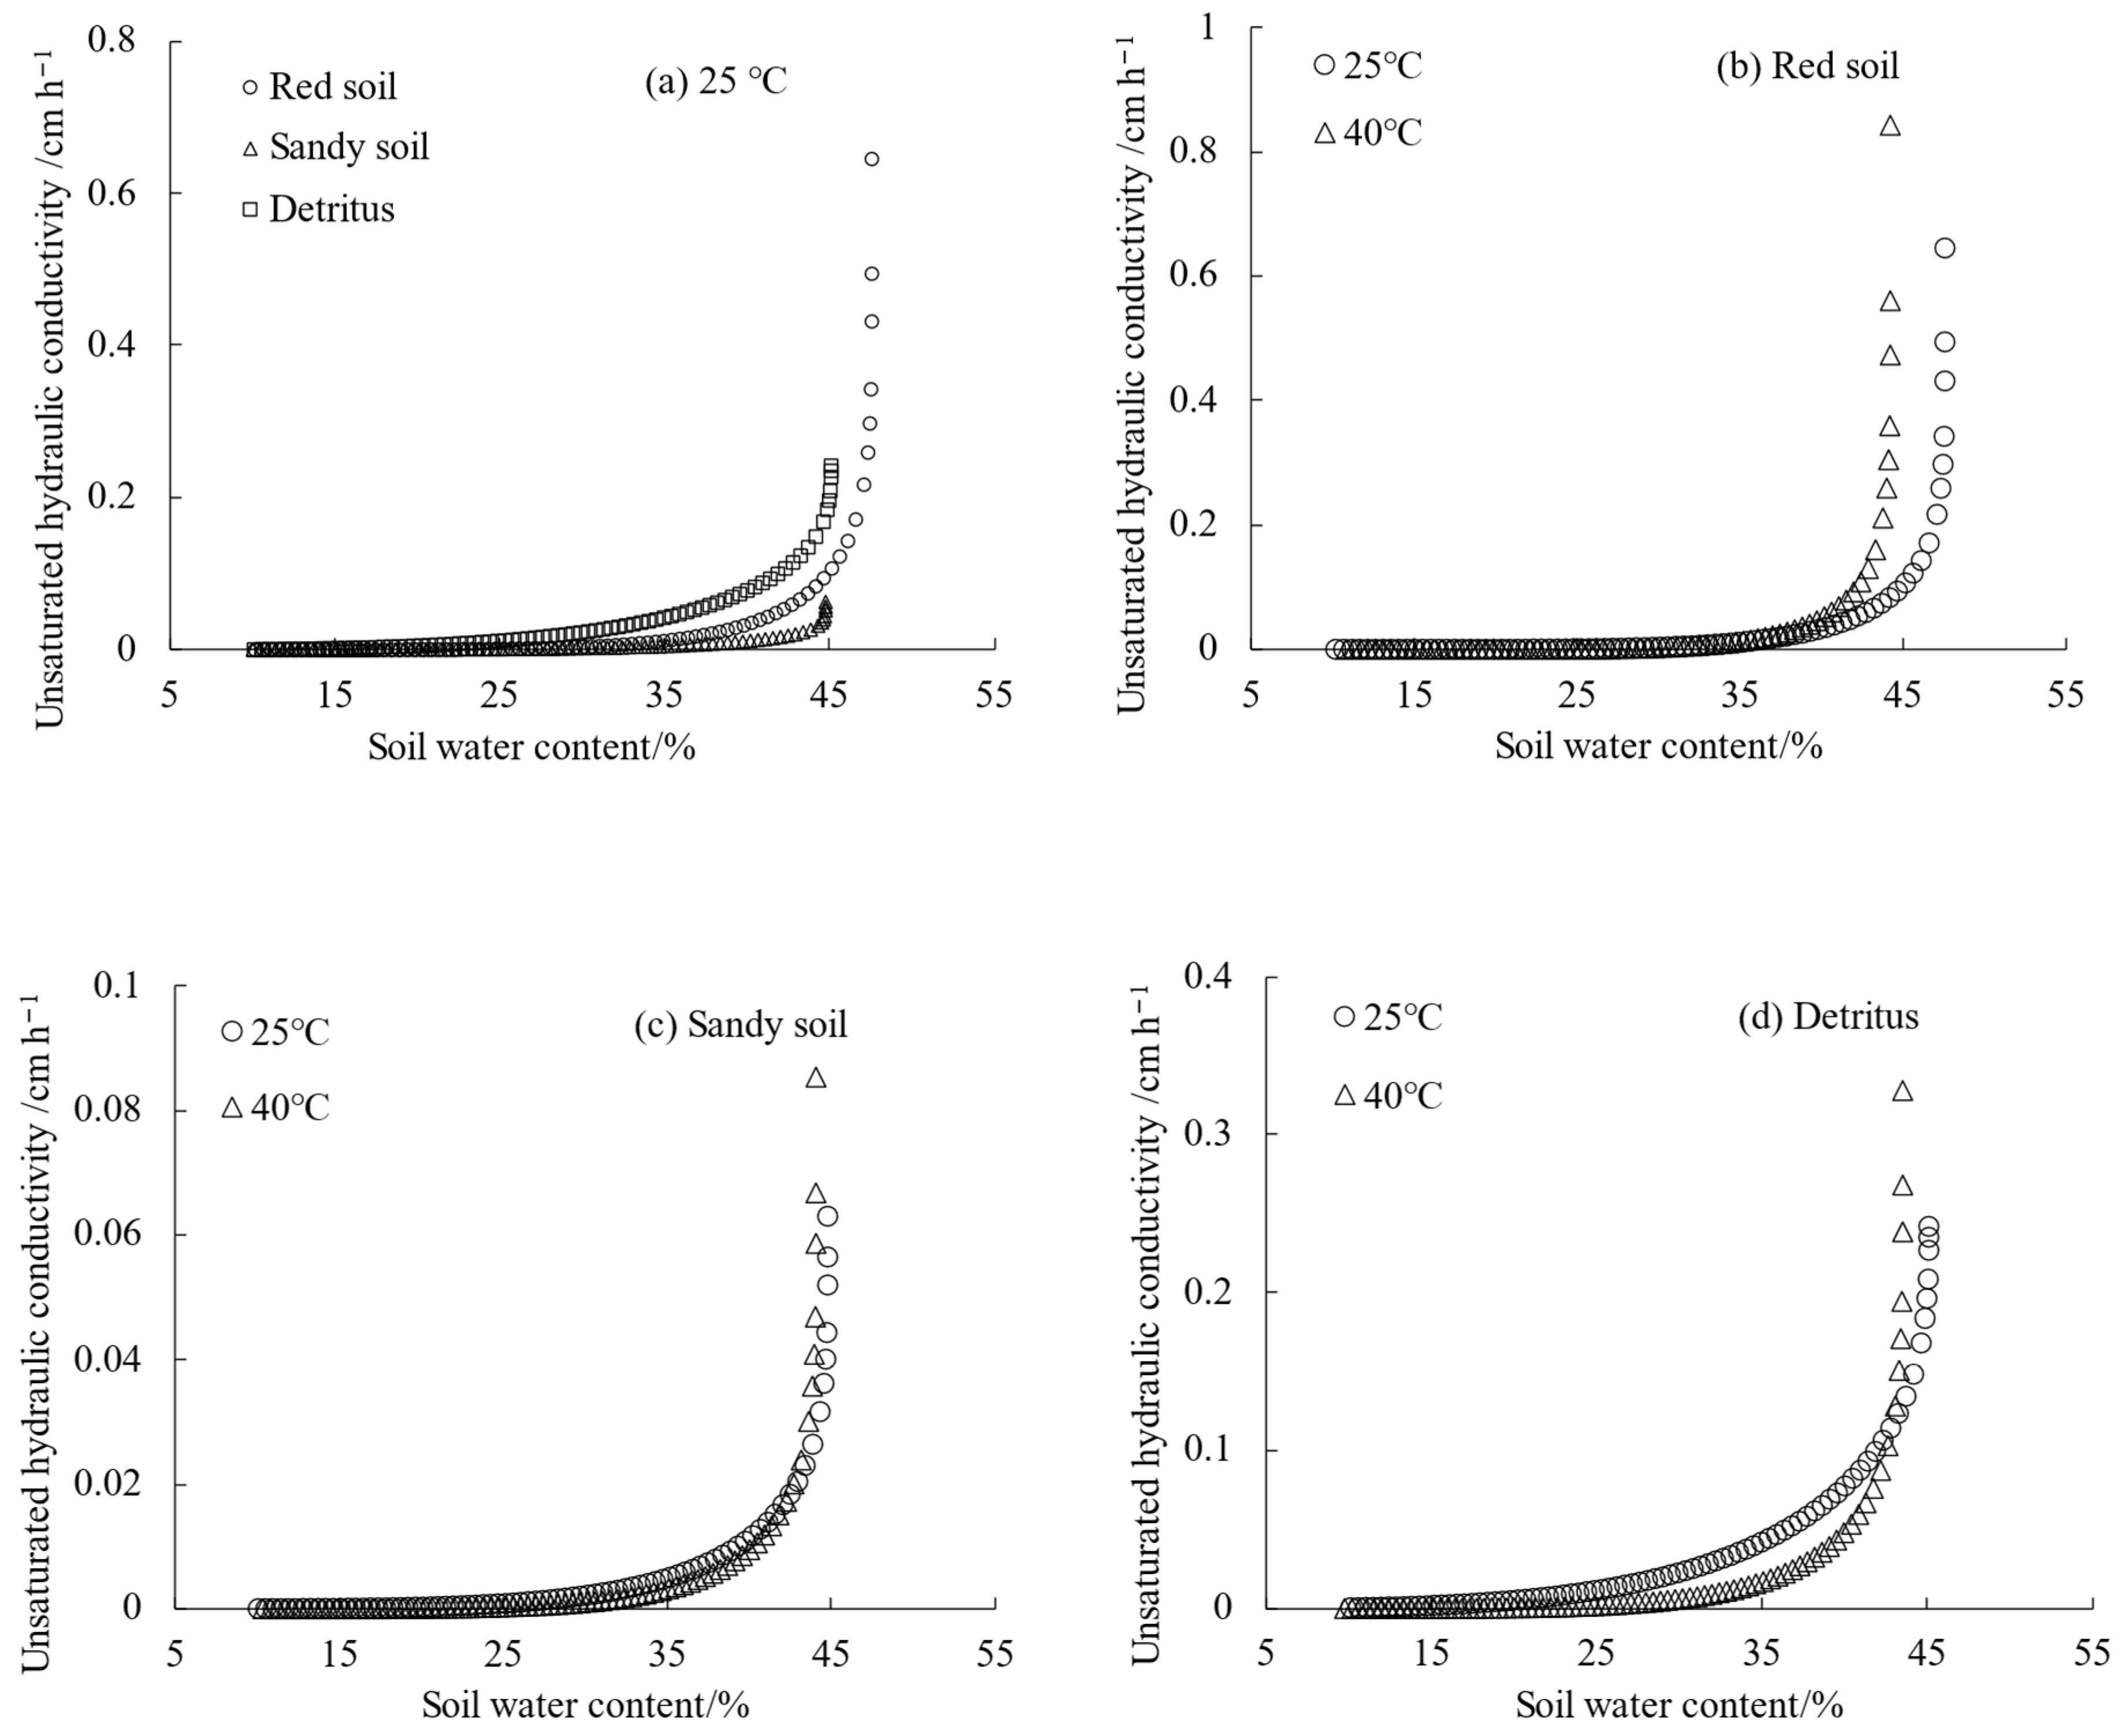
3.3. Effect of Temperature on the Unsaturated Hydraulic Conductivity of the Soil

The unsaturated hydraulic conductivity of the red soil layer, sandy soil layer and detritus layer soil exhibited a trend of gradual increase followed by an abrupt increasing trend with an increase in the soil water content (Figure 7a). The unsaturated hydraulic conductivity of the detritus layer was significantly higher than that of the red soil layer and sandy soil layer, with the sandy soil layer having the lowest unsaturated hydraulic conductivity. The red soil layer, sandy soil layer and detritus layer exhibited unsaturated hydraulic conductivities of 0.01, 0.01 and 0.04 cm h−1, respectively, at a soil water content of 35%. The unsaturated hydraulic conductivity of the three soil layers exhibited a consistent increase as temperature increased (Figure 7b–d). At the same soil water content, the unsaturated hydraulic conductivities of the red soil layer, sandy soil layer and detritus layer were all greater at 40 °C than at 25 °C. In the near-saturated zone, when the soil water content was 44%, the unsaturated hydraulic conductivity of the red soil layer was 0.07 cm h−1 and 0.21 cm h−1 at 25 and 40 °C, respectively, exhibiting an increase of 0.14 cm h−1. Furthermore, the unsaturated hydraulic conductivity of the detritus layer was 0.02 and 0.20 cm h−1 at 25 and 40 °C, respectively, representing an increase of 0.18 cm h−1; the unsaturated hydraulic conductivity of the sandy soil layer was 0.02 and 0.03 cm h−1 at 25 and 40 °C, respectively, representing an increase of 0.01 cm h−1.

4. Discussion

4.1. Differences in the SWRCs of the Different Soil Layers in the Collapsing Gully Wall

The present investigation revealed consistent variations in the SWRCs of the red soil layer, sandy soil layer and detritus layer of the collapsing gully wall. As the matric suction increased, the soil water content decreased, and the soil water-holding capacity was determined to be as follows: red soil layer > sandy soil layer > detritus layer. The trend of their curves was similar to that reported by Deng et al. [35] using the centrifuge method. The differences in the same soil layer’s water-holding capacity in different suction sections may be associated with the soil pores. For example, the water-holding capacity was limited at the low suction stage of macropore drainage. In the low suction stage, water is expelled from macropores in the soil, so the water-holding capacity was poor. The water-holding capacity of the water was further strengthened in the high suction stage due to capillary forces and soil particle adsorption, and the trend of increasing water content with increased suction demonstrated a flat curve. The water-holding capacity of the red soil layer was the strongest. The red soil layer exhibited significantly higher soil water content than both the sandy soil layer and the detritus layer under identical suction conditions, which was consistent with the findings reported by Xia et al. [36]. The red soil layer exhibited a higher clay content in comparison to the sandy soil and detritus layers while also demonstrating a lower soil bulk density (Table 1). Furthermore, the red soil layer had a high water-holding capacity, as the water was difficult to release, and during the rainy season, the infiltration of water into the red soil layer expanded its bulk beyond its own weight, potentially leading to its collapse.

4.2. Effect of Temperature on the SWRCs of Different Soil Layers in the Collapsing Gully Wall

The present investigation revealed that the temperature increase had the most pronounced effect on the SWRCs of the different soil layers during a particular suction stage (the near-saturated to 1000 kPa suction section). The SWRCs for the different temperatures overlapped in the near-saturated zone, where the detritus layer of the soil experienced a significant decrease in its water-holding capacity. The increase in temperature led to the expansion of the soil particles, which changed the pore characteristics and liquid–solid interface of the soil. A further analysis revealed a decrease in the void ratio, water-holding capacity and specific surface area of the soil particles [24]. The temperature curves corresponding to the same soil layer overlapped in the near-saturated region, and the complex water film covering the soil mineral particles exhibited properties comparable to pure water [37]. The water content of the soil in each layer varied significantly at different temperatures during the low suction stage (<500 kPa suction), and as the temperature increased, the soil water-holding capacity decreased even more. At this matric suction, the influence of temperature on the SWRCs was caused by changes in the water surface tension and viscosity, as well as variations in air trapping and the air–liquid contact angle [38]. Within the near-saturated zone up to the 1000 kPa suction stage, temperature exerted the greatest influence on the detritus layer. The impact of temperature varies depending on the texture of the soil, and a light texture is more significantly influenced than a heavy texture [39]. The detritus layer had a higher sand particle content and lower clay content than those of the red soil layer and sandy soil layer (Table 1), so it had a weaker water-holding capacity. Moreover, the thermal movement of the water molecules was intensified by the increase in temperature, which led to a decrease in the viscosity and surface tension of the water. The detritus layer had more macropores, so it decreased greatly in terms of water viscosity and surface tension [39]. The gradual decrease in the temperature effect with increasing suction was probably because high temperatures caused a reduction in the electric double-layer thickness of the soil colloids, which in turn decreased the water-holding capacity under a high matric suction [25]. In contrast, the high temperatures prompted the expansion of soil particles and the development of a compact soil structure, thereby increasing its water-holding capacity [40]. Under conditions of high suction, the combined effect contributed to a limited impact of temperature on the water content of the soil across the different soil layers. The degree of response of the SWRC parameters to temperature varied among the red soil layer, sandy soil layer and detritus layer. With an increasing temperature, θ s of the different soil layers decreased, α increased, and both m and n decreased. The pore conditions of the soil in the different soil layers changed with increasing temperature, leading to a reduction in the total porosity of the different soil layers with the increase in temperature [16]. Temperature affects the surface tension of water. Water flowing in the soil pores dissolves or releases gas and changes the gas phase volume in the soil, resulting in a reduction in soil air suction and a weakening of the soil water-holding capacity [41].

4.3. Effect of Temperature on the Unsaturated Hydraulic Conductivity of the Soil in the Different Soil Layers of the Collapsing Gully Wall

The present investigation revealed that the soil unsaturated hydraulic conductivities all exhibited a pattern of gradual increment followed by a sudden and significant increase for the red soil layer, sandy soil layer and detritus layer. Furthermore, as the temperature increased, variations in the soil’s unsaturated hydraulic conductivity were observed, especially for the red soil layer and detritus layer. This was because an increase in temperature resulted in a decrease in both the overall soil porosity and the micropores (<0.2 μm) of the three soil layers, but the sum of the effective pores and macropores increased. Moreover, the elevated temperatures contributed to enhanced water mobility and reduced viscosity, which ultimately resulted in water discharge from the considerable porosities via capillary action and friction, and the soil water encountered less resistance to its movement. This combined effect led to an increase in the soil unsaturated hydraulic conductivity of the different soil layers at elevated temperatures and a decrease in the water-holding capacity of the soil. The increase in temperature resulted in a significantly higher unsaturated hydraulic conductivity in the detritus layer in comparison to the red soil layer and sandy soil layer. This finding implies that the influence of temperature on the unsaturated hydraulic conductivity of the soil was also related to the soil texture. Macropores are more prevalent in the detritus layer due to their high sand content, and the connectivity and quantity of these pores influence the soil permeability. An increase in temperature induces thermal expansion in the soil air, while a corresponding increase in soil water content facilitates the air’s ability to displace water from the macropores. Hence, in comparison to the other two soil layers, the unsaturated hydraulic conductivity of the soil was highest in the detritus layer.
In summary, rising temperatures reduced the water-holding capacity of the soils and increased the unsaturated hydraulic conductivity of the soil in the different soil layers of a collapsing gully wall. The high temperature and rainfall in the summer may lead to increased vertical infiltration of the surface soil, increased horizontal infiltration of the collapsing gully wall [42], and an increased weight of the collapsing gully wall. Moreover, the decrease in the soil matric suction at elevated temperatures may lead to a decrease in the soil shear strength, which further causes a decrease in the stability of the collapsing gully wall.

5. Conclusions

The red soil layer, sandy soil layer and detritus layer were collected from a collapsing gully wall, and the SWRCs of the different soil layers were determined at 25 and 40 °C using the filter paper method. The investigation focused on the correlation between temperature and the hydraulic properties of the different soil layers comprising the collapsing gully wall. The findings of this study are outlined below:
The temperature affected the SWRCs of the red soil layer, sandy soil layer and detritus layer. The soil water-holding capacity of the different soil layers exhibited a decrease as the temperature increased. Notably, the detritus layer demonstrated a significantly lower water-holding capacity in comparison to the sandy layer and red soil layer. As the temperature increased, the VG model parameters for the different soil layers, including θ s , α , n and m, exhibited a substantial decrease. Furthermore, the parameter values for the distinct textures exhibited varying degrees of temperature sensitivity; the detritus layer varied greatly. The impact of the temperature varied among the three soil layers, with the detritus layer exhibiting the most obvious alteration in pore characteristics. The unsaturated hydraulic conductivity of all three soil layers increased with an increase in temperature, and the increase was more visible in the detritus layer. Furthermore, at the same temperature, the unsaturated water conductivity of the detritus layer was higher than that of the red soil and sandy soil layers. This indicated that the soil water movement was closely related to the temperature and the texture of the soil. In this study, temperature was found to have a significant effect on the hydraulic properties of the soil, and the water entered the Benggang more quickly at higher temperatures. This is one of the main reasons leading to the collapse of the Benggang. To better comprehend the process of the destabilization of collapsing gully wall soil, additional research is required to monitor the water-temperature change process of the collapsing gully wall soil and to clarify the seepage process of the soil during rainfall at high temperatures in the summer.

Supplementary Materials

The following supporting information can be downloaded at https://www.mdpi.com/article/10.3390/w16020238/s1, Table S1: Results of the calibration curve of domestic double-circle quantitative filter paper at 25 °C, 40 °C.

Author Contributions

Conceptualization, Y.Y. and Y.Z.; methodology, Y.Y. and L.Y.; software, Y.Y. and D.Z.; validation, Y.Y., L.Y. and D.Z.; formal analysis, Y.Y. and L.Y.; investigation, Y.Y. and Y.G.; resources, Y.Z. and Y.H.; data curation, Y.Y. and D.Z.; writing—original draft preparation, Y.Y.; writing—review and editing, Y.Z. and Y.Y.; supervision, J.L., F.J. and Y.H.; project administration, Y.Z.; funding acquisition, Y.H. and Y.Z. All authors have read and agreed to the published version of the manuscript.

Funding

Financial support for this study was provided by the National Natural Science Foundation of China (No. 41907043); the Natural Science Foundation of Fujian Province (No. 2021J01119); and the Water Conservancy Science and Technology Project of Fujian Province (No. KJG21009A). The funder: Yanhe Huang and Yue Zhang.

Data Availability Statement

The data presented in this study are available on request from the corresponding author.

Conflicts of Interest

The authors declare no conflicts of interest.

References

  1. Jiang, F.-S.; Huang, Y.-H.; Wang, M.-K.; Lin, J.-S.; Zhao, G.; Ge, H.-L. Effects of rainfall intensity and slope gradient on steep colluvial deposit erosion in southeast China. Soil Sci. Soc. Am. J. 2014, 78, 1741–1752. [Google Scholar] [CrossRef]
  2. Wei, Y.; Liu, Z.; Wu, X.; Zhang, Y.; Cui, T.; Cai, C.; Guo, Z.; Wang, J.; Cheng, D. Can Benggang be regarded as gully erosion? Catena 2021, 207, 105648. [Google Scholar] [CrossRef]
  3. Xia, J.; Cai, C.; Wei, Y.; Wu, X. Granite residual soil properties in collapsing gullies of South China: Spatial variations and effects on collapsing gully erosion. Catena 2019, 174, 469–477. [Google Scholar] [CrossRef]
  4. Li, C.; Kong, L.; Shu, R.; An, R.; Zhang, X. Disintegration characteristics in granite residual soil and their relationship with the collapsing gully in South China. Open Geosci. 2020, 12, 1116–1126. [Google Scholar] [CrossRef]
  5. Feng, M.H.; Liao, C.Y.; Li, S.X.; Lu, S.L. Investigation on Status of Hill Collapsing and Soil Erosion in Southern China. Yangtze River 2009, 40, 66–68+75, (In Chinese with English Abstract). [Google Scholar]
  6. Deng, Y.; Duan, X.; Ding, S.; Cai, C.; Chen, J. Suction stress characteristics in granite red soils and their relationship with the collapsing gully in South China. Catena 2018, 171, 505–522. [Google Scholar] [CrossRef]
  7. Deng, Y.-S.; Xia, D.; Cai, C.-F.; Ding, S.-W. Effects of land uses on soil physic-chemical properties and erodibility in collapsing-gully alluvial fan of Anxi County, China. J. Integr. Agric. 2016, 15, 1863–1873. [Google Scholar] [CrossRef]
  8. Duan, X.; Deng, Y.; Tao, Y.; He, Y.; Lin, L.; Chen, J. The soil configuration on granite residuals affects Benggang erosion by altering the soil water regime on the slope. Int. Soil Water Conserv. Res. 2021, 9, 419–432. [Google Scholar] [CrossRef]
  9. Wang, H.; Zou, J.; Wu, W.; Ni, W. Assessing unsaturated permeability of loess under multiple rainfalls. Eng. Geol. 2023, 324, 107280. [Google Scholar] [CrossRef]
  10. Rahimi, A.; Rahardjo, H.; Leong, E.C. Effects of soil–water characteristic curve and relative permeability equations on estimation of unsaturated permeability function. Soils Found. 2015, 55, 1400–1411. [Google Scholar] [CrossRef]
  11. Zhang, C.; Lu, N. Unified Effective Stress Equation for Soil. J. Eng. Mech. 2020, 146, 04019135. [Google Scholar] [CrossRef]
  12. Lu, N.; Dong, Y. Validating a unified effective stress equation for soil. J. Geotech. Geoenviron. 2022, 148, 02822001. [Google Scholar] [CrossRef]
  13. Kelishadi, H.; Mosaddeghi, M.; Ayoubi, S.; Mamedov, A. Effect of temperature on soil structural stability as characterized by high energy moisture characteristic method. Catena 2018, 170, 290–304. [Google Scholar] [CrossRef]
  14. Shao, M.A.; Wang, Q.J.; Huang, M.B. Soil Physics; Higher Education Press: Beijing, China, 2006. [Google Scholar]
  15. Hopmans, J.W.; Dane, J.H. Effect of Temperature-dependent Hydraulic Properties on Soil Water Movement. Soil Sci. Soc. Am. J. 1985, 49, 51–58. [Google Scholar] [CrossRef]
  16. Hopmans, J.W.; Dane, J.H. Temperature Dependence of Soil Hydraulic Properties. Soil Sci. Soc. Am. J. 1986, 50, 4–9. [Google Scholar] [CrossRef]
  17. Hopmans, J.; Dane, J.H. Temperature Dependence of Soil Water Retention Curves. Soil Sci. Soc. Am. J. 1986, 50, 562–567. [Google Scholar] [CrossRef]
  18. Pham, T.A.; Hashemi, A.; Sutman, M.; Medero, G.M. Effect of temperature on the soil–water retention characteristics in unsaturated soils: Analytical and experimental approaches. Soils Found. 2023, 63, 101301. [Google Scholar] [CrossRef]
  19. Pham, T.; Sutman, M. Modeling the combined effect of initial density and temperature on the soi1 water characteristic curve of unsaturated soils. Acta Geotech. 2023, 18, 6427–6455. [Google Scholar] [CrossRef]
  20. Philip, J.R. Theory of Infiltration. Adv. Hydrosci. 1969, 5, 215–296. [Google Scholar]
  21. De Vires, D.A. Chapter 7: Thermal Properties of Soils. Physics of Plant Environment; van Wijk, W.R., Ed.; Wiley: New York, NY, USA, 1963; pp. 210–235. [Google Scholar]
  22. Zhang, L.; Sun, S.; Lin, M.; Feng, K.; Zhang, Y.; Lin, J.; Ge, H.; Huang, Y.; Jiang, F. Study on soil-water characteristic curves in the profiles of collapsing walls of typical granite Benggang in southeast China. PeerJ 2022, 10, e13526. [Google Scholar] [CrossRef]
  23. Ye, W.-M.; Wan, M.; Chen, B.; Chen, Y.-G.; Cui, Y.-J.; Wang, J. Effect of temperature on soil-water characteristics and hysteresis of compacted Gaomiaozi bentonite. J. Cent. South Univ. Technol. 2009, 16, 821–826. [Google Scholar] [CrossRef]
  24. Gao, H.B.; Shao, M.A. Effects of temperature changes on soil hydraulic properties. Soil Tillage Res. 2015, 153, 145–154. [Google Scholar] [CrossRef]
  25. Roshani, P.; Sedano, I.Á.J. Incorporating Temperature Effects in Soil-Water Characteristic Curves. Indian Geotech. J. 2016, 46, 1–10. [Google Scholar] [CrossRef]
  26. Gong, Z.T.; Lei, W.J.; Chen, Z.C.; Gao, Y.X.; Zeng, S.G.; Zhang, G.L.; Xiao, D.N.; Li, S.G. Chinese soil taxonomy. BCAS 2007, 21, 36–38. [Google Scholar]
  27. SL/T 237-1999; Test Methods of Soils. China Water and Power Press: Beijing, China, 1999. (In Chinese)
  28. Hu, W.; Shao, M.; Wang, Q.; Li, Y. Effects of sampling size on measurements of soil saturated hydraulic conductivity. Acta Pedol. Sin. 2005, 42, 1040–1043, (In Chinese with English Abstract). [Google Scholar]
  29. ASTM Standard D 5298-94. Standard test method for measurement of soil potential (suction) using filter paper. Annu Book ASTM Stand. 1997, 4, 1312–1316. [Google Scholar]
  30. Bulut, R.; Wray, W.K. Free energy of water suction in filter papers. Geotech. Test. J. 2005, 28, 355–364. [Google Scholar]
  31. Qin, W.J.; Fan, G.S. Estimating parameters for the Van Genuchten model from soil physical-chemical properties of undisturbed loess-soil. Earth Sci. Inform. 2021, 14, 1563–1570. [Google Scholar] [CrossRef]
  32. Van Genuchten, M.T.; Leij, F.J.; Yates, S.R. The RETC Code for Quantifying the Hydraulic Functions of Unsaturated Soils; Robert, S.K., Ed.; Environmental Research Laboratory, Office of Research and Development, U.S. Environmental Protection Agency: Washington, DC, USA, 1992; pp. 9–21.
  33. Van Genuchten, M.T. A Closed-form Equation for Predicting the Hydraulic Conductivity of Unsaturated Soils. Soil Sci. Soil Sci. Soc. Am. J. 1980, 44, 892–898. [Google Scholar] [CrossRef]
  34. Mcqueen, I.S.; Miller, R.F. Approximating soil moisture characteristics from limited data: Empirical evidence and tentative model. Water Resour. Res. 1974, 10, 521–527. [Google Scholar] [CrossRef]
  35. Deng, Y.; Ding, S.; Cai, C. Characteristic Curves and Model Analysis of Soil Moisture in Collapse Mound Profiles in Southeast Hubei. Acta Pedol. Sin. 2016, 53, 355–364, (In Chinese with English Abstract). [Google Scholar]
  36. Xia, D.; Deng, Y.; Wang, S.; Ding, S.; Cai, C. Fractal features of soil particle-size distribution of different weathering profiles of the collapsing gullies in the hilly granitic region, southern China. Nat. Hazards 2015, 79, 455–478. [Google Scholar] [CrossRef]
  37. Schneider, M.; Goss, K.U. Temperature dependence of the water retention curve for dry soils. Water Resour. Res. 2011, 47, 1–5. [Google Scholar] [CrossRef]
  38. Grant, S.A.; Bachmann, J. Effect of Temperature on Capillary Pressure. Geophysical Monograph; American Geophysical Union: Washington, DC, USA, 2002; pp. 199–212. [Google Scholar]
  39. Luo, L.P.; Wang, H.; Zhu, J.B.; Tan, S.; Hu, C.W.; Chen, X.Y.; Ye, L. Difference Analysis of Temperature Effect on Water Characteristic Curves of Red Soil and Paddy Soil in South China. J. Soil Water Conserv. 2019, 33, 72–78+84. [Google Scholar]
  40. Paaswell, R.E. Temperature effects on clay consolidation. J. Soil Mech. Found. Engrg. Div. ASCE 1967, 93, 9–21. [Google Scholar] [CrossRef]
  41. Guo, Q.E.; Wang, Y.Q.; Che, Z.X.; Nan, L.L.; Cao, S.Y. Effect of Temperature and Degree of Mineralization on the Water-Retention Properties of Soil. J. Irrig Drain 2012, 31, 52–55, (In Chinese with English Abstract). [Google Scholar]
  42. Zhang, Y.; Zhao, D.; Zheng, Q.; Huang, Y.; Jiang, F.; Wang, M.-K.; Lin, J.; Huang, Y. Evaluating the effects of temperature on soil hydraulic and mechanical properties in the collapsing gully areas of south China. Catena 2022, 218, 106549. [Google Scholar] [CrossRef]
Figure 1. Location of the research site.
Water 16 00238 g001
Figure 2. Granite soil profile of a typical Benggang in this study.
Water 16 00238 g002
Figure 3. (a) The calibration curve of domestic double-circle quantitative filter paper at 25 °C; (b) the calibration curve of domestic double-circle quantitative filter paper at 40 °C.
Water 16 00238 g003
Figure 4. (a) SWRCs of red soil layer, sandy soil layer and detritus layer at 25 °C; (b) SWRCs of red soil layer, sandy soil layer and detritus layer at 40 °C.
Water 16 00238 g004
Figure 5. (a) SWRCs of red soil layer at 25 and 40 °C; (b) SWRCs of sandy soil layer at 25 and 40 °C; (c) SWRCs of detritus layer at 25 and 40 °C.
Water 16 00238 g005
Figure 6. (a) Percentage distribution of micropores in the red soil layer, sandy soil layer and detritus layer soil at 25 and 40 °C; (b) percentage distribution of effective pores in the red soil layer, sandy soil layer and detritus layer soil at 25 and 40 °C; (c) percentage distribution of macropores in the red soil layer, sandy soil layer and detritus layer soil at 25 and 40 °C. Matric suction >1500 kPa is equivalent to a pore diameter of d < 0.2 μm, i.e., micropores; matric suction 33–1500 kPa is equivalent to a pore diameter of d = 0.2–8.7 μm, i.e., effective pores; and matric suction <33 kPa is equivalent to a pore diameter of d > 8.7 μm, i.e., macropores.
Water 16 00238 g006
Figure 7. (a) The connection between the soil unsaturated hydraulic conductivity and the soil water content of different layers at 25 °C; (b) the connection between the soil unsaturated hydraulic conductivity and the soil water content of the red soil layer at 25 and 40 °C; (c) the connection between the soil unsaturated hydraulic conductivity and the soil water content of the sandy soil layer at 25 and 40 °C; (d) the connection between the soil unsaturated hydraulic conductivity and the soil water content of the detritus layer at 25 and 40 °C.
Water 16 00238 g007
Table 1. Physicochemical properties of the different soil layers in the Benggangs.
Soil LayerspH25 °C Plasticity Index40 °C Plasticity IndexBulk Density
/(g cm−3)
Sand
/%
Silt
/%
Clay
/%
Red soil5.8834.1129.041.4630.0052.8817.12
Sandy soil5.5619.3720.021.5643.7447.298.97
Detritus5.6014.2621.801.5967.7929.472.74
Table 2. The VG model parameters of the different soil layers at varying soil temperatures.
ParametersRed SoilSandy SoilDetritus
25 °C40 °C25 °C40 °C25 °C40 °C
θ s 0.4760.4400.4480.4410.4510.435
θ r 0.0000.0000.0000.0000.0000.000
0.01 α 0.0470.0960.0530.1160.0410.366
n2.3572.2652.5852.3763.0362.423
m0.1510.1170.2260.1580.3410.175
R20.960.980.960.970.900.89
RMSE0.0240.0190.0250.0240.0410.044
Disclaimer/Publisher’s Note: The statements, opinions and data contained in all publications are solely those of the individual author(s) and contributor(s) and not of MDPI and/or the editor(s). MDPI and/or the editor(s) disclaim responsibility for any injury to people or property resulting from any ideas, methods, instructions or products referred to in the content.

