Abstract
This paper aims to predict the internal erosion rate index and critical shear of soils based on the initial physical properties of soils. Regression statistical analyses were employed on sixteen types of clayey soils prepared at different initial dry densities and water contents. The Hole Erosion test was conducted to determine the internal erosion parameters: the erosion rate index and the critical shear. Another set of specimens with the same initial dry unit weight and water content was remolded in the direct shear box and tested using the direct shear test to determine the shear strength parameters (i.e., the cohesion and the angle of internal friction). The various physical properties of soil (initial dry unit weight, initial water content, plastic index, liquid limit, optimum water content, maximum dry density, cohesion, and angle of internal friction) were used to develop models that predict both the erosion rate index and the critical shear. The findings show that the initial physical properties can be used to predict the erosion rate index and the critical shear. The coefficient of determination (R2) was found to be between 0.83 and 0.92 to predict the erosion rate index and between 0.85 and 0.9 to predict the critical shear. The high R2 implies that the models can be used to rate the soil erodibility in advance based on simple laboratory testing instead of time-consuming tests. Additionally, the findings give varied options for prediction depending on the availability of the soil initial physical properties.
1. Introduction
Earth fill dams are built mainly from soil and rock and used for many purposes such as flood prevention, water diversion, recreation, and irrigation [1]. Most of the time, earth fill dams are constructed near urban areas and the consequences of such a type of dam failing are devastating due to the potentially huge loss of lives and properties. Therefore, evaluating soil properties to understand soil behavior is vital and should be given a high priority in order to build a sustainable and safe dam that resists failure. Typically, earth fill dams fail due overtopping, wave erosion, top erosion, and internal erosion due to seepage forces [2].
Failure due to the internal erosion of the soil by seepage forces is the most common type of failure in earth fill dams. It is reported in the literature that around 43% of large embankment dam failures is due to internal erosion, which has occurred either through the embankment and/or the foundation of the dam [3]. Internal erosion of soil can be defined as when the water seeps through the earth fill hydraulic structure, carrying soil particles away from the body of the embankment, foundation or its abutments [4]. This removal of soil particles by seepage forces will form voids which cause rearrangements in the embankment soils that trigger failure [5]. Also, Ke and Takahashi [6] showed that internal erosion results in a decrease in the soil strength due to the change in void ratio. Another study showed that soil erosion can result in changes in moisture content and the seepage forces of water, which can reduce the soil’s shear strength and bearing capacity [7]. As a result, soil can fail in various ways, such as settlement, compressibility, collapsibility, piping, or internal erosion [8,9,10,11]. Several internal erosion mechanisms have been reported in the literature, including suffusion, backward erosion, concentrated erosion, and contact erosion [12]. Suffusion erosion takes place when fine soils are washed away through the opening voids of coarse particles. Backward erosion is due to piping at the exit side of the water and contact erosion occurs at two differently textured interface soil layers, whereas cracks cause concentrated leak erosion.
The primary aim of this study is to establish correlations that can predict the internal erosion indices of soil by employing initial physical properties such as the liquid limit (LL), plastic index (PI), initial water content (W), initial dry density, optimum moisture content, maximum dry unit weight, and shear strength parameters (cohesion and angle of internal friction).
2. Background and Literature Review
Many researchers have analyzed the properties of soils from different regions like Northwest Australia [13], the coastal area near the South China Sea [14], the Mediterranean Sea [15], and the Arabian Gulf [16,17,18,19,20,21,22]. Concurrently, another group of researchers (i.e., [23,24,25,26,27,28]) focused on assessing the factors influencing soil erosion. Most of the studies found in this area of research addressed the effect of physical properties on surface soil erosion. For example, Nearing et al. [23] evaluated the relationship between soil detachment rates, soil aggregate size, flow shear stress, flow stream power, and soil tensile strength. The outcomes of the study showed that tensile strength, mean weight diameter, and flow depth can be used for estimating the detachment rates. Grissinger [24] studied the resistance of selected clay systems to surface erosion. The study showed that, as the temperature of the eroding water increased, the erosion rates increased [24]. Römkens et al. [25] developed a model to relate the properties of surface soil to predict subsoil erodibility. Ostovari et al. [26] developed models to estimate soil surface erodibility with reasonable accuracy. The model’s development was based on regression tree and multiple linear regression. Mallick et al. [27] completed a study to measure the erodibility and its correspondence with soil characteristics. The outcome of the research showed that the erodibility decreases as the silt content decreases, whereas sand exhibited a negative relationship. Tsanis et al. [28] conducted a study to analyze the impact of crop on erosion rates and showed that cropping practices have a direct impact on soil erosion.
There are few investigations in the literature that studied the internal erosion of soil. Barrio et al. [29] concluded that the shear strength and permeability relate well with soil erodibility. Few researchers investigated the behavior and the factors affecting soil internal erosion. It was found that internal erosion is affected by several soil properties such as particle size distribution, water content, compaction, texture of the soil, dispersity, and clay content [30,31]. Briaud [32] states that erosion in coarse-grained soil is controlled by soil particle size and that fine soils depend on the plasticity of the soil. Furthermore, soil erodibility is found to be affected by other factors such as the unit weight, water content, void ratio, plasticity index, soil swell, pH, silt, and clay content, in addition to the mineral composition of the soil [32]. Another study by Wan and Fell [33] stated that the erosion rate is strongly influenced by the degree of compaction, degree of saturation, and the water content of soil. For fine soil, it was found that soil with a higher dry density and with an optimum water content had higher erosion rate indexes and, therefore, had higher erosion resistance. The soil structure interface significantly affected the stability of embankment erosion [34]. Other mechanical properties, such as the stiffness and fabric of the soil, effect the formation of piping or internal erosion channels [35,36,37]. Mainly, studies concluded that there are three major factors affecting the internal erosion stability of embankments: material susceptibility [38], stress levels [39], and hydraulic conditions [40]. The aforementioned investigations have examined the various factors impacting soil internal erosion, yet none have attempted to utilize these factors for quantifying key parameters, such as the erosion rate index and critical shear, based on the initial physical properties.
Several tests found in the literature evaluate the internal erosion of the soil, such as the Hole Erosion Test [33], flume test [41], jet erosion test [42,43,44,45], rotating cylinder test [46], and erosion function apparatus (EFA) test [47,48,49]. Most of these tests are currently in use at a high cost and require a substantial amount of time and extensive preparation. Various researchers have examined the impact of specific soil characteristics on the behavior of internal erosion.
The detection of internal erosion is crucial for the stability of earth fill dams due to the difficulty in identifying at the early stage. Once it is observed, it is too late and failure becomes inevitable. Therefore, early detection should be based on the initial material properties of the soil used in constructing the dam. However, instead of the time consuming and costly laboratory testing, it is possible to investigate the impact of the physical and mechanical characteristics of soils on internal erosion. In order to do so, correlations should be developed to predict internal erosion parameters using the soil physical properties. These correlations can anticipate soil internal erosion behavior in advance, providing a more efficient and cost-effective resolution to the problem.
However, to the best of the authors’ knowledge, no existing studies provide correlations for predicting the internal erosion of soils based on their physical and mechanical properties and quantify the internal erosion parameters. Consequently, evaluating soil internal erosion by experiments remains the sole method for assessing the internal erosion of soil.
3. Experimental Program and Methodology
3.1. Materials
Sixteen different types of soils were selected and the liquid limit and plastic index for each soil were determined in accordance with ASTM D4318 [50]. The compaction properties, mainly the optimum moisture content and the maximum dry unit weight, were determined using the Standard Proctor Density test. The physical properties of the used soils are shown in Table 1.

Table 1.
Physical properties of the tested soil.
3.2. Hole Erosion Test and Sample Preparation
Several tests could be performed to evaluate and simulate the internal erosion phenomena of soils. In this study, The Hole Erosion test (HET) proposed by Wan and Fell [33] was used and adapted to obtain the erosion rate indices, mainly the erosion rate index and critical shear. The Hole Erosion test is the most economical, simple, least time consuming, and most relevant test used to evaluate the internal erosion in laboratories [27]. In this test, the soil specimen is placed between two different heads of water that stimulate the field conditions. The water is allowed to flow throughout the 6 mm hole with a difference in head varies between 500 mm and 1200 mm. The selection of the head value depends on the initiating of erosion. However, the selected head between the inlet and outlet remains constant throughout up to 45 min. If there is no initiation of erosion, the difference in head will be increased. The hydraulic gradient, flow rate at different time, and the diameter of the hole at the end of the test should be measured. The calculation of the erosion rate index and the critical shear are shown in detail in Section 3.3.
It is worth mentioning that the erosion rate index (IHET) and the critical shear are the main parameters obtained from the HET test. The erosion rate index is a value that indicates the resistance of a certain soil to erosion. It varies from less than 2 (rapid erosion), up to greater than 6, which indicates a very slow erosion and thus high resistance, as shown in Table 2.
Table 2.
Qualitative terms for representative erosion rate index [22].
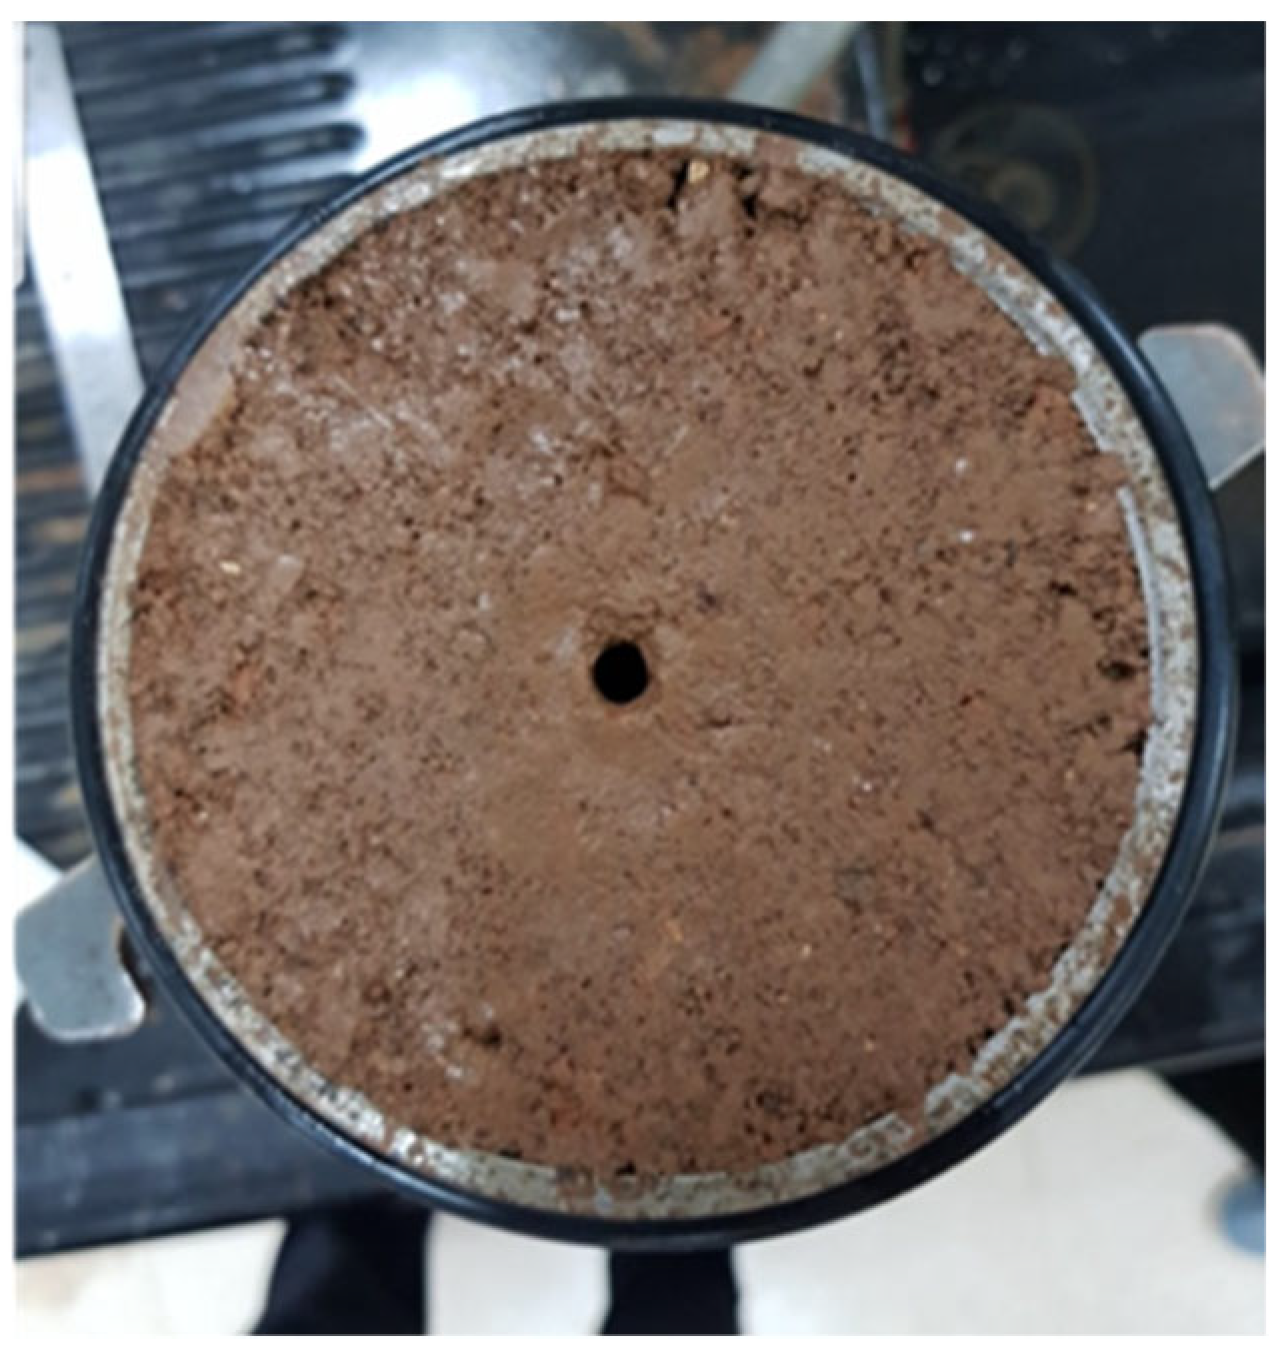
The sixteen selected soils were prepared with a specified initial dry density and initial water content. For some soils, in total, four different dry unit weights were used in this research. Different initial water contents were applied for each dry density. The samples were prepared in a standard Hole Erosion test mold and tested under a specific hydraulic gradient. A 6 mm steel rod was used to drill a hole through the longitudinal direction of the samples, as shown in Figure 1. Table 3 illustrates the test matrix for the selected soils and the results from the Hole Erosion and the direct shear tests.
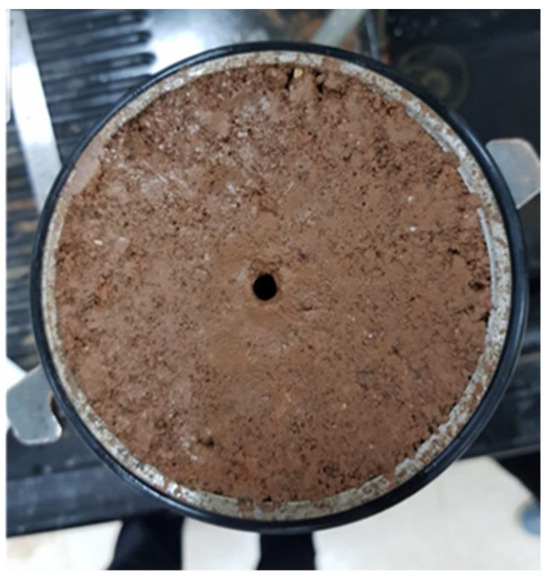
Figure 1.
A prepared sample.
Table 3.
Testing matrix.
The main force applied to simulate the erosion phenomena in this test is hydraulic shear stress. This is generated due to the difference in the total pressure head between the inlet and outlet of the water through the remolded specimen and controlled by the hydraulic head. The Hole Erosion test was conducted on remolded specimens using sixteen types of clay soils with different initial dry densities and water contents. The direct shear test was performed on all specimens prepared with the same initial properties as in the Hole Erosion test to obtain the corresponding value of cohesion and the angle of internal friction. Both the Hole Erosion test and the shear strength parameters were evaluated. The obtained data were analyzed to correlate both physical and mechanical properties to the internal erosion and critical shear. Section 3.3 presents the step-by-step calculation of both the erosion rate index and the critical shear.
3.3. Calculation of the Erosion Rate Index and Critical Shear
In the HET, the erosion rate index can be expressed as follows:
where I represents the erosion rate index and Ce is the coefficient of soil erosion.
I = −Log Ce
A linear correlation between the applied hydraulic shear stress and the rate of erosion is assumed and developed. The correlation can be expressed as follows:
where represents the rate of erosion per unit surface area of the slot at time t (kg/s/m2), Ce depicts the coefficient of soil erosion, reflects the hydraulic shear stress on the surface of the preformed hole at time t (N/m2), and illustrates the critical shear stress (N/m2).
The hydraulic shear stress along the pre-created hole can be obtained with the following equation:
where is the hydraulic shear stress on the surface of the preformed hole at time t (N/m2); is the density of the eroding fluid (kg/m3); g depicts the gravitational acceleration (m/s2); is the hydraulic gradient across the soil sample at time t; and demonstrates the diameter of the pre-created hole, which is assumed to remain circular, at time t (m).
The rate of erosion per unit surface area of the slot at time t is calculated from the following equation:
where stands for the density of the dry soil (kg/m3) and is the diameter of the pipe at any given time t (min), which can be calculated using the following equations:
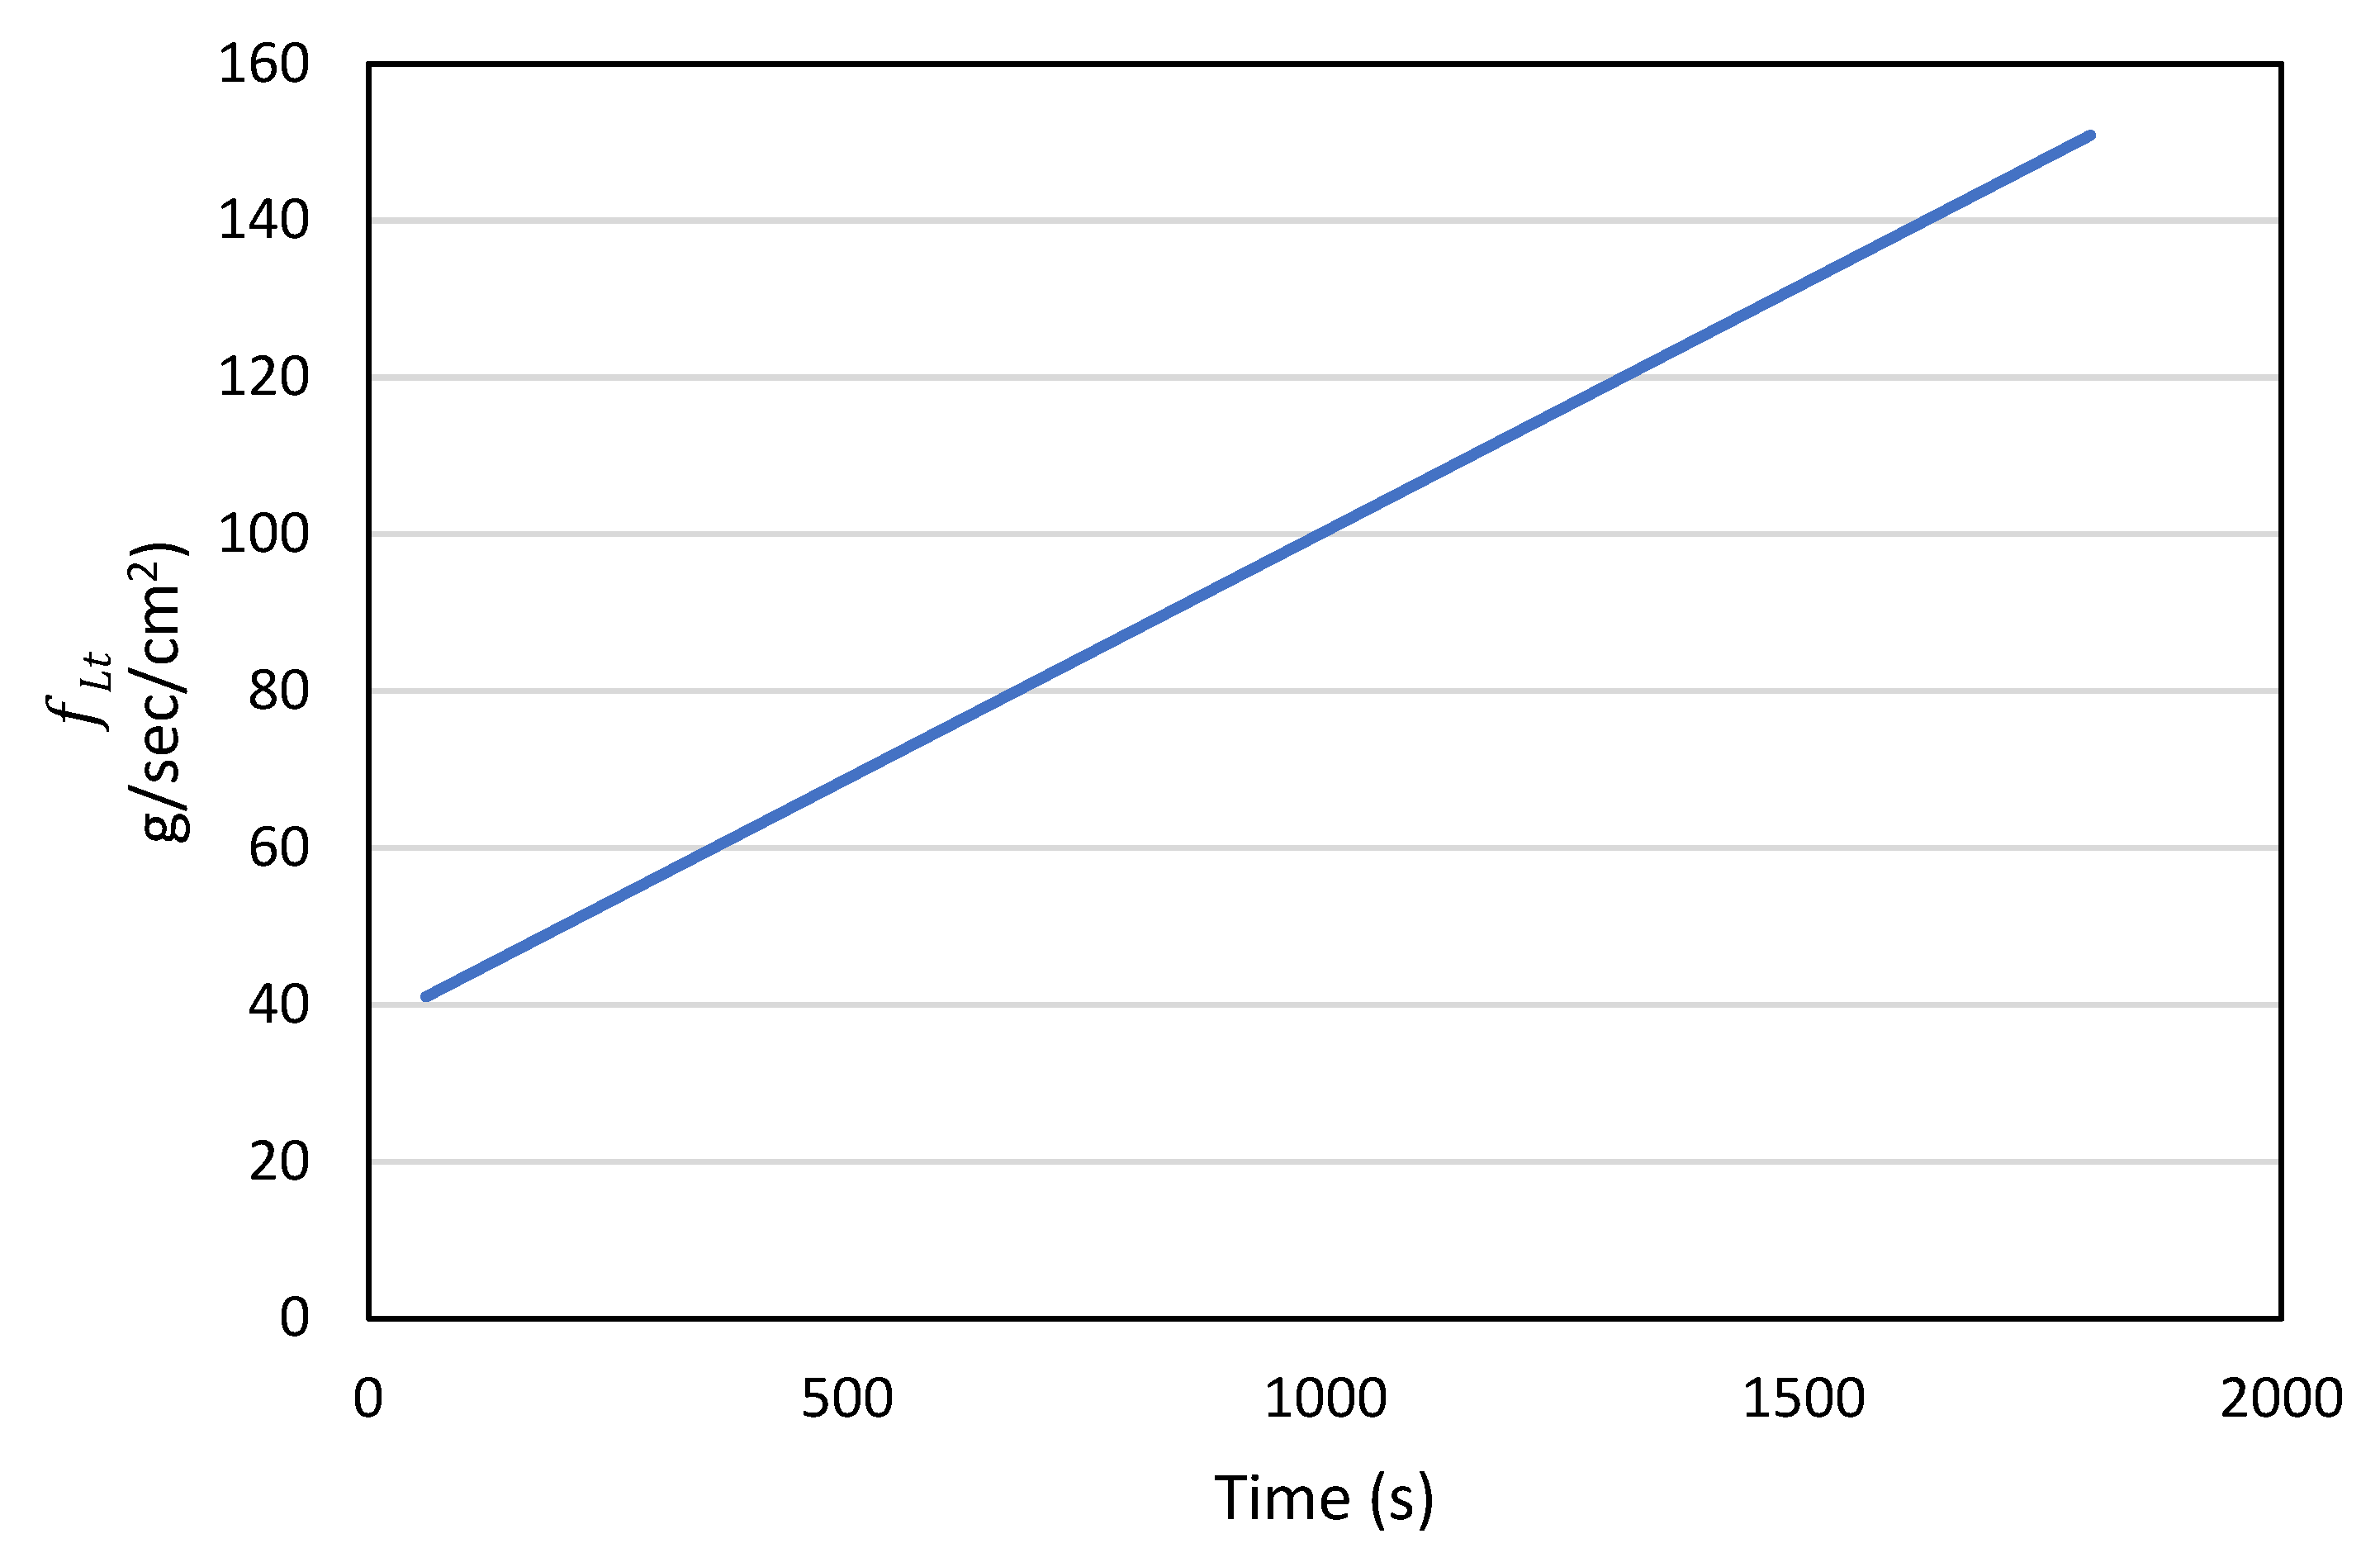
Equation (5) is used for turbulent flow conditions, whereas Equation (6) is used for laminar flow conditions. Qt represents the flow rate at time t (m3/s) and (kg/m3) and (kg/m2/s) are both friction coefficients relating the mean flow velocity to the shear stress. Throughout HET, both the volume and the time required to fill the volume are measured at selected time periods. At the start of the test (t = 0), the diameter of the pipe is known to be 6 mm and is determined directly at the end of the experiment (t = ). Based on the type of flow, Equation (5) or Equation (6) is used to compute the friction factor both at the initiation and at the end of the test. It should be noted that the friction coefficients are assumed to have a linear variation with respect to time throughout the time of the test, as shown in Figure 2. Therefore, , at any time, can be calculated by finding the corresponding from Figure 2 and using Equation (5) or Equation (6).
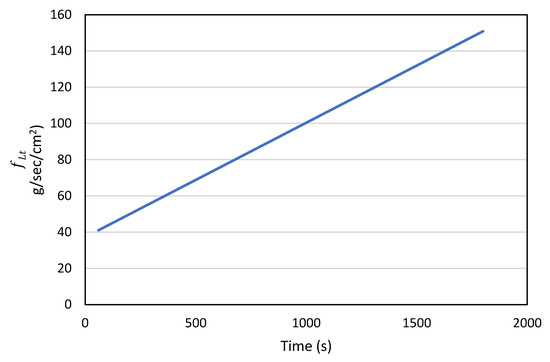
Figure 2.
The relation between friction coefficient (fLt) and time.
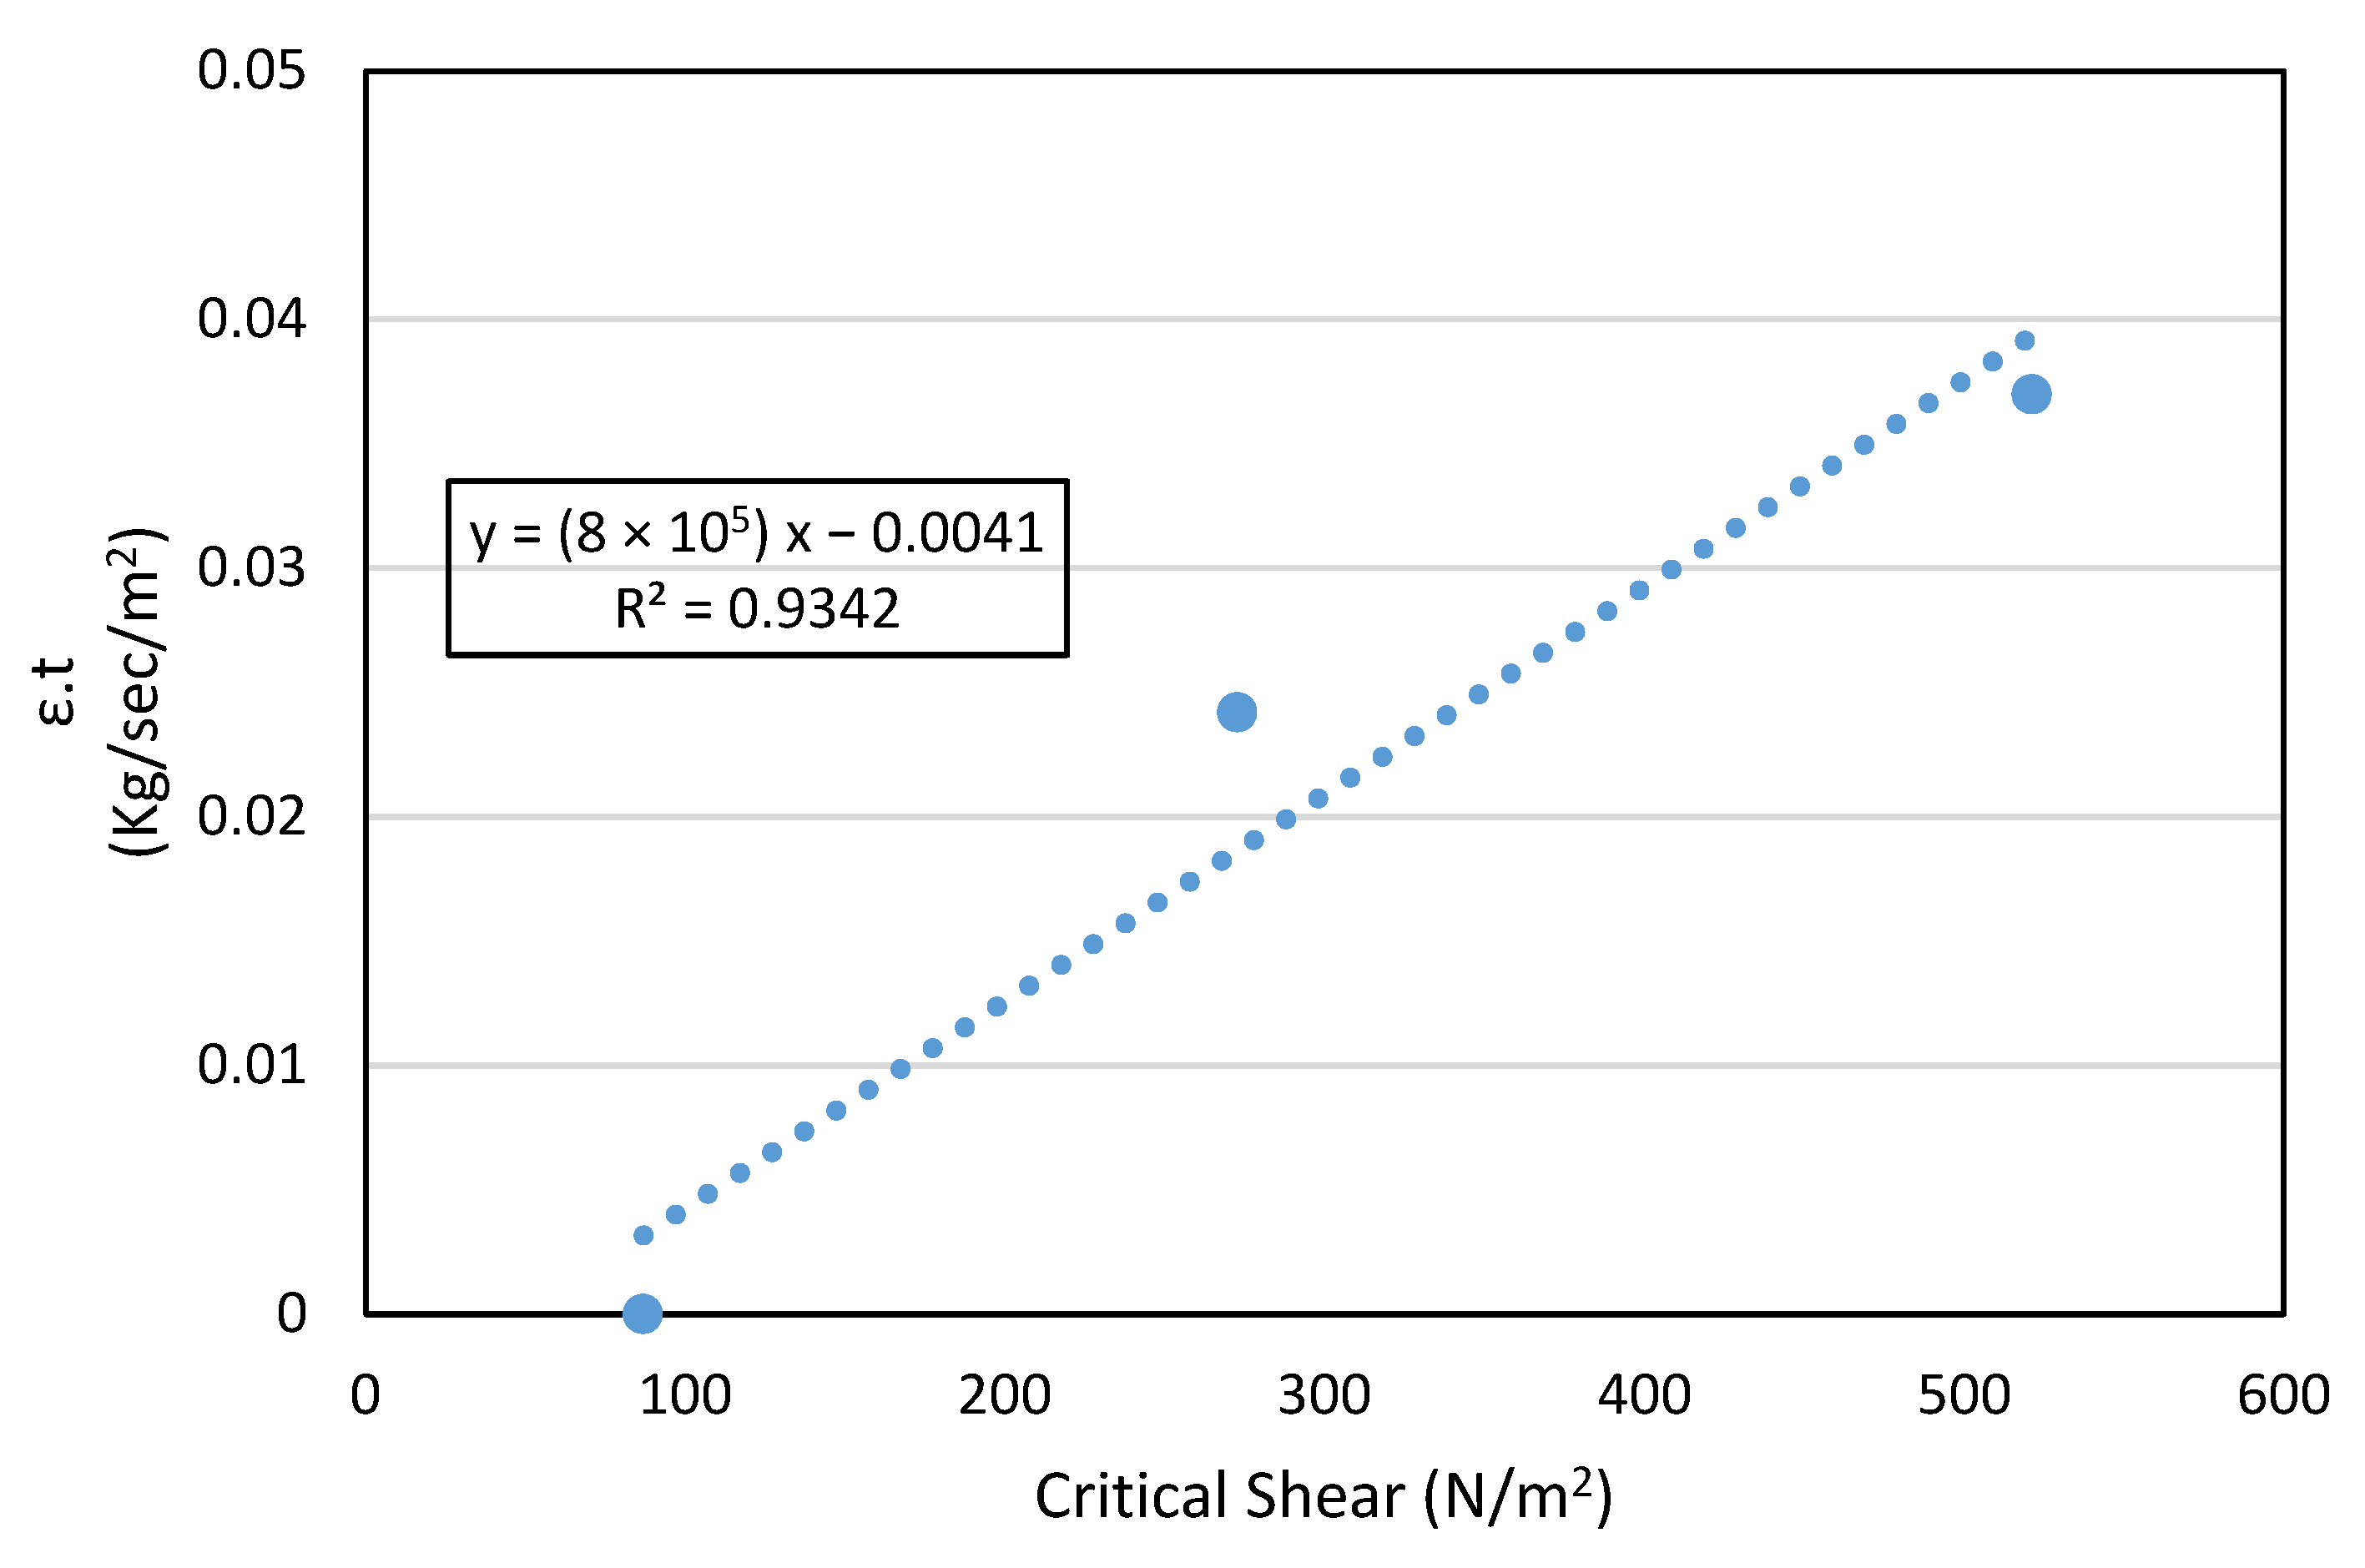
Since and are known, τt and are obtained at each specified time interval using Equations (3) and (4). Afterwards, is plotted with respect to τt. A best-fit line is used to represent the rising section of the graph represented by Equation (2). The value Ce is represented by the slope of the best-fit straight line, as shown in Figure 3.
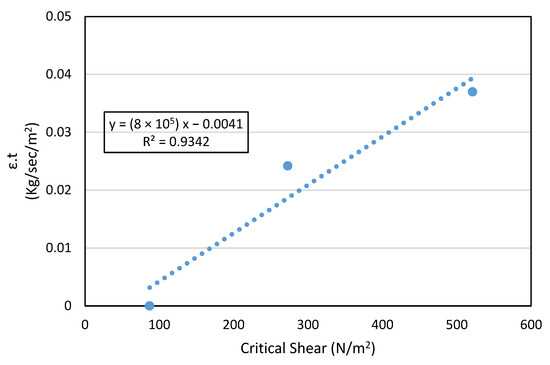
Figure 3.
The relation between erosion per unit surface area at time (t) and the hydraulic shear stress.
4. Results and Discussion
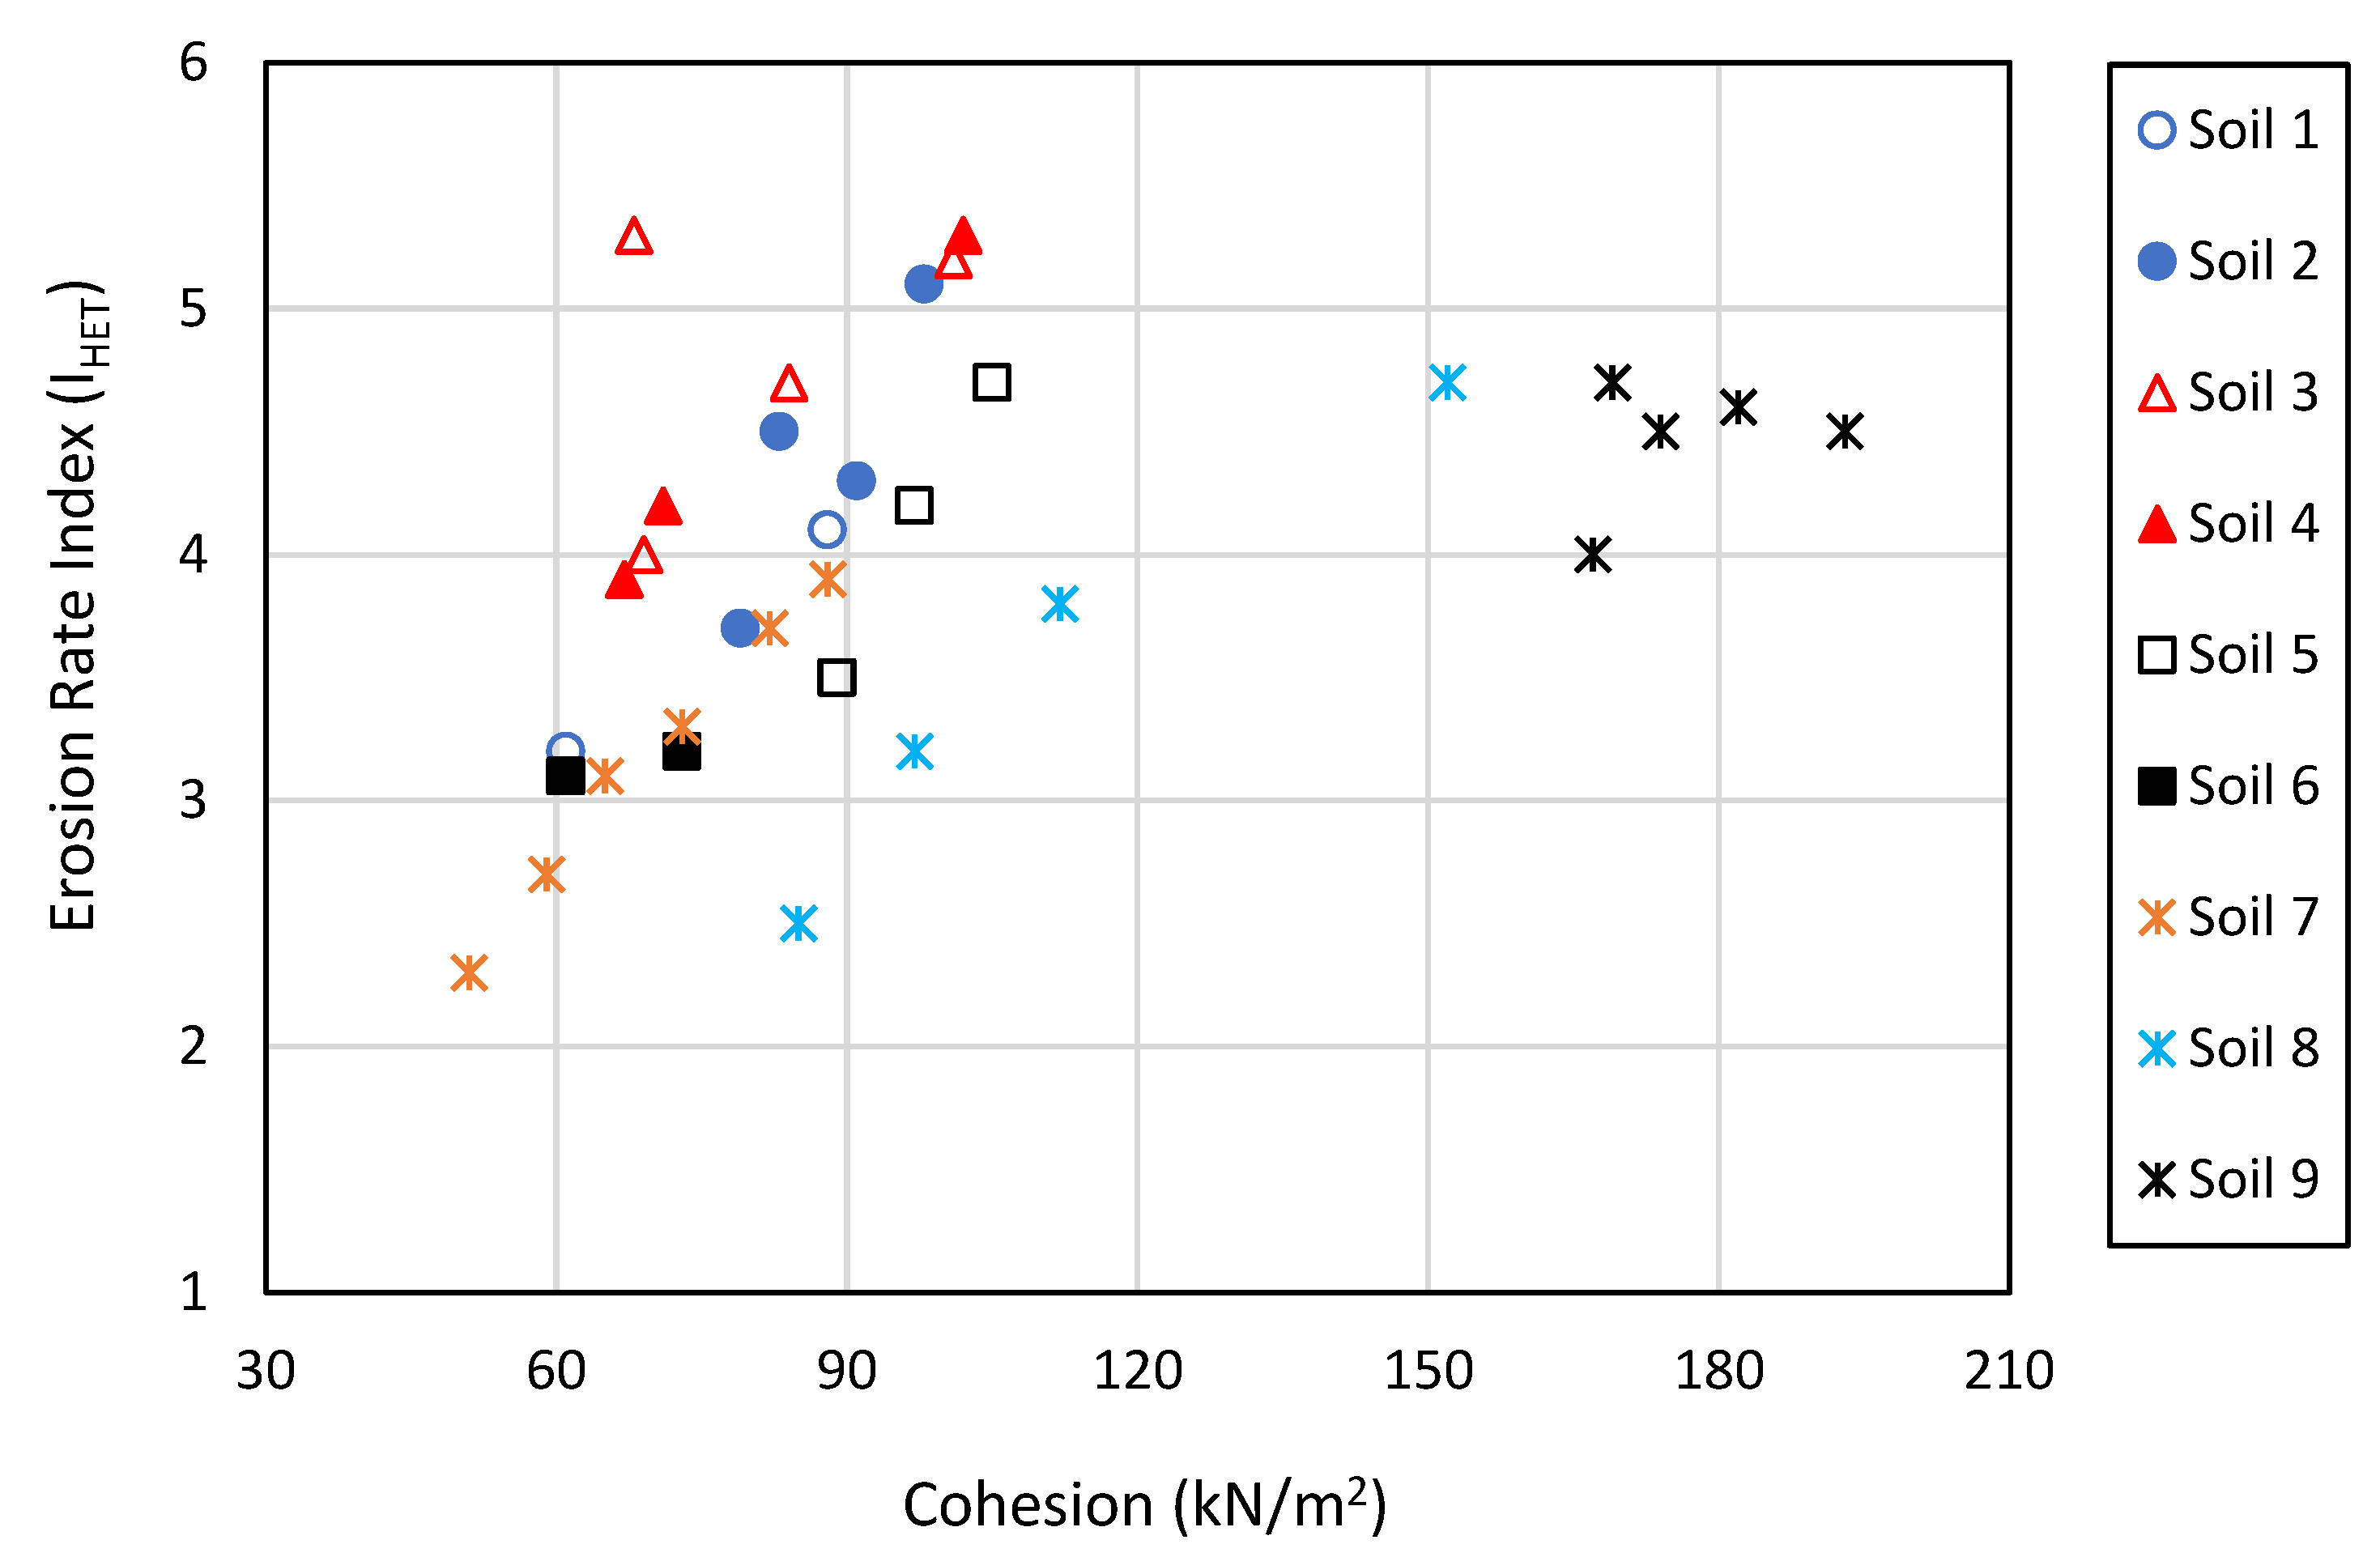
The effect of the mechanical properties, such as cohesion and angle of internal friction, on the internal erosion and the critical shear of the soil were investigated. Figure 4 and Figure 5 show the relationship between the cohesion and the rate of erosion and the critical shear of the soil, respectively. From these two figures, it is clear that an increase in the cohesion will result in an increase in both the erosion rate index and the critical shear of the soil. This was noticed for all the tested soils. The erosion rate index for soil 4 increased from 3.9 to 5.3 when the cohesion increased from 67 kN/m2 to 102 kN/m2 with an increase of about 36%. Additionally, the erosion rate index for soil 8 increased from 2.5 to 4.7 when the cohesion increased from 61 kN/m2 to 152 kN/m2 with an increase of around 88%.

Figure 4.
The effect of cohesion on the internal friction of the soil.
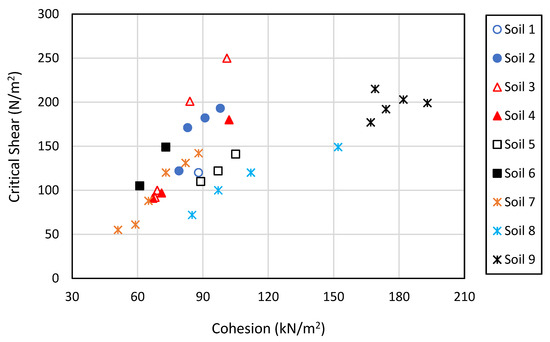
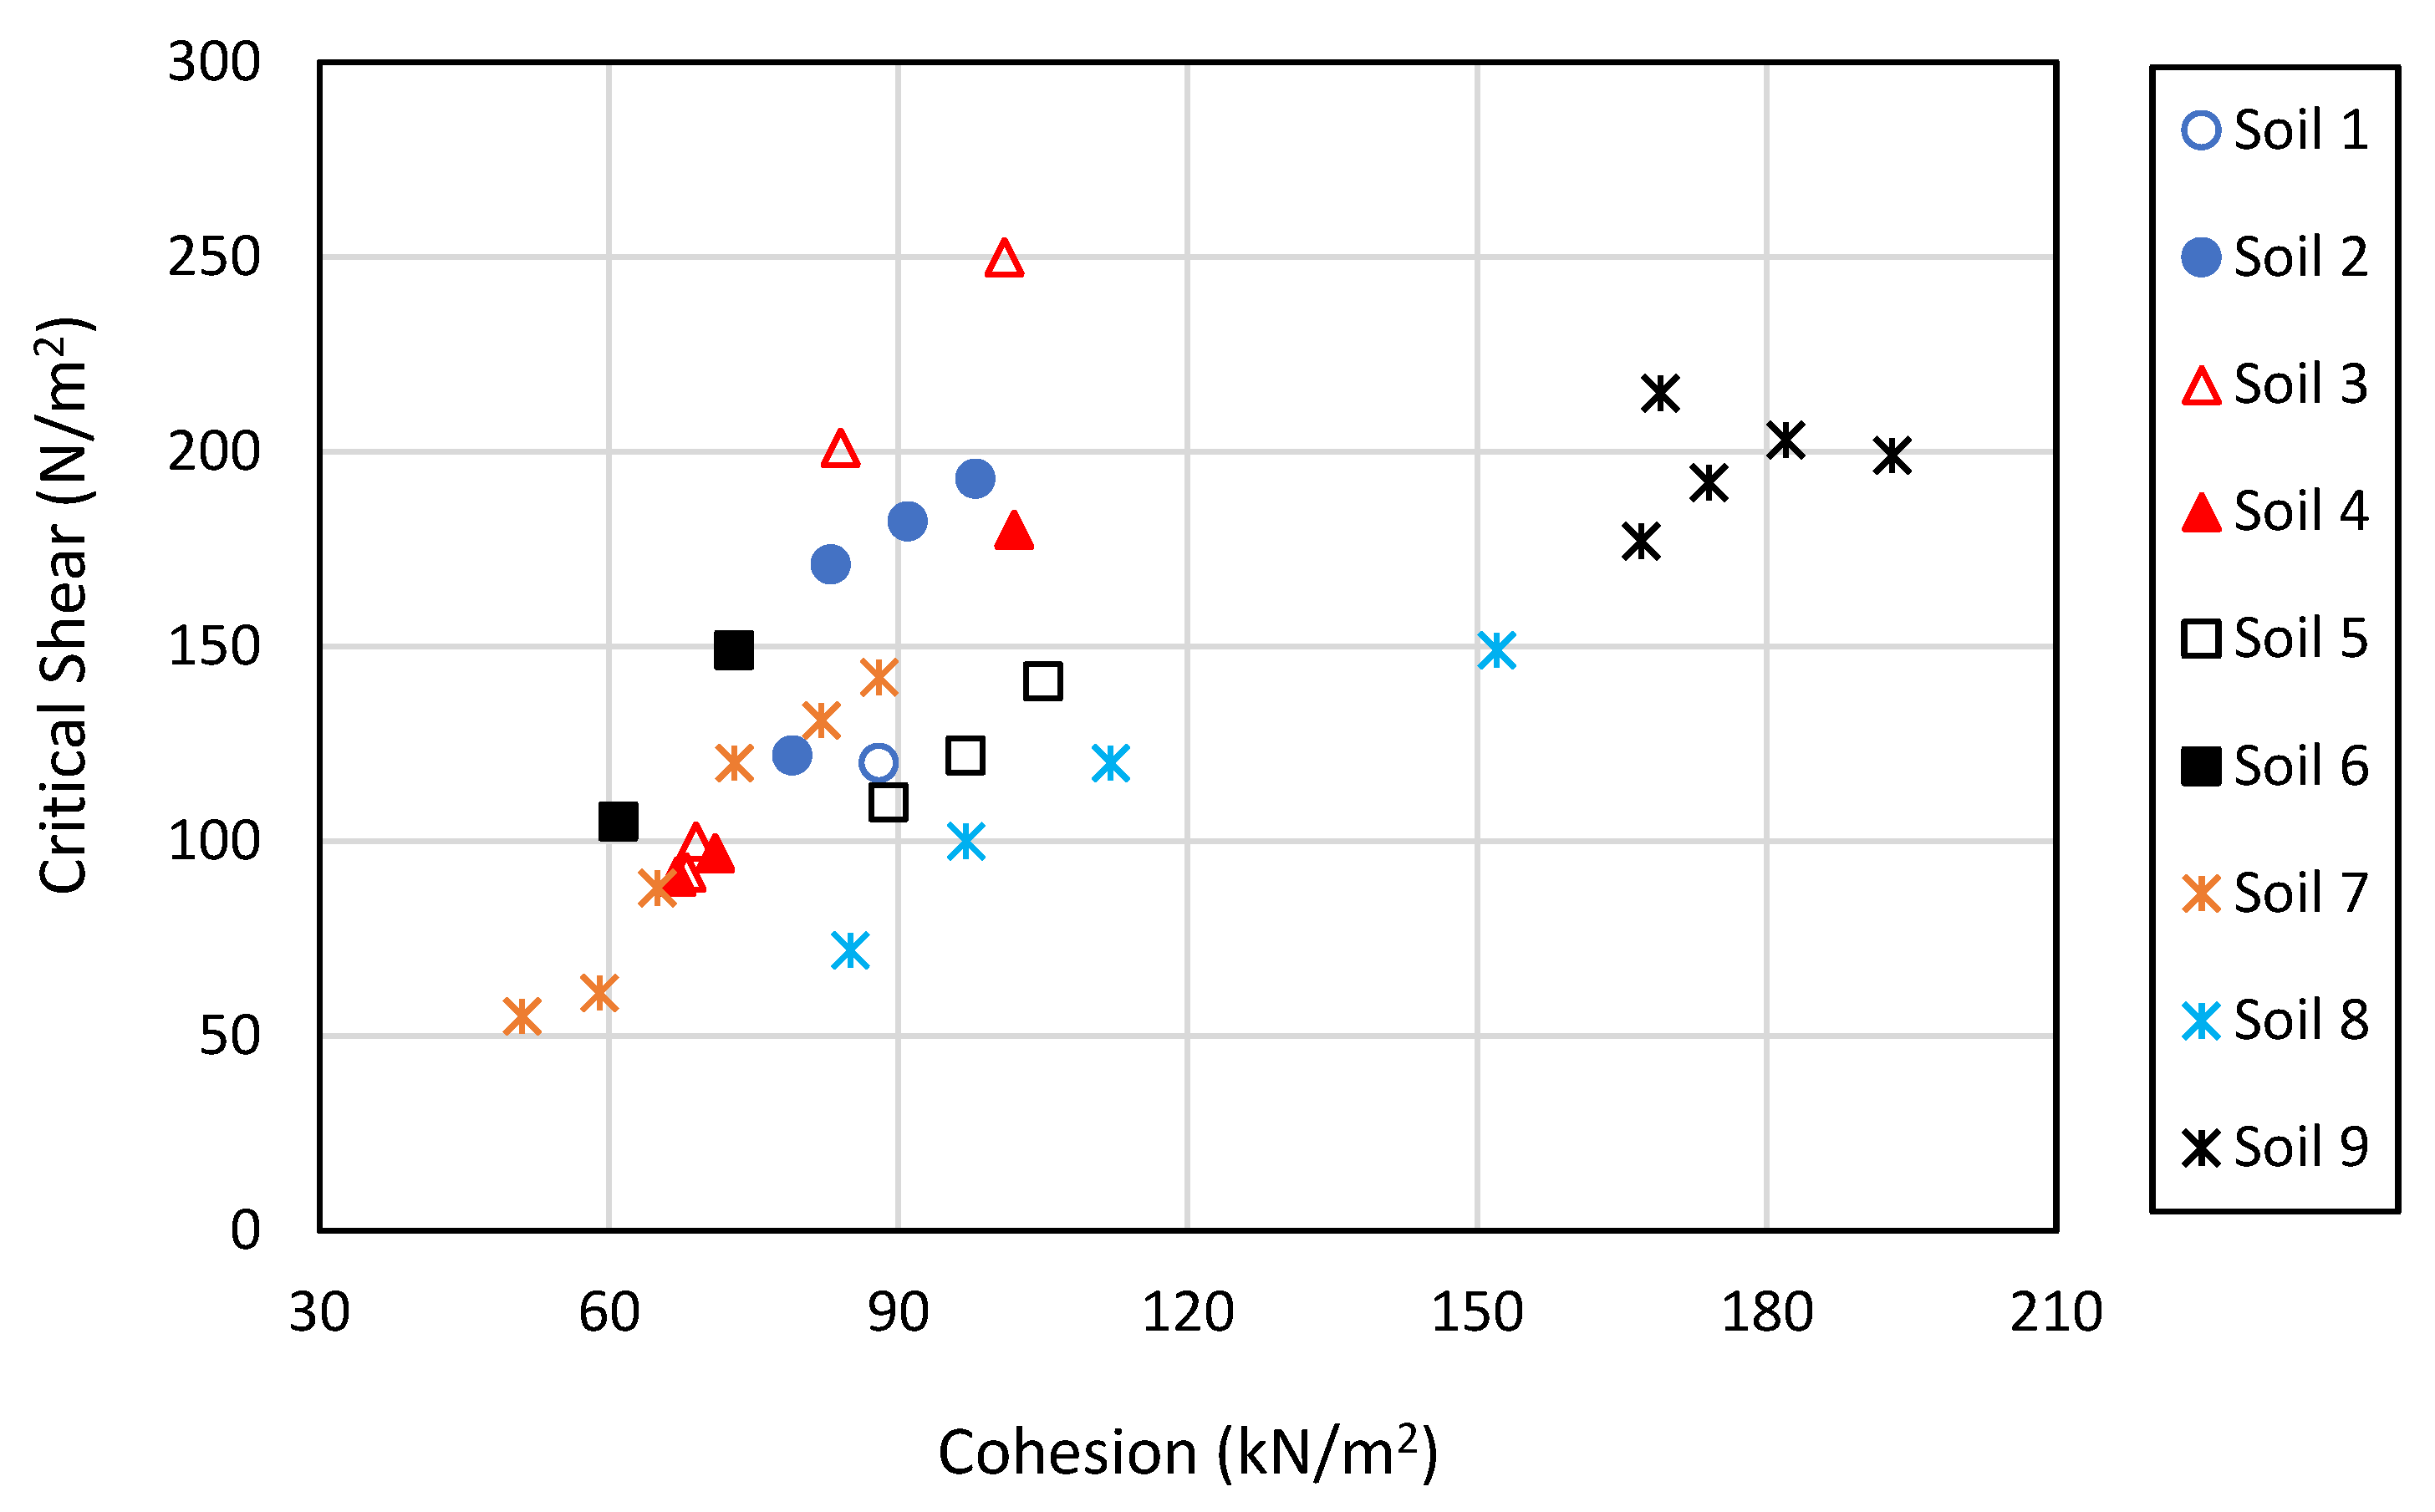
Figure 5.
The effect of cohesion on the critical shear of the soil.
The increases in the erosion rate index and the critical shear due to the increase in the cohesion is attributed to the fact that the soil becomes stronger. The soil with higher cohesion possesses a higher shear strength to resist erodibility. Additionally, cohesive soil (clay) tends to resist the water seepage force more than cohesionless soils.
The effect of cohesion on the critical shear is shown in Figure 5. The increase in the cohesion will increase the critical shear as well. The critical shear increased for soil 6 from 105 kN/m2 to 149 kN/m2 when the cohesion increased from 61 kN/m2 to 73 kN/m2 with an increase of about 42%. However, soil 7 increased about 61% when the cohesion increased from 55 kN/m2 to 88 kN/m2. This trend of increase was observed in all soils with different values.
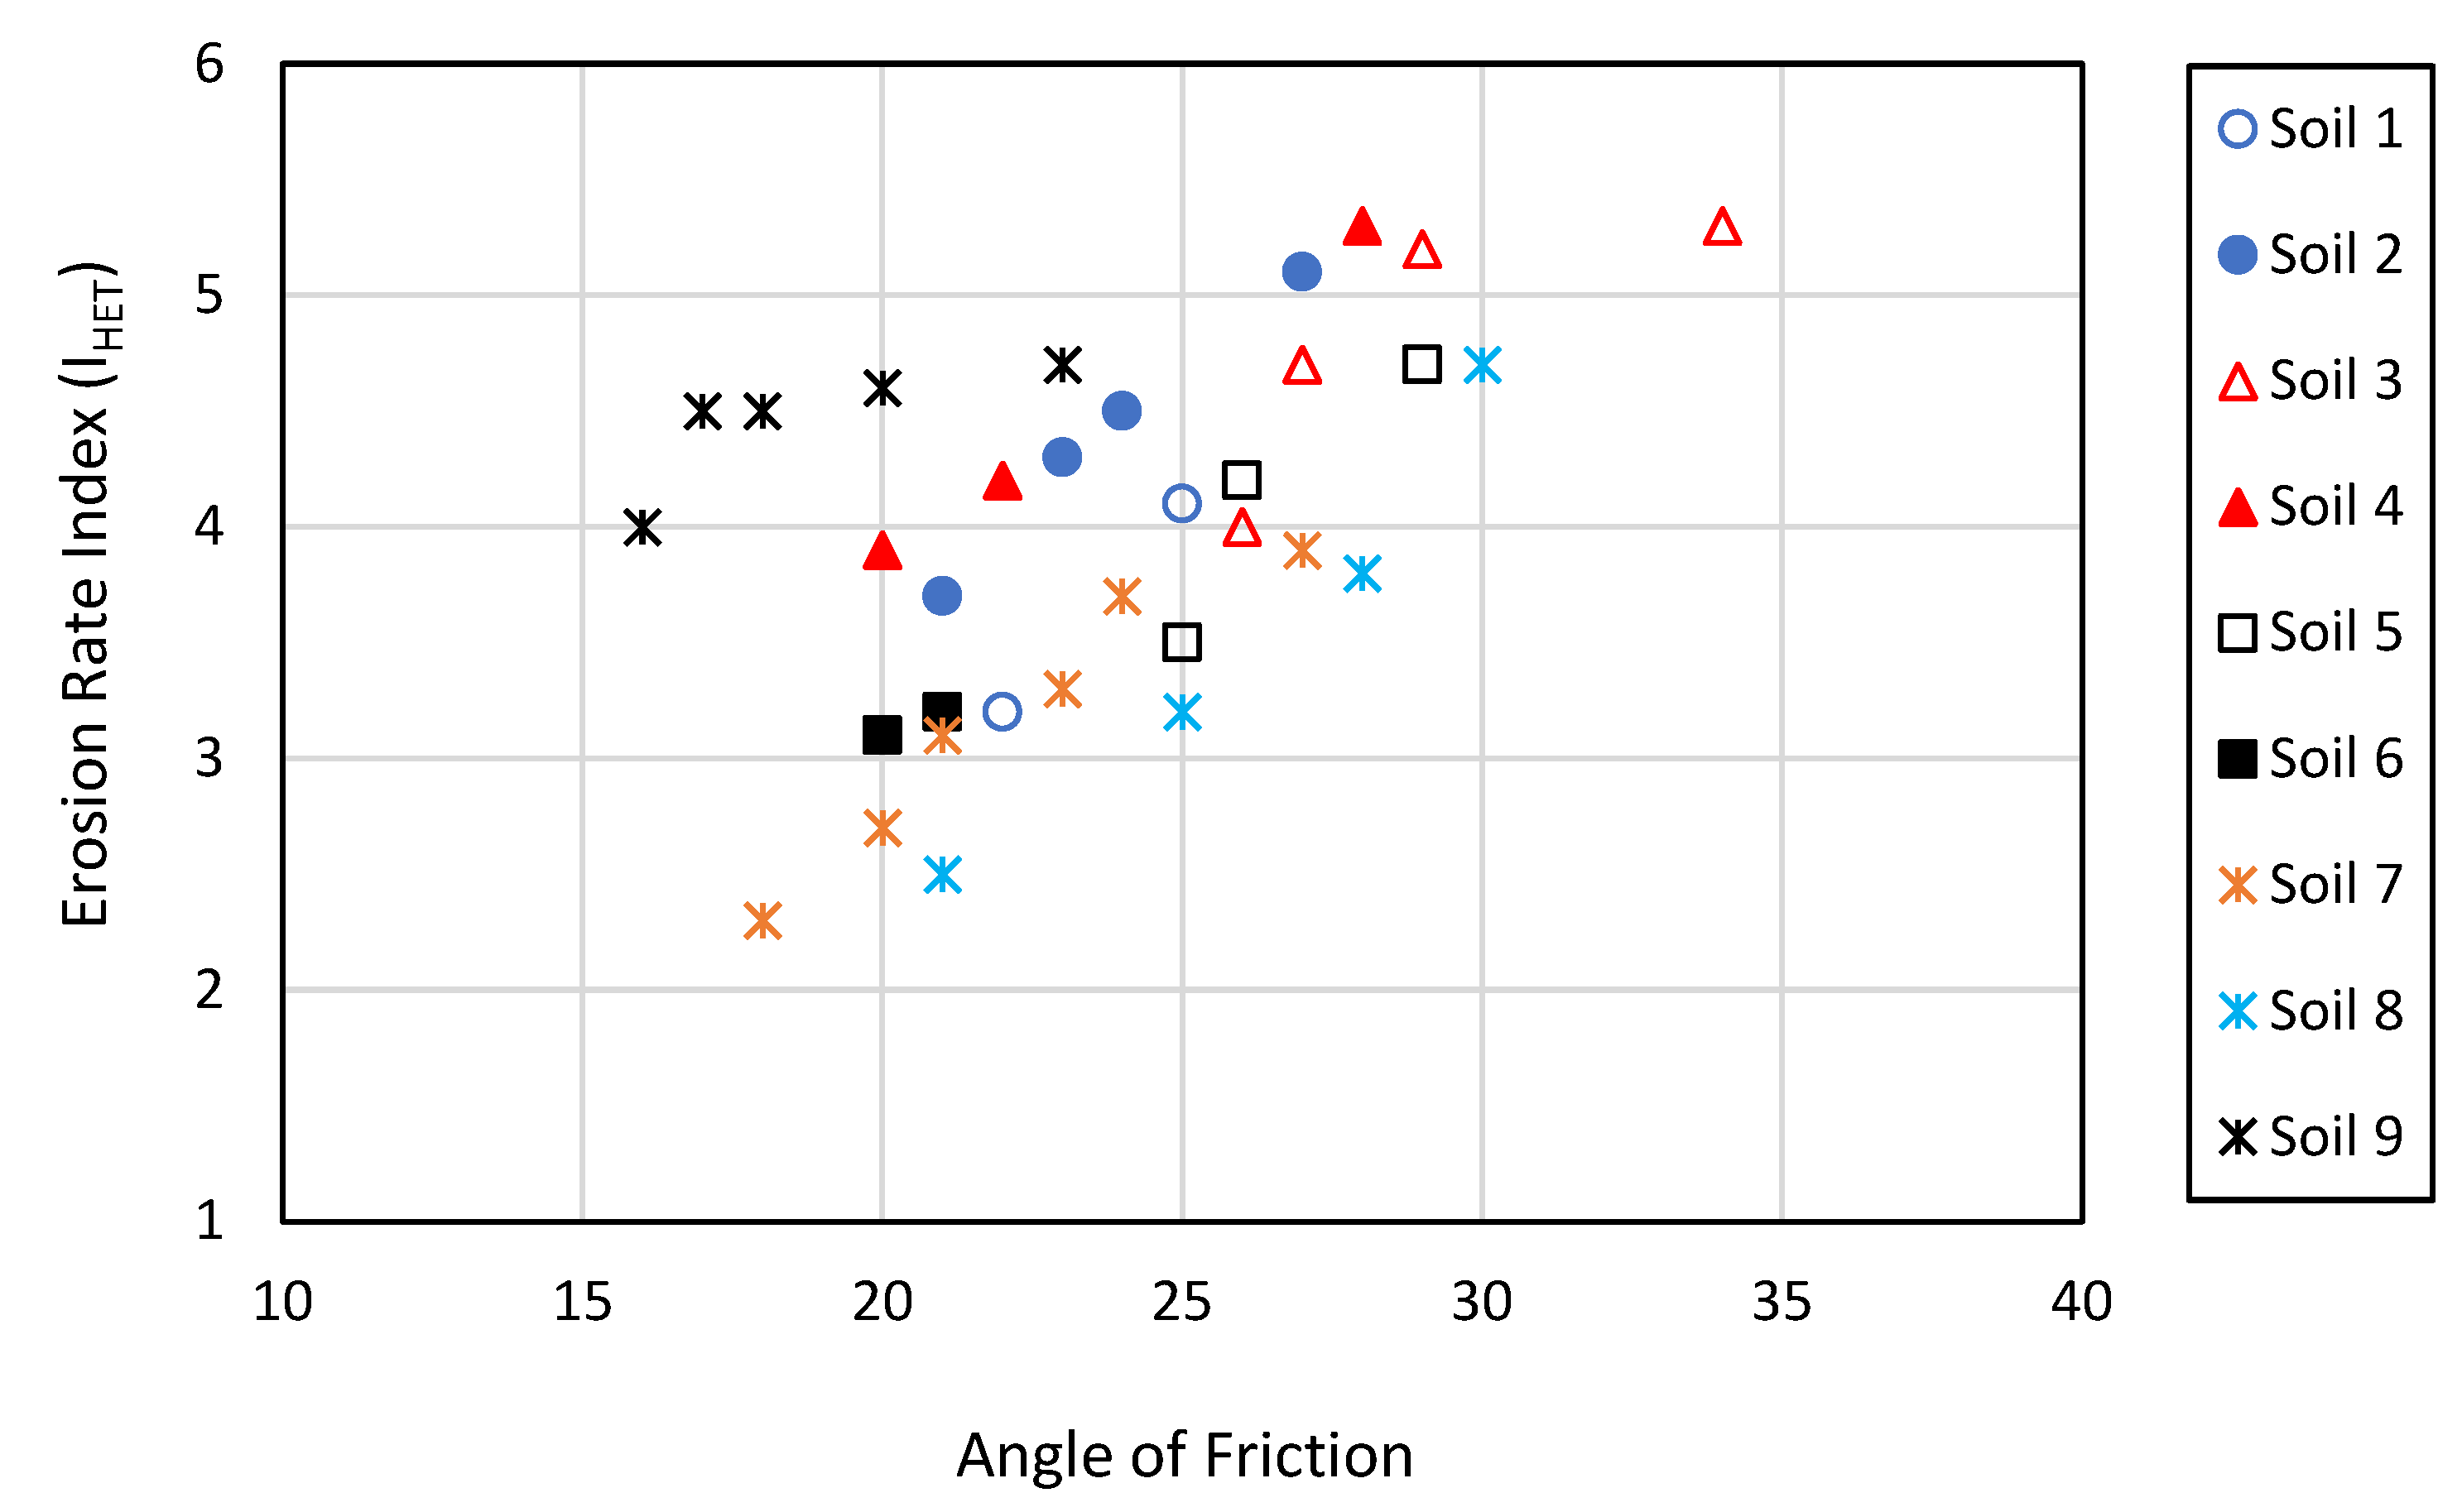
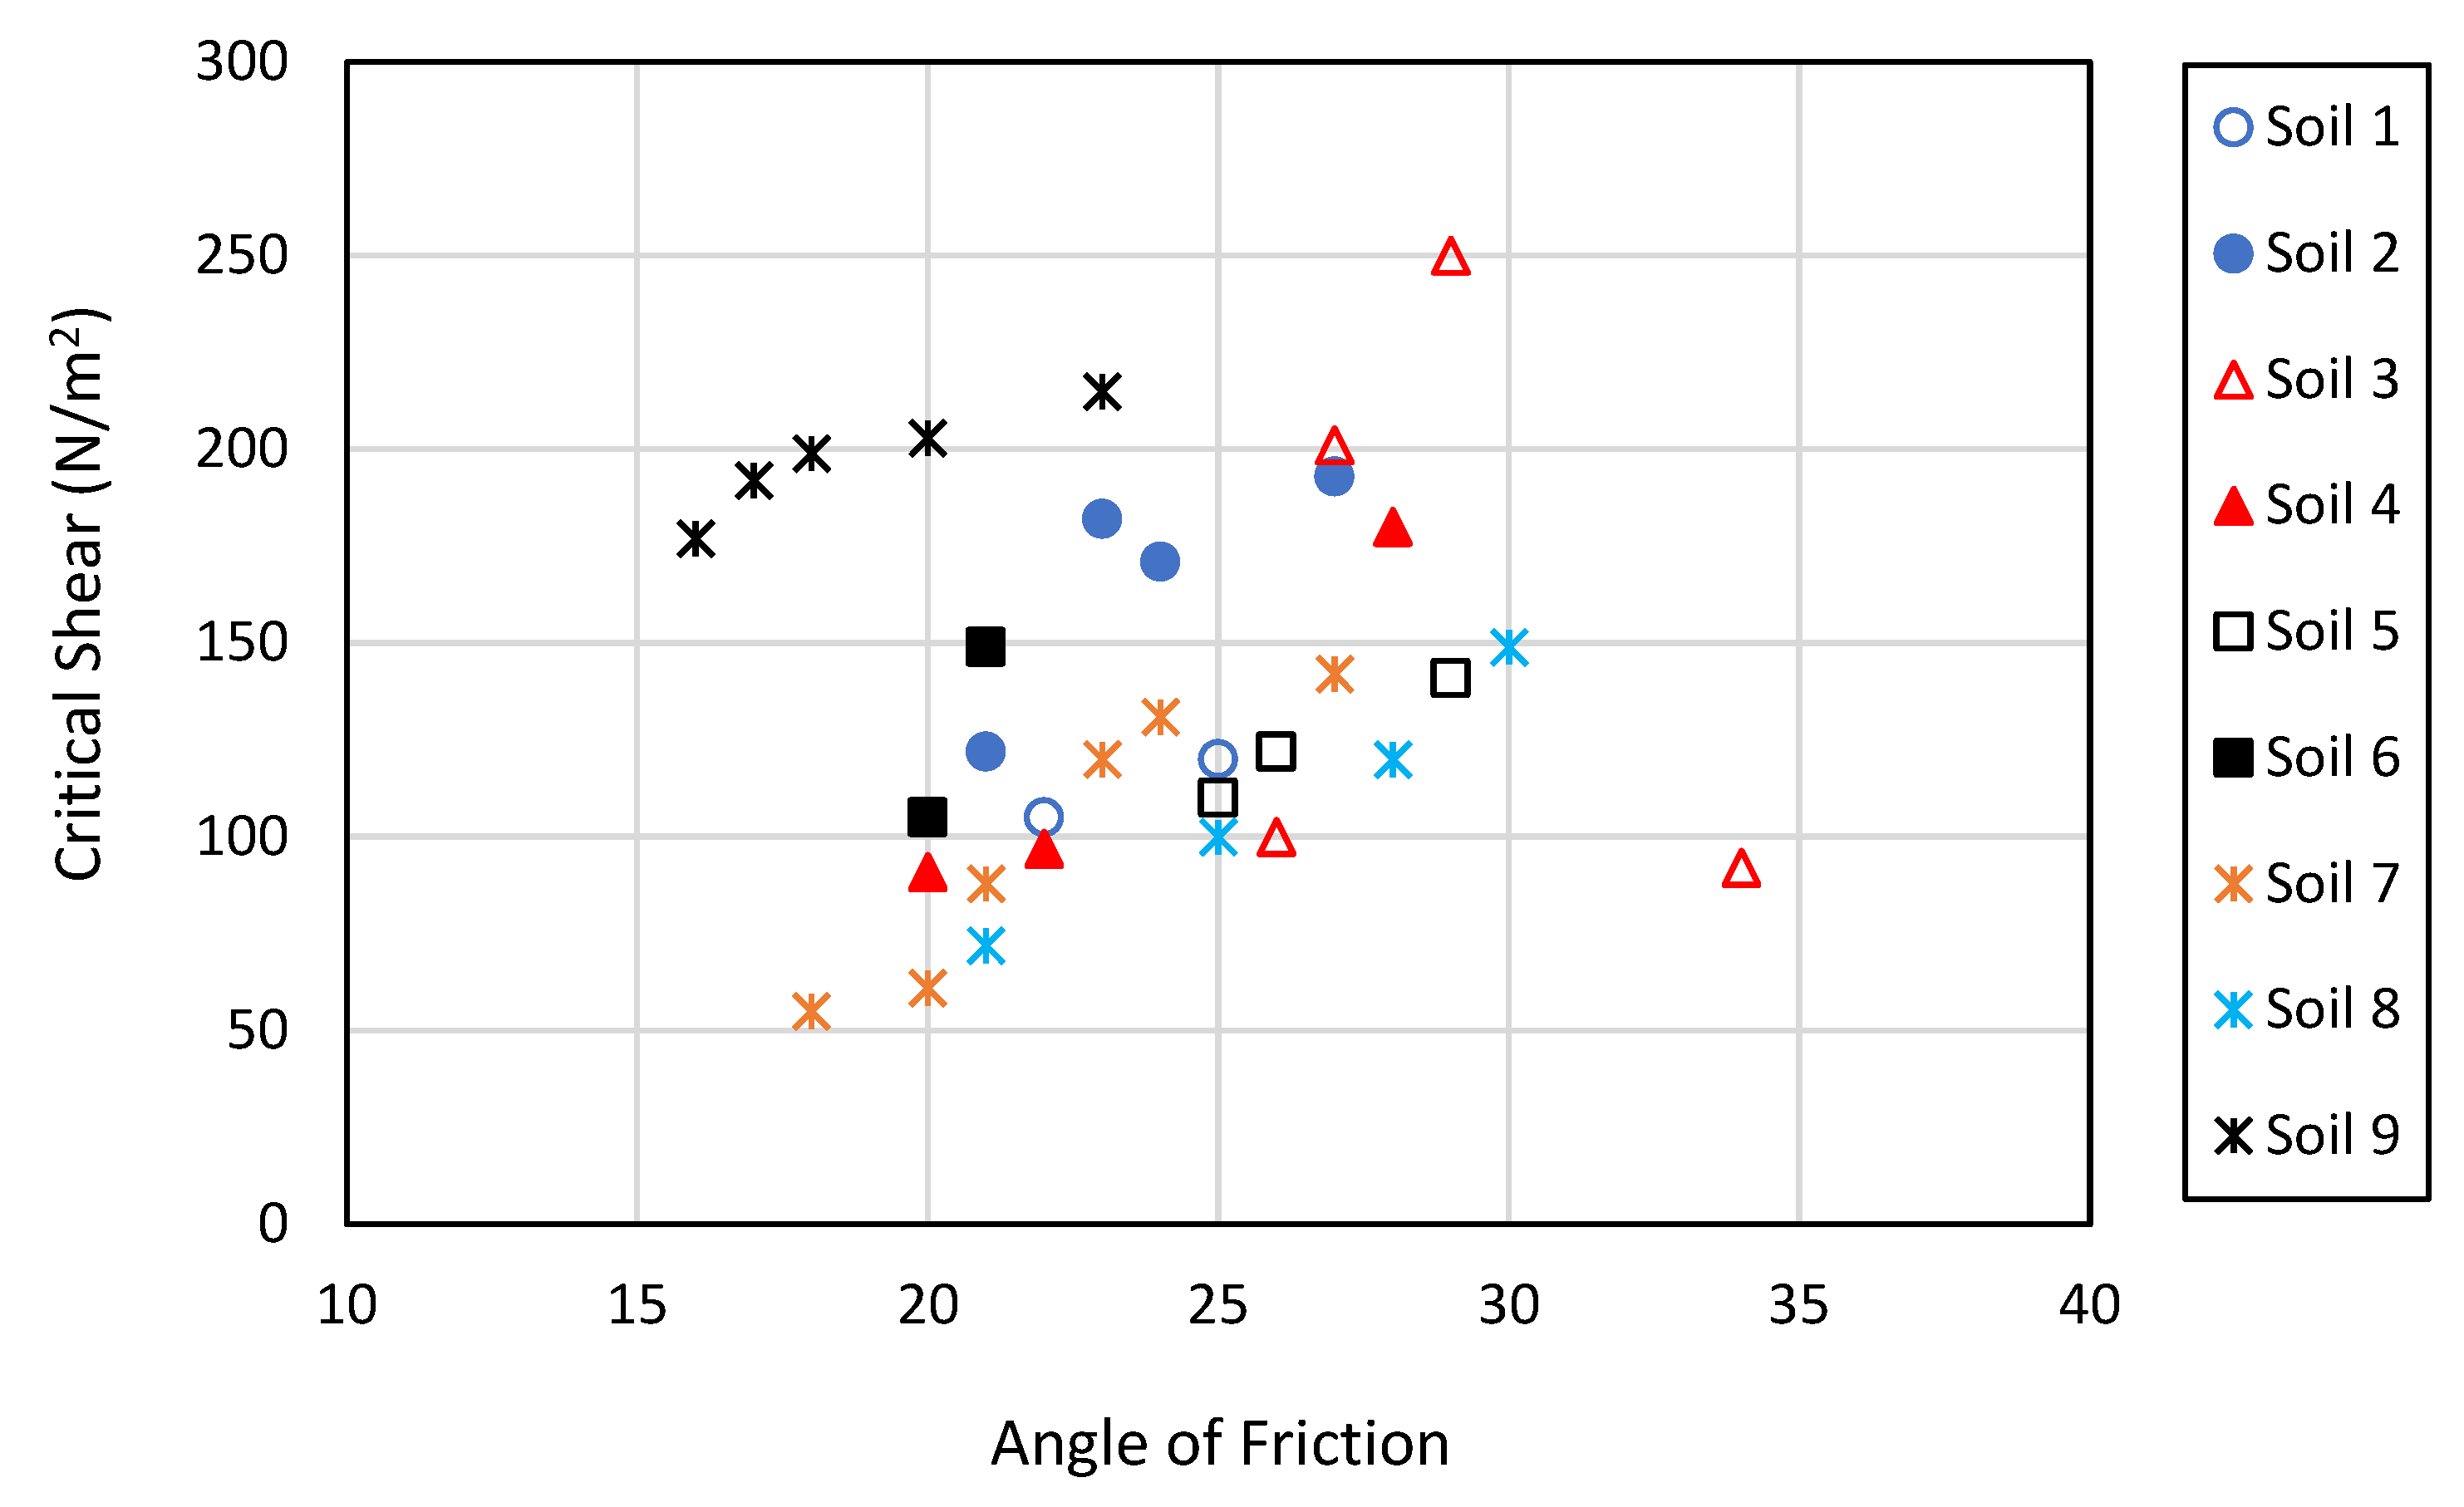
The effect of internal friction on the erosion rate index and critical shear are shown in Figure 6 and Figure 7, respectively. The same trend was noticed as in the cohesion, which implies that the increase in the angle of internal friction will increase both the erosion rate index and the critical shear. Soil 7 shows the highest effect of angle of internal friction on the critical shear of the soil. In Figure 7, the critical shear for soil 2 increased from 122 kN/m2 to 193 kN/m2 when the angle of internal friction increased from 21 to 27 with an increase of around 58%. This is considered a significant effect and indicates that the soil will be more resistant to internal erosion at a higher angle of internal friction. The higher internal friction is an indication of stronger soils which resulted in higher erosion resistance.
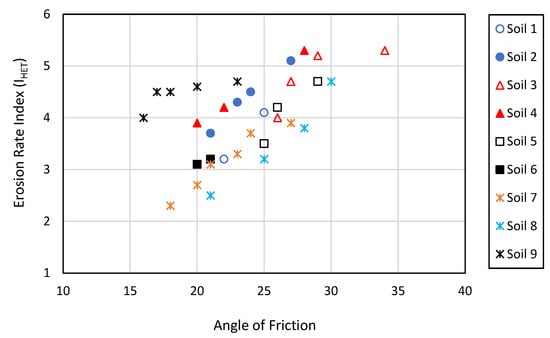
Figure 6.
The effect of angle of internal friction on the erosion rate of the soil.

Figure 7.
The effect of angle of internal friction on the critical shear of the soil.
4.1. Prediction Analysis
4.1.1. Prediction of Internal Erosion
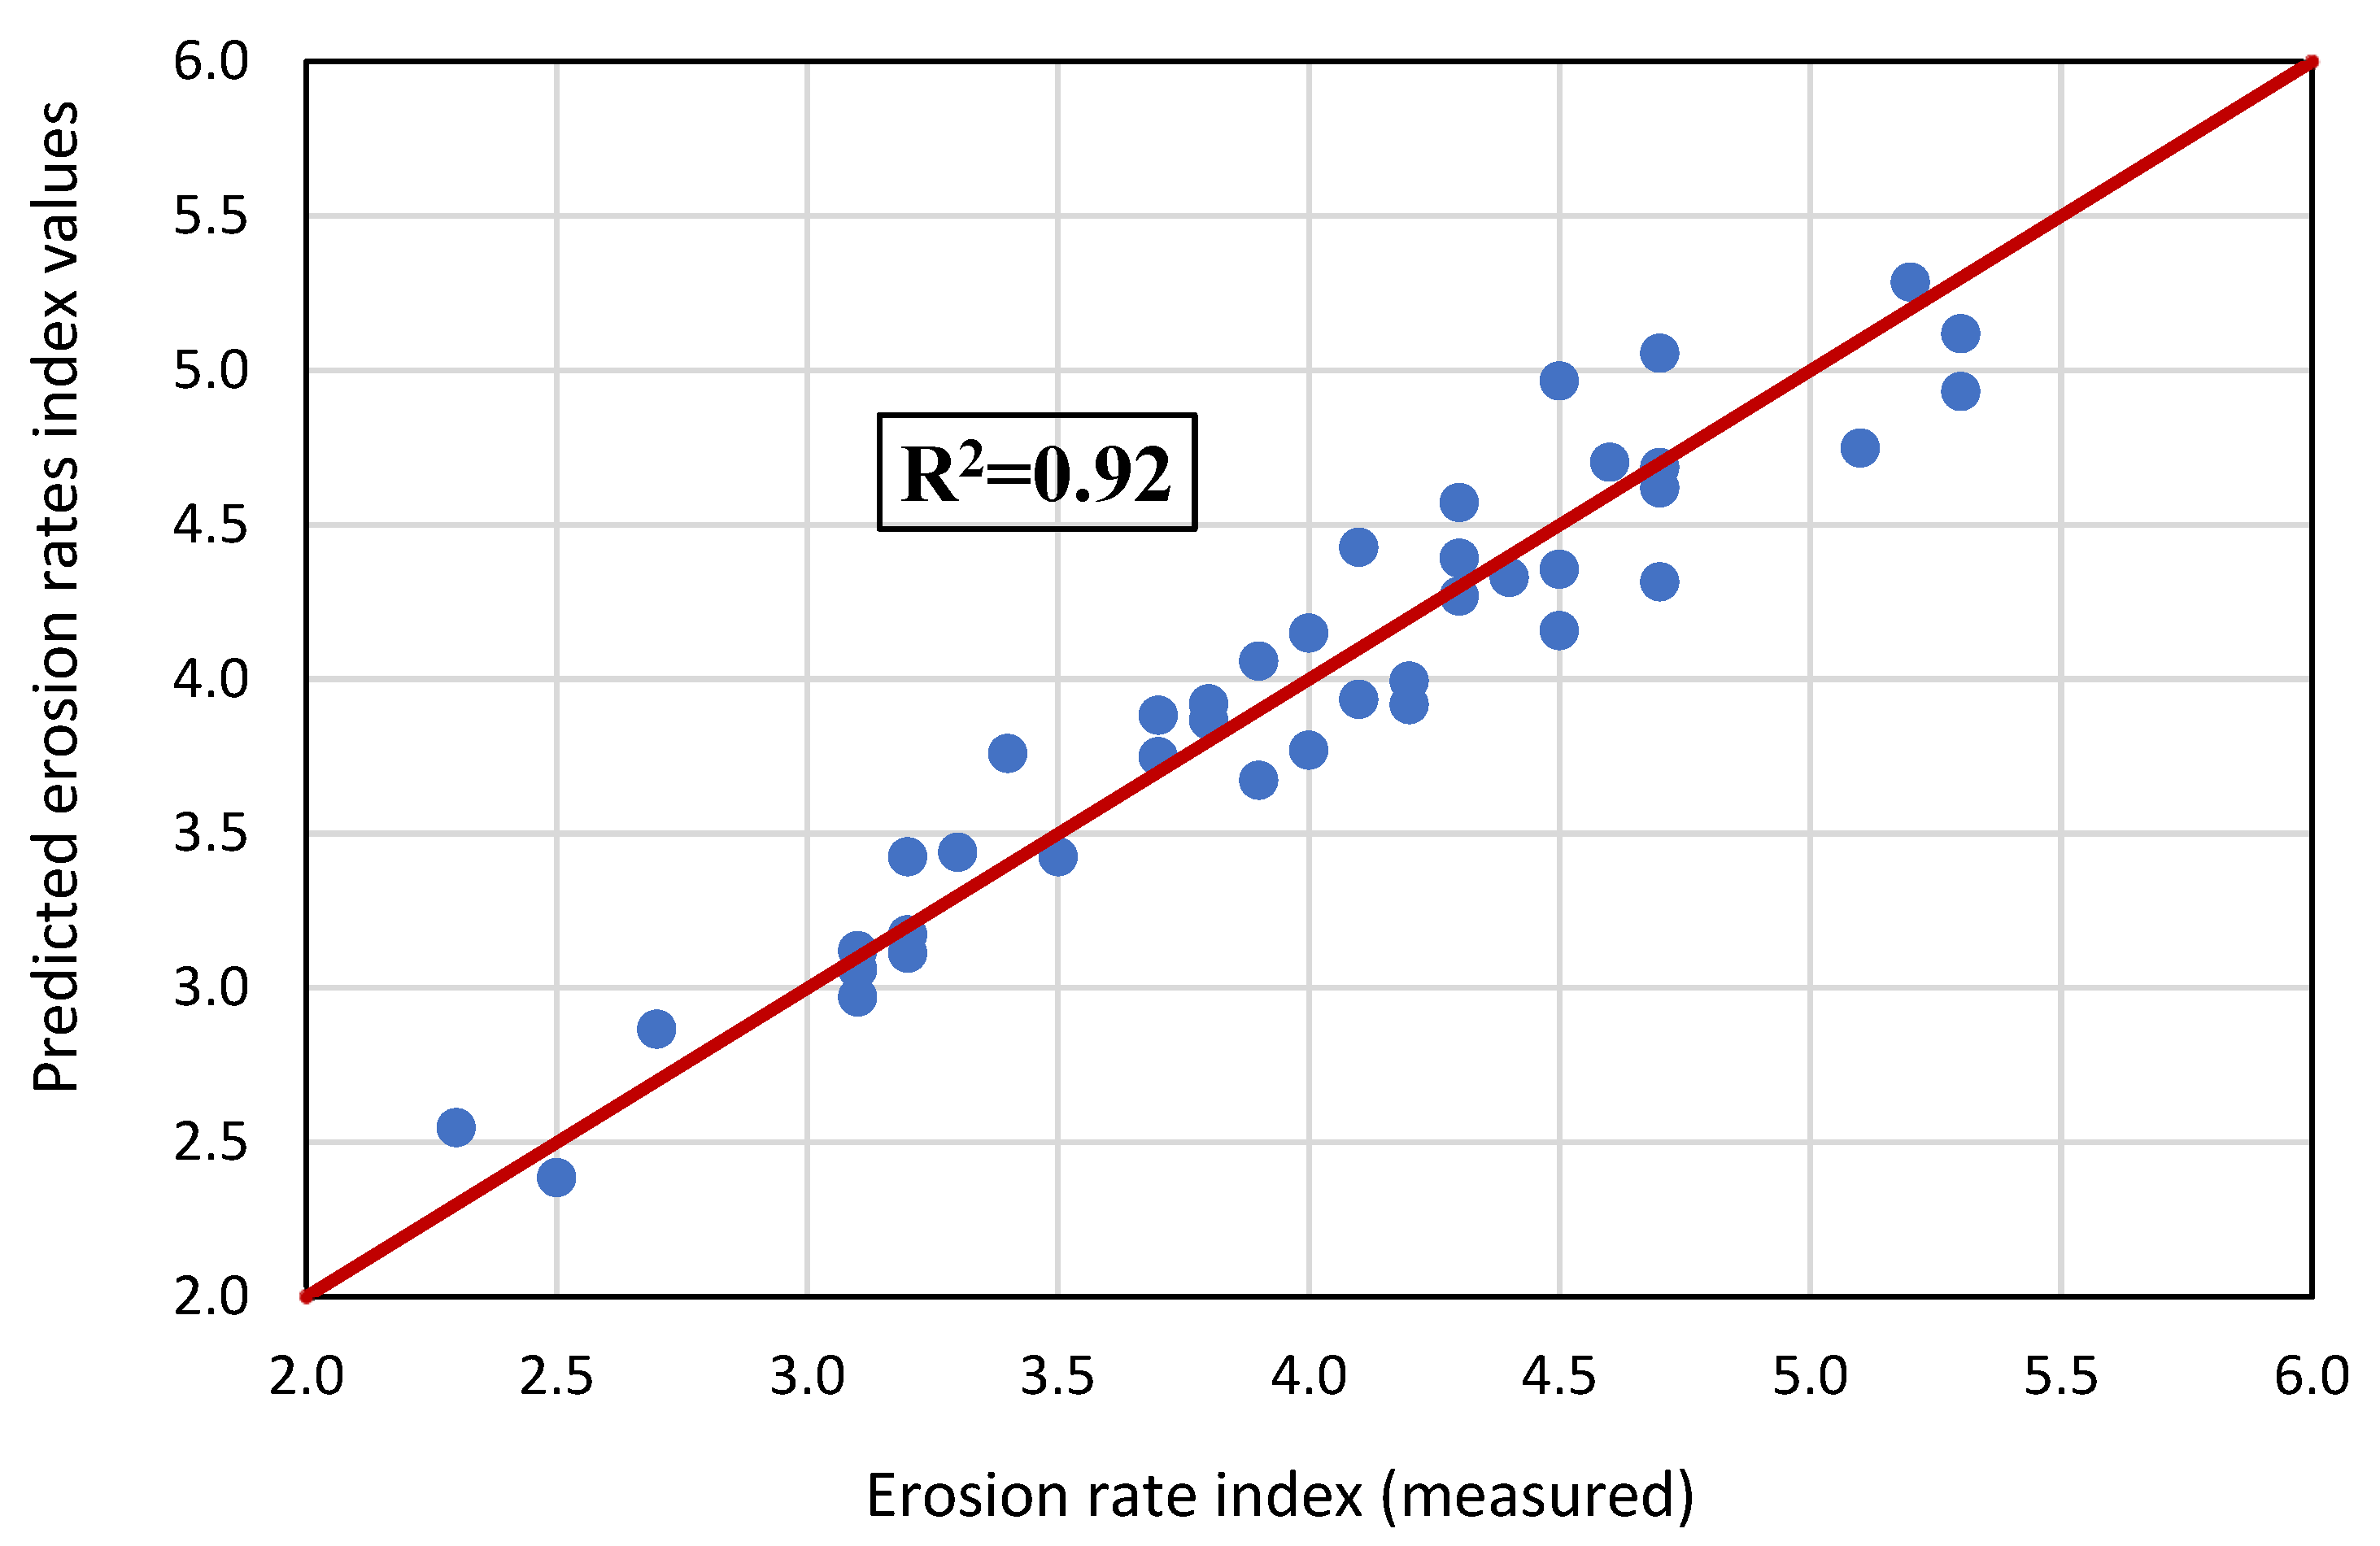
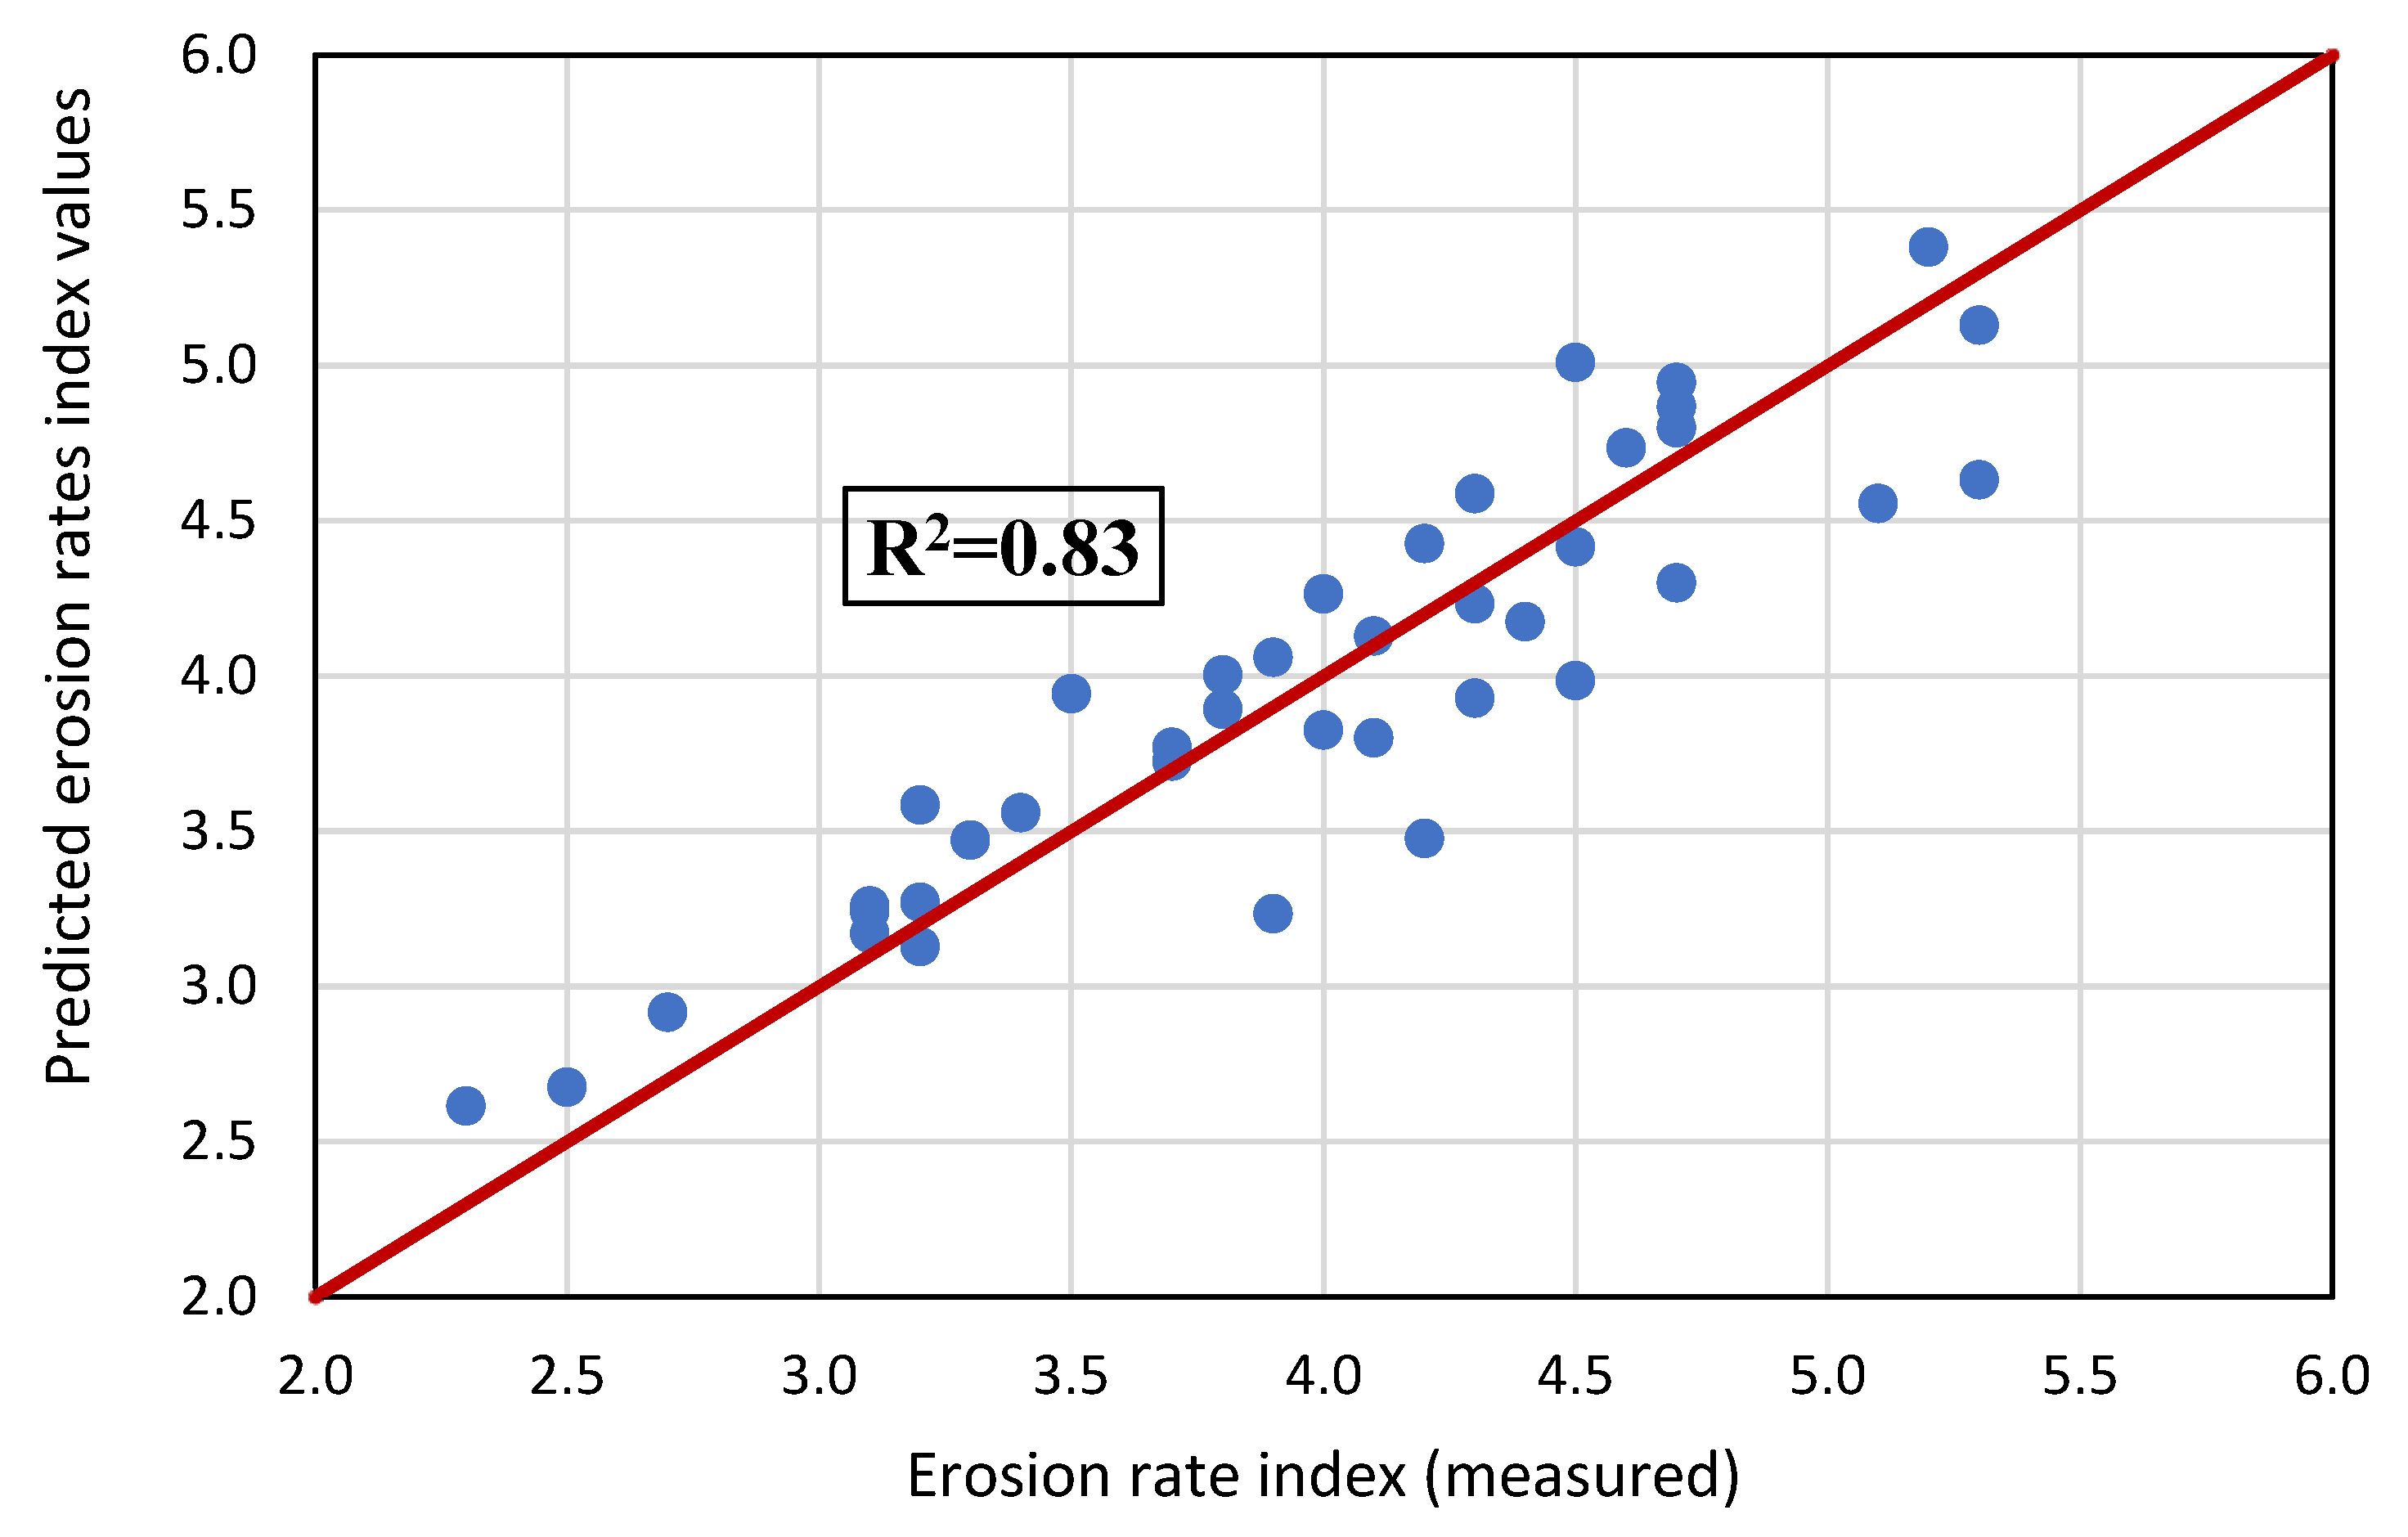
The initial physical properties of soils and the results from the Hole Erosion test in Table 2 have been used in the analysis to predict internal erosion and critical shear values for soils. The physical properties of the soils employed in formulating the prediction equations include the liquid limit, plasticity index, initial water content, and initial dry unit weight. Additionally, the shear strength properties, such as cohesion and angle of internal friction, obtained from the direct shear test, as well as the erosion rate index and critical shear, are considered. It was concluded that selected physical and mechanical properties can be used to predict the erosion rate. Three equations were developed based on different initial properties. For example, the six parameters liquid limit (LL), plasticity index (PI), water content (w), the initial dry unit weight of the soil, cohesion (c), and the angle of friction (ϕ) were used to predict the erosion rate index, as shown in Equation (7). A very good correlation with an R2 value = 0.92 was obtained when the six parameters were used and Figure 8 depicts the relationship between the measured and the predicted erosion rate index using Equation (7). Another correlation was developed, as presented in Equation (8), to predict the erosion rate index by using five parameters with R2 = 0.85. Figure 9 presents the relation between the measured and the predicted values using Equation (8). The third relationship was developed based on just four parameters—initial water content, initial dry density, cohesion, and angle of internal friction—to predict the erosion rate index, as shown in Equation (9), with R2 = 0.83. Figure 10 presented the outcome of Equation (9) and the correlation between the measured and the predicted erosion rate index. Table 4 illustrates in detail the selected parameters used to develop the three equations to predict the erosion rate index (IHET) and the corresponding coefficient of determination for each developed equation.
where LL is the liquid limit; PI is the plastic index; and w is the initial water content. All of these are shown in percentage (%). γ is the initial dry unit weight in (kN/m3); ϕ is the angle of internal friction in degrees; and c is the cohesion in (kN/m2).
IHET = −0.02LL + 0.07PI − 0.02w + 0.39γ + 0.03ϕ + 0.02c − 3.11
IHET = −0.04LL + 0.07PI + 0.33γ + 0.05ϕ + 0.02c − 3.15
IHET = −0.03w + 0.35γ + 0.02ϕ + 0.01c − 1.59

Figure 8.
The relation between the measured and predicted erosion rate index using Equation (7).
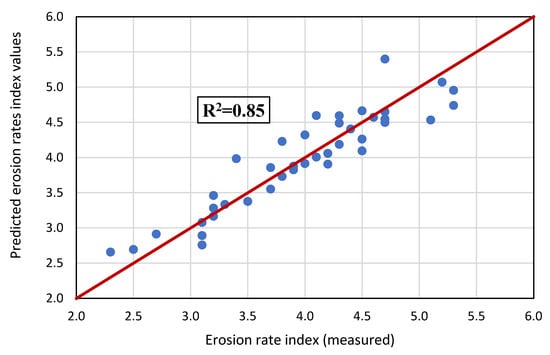
Figure 9.
The relation between the measured and predicted erosion rate index using Equation (8).

Figure 10.
The relation between the measured and predicted erosion rate index using Equation (9).
Table 4.
Parameters used to predict erosion rate index (IHET).
4.1.2. Prediction of Critical Shear
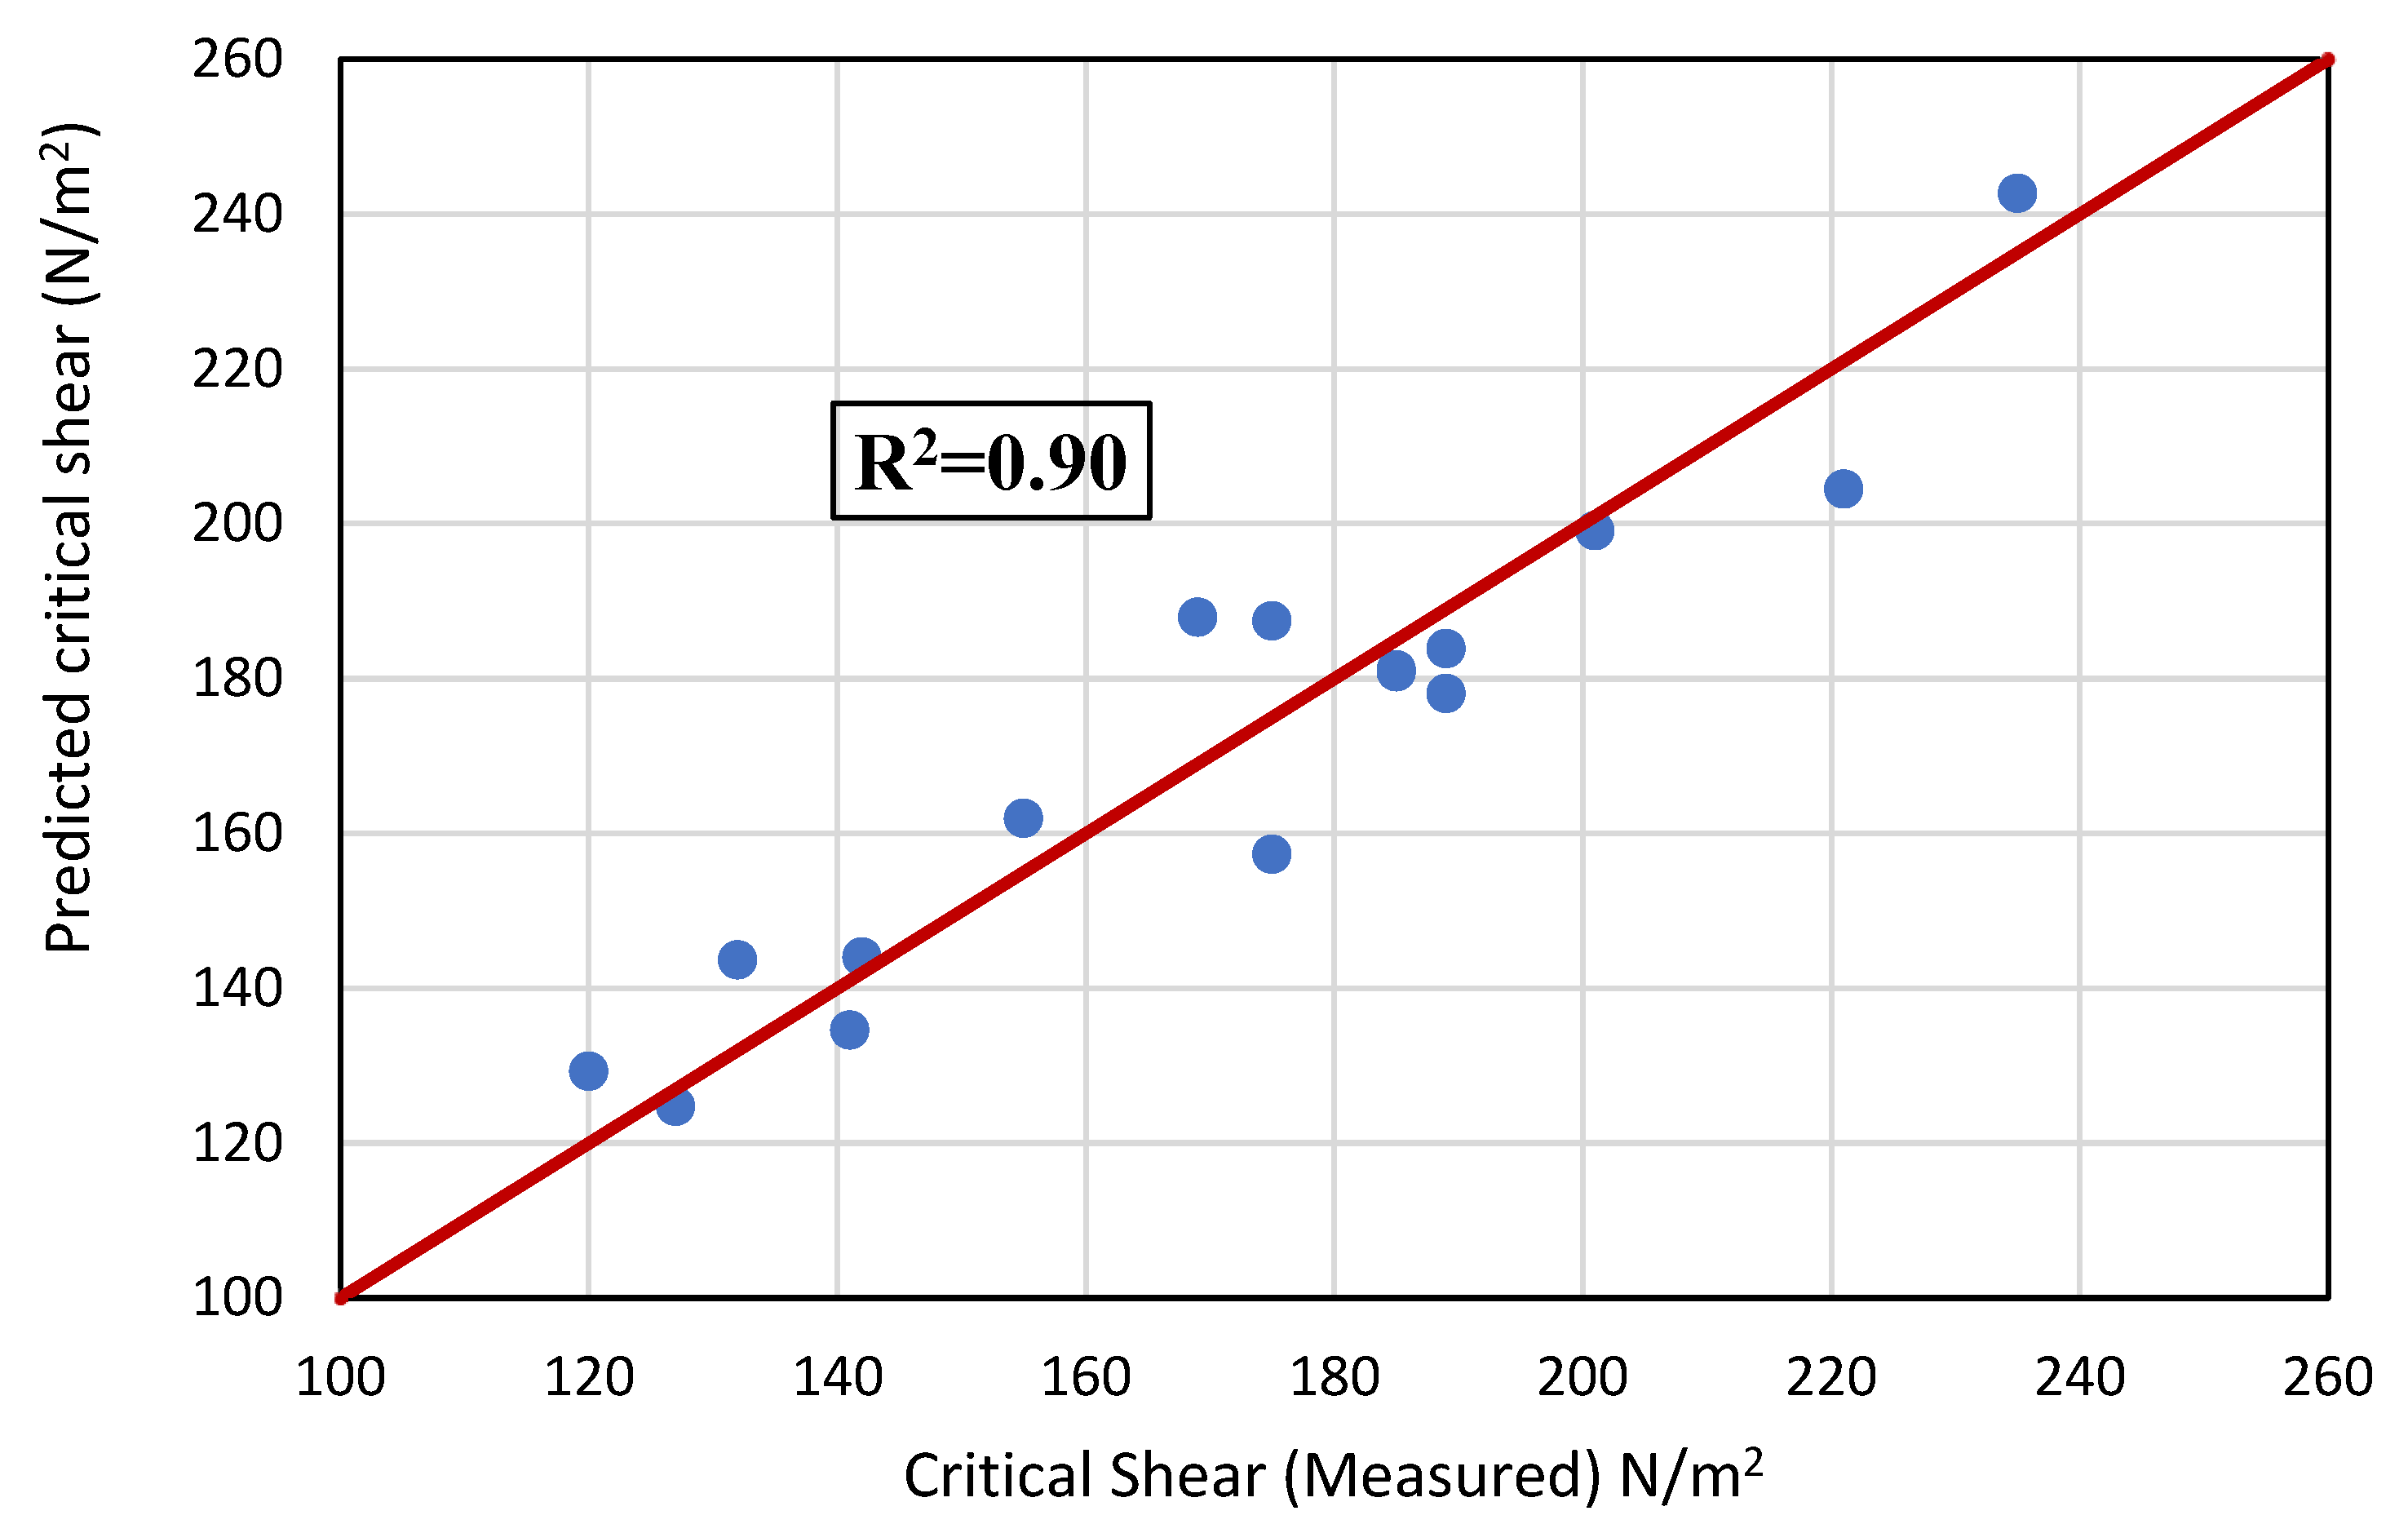
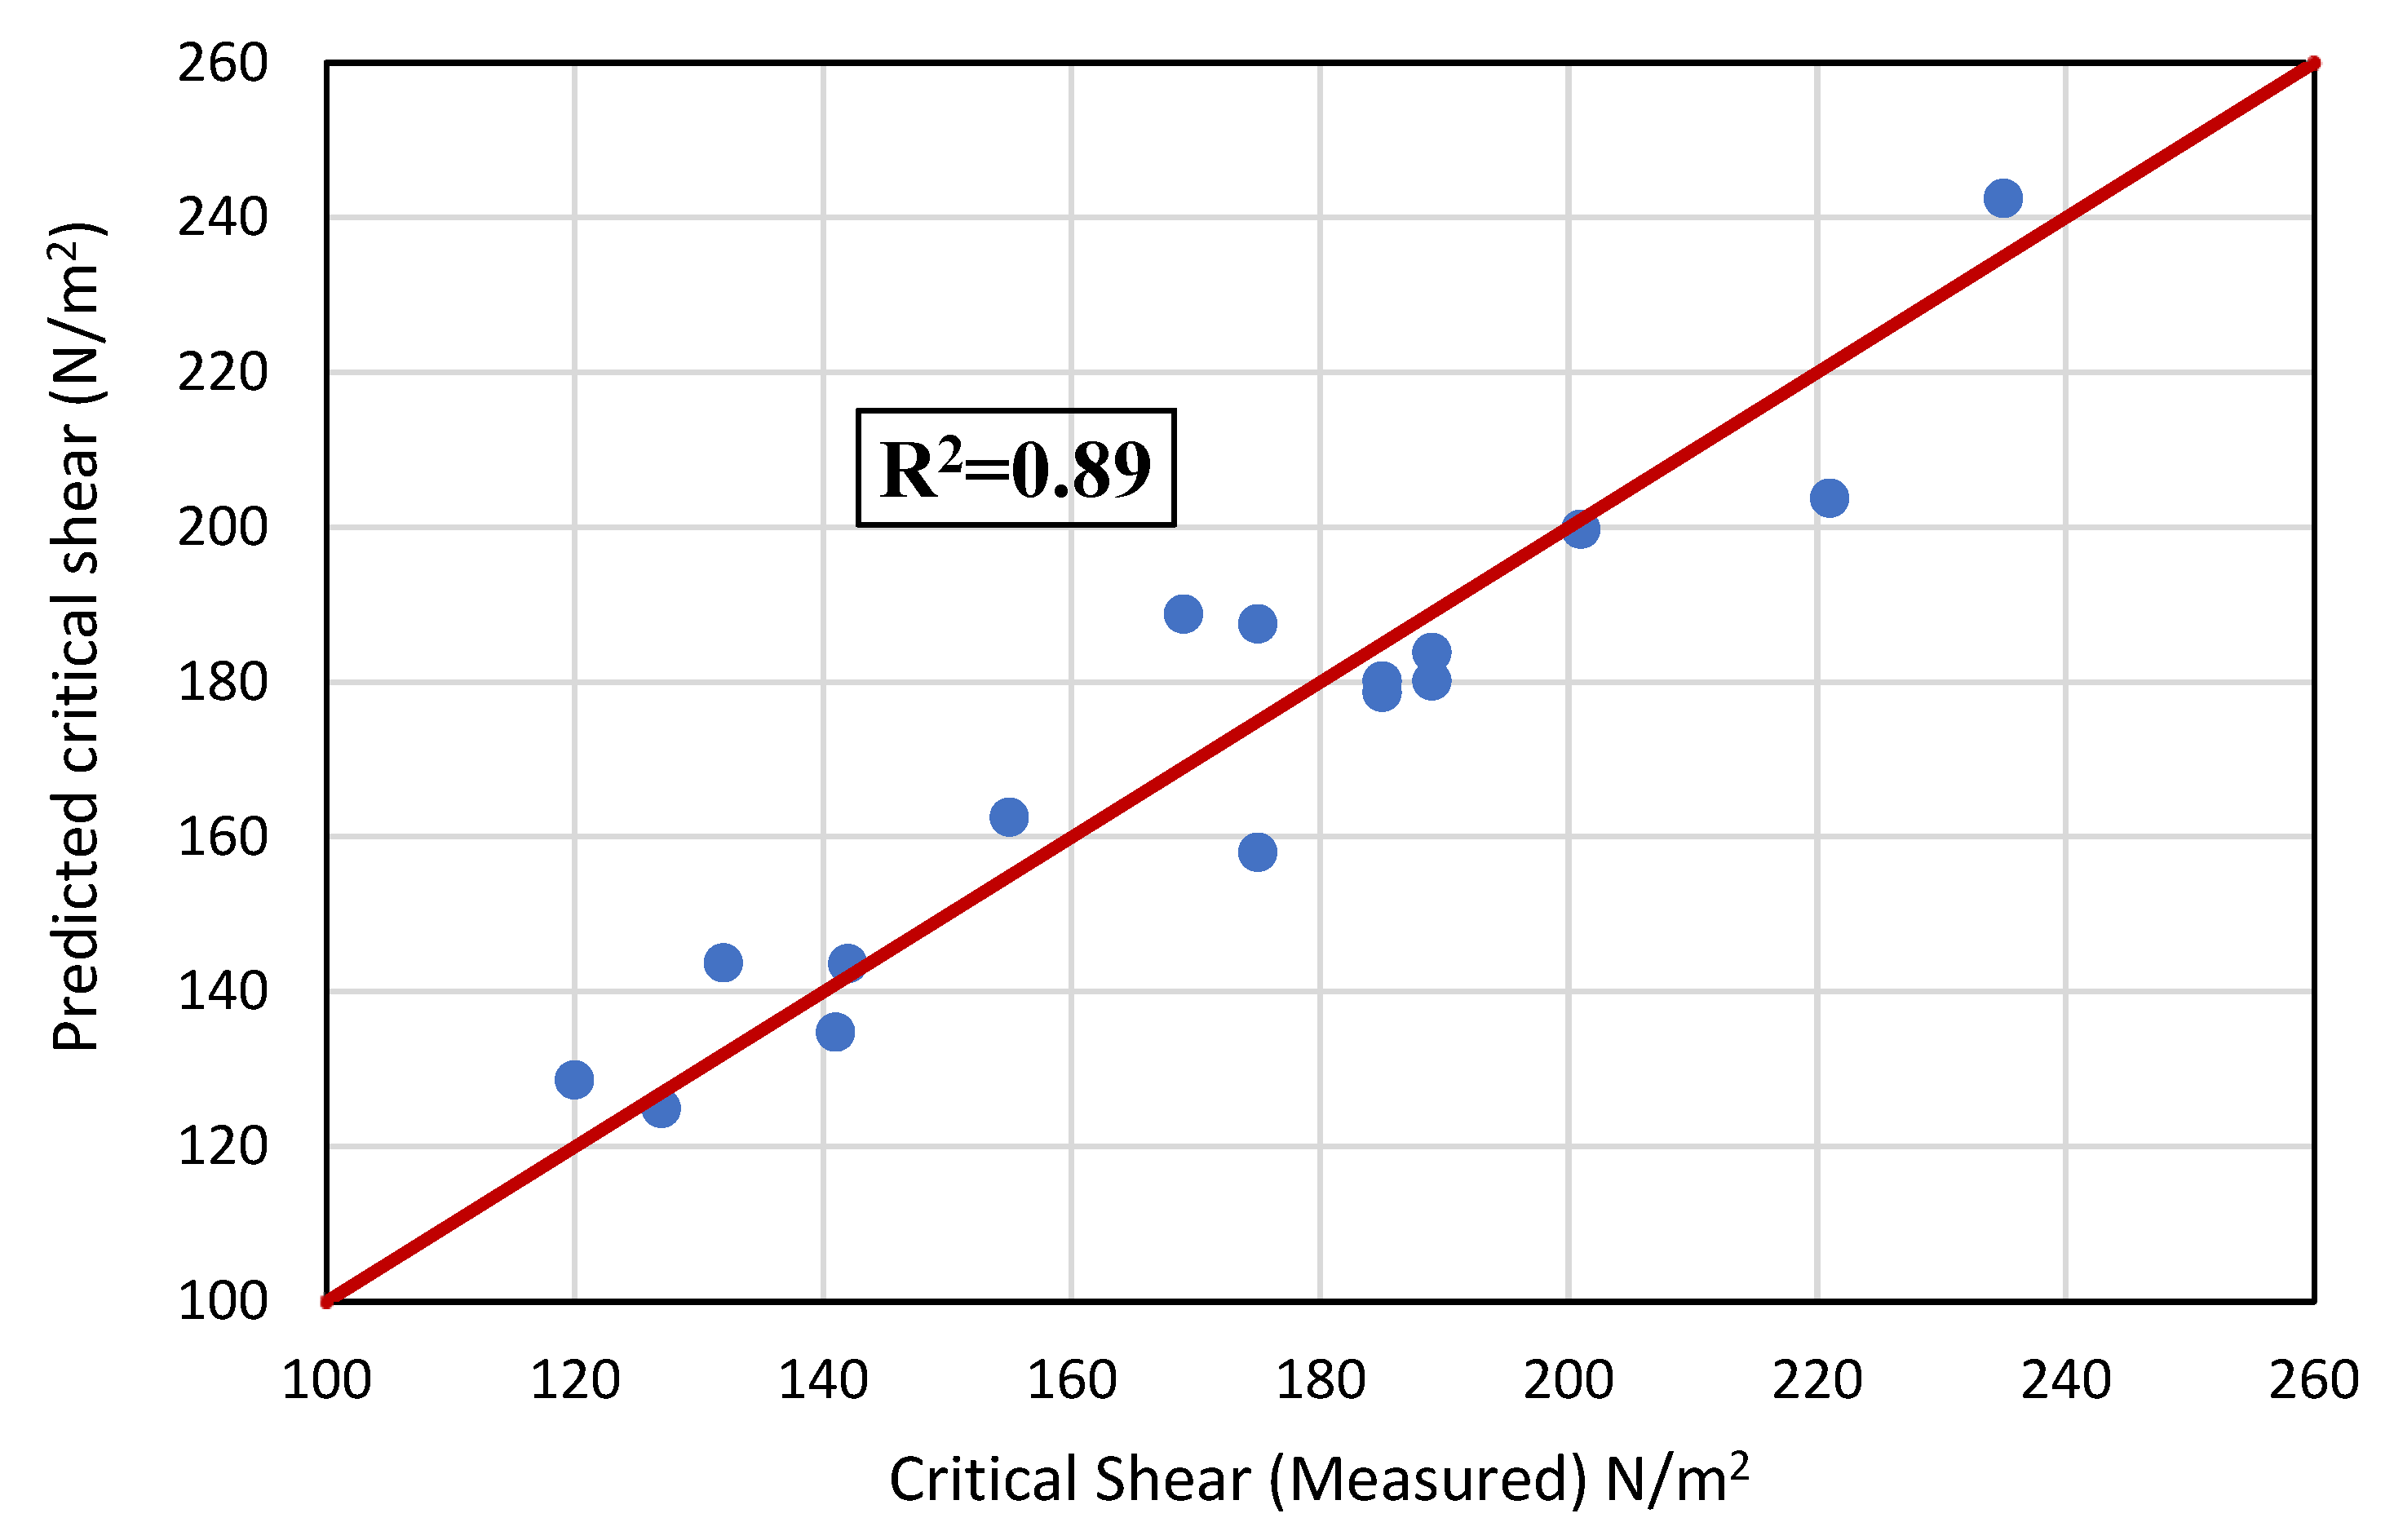
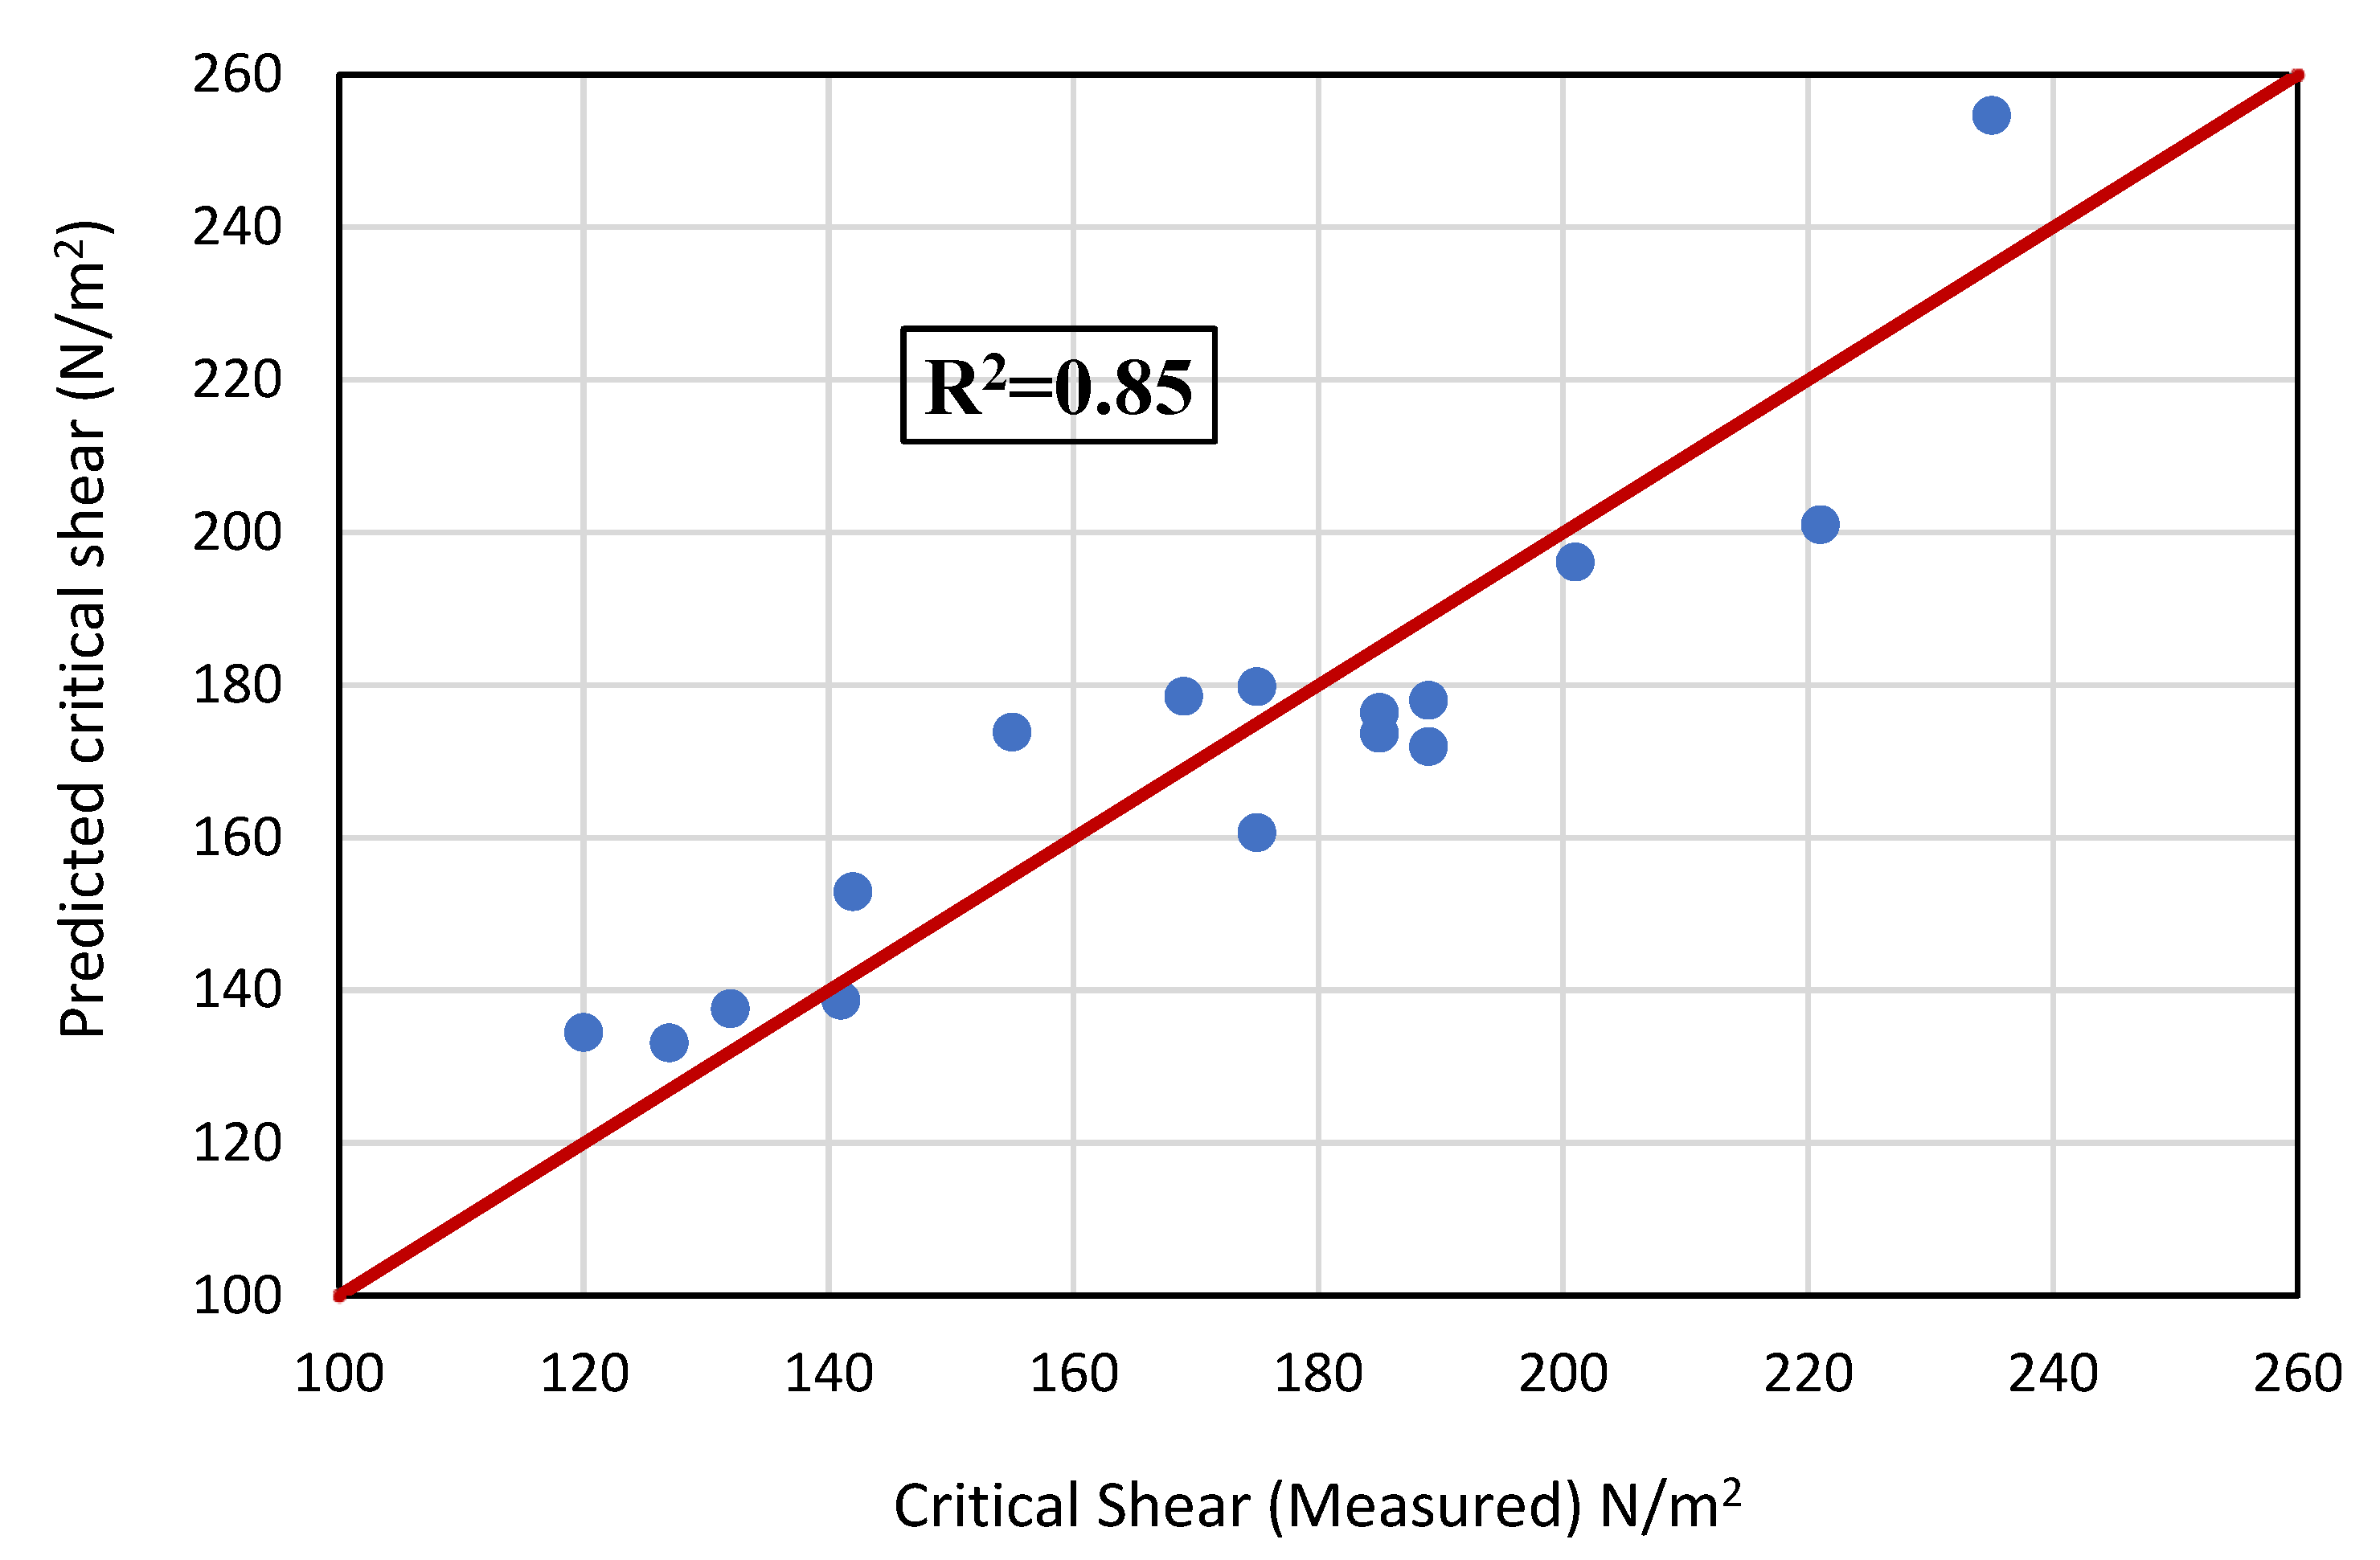
From the analysis and trials, different initial parameters should be used to predict the critical shear of the soil (τc). However, it was found that the six initial parameters used in the prediction of the erosion rate index will not give a good correlation to predict the critical shear and that no correlation can be developed. Therefore, the developed equations to predict the critical shear of the soil used new parameters such as the optimum water content and the maximum dry density. As shown in Equation (10), four parameters—plastic index, liquid limit, optimum water content, and maximum dry unit—were used to predict the critical shear. The result of Equation (10) is shown in Figure 11 with a coefficient of correlation value R2 = 0.9. Furthermore, Equation (11) used three initial properties—liquid limit, optimum water content, and maximum dry unit weight—and these parameters give a very good correlation, as shown in Figure 12, with R2 = 0.9. Equation (12) with R2 = 0.85 used the liquid limit, plastic index, and maximum dry unit weight for the prediction of the critical shear. The result of Equation (12) is shown in Figure 13. Table 5 illustrates the soil parameters used in developing Equations (10)–(12), along with the coefficient of determination.
where wopt is the optimum moisture content in percentage (%) and γmax is the maximum dry unit weight in (kN/m2).
τc = −0.26PI + 2.78LL + 1.86wopt + 5.84γmax − 96.1
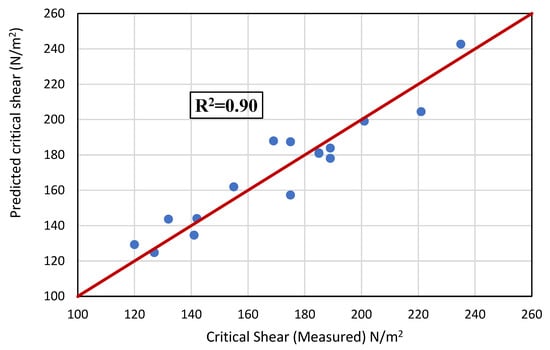
Figure 11.
The relation between the measured and predicted critical shear using Equation (10).
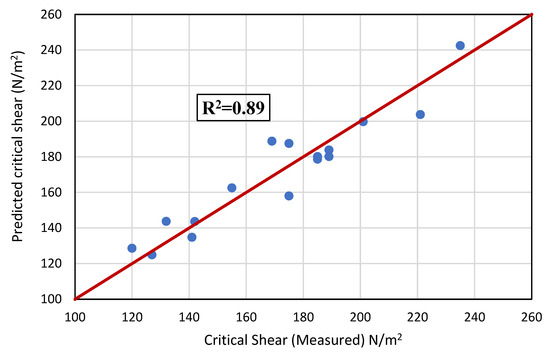
Figure 12.
The relation between the measured and predicted critical shear using Equation (11).
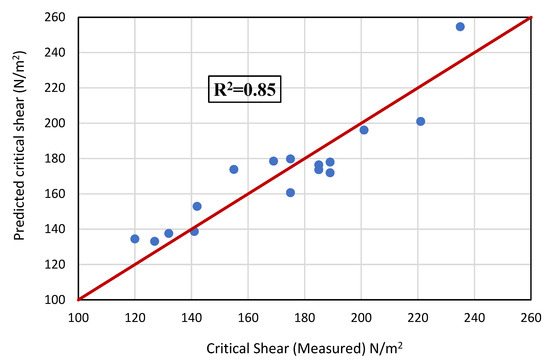
Figure 13.
The relation between the measured and predicted critical shear using Equation (12).
Table 5.
Parameters used to predict critical shear (τc).
According to the results, Equation (10) has a higher R2 than Equations (11) and (12) in predicting the critical shear. This is an indication that using four parameters gives a better prediction than using three parameters.
τc = 2.74LL + 1.85wopt + 6.11γmax − 103.96
τc = −0.22PI + 4.40LL + 6.02γmax − 115.05
5. Conclusions
The investigation and statistical prediction of internal erosion parameters (i.e., the erosion rate index and critical shear), through a regression analysis of the test results, has been performed. Sixteen clayey soils at different initial dry unit weights and water contents were used in this study. The effect of various physical parameters (liquid limit, plastic index, water content, dry unit weight, cohesion, and friction angle) on internal erosion has been investigated. It was found that the abovementioned physical properties can be used to calculate the erosion rate index. Different parameters based on the liquid limit, plastic index, optimum water content, and maximum dry density were used to develop the critical shear correlation. A total of six regression models have been developed with a high coefficient of determination (R2) to predict the erosion rate index and the critical shear. The R2 value in the prediction model varies between 0.83 and 0.92 to predict the erosion rate index and between 0.85 and 0.9 to predict the critical shear, respectively. The developed models will save time and effort in evaluating soil internal erosion behavior in advance and in avoiding the problems associated with internal erosion phenomena. Additionally, it was concluded that the increase in the cohesion and internal friction of clay soil will increase the erosion rate index and the critical shear, which implies that the soil becomes more resistant to erosion.
Author Contributions
Conceptualization, M.F.A. and A.E.; methodology, M.F.A., Z.K. and M.Y.; software, M.F.A., R.V., Z.K, P.V.A., A.E. and A.K.; validation, M.F.A., Z.K., M.Y., P.V.A. and A.E.; formal analysis, M.F.A., R.V., M.Y., P.V.A., A.E. and A.K.; investigation, M.F.A. and A.E.; resources, M.F.A. and R.V.; data curation, M.F.A., Z.K., M.Y. and A.E.; writing—original draft preparation, M.F.A., R.V., Z.K., M.Y., A.E. and A.K.; writing—review and editing, M.F.A., R.V., Z.K., M.Y., P.V.A., A.E. and A.K.; visualization, M.F.A., R.V. and A.E.; supervision, M.F.A. and R.V.; project administration, M.F.A. and R.V.; funding acquisition, M.F.A. and R.V. All authors have read and agreed to the published version of the manuscript.
Funding
This research was financially supported by the American University of Sharjah (AUS) through the Faculty Research Grant program (FRG20-M-E61) and the Open Access Program (OAP).
Data Availability Statement
Data are available from the corresponding author upon reasonable request.
Acknowledgments
The authors would like to acknowledge and show their gratitude towards the American University of Sharjah (AUS) research office, and the Open Access Program (OAP) in the University, for their support. This paper represents the opinions of the authors and does not represent the opinions or position of the American University of Sharjah.
Conflicts of Interest
Author Zahid Khan was employed by the company AECOM. The remaining authors declare that the research was conducted in the absence of any commercial or financial relationships that could be construed as a potential conflict of interest.
References
- Baxter, R.M. Environmental effects of dams and impoundments. Annu. Rev. Ecol. Syst. 1977, 8, 255–283. [Google Scholar] [CrossRef]
- Yuan, J.; Wang, T.J.; Chen, J. Microscopic mechanism study of the creep properties of soil based on the energy scale method. Front. Mater. 2023, 10, 1137728. [Google Scholar] [CrossRef]
- Foster, M.; Fell, R.; Spannagle, M. The statistics of embankment dam failures and accidents. Can. Geotech. J. 2000, 37, 1000–1024. [Google Scholar] [CrossRef]
- Wei, X.; Bai, X.; Wen, X.; Liu, L.; Xiong, J.; Yang, C. A large and overlooked Cd source in karst areas: The migration and origin of Cd during soil formation and erosion. Sci. Total Environ. 2023, 895, 165126. [Google Scholar] [CrossRef] [PubMed]
- Kwon, Y.-M.; Moon, J.-H.; Cho, G.-C.; Kim, Y.-U.; Chang, I. Xanthan gum biopolymer-based soil treatment as a construction material to mitigate internal erosion of earthen embankment: A field-scale study. Constr. Build. Mater. 2023, 389, 131716. [Google Scholar] [CrossRef]
- Ke, L.; Takahashi, A. Strength reduction of cohesionless soil due to internal erosion induced by one-dimensional upward seepage flow. Soils Found. 2012, 52, 698–711. [Google Scholar] [CrossRef]
- Han, Z.; Li, J.; Gao, P.; Huang, B.; Ni, J.; Wei, C. Determining the shear strength and permeability of soils for engineering of new paddy field construction in a hilly mountainous region of Southwestern China. Int. J. Environ. Res. Public Health 2020, 17, 1555. [Google Scholar] [CrossRef]
- Banu, S.A.; Attom, M.F. Effect of Curing Time on Lime-Stabilized Sandy Soil against Internal Erosion. Geosciences 2023, 13, 102. [Google Scholar] [CrossRef]
- Banu, S.; Attom, M. Internal Erosion Stabilization of Cohesionless Soil Using Lime. Water 2023, 15, 1992. [Google Scholar] [CrossRef]
- Adamo, N.; Al-Ansari, N.; Sissakian, V.; Laue, J.; Knutsson, S. Dam safety problems related to seepage. J. Earth Sci. Geotech. Eng. 2020, 10, 191–239. [Google Scholar]
- Prasomsri, J.; Takahashi, A. The role of fines on internal instability and its impact on undrained mechanical response of gap-graded soils. Soils Found. 2020, 60, 1468–1488. [Google Scholar] [CrossRef]
- Fell, R.; Wan, C.F.; Cyganiewicz, J.; Foster, M. Time for development of internal erosion and piping in embankment dams. J. Geotech. Geoenviron. Eng. 2003, 129, 307–314. [Google Scholar] [CrossRef]
- Carraro, J.A.H.; Bortolotto, M.S. Stiffness degradation and damping of carbonate and silica sands. Front. Offshore Geotech. III 2015, 2015, 1179–1183. [Google Scholar]
- Liu, X.; Li, S.; Sun, L. The study of dynamic properties of carbonate sand through a laboratory database. Bull. Eng. Geol. Environ. 2020, 79, 3843–3855. [Google Scholar] [CrossRef]
- Morsy, A.M.; Salem, M.A.; Elmamlouk, H.H. Evaluation of dynamic properties of calcareous sands in Egypt at small and medium shear strain ranges. Soil Dyn. Earthq. Eng. 2019, 116, 692–708. [Google Scholar] [CrossRef]
- Abdelfattah, M.A.; Shahid, S.A. Characterization and Classification of Soils in the Coastline of Abu Dhabi Emirate. In Proceedings of the 5th International Agroenviron Symposium Titled Agricultural Constraints in the Soil-Plant-Atmosphere Continuum, Ghent, Belgium, 4–7 September 2006; pp. 4–7. [Google Scholar]
- Abdelfattah, M.A.; Shahid, S.A. A comparative characterization and classification of soils in Abu Dhabi coastal area in relation to arid and semi-arid conditions using USDA and FAO soil classification systems. Arid. Land Res. Manag. 2007, 21, 245–271. [Google Scholar] [CrossRef]
- Giretti, D.; Fioravante, V.; Been, K.; Dickenson, S. Mechanical properties of a carbonate sand from a dredged hydraulic fill. Géotechnique 2018, 68, 410–420. [Google Scholar] [CrossRef]
- Giang, P.H.H.; Van Impe, P.O.; Van Impe, W.F.; Menge, P.; Haegeman, W. Small-strain shear modulus of calcareous sand and its dependence on particle characteristics and gradation. Soil Dyn. Earthq. Eng. 2017, 100, 371–379. [Google Scholar] [CrossRef]
- Khalil, A.; Khan, Z.; Attom, M.; Fattah, K.; Ali, T.; Mortula, M. Continuous Evaluation of Shear Wave Velocity from Bender Elements during Monotonic Triaxial Loading. Materials 2023, 16, 766. [Google Scholar] [CrossRef]
- Khalil, A.; Khan, Z.H.; Attom, M.; El Emam, M.; Fattah, K. Dynamic properties of calcareous sands from urban areas of Abu Dhabi. Appl. Sci. 2022, 12, 3325. [Google Scholar] [CrossRef]
- Jafarian, Y.; Javdanian, H.; Haddad, A. Strain-dependent dynamic properties of Bushehr siliceous-carbonate sand: Experimental and comparative study. Soil Dyn. Earthq. Eng. 2018, 107, 339–349. [Google Scholar] [CrossRef]
- Nearing, M.A.; Bradford, J.M.; Parker, S.C. Soil Detachment by Shallow Flow at Low Slopes. Soil Sci. Soc. Am. J. 1991, 55, 339. [Google Scholar] [CrossRef]
- Grissinger, E.H. Resistance of selected clay systems to erosion by water. Water Resour. Res. 1966, 2, 131–138. [Google Scholar] [CrossRef]
- Römkens, M.J.M.; Roth, C.B.; Nelson, D.W. Erodibility of selected clay subsoils in relation to physical and chemical properties. Soil Sci. Soc. Am. J. 1977, 41, 954–960. [Google Scholar] [CrossRef]
- Ostovari, Y.; Ghorbani-Dashtaki, S.; Kumar, L.; Shabani, F. Soil erodibility and its prediction in semi-arid regions. Arch. Agron. Soil Sci. 2019, 65, 1688–1703. [Google Scholar] [CrossRef]
- Mallick, J.; Al-Wadi, H.; Rahman, A.; Ahmed, M.; Khan, R.A. Spatial variability of soil erodibility and its correlation with soil properties in semi-arid mountainous watershed, Saudi Arabia. Geocarto Int. 2016, 31, 661–681. [Google Scholar] [CrossRef]
- Tsanis, I.K.; Seiradakis, K.D.; Sarchani, S.; Panagea, I.S.; Alexakis, D.D.; Koutroulis, A.G. The Impact of Soil-Improving Cropping Practices on Erosion Rates: A Stakeholder-Oriented Field Experiment Assessment. Land 2021, 10, 964. [Google Scholar] [CrossRef]
- Ollobarren Del Barrio, P.H.H.; Giménez, R.; Campo-Bescós, M.Á. Assessing soil properties controlling interrill erosion: An empirical approach under Mediterranean conditions. Land Degrad. Dev. 2017, 28, 1729–1741. [Google Scholar] [CrossRef]
- Yamin, M.; Attom, M.F.; Atabay, S.; Vandanapu, R. The Effect of Compaction Effort on Shear Strength Parameters of Low/High Plasticity Clay Soils. Geotech. Eng. (00465828) 2021, 52, 2. [Google Scholar]
- Hanson, G.J.; Hunt, S.L. Lessons Learned using Laboratory JET Method to Measure Soil Erodibility of Compacted Soils. Appl. Eng. Agric. 2007, 23, 305–312. [Google Scholar] [CrossRef]
- Briaud, J.-L. Case histories in soil and rock erosion: Woodrow wilson bridge, brazos river meander, normandy cliffs, and new orleans levees. J. Geotech. Geoenviron. Eng. 2008, 134, 1425–1447. [Google Scholar] [CrossRef]
- Wan, C.F.; Fell, R. Investigation of rate of erosion of soils in embankment dams. J. Geotech. Geoenviron. Eng. 2004, 130, 373–380. [Google Scholar] [CrossRef]
- Chen, C.; Mei, S.; Chen, S.; Tang, Y.; Wan, C. Laboratory investigation of erosion behavior at the soil–structure interface affected by various structural factors. Nat. Hazards 2022, 111, 1065–1084. [Google Scholar] [CrossRef]
- Liu, R.; Han, G.; Jiang, Y.; Yu, L.; He, M. Shear behaviour of multi-joint specimens: Role of surface roughness and spacing of joints. Géotechnique Lett. 2020, 10, 113–118. [Google Scholar] [CrossRef]
- Zhang, G.; Zhang, J.-M. Constitutive rules of cyclic behavior of interface between structure and gravelly soil. Mech. Mater. 2009, 41, 48–59. [Google Scholar] [CrossRef]
- Xie, Q.; Liu, J.; Han, B.; Li, H.; Li, Y.; Li, X. Critical hydraulic gradient of internal erosion at the soil–structure interface. Processes 2018, 6, 92. [Google Scholar] [CrossRef]
- Hu, Z.; Zhang, Y.; Yang, Z. Suffusion-induced deformation and microstructural change of granular soils: A coupled CFD–DEM study. Acta Geotech. 2019, 14, 795–814. [Google Scholar] [CrossRef]
- Chang, D.S.; Zhang, L.M. Critical hydraulic gradients of internal erosion under complex stress states. J. Geotech. Geoenviron. Eng. 2013, 139, 1454–1467. [Google Scholar] [CrossRef]
- Sibille, L.; Marot, D.; Sail, Y. A description of internal erosion by suffusion and induced settlements on cohesionless granular matter. Acta Geotech. 2015, 10, 735–748. [Google Scholar] [CrossRef]
- Hu, W.; Scaringi, G.; Xu, Q.; Huang, R. Internal erosion controls failure and runout of loose granular deposits: Evidence from flume tests and implications for postseismic slope healing. Geophys. Res. Lett. 2018, 45, 5518–5527. [Google Scholar] [CrossRef]
- Fox, G.A.; Felice, R.G.; Midgley, T.L.; Wilson, G.V.; Al-Madhhachi, A.T. Laboratory soil piping and internal erosion experiments: Evaluation of a soil piping model for low-compacted soils. Earth Surf. Process. Landf. 2014, 39, 1137–1145. [Google Scholar] [CrossRef]
- Al-Madhhachi, A.-S.T.; Hanson, G.J.; Fox, G.A.; Tyagi, A.K.; Bulut, R. Measuring soil erodibility using a laboratory ‘mini’ JET. Trans. ASABE 2013, 56, 901–910. [Google Scholar]
- Daly, E.R.; Fox, G.A.; Miller, R.B.; Al-Madhhachi, A.-S.T. A scour depth approach for deriving erodibility parameters from jet erosion tests. Trans. ASABE 2013, 56, 1343–1351. [Google Scholar]
- Hanson, G.J.; Cook, K.R. Development of excess shear stress parameters for circular jet testing. ASAE Pap. 1997, 972227. [Google Scholar]
- Pachideh, V.; Hosseini, S.M. A new physical model for studying flow direction and other influencing parameters on the internal erosion of soils. Geotech. Test. J. 2019, 42, 1431–1456. [Google Scholar] [CrossRef]
- Kwon, Y.-M.; Ham, S.-M.; Kwon, T.-H.; Cho, G.-C.; Chang, I. Surface-erosion behaviour of biopolymer-treated soils assessed by EFA. Géotechnique Lett. 2020, 10, 106–112. [Google Scholar] [CrossRef]
- Ham, S.-M.; Kwon, T.-H.; Chang, I.; Chung, M.-K. Ultrasonic P-wave reflection monitoring of soil erosion for erosion function apparatus. Geotech. Test. J. 2016, 39, 301–314. [Google Scholar] [CrossRef]
- Briaud, J.-L.; Ting, F.C.K.; Chen, H.C.; Cao, Y.; Han, S.W.; Kwak, K.W. Erosion function apparatus for scour rate predictions. J. Geotech. Geoenviron. Eng. 2001, 127, 105–113. [Google Scholar] [CrossRef]
- ASTM International. D4318 Standard Test Methods for Liquid Limit, Plastic Limit, and Plasticity Index of Soils. Available online: https://www.astm.org/d4318-17e01.html (accessed on 10 December 2023).

Disclaimer/Publisher’s Note: The statements, opinions and data contained in all publications are solely those of the individual author(s) and contributor(s) and not of MDPI and/or the editor(s). MDPI and/or the editor(s) disclaim responsibility for any injury to people or property resulting from any ideas, methods, instructions or products referred to in the content. |
© 2024 by the authors. Licensee MDPI, Basel, Switzerland. This article is an open access article distributed under the terms and conditions of the Creative Commons Attribution (CC BY) license (https://creativecommons.org/licenses/by/4.0/).