Article

Mapping Groundwater Potential (GWP) in the Al-Ahsa Oasis, Eastern Saudi Arabia Using Data-Driven GIS Techniques

by
Abdalhaleem Hassaballa
1,2,* and
Abdelrahim Salih
3
1
Department of Natural Resources, Faculty of Agriculture, King Faisal University, Al-Ahsa P.O. Box 420, Saudi Arabia
2
Agricultural and Biological Engineering Department, Faculty of Engineering, University of Khartoum, Khartoum 11111, Sudan
3
Department of Geography, Faculty of Arts, King Faisal University, Al-Ahsa P.O. Box 420, Saudi Arabia
*
Author to whom correspondence should be addressed.
Water 2024, 16(2), 194; https://doi.org/10.3390/w16020194
Submission received: 10 December 2023 / Revised: 31 December 2023 / Accepted: 3 January 2024 / Published: 5 January 2024
(This article belongs to the Section Hydrology)

Abstract

:
Searching for new sources of water is becoming one of the most important aspects of scientific research, especially in areas prone to drought, like Saudi Arabia. The study aim was to delineate groundwater potential zones within the Oasis of Al-Ahsa, in Saudi Arabia’s eastern region, and to identify the optimum factors that control the availability of groundwater zones. This was achieved through examining the effect of ten environmental variables on groundwater recharge, namely: slope, topographic wetness index (TWI), land cover (LC), elevation, lineament density (Ld), drainage density (Dd), rainfall, geology, and soil texture. The variables were prepared from a variety of data sources, including spatial data (i.e., DEM and Landsat-8 image), in addition to other complementing data sources for appropriate parameters extraction. Two weighted overlay methods were used, namely the simple additive weight (SAW) as well as the optimum index factor (OIF) in order to categorize the optimal set of parameters for computing GWP and identifying its zones. Two GWP maps were obtained and validated through comparison with the locations of existing wells at GWP zones. The study findings have assured the cogency of the SAW map, where it was found that nearly 45–48% of the resultant zones were characterized as in the “moderate” class, whereas around 21–37% of the entire zones area were classified within the “high” class. The soil texture parameter was determined as being the most influencing parameter for GWP mapping followed by the “geology” parameter; however, the “lineament density” (Ld) was the least important factor. Furthermore, the OIF method has facilitated the identification of the optimal parameter combination for delineating groundwater potential (GWP) zones, which included “Ld”, “land cover”, and “TWI”. The study findings and methodology can serve as a potential model for other similar regions, supporting sustainable water resource management locally as well as globally.

Graphical Abstract

1. Introduction

In arid regions where rainfall barely reaches 200 mm per year, indirect recharge becomes the lifeline for aquifers. Direct recharge from meager rainfall is simply too limited to be reliable [1]. This translates to a limited replenishment of such vital water reservoirs. Shallow alluvial aquifers hold an insufficient portion of the stored groundwater, while the vast majority resides within the sedimentary aquifers of local and regional scales. This valuable resource, however, is non-renewable fossil water; its age reflects ancient hydrological eras, ranging from approximately 10,000 to 32,000 years [2,3].
The Kingdom of Saudi Arabia (KSA) confronts a difficult challenge as its arid climate and limited renewable freshwater resources face a persistent surge in demand driven by rapid population growth, urbanization, and expanding industrial activities. This stark disparity between supply and demand necessitates a paradigm shift in water management strategies to ensure sustainable utilization and long-term resource security [4]. So, groundwater resources in Saudi Arabia are primarily located within the extensive, highly permeable aquifers occupying sedimentary basins in the north and east. Conversely, the Precambrian crystalline rocks of the Arabian Shield host groundwater in a fractured rock system [2,3]. The Arabian Shelf, encompassing roughly 67% of KSA (approximately 1.49 M squared kilometers), hosts these deep sedimentary aquifers, which are primarily composed of limestone and sandstone. These stratified formations, overlying the basement rock formation of the Arabian Shield, serve as reservoirs for groundwater within over 20 distinct principal and secondary aquifers [3]. The estimated age of this groundwater largely falls within the range of 10–32 thousand years. While the total groundwater table to 300 m depth underneath the ground surface is estimated at 2.185 billion cubic meters, the annual recharge stands at a mere 2762 million cubic meters [5].
In fact, Saudi Arabia’s agricultural sector has undergone a massive expansion driven by extensive irrigation infrastructure [6]. This exponential growth, however, has entailed a significant voracious need for water. The 1980s witnessed a staggering surge in agricultural water demand, boosting from an estimated 2 billion cubic meters per annum in 1980 to a colossal 7.43 billion by 1985 [7]. This limitless consumption continued unabated, nearly doubling once again within the following year. By 1987, agriculture claimed a dominant 90% of the Kingdom’s total water demand with wheat alone gulping down 37% of the agricultural sector’s share [8]. This persistent consumption has established a challenging reality that groundwater levels across the land are dropping. The volumes extracted for irrigation far exceed the natural renewal rates, leading to a continuous depletion of aquifers [3,7,9]. This unsustainable exploitation endangered the long-term viability of agriculture itself, threatening to render once fertile lands arid and abandoned.

Groundwater Potentials

GWP signifies the estimated probability of a place to gather this vital resource. This estimation arises from precisely modeling the interaction between relevant physiographic variables (e.g., topography, geology) and key hydrologic parameters like subsurface runoff, infiltrations, as well as surface water ponds’ capacity [10,11]. This complex interaction is analyzed by geospatial capabilities like remote sensing (RS) along with GIS. These powerful tools offer a cost-effective and time-efficient approach to assessing and managing this vital resource [12]. Scholars have efficaciously utilized diverse spatio-hydrogeological products derived thematically from RS data to evaluate groundwater potential across various environments [13,14,15,16]. Patterns of Ld are just a few examples of such valuable hydrogeological indices. However, achieving a truly reliable and precise groundwater potential model necessitates the integration of all relevant factors that contribute to groundwater occurrence. This underscores the inherent complexity of predicting groundwater potential, as it encompasses a vast array of possible options and demands the evaluation of multiple interrelated elements [17]. Within this context, the SAW model plays a pivotal role in delineating zones of groundwater recharge based on assigning weights to the various environmental variables, effectively bridging the gap between qualitative and quantitative data. This elegant fusion of OIF and SAW allows navigating the intricate landscape of groundwater potential with unparalleled precision.
Globally, researchers have been actively progressing to precisely explore and delineate the groundwater potential zones from spatial tools. However, the factors influencing these zones are always as diverse as the landscapes themselves [18,19,20,21,22]. Some solely relied on lineament analysis, while others considered other factors including geology, land use, intensity of rainfall, geomorphology, drainage density, soil texture, as well as slope. This necessitates a region-specific approach, as the results are demonstrably variable due to diverse geo-environmental circumstances [19,20,21,22].
GWP assessments have traditionally been carried out over the arid natures of the Middle East and India, typically incorporating separate layers, with at least one for each of the following: recharge from precipitation, infiltration driven by topography, and storage potential based on geological data [23,24,25,26]. For instance, a study conducted by El-Mahmoudi et al. [4] aimed to investigate the underlying aquifer systems within the King Faisal University (KFU) campus in the Eastern Region of Saudi Arabia by employing a multifaceted approach to identify zones of high groundwater potential and guide the strategic placement of wells. Their methodology seamlessly integrates data and techniques from diverse disciplines, including geophysical, remote sensing, hydrogeological, and GIS analyses. Additionally, significant contributions to the field of GWP research have come from researchers in the Middle Eastern areas of UAE and Oman with a focus on numerous investigations [27,28,29,30,31].
However, in spite of the considerable amount of literature on groundwater potential mapping and assessment, there are still important gaps in this information. No study, to our knowledge, has examined and assessed the groundwater potential zones of recharge in the Al-Ahsa Oasis. Most studies, which have conducted in the study area, have been made on groundwater quality; ours was focused on mapping prospect zones for groundwater recharge. Moreover, no study yet has exclusively encompassed 11 independent spatially driven data to model potential groundwater hotspots, nor have they been applied for studying the GWP within the aquifers of the Eastern Regions of Saudi Arabia. Thus, this study aimed to (1) conduct groundwater spatial predictor by mapping GWP zones combining geospatial technologies with GWP models to provide comprehensive insights into groundwater resources, and (2) recognize the optimal parameters leading to groundwater prospect zones by means of a correlation medium as well as OIF. The findings of this study will provide valuable insights to local authorities (e.g., Saudi Irrigation Organization), farmers, interested researchers, investing bodies, and agricultural companies within the surrounding areas, in addition to decision makers in establishing groundwater management and assessment strategies within the study region.

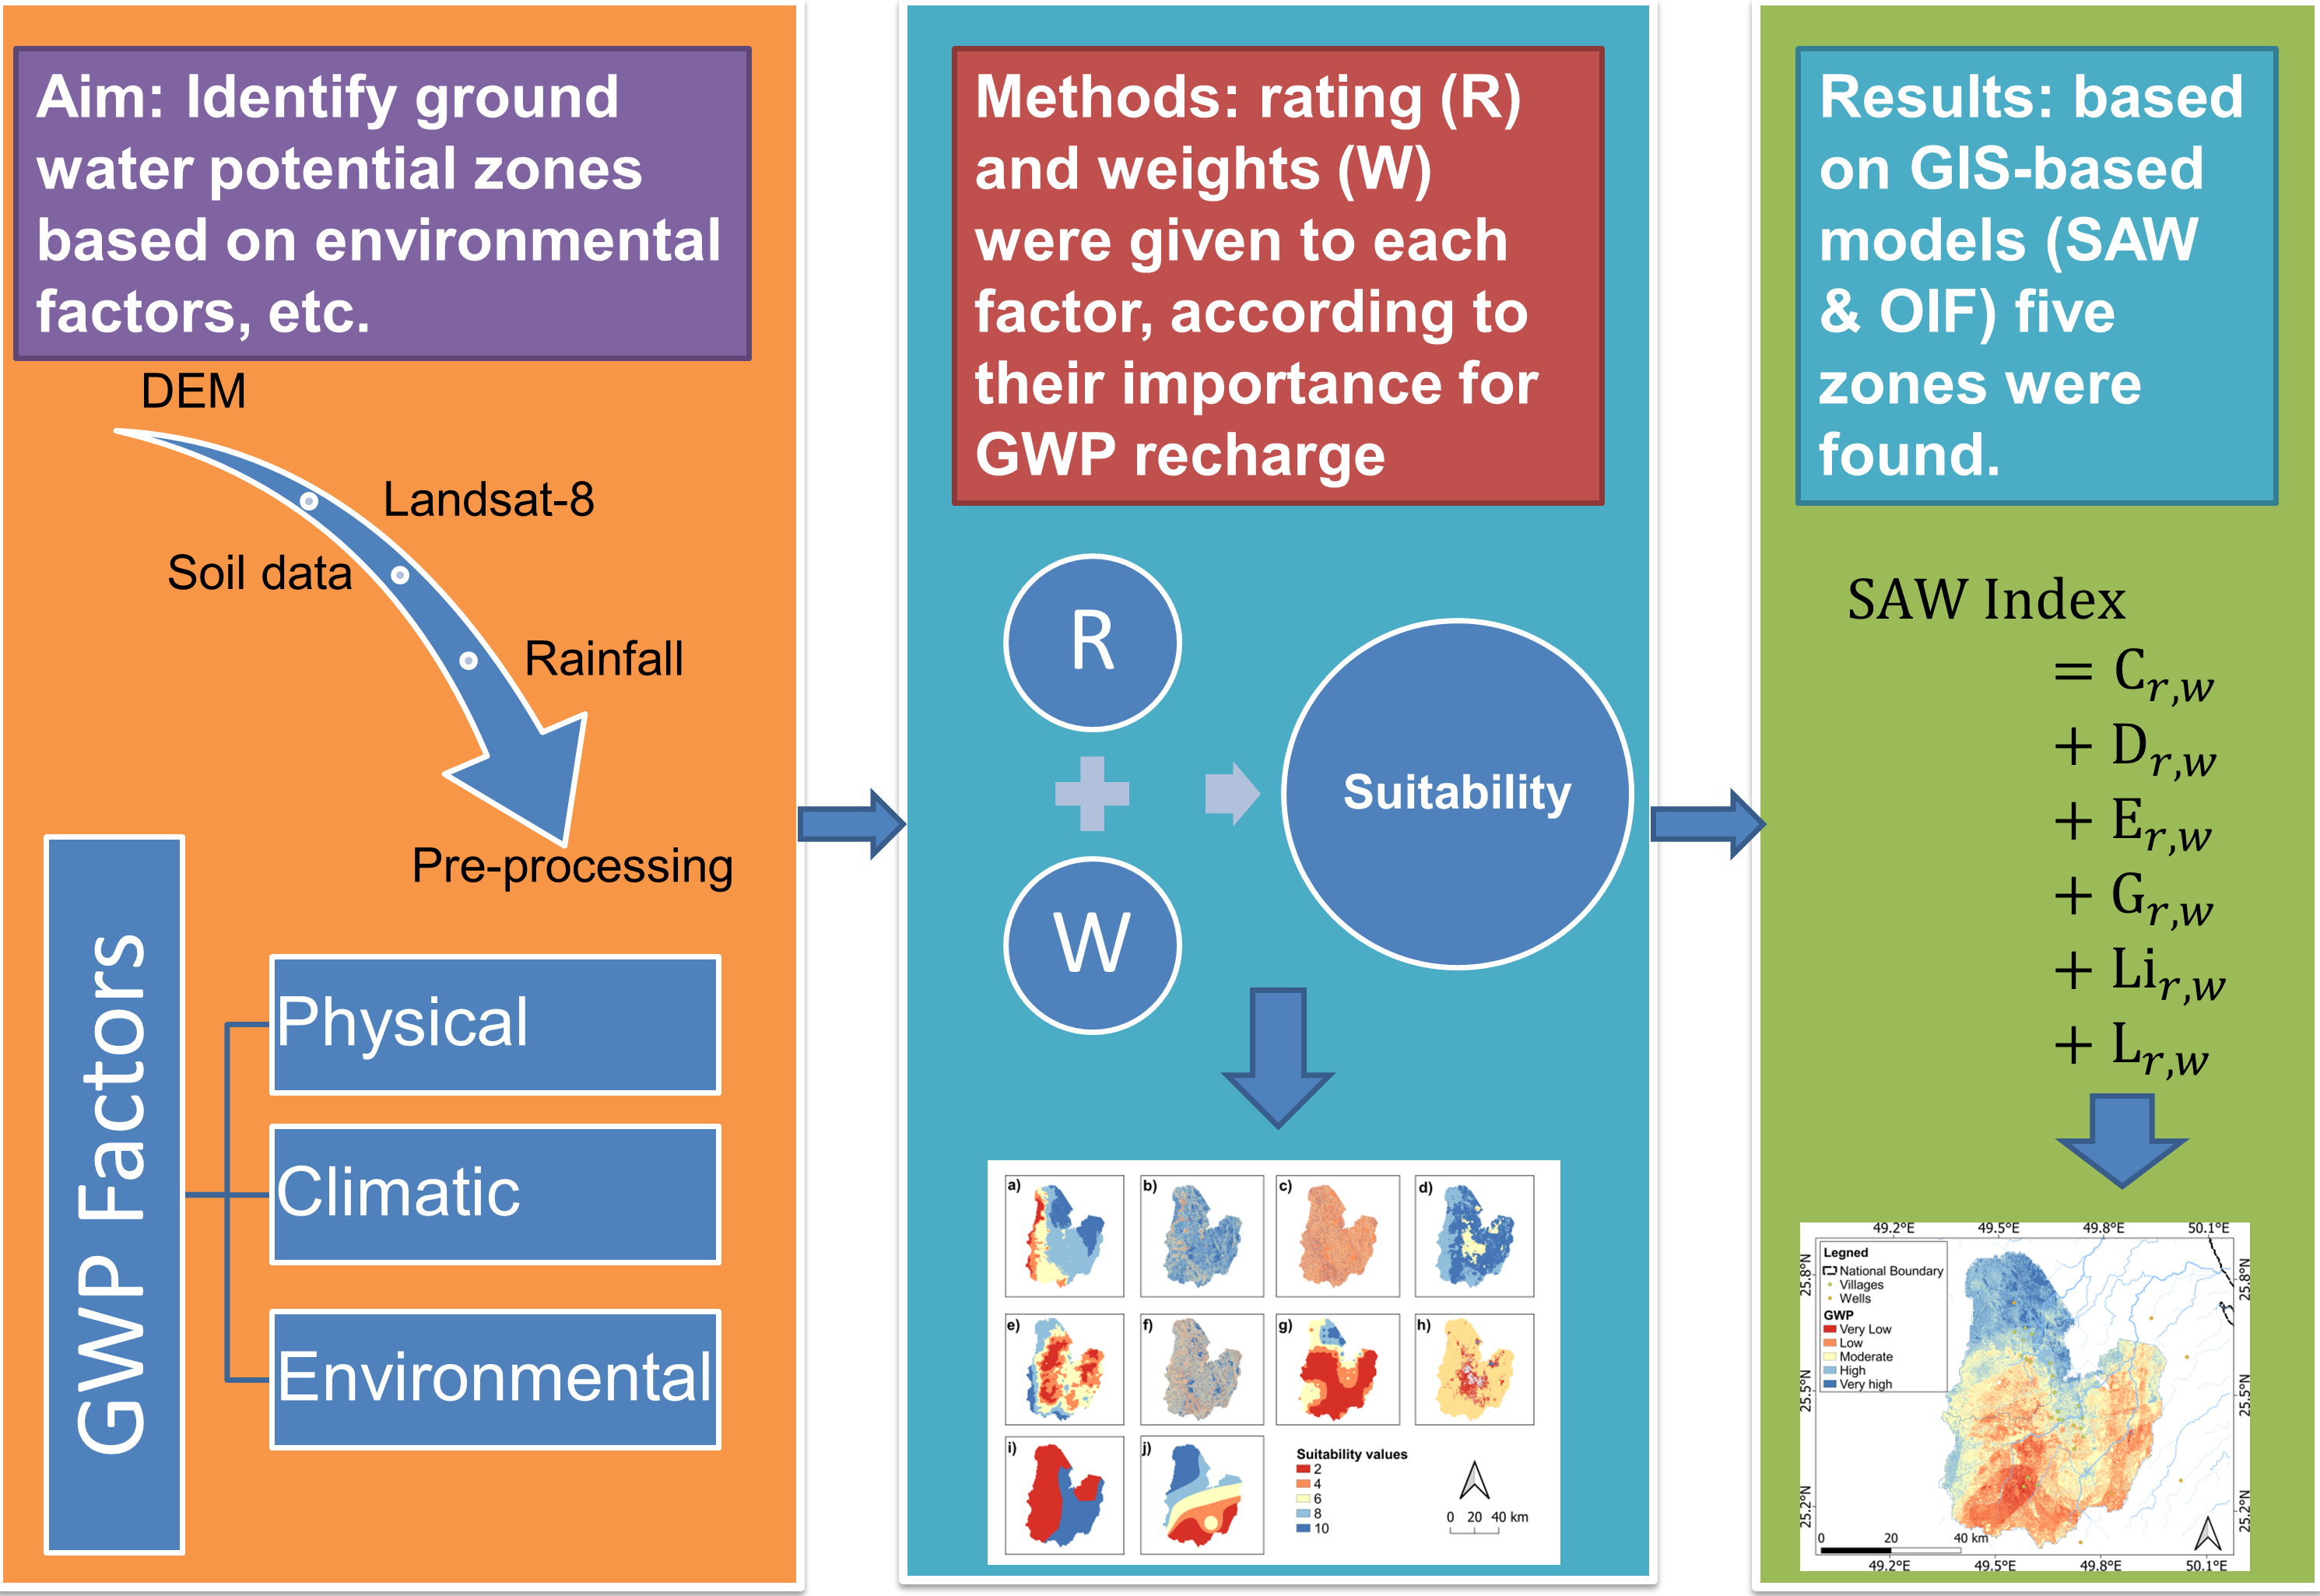
2. Materials and Methods
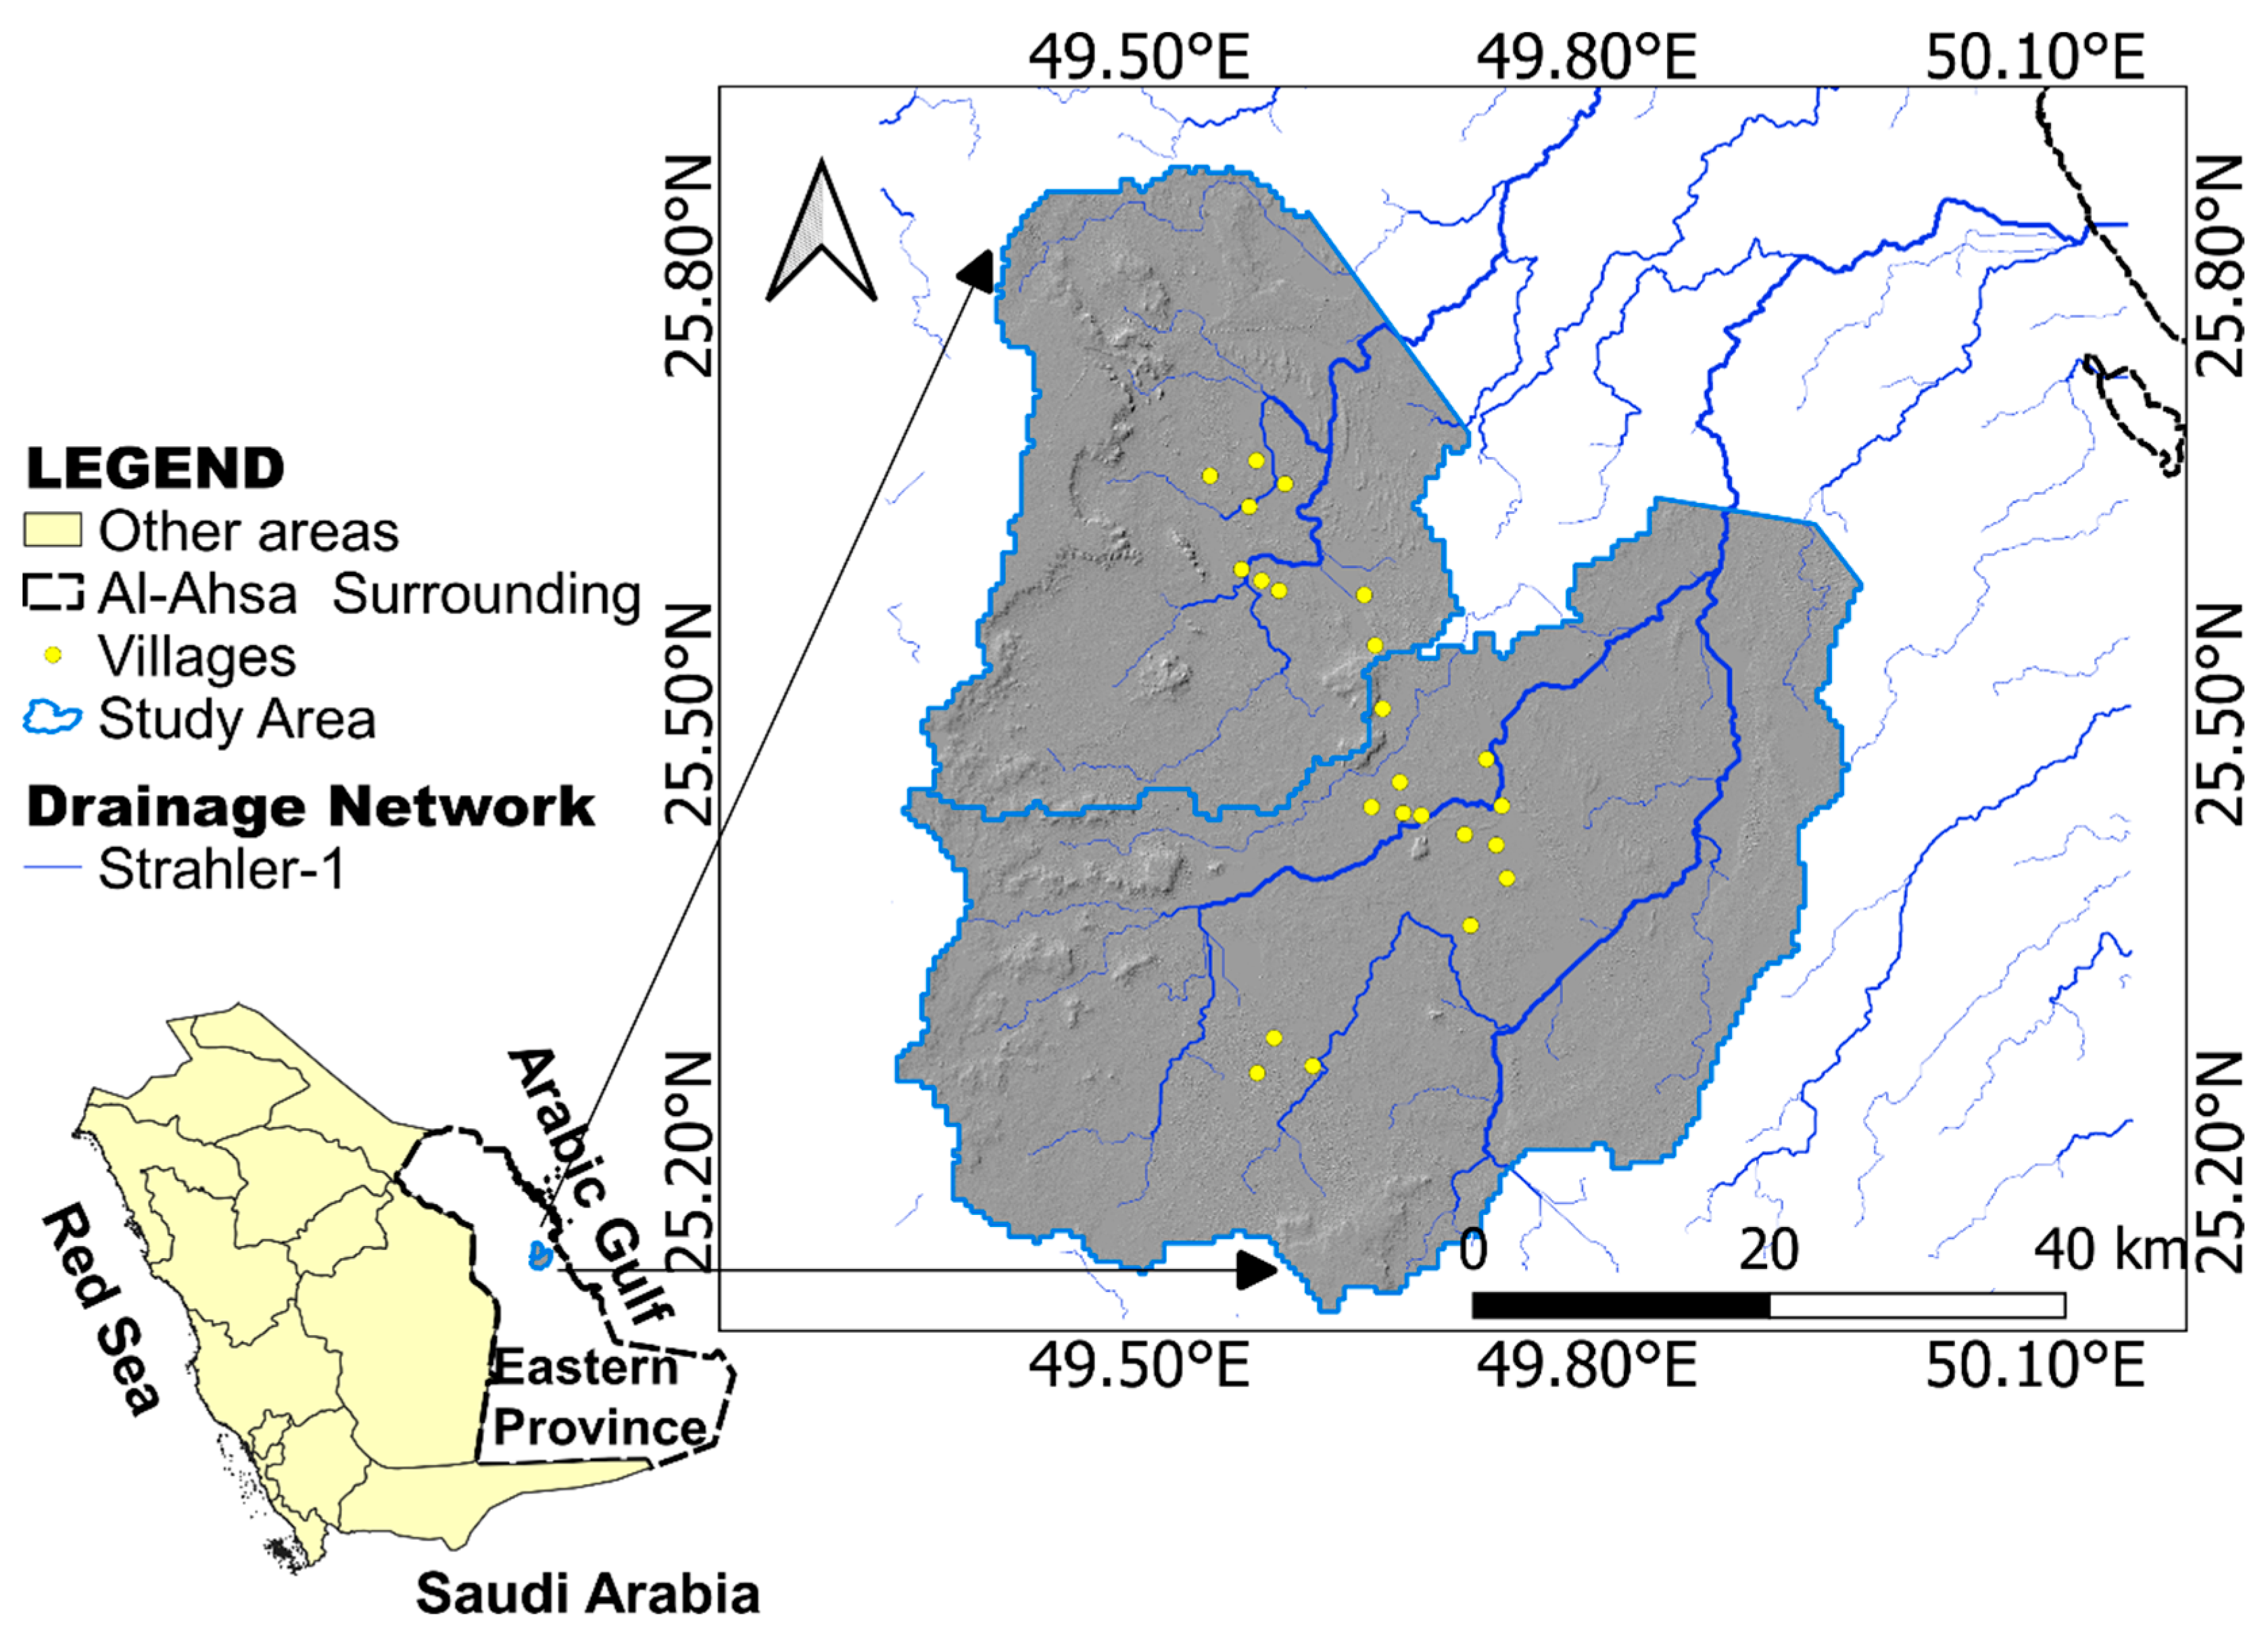
2.1. Study Area

The Al-Ahsa district is situated at approximately 25°–26° N latitude and longitude of 49.30°–50.20° E and is situated roughly 160 km inland from the Arabian Gulf with an area of approximately 3484 km2 (Figure 1). Within this area, Al-Ahsa Oasis exists, which is a prominent example of a natural oasis, ranking among the largest in the world [4]. The oasis’s groundwater supply originates from a complex aquifer system, comprising the Aruma aquifer (AR), Umm Er-Radhuma (UE), Dammam complex (DC) as well as the Neogene complex (Nc) aquifers. In recent decades, the oasis has witnessed a surge in water demand, which was primarily driven by rapid economic growth. This demand has witnessed a notable acceleration post-1975 with groundwater accounting for a substantial portion of the oasis’s water usage. Consequently, groundwater levels have undergone a significant decline, leading to the drying up of renowned springs within the oasis. To meet the escalating demand, the drilling of deeper wells has become necessary. However, this approach was accompanied by a potential deterioration in groundwater quality due to the intrusion of deeper saline groundwater [32].
The aquifer system within the study area exhibits a partially interconnected structure. The UE and DC aquifers are disconnected by the Rus formation, which comprises marls and limestones. The Rus formation usually reacts as an aquitard, forming a barrier between the two aquifers. However, there are instances where it transforms into a combined aquifer, particularly in zones that are characterized by fissured carbonates [4]. The inferior portion of AR strata, predominantly composed of clay along with shale, also serves as an aquitard, preventing hydraulic connection between the aquifer system and the underlying Wasia aquifer. For a graphical outline of the aquifer system for the study area, we refer the readership to the study conducted by Al Tokhais and Rausch [32].
The primary groundwater flow direction within the system of the area’s aquifers is from the western region to the Arabian Gulf. The intricate network of secondary openings within the aquifer system, consisting of joints, fractures, and bedding-plane openings, facilitates groundwater flow with dissolution processes playing a significant role in enhancing their hydraulic conductivity.

2.2. Data Acquisition and Preprocessing

Table 1 shows the processed data for this research and their relative sources aiming to prepare the required work parameters. Eleven causative parameters of groundwater recharge/availability were prepared, containing elevation, slope, curvature, lineament density (Ld), geology, lithology, drainage density (Dd), soil texture, rainfall, land use, and geomorphology. These parameters were selected based on the literature recommendations [33,34,35]. All data were preprocessed using QGIS v 3.18 (open source) software, ILWIS v 3.4 GIS software, and ENVI v 4.8 software. Landsat-8 (OLI) image was carefully preprocessed for atmospheric and radiometric corrections, using SCP’s dark object subtraction method [36] and the “Semi-Automatic Classification Plugin” (SCP) [37,38]. The “gain” and “offset” obtainable from image’s metadata files were applied to obtain a “top-of-atmospheric” (TOA) reflectance. To classify the processed image and obtain the land cover (LC) classes, according to Anderson’s classification Level 1 scheme [39], a maximum likelihood classification algorithm was used. The final map contained six classes, namely: dates palm, cropland, bare land, urban/built-up, natural vegetation, and water bodies. The map accuracy was assessed using the method described previously in Congalton and Green [40] with an overall accuracy of 0.913 and kappa coefficient of 0.778, which is reasonably adequate for the conducted work.
One arc-second “Digital Elevation Model” (DEM) data, with a spatial resolution of 30 m, was utilized in order to extract the hydrological parameters in terms of slope, curvature, TWI, drainage density (Dd), and elevation (m). DEM was freely obtained as a product of the “Shuttle Radar Topographic Mission version 3.0” (SRTMGL1). The applied 1-degree tiles raster scene was downloaded by making use of the Earth Explorer platform (https://earthexplorer.usgs.gov/, accessed on 23 October 2023). In order to enhance the DEM and obtain accurate results, local depressions (sinks) were removed by utilizing the fill tool of ILWIS v 3.4 software program; then, the DEM was further improved using optimization operation. Accordingly, the network of the drainage system was delineated upon computing the flow direction using the 8D neighboring pixels algorithm. Then, the flow accumulation was determined using the hydro-processing tool of DEM. The concrete drainage network was proposed by means of a threshold of >450 pixels (i.e., 0.405 km2).
For reliability, the delineated drainage network was assessed using a sharp image obtained from the Google-Earth Pro platform, as described previously [41], and a satisfactory result was obtained.
The wells location was pending to a vectorization process using table operations (Table to Point Map), and then the coordinate system of the points was transformed into the “projected coordinate system” (WGS 1984 UTM) zone 39N so as to correspond to the rest of the data applied.

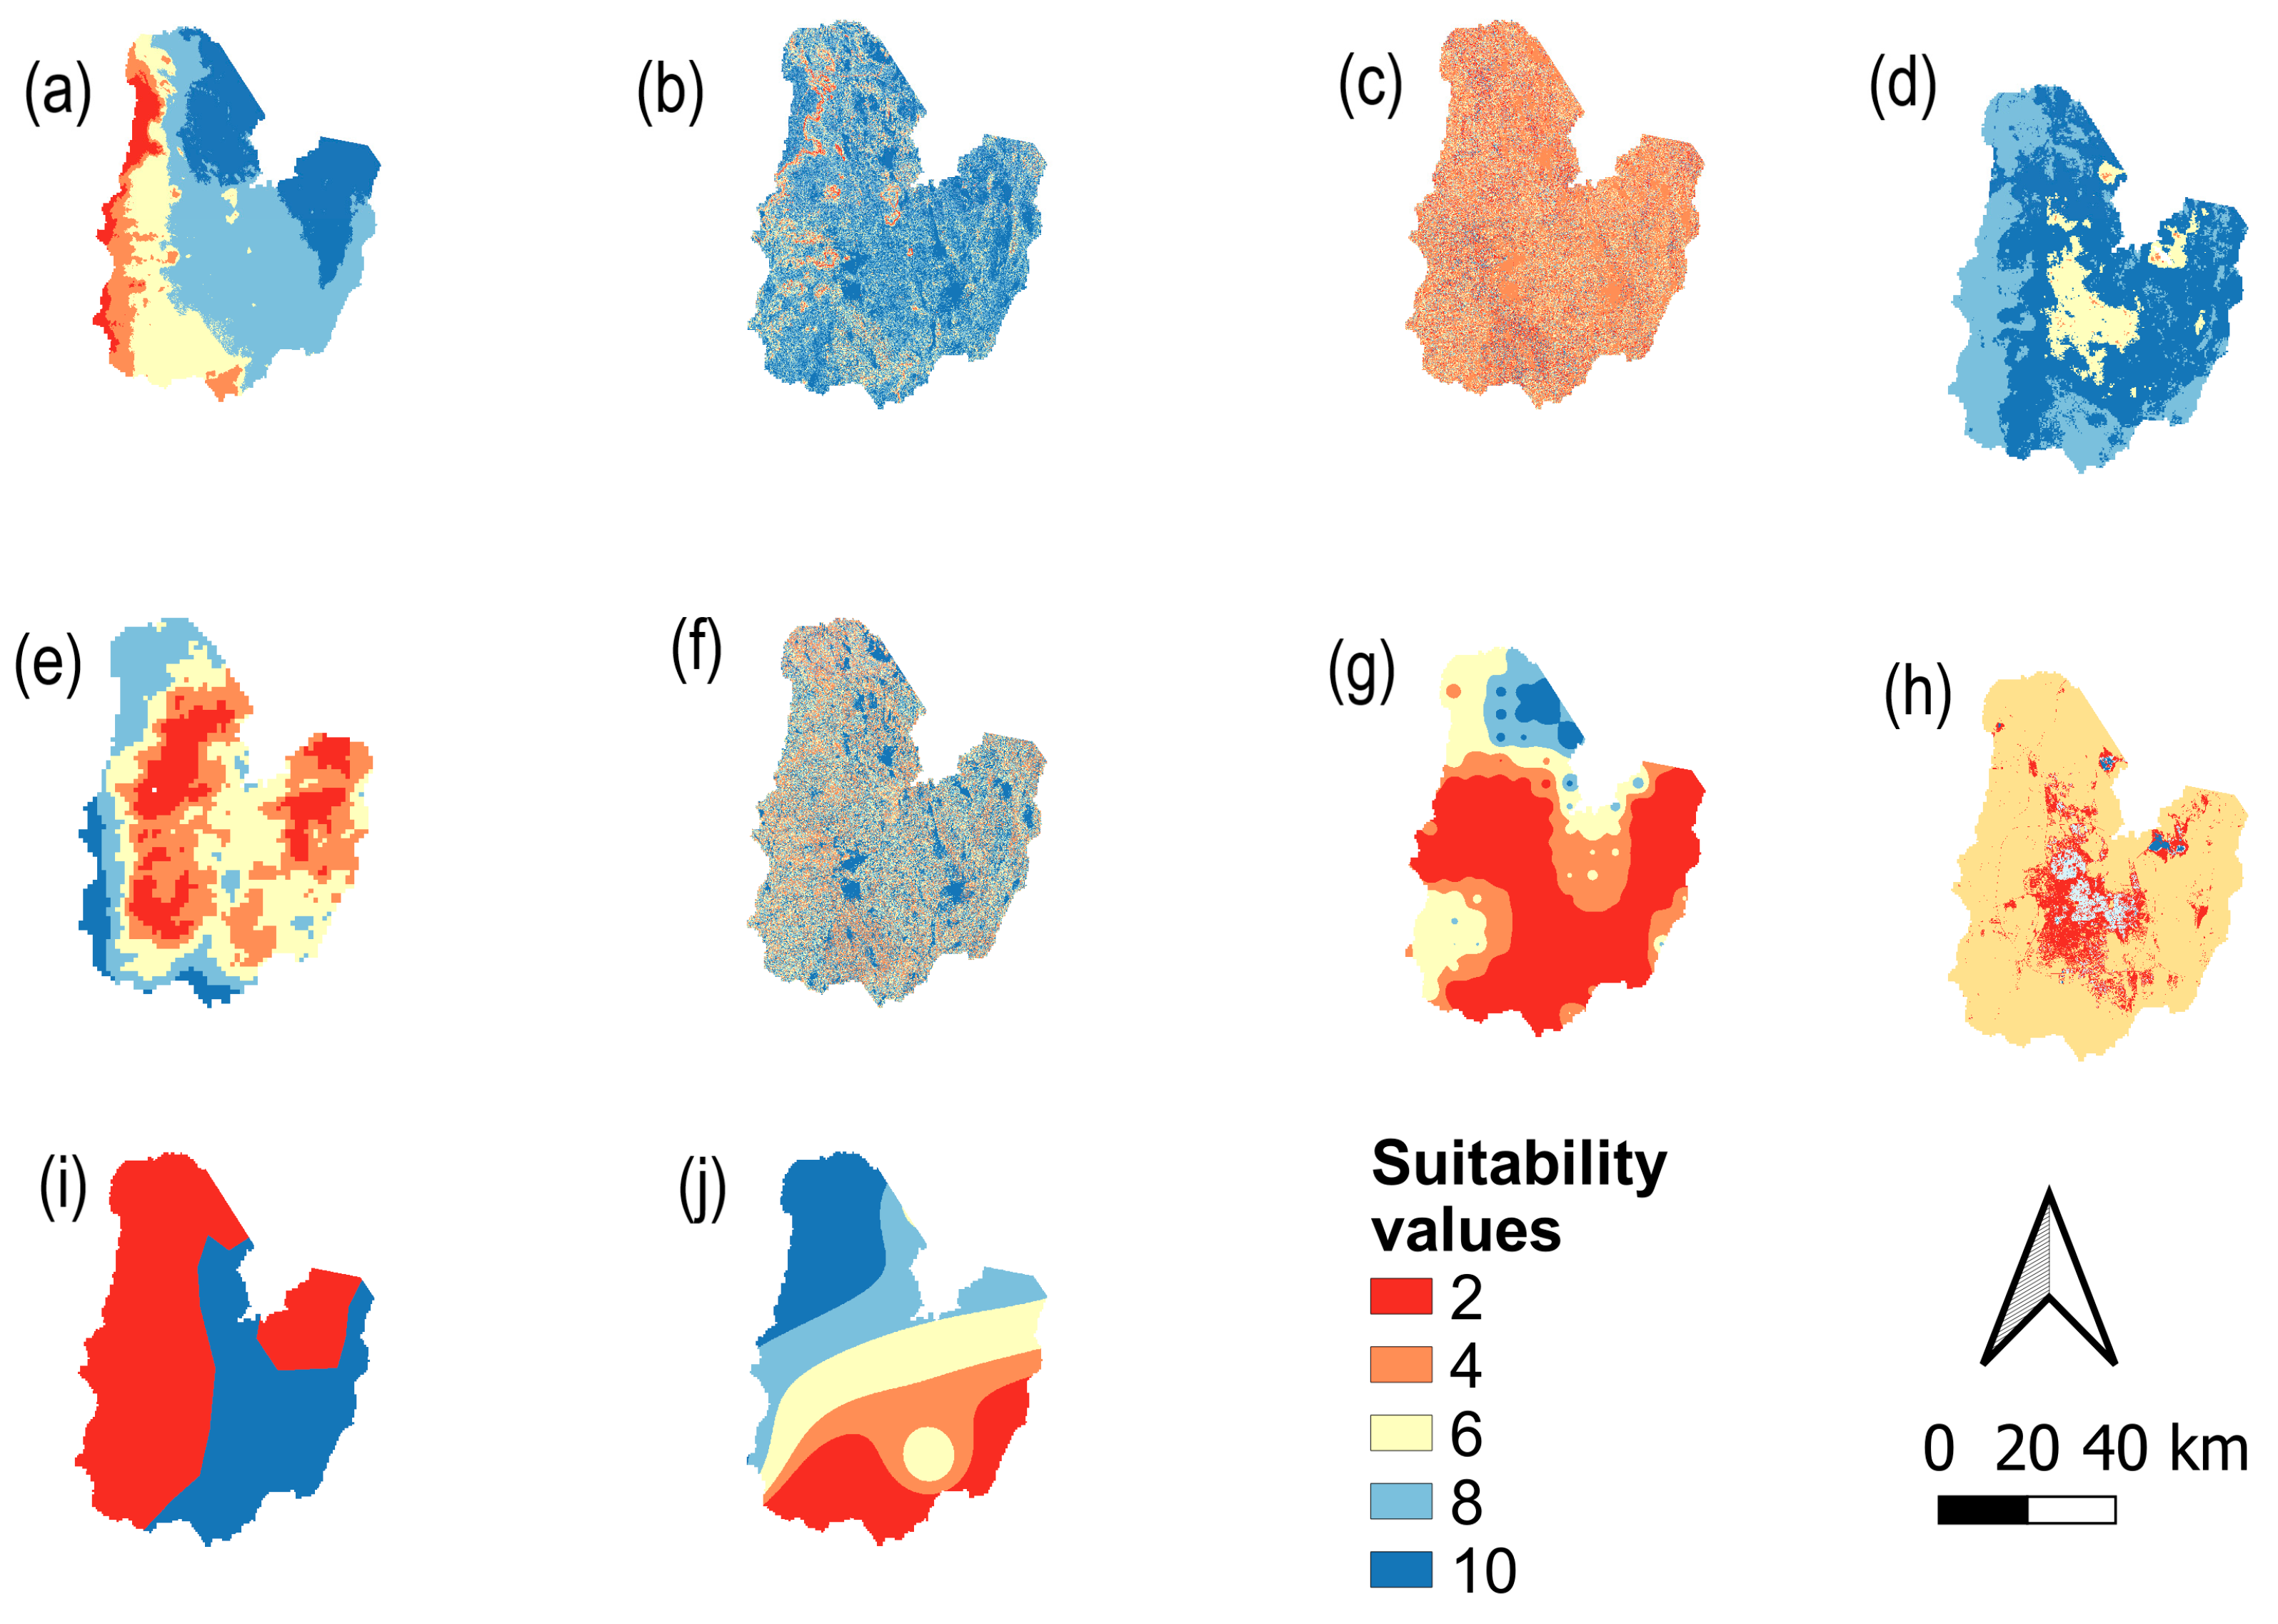
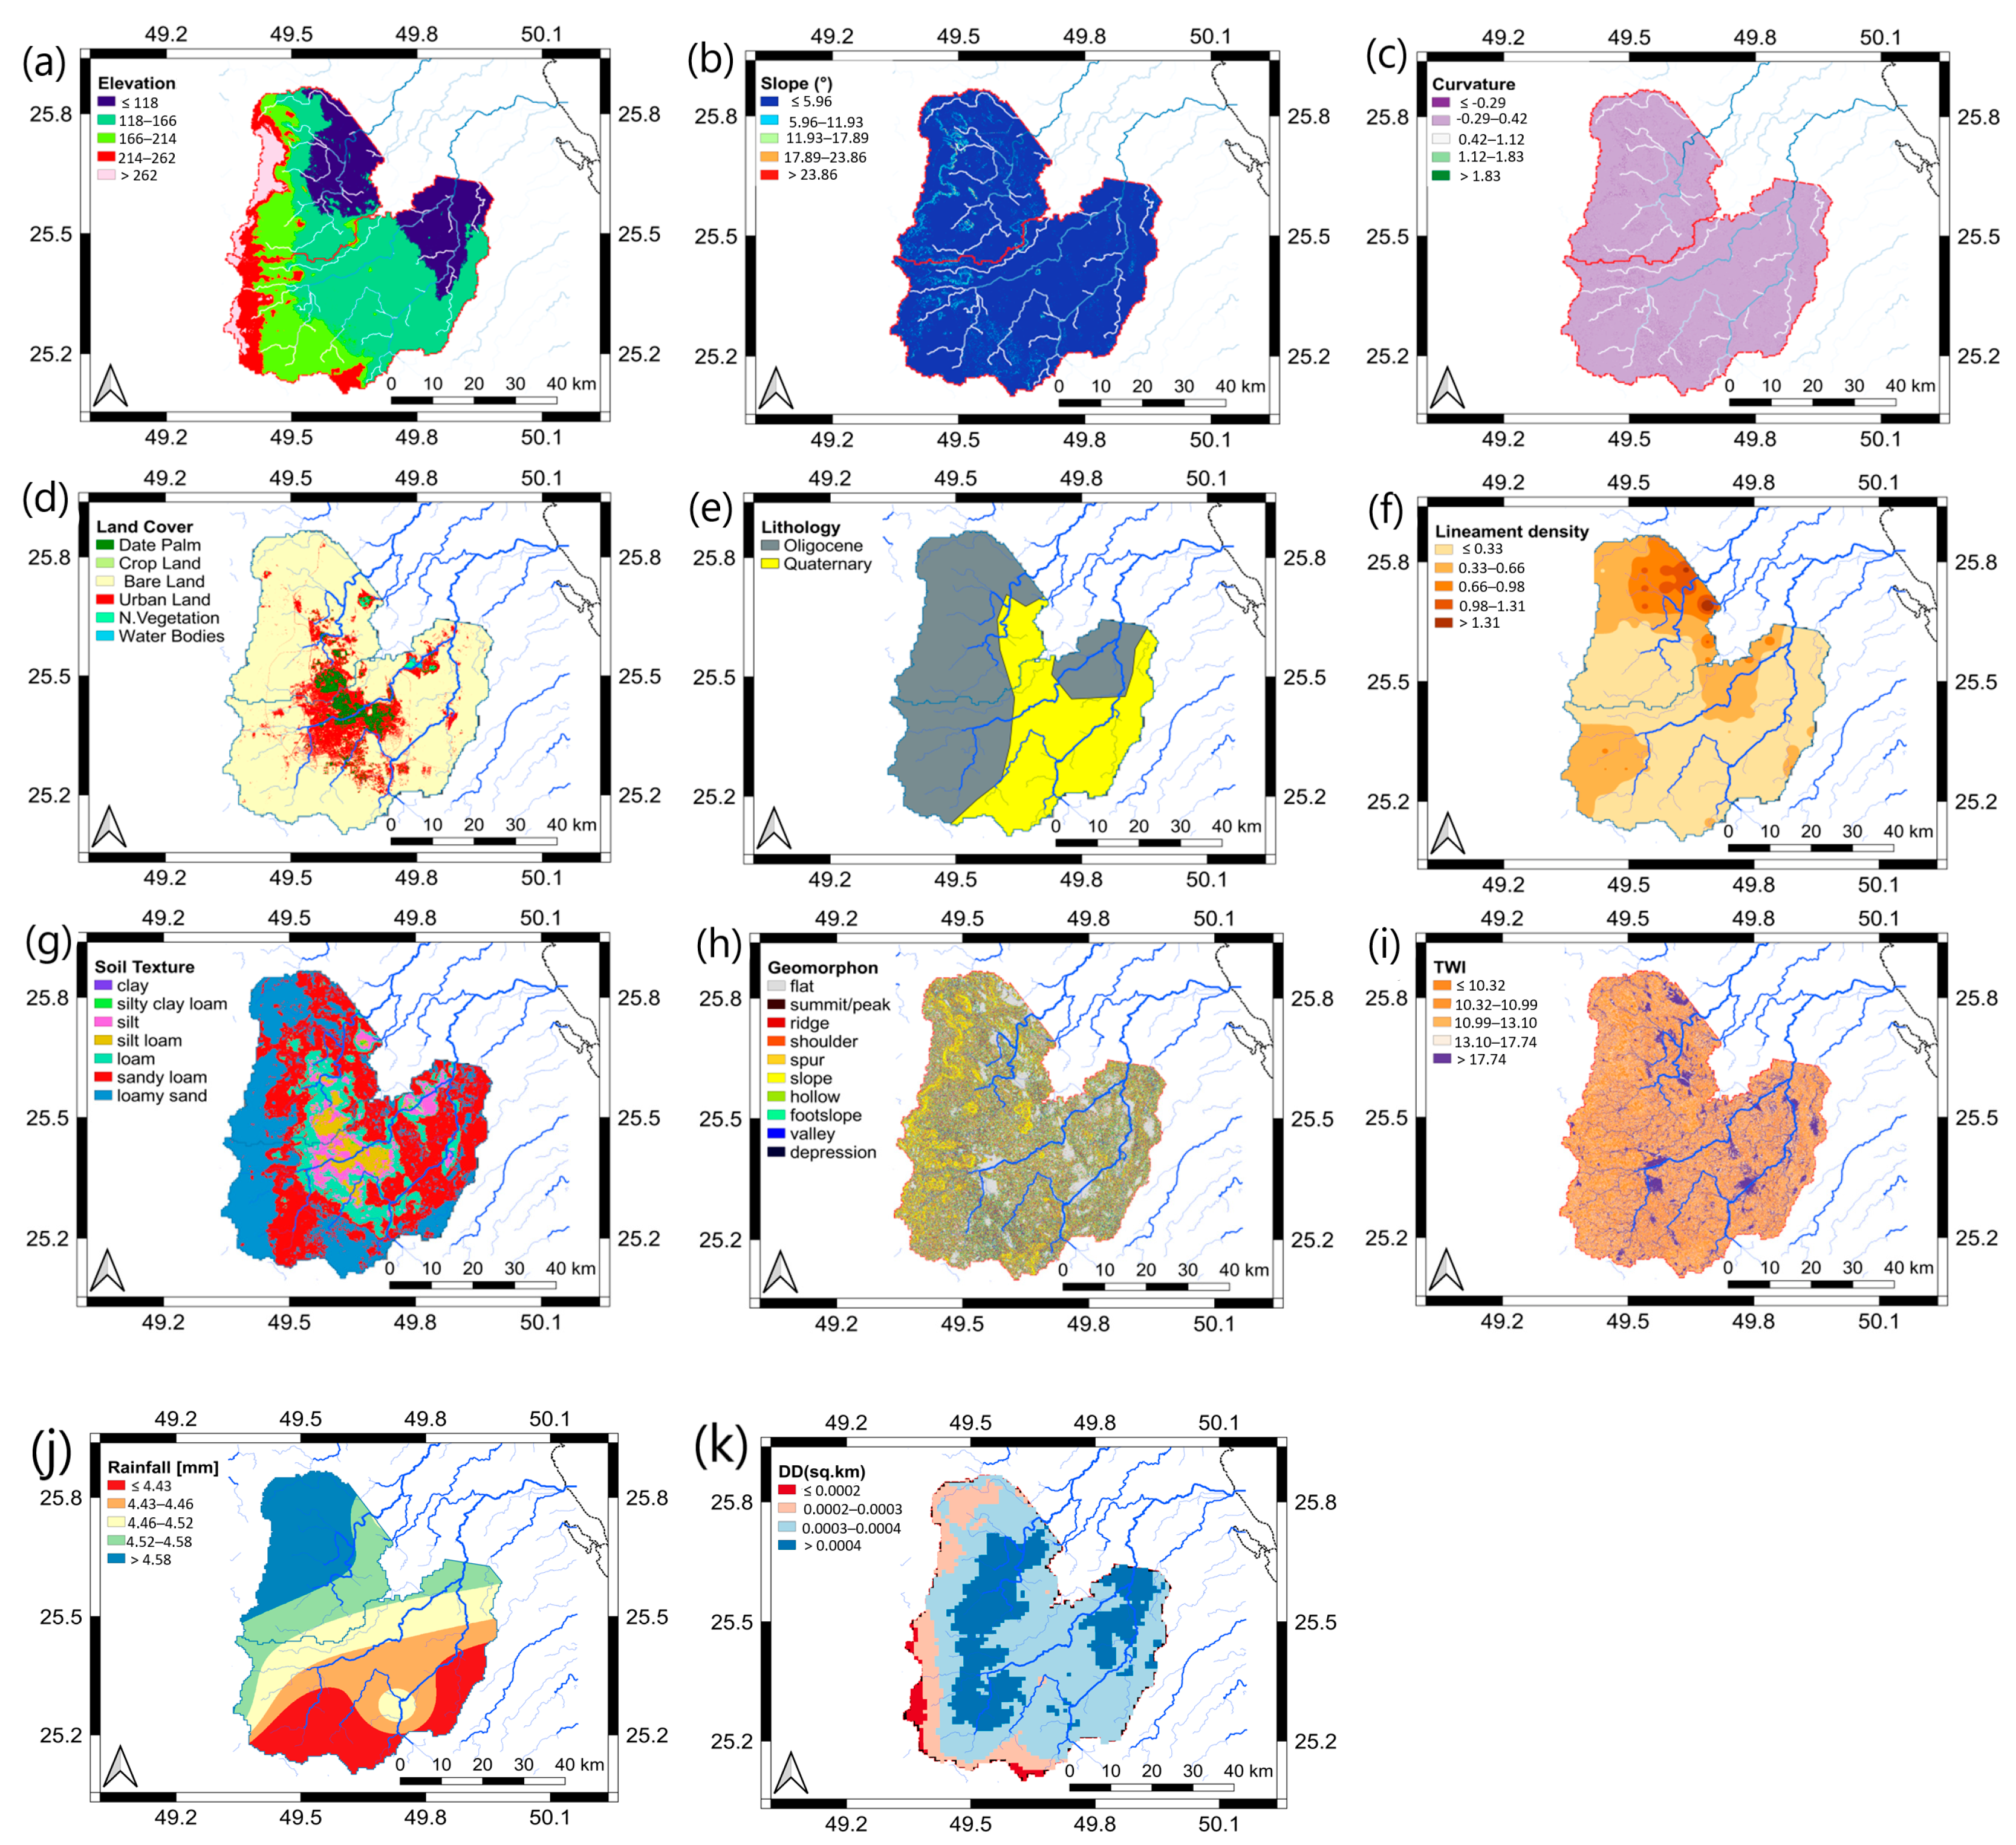
2.3. Applied Physiographic Variables

Selecting the right variables for GIS analysis in groundwater potential assessment demands a delicate balance between relevance, data accessibility, and context. Each variable, like slope, TWI, land cover, elevation, and even rainfall, plays a unique role in influencing the infiltration, storage, and movement of water within the ground. However, the choice of which variables to prioritize depends on several factors. Reliable and high-quality data with appropriate spatial resolution are crucial for meaningful analysis. Additionally, the influence of each variable can vary based on the local geology, climate, and topography as well as the scale and specific research questions of your study. Analytical methods like multi-criteria evaluation or weighted overlay might also impose specific requirements on variable selection. To truly unlock the potential of GIS in this realm, careful variable selection must consider both individual relevance and its integration within a broader analytical framework. Remember, factors like evapotranspiration, soil depth, and even anthropogenic influences can play a crucial role in the complete picture. Ultimately, effective groundwater potential assessment hinges on this meticulous selection, combined with data cleaning, spatial analysis, and validation through field data and expert knowledge.
Eleven key drivers of groundwater occurrence were subjected to cross-correlation analysis and then spatially superimposed upon well locations to facilitate the exploration of potential underlying associations. The applied parameters, which are presented in Figure 2a–k, can be explained as follows:

2.3.1. Surface Elevation

Elevation exerts a significant influence on groundwater potential mapping (Figure 2a), demonstrating an inverse relationship with groundwater reserves [42,43]. So, areas with lower elevations tend to have higher groundwater potential compared to areas with higher elevations. This is because lower elevations allow for more infiltration of water into the ground, which replenishes groundwater supplies. In contrast, higher elevations promote surface runoff, which reduces the amount of water that can infiltrate into the ground.

2.3.2. Surface Slope

Slope shows a substantial control on the infiltration of groundwater (Figure 2b), thereby serving as an indicator for groundwater prospectively. Gentle slopes promote slow surface runoff, allowing ample time for rainwater infiltration. Conversely, steeper slopes facilitate rapid runoff, minimizing the settling time and consequently reducing infiltration [44].
Despite its crucial role in the flow and storing of groundwater, surface slope is regularly disregarded particularly in regions with low topographic relief [45].

2.3.3. Surface Curvature

Surface curvature (Figure 2c), the measure of how much a surface bends or curves, also plays a significant role in determining groundwater potential. It influences the flow of water across the landscape and the amount of infiltration that can occur. Convex areas, which curve outward like domes or hills, tend to have lower groundwater potential. Water tends to flow away from these areas, reducing the amount of infiltration that can occur. Concave areas, which curve inward like bowls or valleys, generally have higher groundwater potential. Water tends to flow toward and accumulate in these areas, increasing the likelihood of infiltration and groundwater replenishment.

2.3.4. Land Cover

Land cover imposes a noteworthy effect on groundwater recharge by modulating infiltration rates and influencing the overall water budget. This factor encompasses diverse elements such as soil types, distribution of settlements, and vegetation cover (Figure 2d), all of which can be effectively interpreted through satellite imagery and dedicated land cover maps. Comprehending LC patterns is crucial for quantifying the water budget, as it directly affects evapotranspiration, runoff generation, and ultimately, the recharge of groundwater [46]. Leduc et al. [47] demonstrated this connection by quantifying the influence of LC and vegetation changes on the recharge of groundwater through observed fluctuations in groundwater levels.

2.3.5. Lithology

Lithology has noticeable effects on the existence as well as circulation of groundwater (Figure 2e). Shaban et al. [48] demonstrated that the rock kind that exists at the surface of the soil substantially influences groundwater recharge. Furthermore, groundwater recharge is affected by lithology by governing the percolating surface water [49].

2.3.6. Lineaments Density (Ld)

A lineament is a linear landscape feature expressing underlying geological structures, such as faults, which are primarily revealed through remote sensing (RS) analysis of fractures or structures (Figure 2f). While both satellite and aerial imagery can capture lineaments, their in situ interpretations may differ. O’Leary et al. [50] defined lineaments as the easy or multifaceted lined appearances of geological features like cracks, faults, cleavages, and numerous discontinuity surfaces, arranged linearly or with slight curvature, as detectable by RS.
Lineament-length density (Ld) (L-1), representing the overall extent of lineaments per an area, can be defined as following [51]:
L d = i = 1 i = n L i A
where i = 1 i = n L i indicates the lineament’s ultimate length (L), while A represents the unit area (L2).
A high value of Ld represents a maximum porosity, hence, it indicates spots with degrees of great recharge potentials of groundwater.

2.3.7. Soil Texture

The nature of the soil plays a pivotal role in determining groundwater storage capacity, as soil properties dictate the area’s permeability [43]. Soil properties exert a significant influence on the interplay between runoff and infiltration rates, ultimately controlling the degree of permeability, which governs an area’s groundwater potential [52]. Notably, soil texture serves as a medium influencing groundwater vulnerability (Figure 2g), which is a crucial parameter in determining intrinsic vulnerability.

2.3.8. Geomorphology

The geomorphology of an area might comprise diverse landforms as well as tectonic structures, many of which possess advantageous characteristics for groundwater existence [44]. These units are classified based on their groundwater potential and have been delineated from remote sensing data (Figure 2h).

2.3.9. Topographic Wetness Index (TWI)

TWI provides spatial insights into saturated zones within the watershed (Figure 2i). This index quantifies the influence of topography on water accumulation within a region [53]. Consequently, areas with steeper slopes and higher elevations tend to exhibit greater runoff, leading to reduced water accumulation potential. Conversely, low-lying areas demonstrate a higher potential for topographic wetness, meaning they are more likely to accumulate water. For TWI extraction, slope degrees in addition to the maps of flow accumulation were used as input factors according to Beven and Kirk’s equation [54]:
T W I = l n α / t a n β
where α represents the local upslope area draining through a certain point per unit contour length, and tan β represents the slope’s angle for the specified pixel.

2.3.10. Rainfall

Precipitation constitutes the primary natural source of groundwater recharge (Figure 2j), instantly influencing the rate of infiltration [43]. Rainfall directly dictates the volume of water infiltrating the soil and percolating into the aquifer system. The intensity and duration of rainfall events also play a noticeable role.

2.3.11. Drainage Density (Dd)
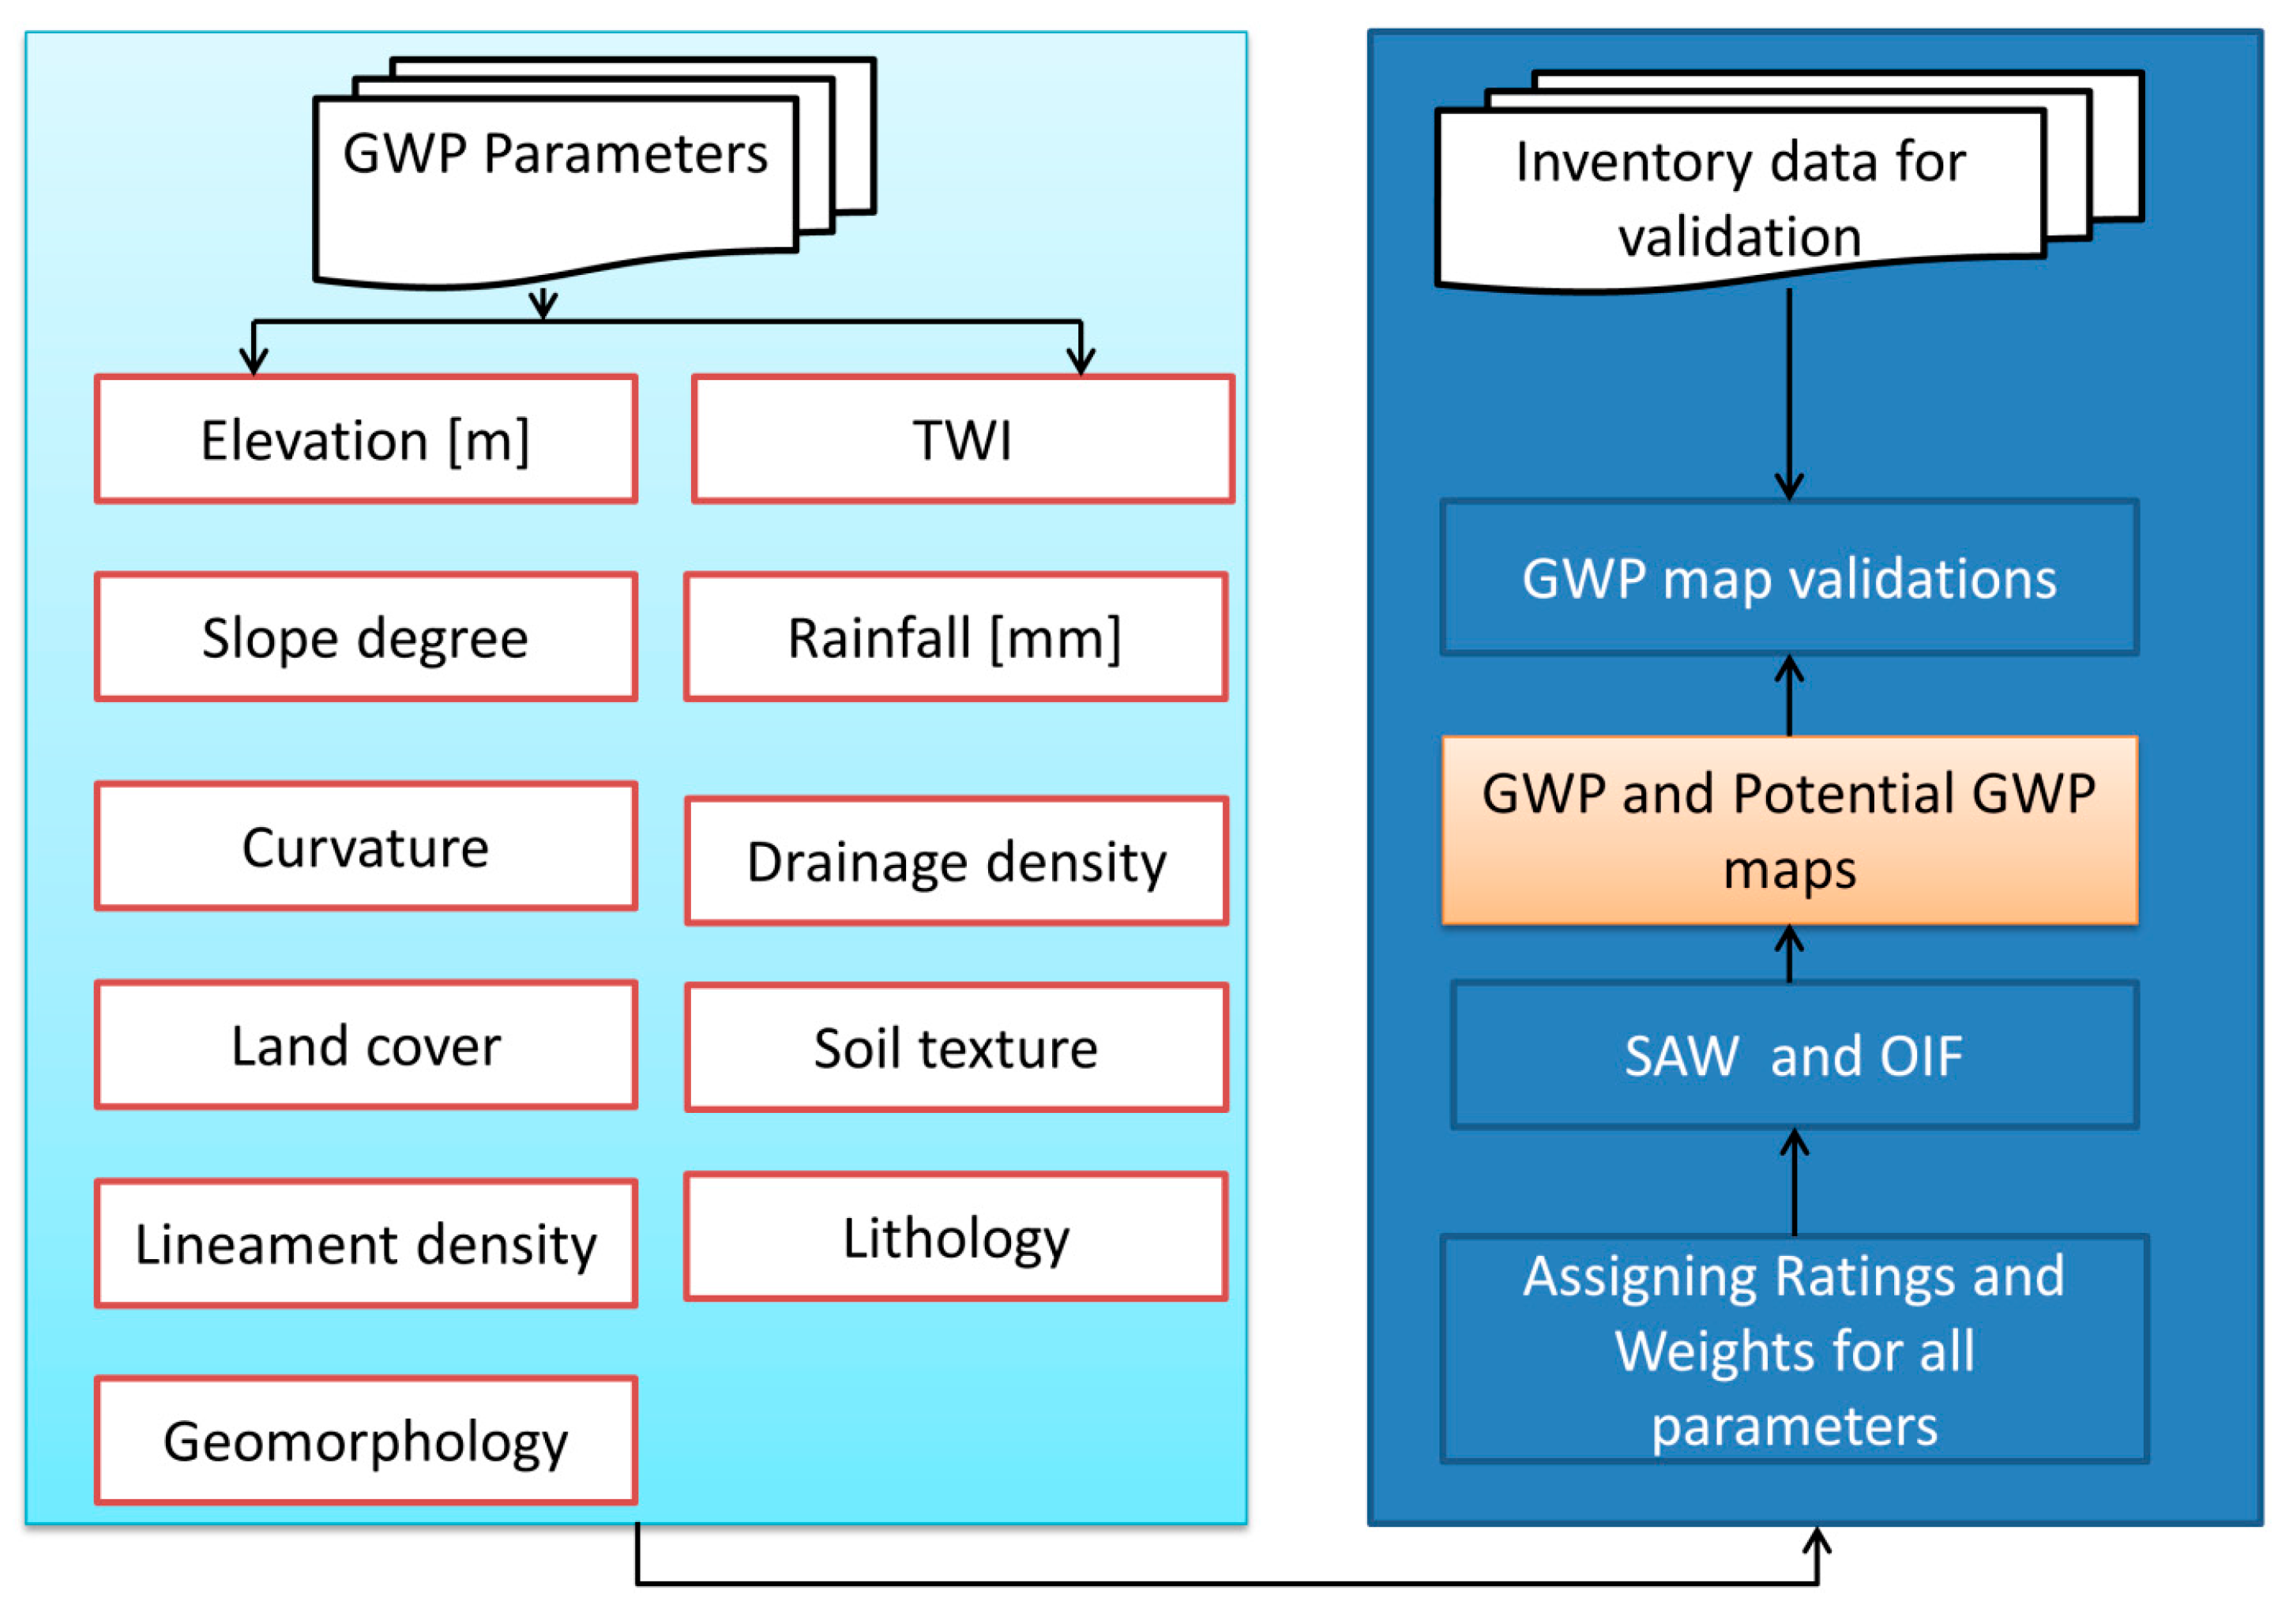
The drainage pattern serves as a window into both surface and subsurface characteristics. Drainage density, measured in km/km2, indicates the proximity of channels and reflects the surface material’s permeability [44]. Higher densities correspond to greater runoff, suggesting limited infiltration. Conversely, lower densities imply reduced runoff and higher potential for recharge, making them indicative potential groundwater zones (Figure 2k). The drainage-length density (Dd) introduced by Greenbaum [51] signifies the entire stream channels length per unit area and is calculated as follows:
D d = i = 1 i = n S i A
where i = 1 i = n S i indicates the drainage ultimate length (L), while A represents the unit area (L2). D d is corresponding to groundwater recharge: an area having a higher D d has the potential to have higher levels of recharge. Some researches combined lineaments along with drainage in order to deduce zones of groundwater potentials [48].
Rating and weights were assigned for all model parameters and their significant classes, as shown in Table 2. The ranks and weights assigned to each parameter and class were in the range of 1–10 showing their comparative significance (Figure 3).

2.4. Methods

2.4.1. GWP Map

Upon assigning equal weight to all parameters (cf: Table 2 and Figure 3), an SAW approach, which is a quantitative index-overlay method [33], was used to establish the GWP map. The SAW examines the effect of parameters through a linear function (combination) and then computes the overall GWP according to the following equation:
G W P   I n d e x = C r , w + D r , w + E r , w + G r , w + L i r , w + L r , w + R r , w + S l r , w + S r , w + T r , w
where C, D, E, G, Li, L, R, Sl, S, and T are the ten parameters used to compute the GWP map, while r and w are subscripts indicating ratings and weights, respectively. The approach was chosen considering many concerns. SAW applies an enormous quantity of variables in order to calculate the GWP index, which guarantees the optimum results. It is based on numerical ratings and weight globally applied, which makes this approach appropriate for generating a regional GWP map. In addition, datasets required for the approach’s parameters are obtainable in the right format. To analyze the data implemented in the GWP index and generate a GWP map, we used the “Integrated Land and Water Information System” (ILWIS 3.4) software.

2.4.2. Potential GWP Map

Numerous GWP factors are spatially invariable, which implies that their contribution to the overall GWP disparity is very weak, and this may influence the consistency of the calculated index. Therefore, in this section, we addressed this concern by suggesting an approach oriented to determine the optimum arrangement of three GWP factors that could precisely produce the highest amount of information to generate a potential GWP index for the best depiction (at most) of the actual situation of groundwater availability and recharge in the study site. For this, we used the OIF along with the correlation matrix of the statistical package available at the ILWIS 3.4 software [55]. Originally, OIF was an arithmetical index established to select the best combination of bands (RGB, 3 layers max) of satellite images exhibiting minimal redundancy and maximizing information content [55].
O F I = S t d i + S t d j + S t d k C o r r i , j + C o r r i , k + C o r r j , k
where Stdi,j,k represents the standard deviations for each of the 3 valued parameters, and Corri,j,k represents the rated parameters correlation.
We used the correlation matrix operation [55] in order to calculate the correlation coefficients between the used GWP parameters. Two steps were followed to compute the correlation coefficients: initially, a matrix of covariance combining the entire GWP parameters was established, then secondly, the covariance matrix components were standardized through applying Equation (6).
C o r r b 1 , b 2 = C o v a r b 1 , b 2 V a r b 1 × V a r b 2
where C o v a r b 1 , b 2 represents the calculated covariance for the two parameters (layers 1 and 2), and V a r b 1 , b 2 represents the variance within the 1st and 2nd parameters. Thus, we assumed that the majority of the GWP factors were spatially constant and interrelated with little contribution to the variance in the potential groundwater recharge in the study site.

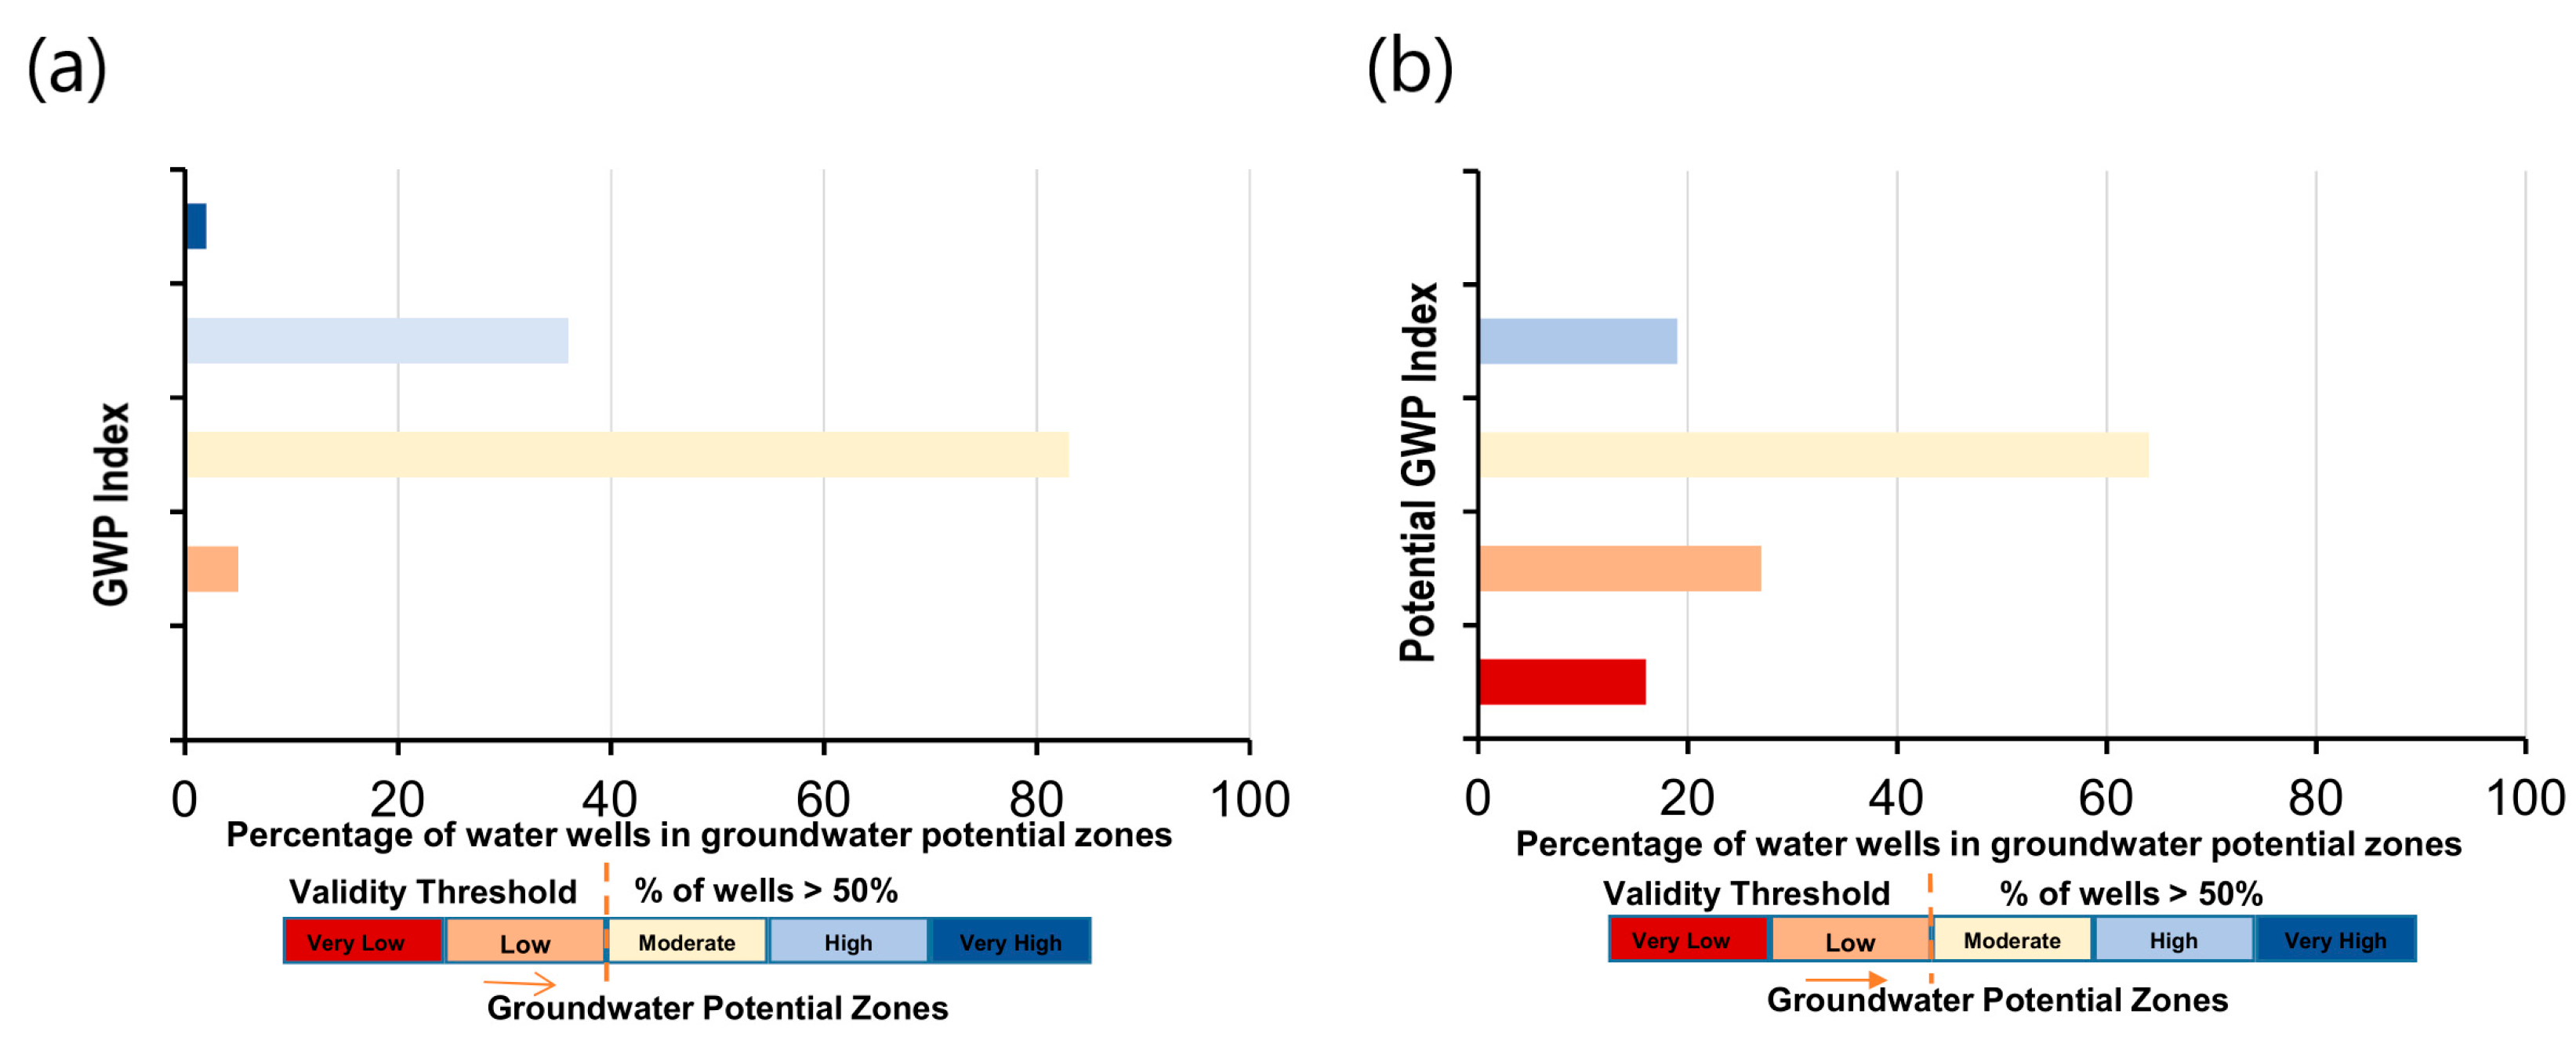
2.4.3. Accuracy Assessment of the GWP Maps

Aiming to validate the obtained GWP maps, the available groundwater wells (vectors file) and frequency ratio approach were used in order to spatially link the wells to the classes of GWP map so as to calculate the frequency (density) of wells allocation inside every class. To achieve so, well sites were primary rasterized, and then the acquired GWP maps were utilized to overlay the rasterized ones. In this operation (i.e., overlay analysis), both maps’ pixels were combined at the identical positions. Thus, the results were documented and tabulated with as a cross-table [55]. From the obtained cross-table, pixels (points) within each GWP class were obtained by using a table aggregation function. The GWP maps were considered valid when approximately 50 percent of the well sites were located to the “moderate” and “high” GWP maps classes. In other words, when 50 percent of the historical points (wells) occurs on the “moderate”, “high”, or both GWP maps classes, it mean that the groundwater index is accurate and yields satisfactory results. Figure 4 shows the flowchart of the adopted methodology for GWP mapping.

3. Results

Two dissimilar maps for GWP were generated: the SAW map (Figure 5a) and the potential GWP map (Figure 5b). Hence, a proportional analysis was carried out between the acquired maps for the approach results’ validation and confirming the spatial distribution of GWP zones, as they connected to the used parameters.

3.1. GWP Mapping Methods Performance

For more consistency, it was essential to authenticate the acquired GWP maps. Accordingly, the first step followed for producing the GWP map was to assess its fitness and dependability through utilizing a validation approach. Figure 6a,b shows the well’s frequency ratio (wells density), calculated through the “cross-overlay analysis” process, that has arisen within every GWP class within every GWP map. Both maps demonstrated a moderate level of agreement with the delineated GWP zones, exceeding the specified threshold by a significant margin. Moreover, over 50% of the ‘good’ points fell within the moderate GWP zone, further corroborating this observation. In terms of concordance for the ‘moderate’ GWP class, both maps yielded acceptable results. The GWP map showed a 66% correspondence with the moderate zone (Figure 6a), while the potential GWP map exhibited a 51% correspondence (Figure 6b).
The ‘high’ GWP class demonstrated acceptable levels of agreement for both maps. As shown in Figure 6a, 29% of points on the GWP map coincided with the ‘high’ zone compared to approximately 15% for the potential GWP map (Figure 6b). The overall performance of both maps is noteworthy with 95% of points falling within the moderate and high GWP zones, while only 5% reside in the very poor and poor zones (Figure 6a). For the potential GWP map (Figure 6b), about 66% are positioned within the ‘moderate’ and ‘high’ areas. In contrast, only 34% of the points are situated in the very poor and poor zones. Additionally, the analysis revealed that the frequency ratio (density) within the study area exhibited variations between the moderate and high zones.

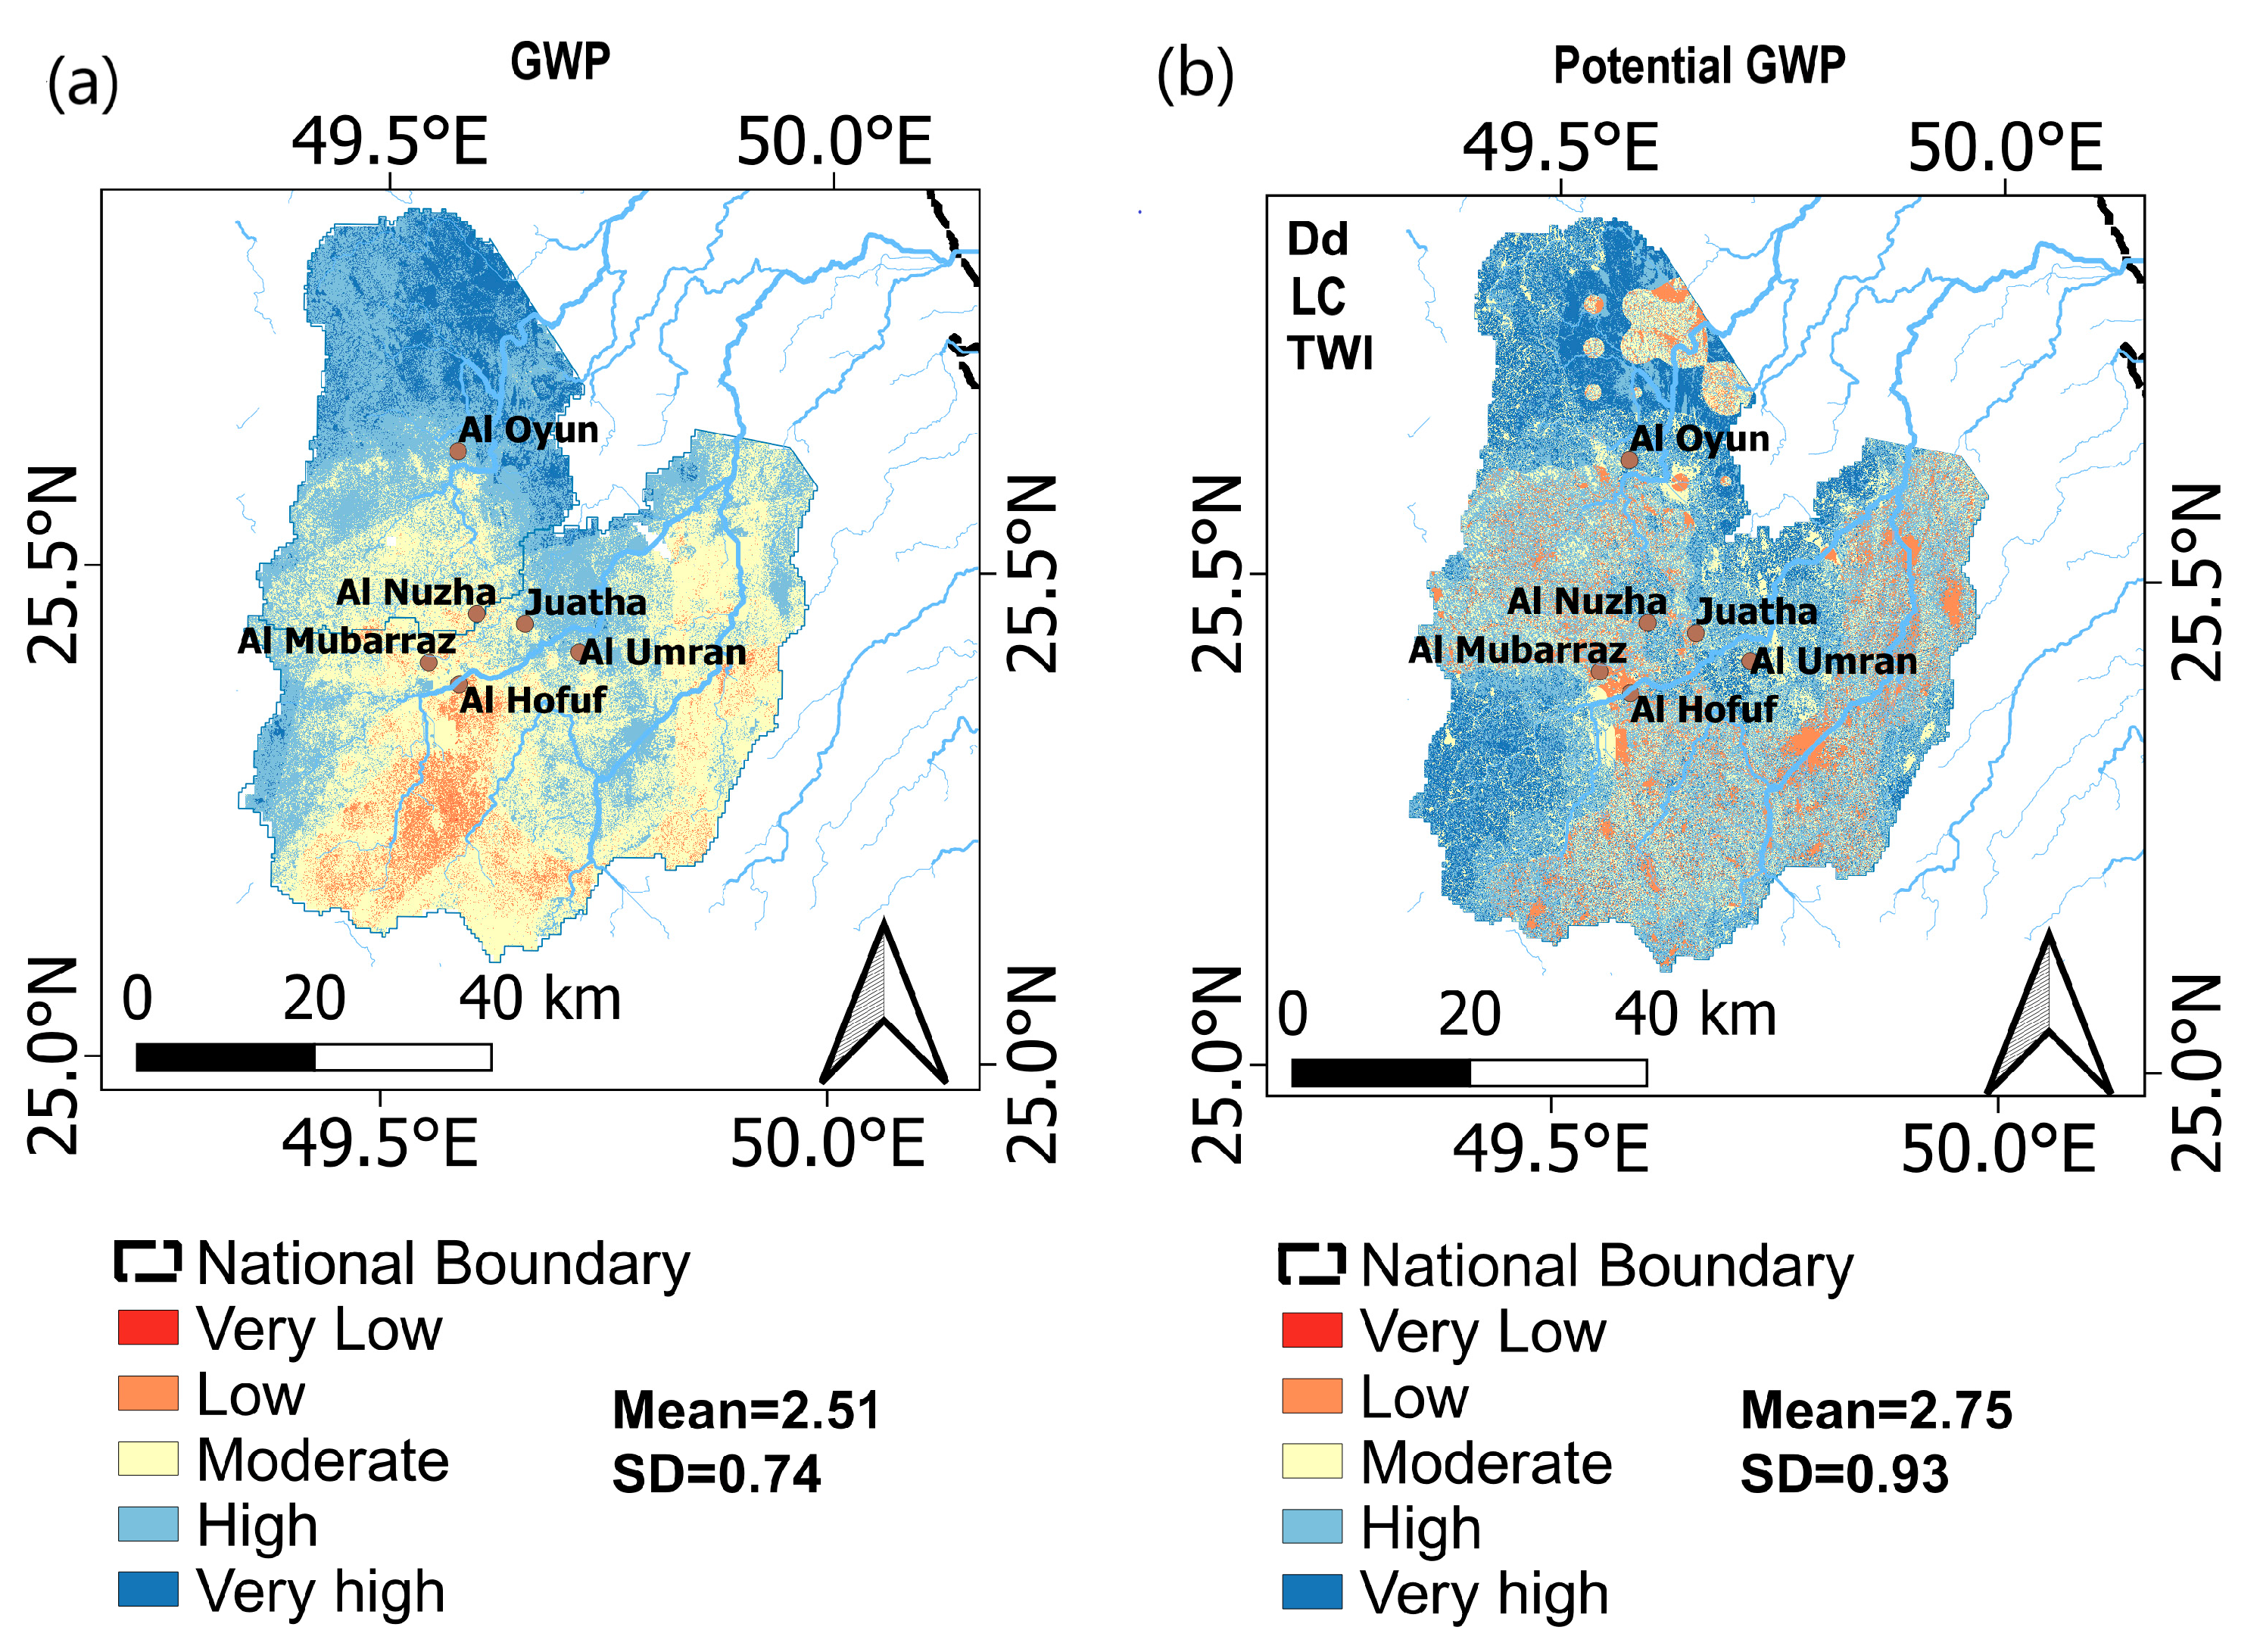
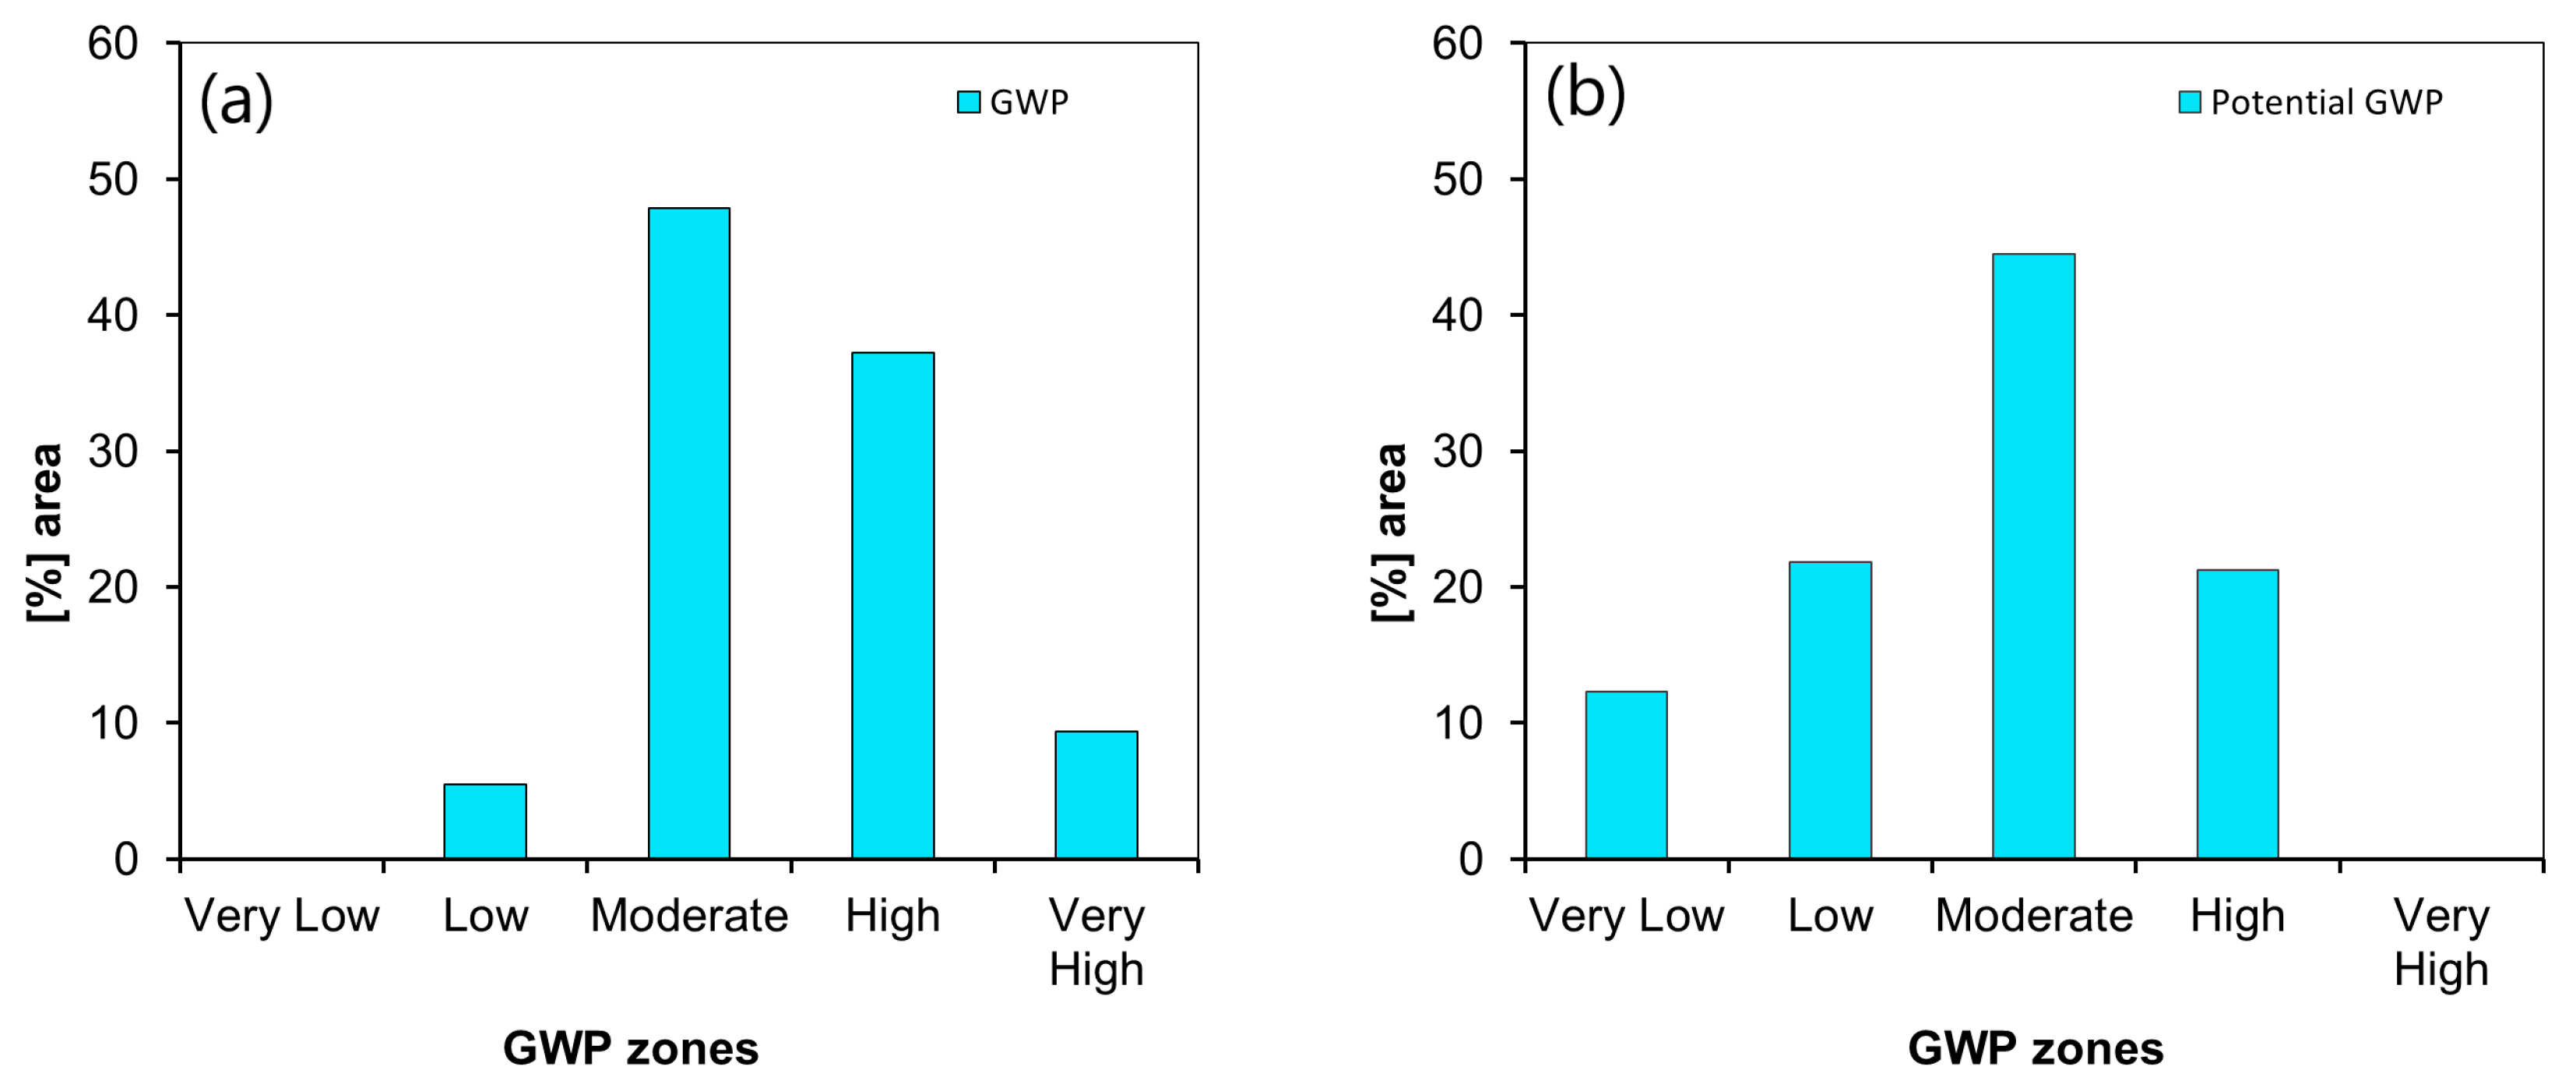
3.2. Distribution of GWP Zones

Five groundwater zones were identified in the study site, including ‘very low’, ‘low’, ‘moderate’, ‘high’, and ‘very high’ (cf. Figure 5a,b). A visual representation of the spatial distribution of these zones is provided in Figure 7a,b. The bars of Figure 7a,b show significant differences between the original GWP and the potential GWP zones. Both maps have highlighted the “moderate” and “high” GWP zones as dominant in the study site. Furthermore, the two models have indicated that nearly 50% of the studied site was characterized by “moderate” zones with an area of approximately 48% (1637.93 km2) for the original GWP map and 45% (1547.3 km2) for the potential GWP map. By referring to Figure 5a, the “moderate” zone is concentrated in the three main parts: the southern, eastern, and western areas of the study location. Whereas, according to Figure 5b, it is noticed mostly in the northern study location. The main directions of the stream network at the study site follow the above-defined directions, where they discharge into existing lakes located at the north and east of the study site [56]. Overall, the ‘low’ and ‘very low’ zones accounted for only 6% of the total area, according to Figure 5a, and for 34% of the total area, according to Figure 5b.
According to the OIF results, the potential GWP was calculated based on three factors, namely Dd, LC, and TWI. As these parameters had the lowest correlation and the highest amount of standard deviation, generally, they have revealed a different form of spatial disparities of groundwater recharge in the area. As expected, the original GWP revealed more spatial variability than the potential GWP (STD = 28.35 and 0.74, respectively). It is important to emphasize that the proposed GWP methodology is appropriate for assessing the relative potential for groundwater resources within the study area rather than the potential (absolute) GWP index.

3.3. The Significance and Relative Contribution of Parameters Concerning GWP and Potential GWP

In this study, eleven parameters were used. However, one factor, i.e., geomorphology, was excluded from the analysis because of its significant correlation with the land cover factor (r > 0.80). The mean (average) values of the used parameters varied considerably (cf. Table 3). The analysis revealed that the soil texture parameter exhibited the largest mean value of 8.92, which was followed by the geology variable with a mean value of 8.77. Compared to these two, both elevation and TWI had moderate mean values of 7.4 and 7, respectively. Notably, Ld, land cover, Dd, and lithology exhibited lower mean values ranging between 3 and 6.
It was found that some of the rated parameters were highly variable compared to the others. For instance, Ld, lithology, curvature, and Dd, the CV % values have ranged between 39 and 60 (Table 1), which were found to be highly variable parameters. On the other hand, slope, elevation, land cover, and TWI parameters were moderately varying (CV % ranged between 22 and 32). The least variable parameters were geology (CV % is 11) and soil texture (CV % is 15). In this context, it worth stating that the highly variable parameter indicates the least contribution to the variability of GWP, while the least variable parameter indicates the high contribution to the variability of GWP across the study site.
Table 4 shows a summary of the statistically significant correlation coefficients that resulted from the carried statistical analysis among all rated parameters. We found a strong positive statistical correlation between the slope and TWI (r = 0.66) and the Ld and rainfall (r = 0.46). On the other hand, a strong negative correlation was observed among six parameters, including Dd and elevation (r = −0.54), curvature and TWI (r = −0.52), and geology and rainfall (r = −0.45). However, regarding the correlation between Dd–Ld and geology–soil texture, a slightly positive relationship was observed (r = 0.18, and 0.12, respectively), while, Dd–soil texture and geology–Ld have exhibited a slightly negative relationship (r = −0.22, and −0.27, respectively). The least correlation was found in correspondence to many parameters, including curvature–Dd (r = 0.01), curvature–Ld (r = 0.00), curvature–rainfall (r = 0.01), slope–soil texture (r = 0.01), and LC–rainfall (r = 0.02) (Table 2). However, we considered the used parameters as statistically independent from each other.

4. Discussion

The applied SAW and OIF models, throughout the study, have emerged as a powerful tool for groundwater potential assessment, offering several advantages over traditional methods. One key strength of SAW is its simplicity. This has allowed explicitly prioritizing factors influencing the groundwater potential, which included elevation, slope, curvature, land cover, lithology, lineament density, soil texture, geomorphology, TWI, rainfall, and DD. The generated map delineated groundwater potential zones within the study area, offering valuable insights for optimizing groundwater resource planning and management. This was in line with study findings achieved by Hamdani and Baali [35] on groundwater potential using Rs and GIS. Their analysis showed that only 3.88% of their study site has exhibited ‘very good’ groundwater potential (GWP). Additionally, 17.22% and 20.20% have possessed ‘good’ and ‘moderate’ GWP, respectively. However, a strong spatial association has emerged between GWP and land cover. In another similar study by Hussein et al. [57], their findings have confirmed that applying RS and GIS, coupled with “multi-criteria decision analysis” (MCDA), has produced powerful instruments for the spatiotemporal monitoring and assessment of groundwater resource potential zones. However, a confirmative study conducted by Hasanuzzaman et al. [58] has also assured that the implemented AHP approach has yielded a robust classification of GWP zones into five distinct categories (VG, G, M, P, VP) with high and acceptable accuracy metrics. Furthermore, the analysis has identified the geomorphology, slope, rainfall, and elevation as primary drivers of GWP zones distribution, overshadowing the influence of LC, vegetation cover, and other parameters.

4.1. Evaluation of the Applied Methods

For the current study, the spatial distribution of groundwater availability (recharge) zones was mapped based on two indices, namely: SAW and OIF for the Oasis of Al-Ahsa region (cf. Figure 5a,b). For reliability, we evaluated the produced maps by using frequency ratio. The consistency of the two approaches with historical evidence, depicted in Figure 6a,b, supports their accuracy and reliability. While the evaluation results suggest that the original GWP zones within the SAW map may exhibit slightly superior performance compared to the potential GWI, with 66% and 51% of historical points exceeding the assumed threshold (≥50%), respectively, the overall findings indicate the suitability of both approaches for investigating the likelihood of groundwater recharge (availability) within the study area.
Comparing these findings with previously published literature reveals extensive support for the efficacy of the SAW method as an effective index for mapping groundwater potential. For instance, Abrams et al. [33] demonstrated the effectiveness of the SAW index in GWP mapping by successfully employing it to delineate GWP zones in the northern United Arab Emirates and Oman, achieving an overall accuracy of 98%. This study further concluded that the SAW model outperforms AHP (Analytical Hierarchy Process) and PFR (Probability Frequency Ratio) in terms of delineating GWP zones. Additionally, they emphasized the enhanced reliability of knowledge-based methods compared to SAW and AHP models for GWP mapping in data-scarce regions.
However, it should be mentioned that for a model to be reliable and yield satisfactory results, the used parameters need to be statistically independent. Here, to test the independence of all rated factors, the coefficient of variation (CV %) was used. As shown in Table 3, four parameters were highly variable, including Ld, lithology, curvature, and Dd (CV % ranged between 39 and 60). This implies a direct proportional relationship between GWP and these factors. Conversely, the low variability of a parameter signifies its minimal influence on the overall variation of groundwater potential within the study area. Notably, using fewer input factors can often lead to highly reliable results and potentially even enhanced accuracy. However, it is crucial to acknowledge the potential impact of subjective selection of parameters, including their assigned ratings and weights, on the GWP’s performance, as highlighted by Napolitano and Fabbri [59].

4.2. GWP Maps—Distribution of Groundwater Zones

The application of the proposed methodology resulted in the delineation of five distinct groundwater prospect zones within the study area: ‘very low’, ‘low’, ‘moderate’, ‘high’, and ‘very high’. However, the two obtained GWP maps clearly showed the dominance of the ‘moderate’ as well as ‘high’ GWP zones in the study area. The ‘moderate’ GWP class accounted for 48% (1637.93 km2) and 45% (1547.26 km2) of the area, according to the original and potential groundwater prospect maps, respectively, whereas, the ‘high’ GWP class accounted for 37% (1274.97 km2) and 21% (738.49 km2), according to the potential GWP map. These zones were located generally at the eastern and southern portions of the Oasis area (cf: Figure 5a,b). This pattern is mainly governed by the dominance of loamy sand and sandy loam soil texture, low altitude (<214 MSL), bare/agricultural lands, and low-to-medium rainfall. Moreover, by referring to Figure 2a, this part of the study site is characterized by low elevation and gentle slope, which makes the water progress relatively slower, thus having a better chance of infiltrating downward and recharging the subsurface strata. These results agree with those of Al Tokhais and Rausch [32] and Magesh et al. [60], indicating that the type of soil, elevation, and slope degree play a pivotal role in groundwater recharge. On the other hand, the upper northwestern and northeastern parts of the study site were characterized as having ‘very poor’ (accounting for 0.18 km2 (0.01%) and 428.54 km2 (12%) according to the original and potential maps, respectively) groundwater potential, which lowers the chance of groundwater recharge. According to the lineament density map (Figure 2f) and drainage density map (Figure 2k), these parts were characterized by a high density of lineament (>0.98) and drainage (>0.0003) and high rainfall (>4.58 mm). However, contradicting results (disagreement) have been conveyed by Magesh et al. [60] and Ghanim et al. [61]: they argued that lineament density and drainage density contribute well to the groundwater recharge through infiltration.

4.3. Optimum Factors for Delineating GWP Zones

The statistical analysis presented in Table 3 reveals that parameters such as Dd, LULC, and TWI have played a dominant role in shaping the spatial distribution of groundwater potential depicted in Figure 5a,b. This is evidenced by their high mean rank values. Therefore, these three factors were used to construct the OIF model and generate the potential GWP map. While all three parameters contributed to the delineation of groundwater prospect zones, soil texture exhibited the most significant influence, as demonstrated by its high mean rank value of 8.92. This further corroborates findings reported by Kabeto et al. [62] in their study. Although Ld was included in the analysis, it demonstrated a minimal impact on the mapping and assessment of groundwater prospects. Geology and slope degrees emerged as the second and third most significant parameters with respective mean importance values of 8.77 and 8.35. A similar result was found by Hamdani and Baali [35], who argued that lithology (mean important equal 6.05), TWI (mean important equal 7), and elevation (mean important equal 7.4) have reasonably clarified the spatial distribution of the groundwater prospect in their study site.
Taking into consideration the inclusion of surface elevation, many other researchers have assured the rationality of surface elevation and its role as being an important factor influencing groundwater potential. For example, a study by Kabeto et al. [62] found that elevation was among the most significant elements affecting groundwater potential in the West Arsi Zone of Ethiopia. Another study by Hasanuzzaman et al. [58] found that elevation was one of the main features manipulating groundwater potential in the Chota Nagpur Plateau of India. In addition, a study by Mulyadi et al. [63] found that elevation was a valuable factor that influenced groundwater potential in the Walahi Watershed of Ethiopia.
The analysis of correlations between the employed parameters, as presented in Table 4, reveals a significant association between land cover and geomorphology parameters with a coefficient exceeding 0.80. Therefore, it was necessary to remove one of them; accordingly, the geomorphology (named geomorphon in Figure 2h) was excluded from the analysis. It was found that the slope degrees and TWI parameters were meaningfully in correspondence with a correlation coefficient of 0.66. We can explain this high correlation by the fact that both TWI and slope degrees quantify the influence of topography on water accumulation, so despite the high correlation observed between the two parameters, suggesting the potential for redundancy, this correlation was deemed advantageous and unlikely to impact the GWP calculation and mapping process. Additionally, a moderate correlation of 0.46 was observed between Ld and rainfall. We can attribute this correlation to the natural relationship between the two parameters in any part of the Earth’s surface, where lineaments, often characterized by fractures and faults in the bedrock, can act as preferential pathways for water flow. This can lead to increased surface runoff during rainfall events, reducing the amount of water available for infiltration and groundwater recharge [64]. The elevation was slightly associated with the geology factor (r = 25). Overall, here, we virtually considered the used parameters independent due to their ineffective association. Accordingly, we consider all these effective parameters for groundwater prospect mapping and assessment. Drawing upon the insights gained from the correlation analysis summarized in Table 4, an optimal index factor (OIF) was formulated by incorporating only three parameters: Ld, LULC, and TWI. These parameters were chosen based on their combined properties of high standard deviation and low correlation, suggesting their minimal redundancy and significant individual contribution to the overall GWP calculation. This finding highlights the effectiveness of this specific combination of parameters for constructing a statistically robust and reliable groundwater prospect index that is capable of accurately mapping and assessing groundwater availability zones within the study site.
While previous groundwater potential studies in the arid Middle East employed various methods, from the familiar simple additive weight (SAW) and more nuanced techniques like Probability Frequency Ratios (PFRs) and the Analytical Hierarchy Process [33], this research breaks new ground by introducing the Optimum Index Factor (OIF) to the region. This innovative approach goes beyond existing models, offering a fresh perspective on understanding groundwater resources. Notably, researchers have also explored machine learning techniques like Classification and Regression Trees (CART) for precise mapping [65] and data-driven approaches that integrate diverse datasets, including Gravity Recovery and Climate Experiment (GRACE) data, aeromagnetic data, and electrical resistivity data [66]. By pioneering the application of OIF in the region, this research adds a valuable tool to the arsenal of groundwater potential assessment methods, contributing to sustainable water management in the Middle East.

5. Conclusions

As groundwater recharge is crucial for sustainable water management, in this study, SAW and OIF models, supported by GIS and RS techniques, were considered for identifying potential sites for groundwater recharge by applying spatially explicit analysis allowing for the integration of diverse spatial datasets. This was achieved to offer a comprehensive understanding of the factors influencing recharge potential and the identification of suitable areas based on user-defined criteria. Decision support tools along with weighted overlay analysis were applied to prioritize the potential recharge sites based on different criteria and preferences.
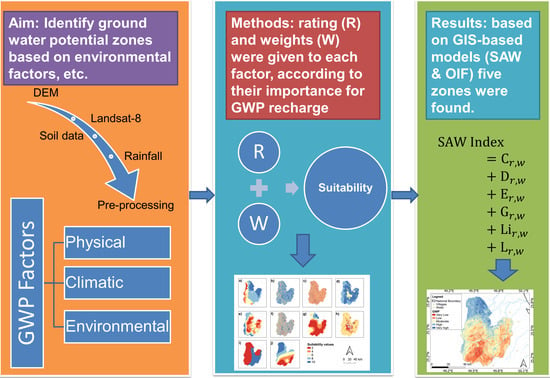
  • The study findings have confirmed the fact that the used models, especially the SAW, can facilitate the selection of zones that offer the best potential for maximizing recharge and achieving desired outcomes. However, the study results can be summarized specifically in the following points:
  • The findings presented in this study indicate that the SAW model offers superior performance compared to the OIF index for groundwater prospect mapping, providing greater accuracy in delineating groundwater potential zones.
  • The generated GWP maps revealed that approximately 45–48% of the total land area falls within the ‘moderate’ GWP zone, which is primarily concentrated in the eastern, southern, and western portions of the study site. Notably, the high GWP zone occupies 21–37% of the area, with soil texture emerging as the dominant factor influencing groundwater occurrence (mean importance: 8.92) followed by geology (mean importance: 8.77) and slope degrees (mean importance: 8.35).
  • Furthermore, the analysis identified lineament density as the least influential parameter (mean importance: 3.78), which is followed by land cover with a mean importance of 3.92.
  • Based on the results of the OIF model, the study suggests that a combination of only three parameters (Ld, land cover, and TWI) captures the most crucial information regarding groundwater prospect zones within the study area. These parameters were chosen due to their minimal correlation (duplication) and highest combined standard deviation, effectively minimizing redundancy and maximizing individual parameter contribution.
Overall, SAW and OIF-based DSS offer valuable tools for identifying potential sites for groundwater recharge. Their advantages in spatial analysis, decision support, and visualization make them powerful instruments for sustainable water management.
Therefore, in the arid landscape of the Al-Ahsa region, remote sensing and GIS can transform water resource management by unlocking a treasure trove of practical benefits. From pinpointing hidden recharge zones and safeguarding vulnerable aquifers to optimizing irrigation practices and engaging communities in sustainable water use, these technologies offer a powerful toolkit for a water-secure future. Satellite technology can track groundwater depletion and map water quality, guiding extraction strategies and protecting precious resources. GIS maps can inform land-use planning, ensuring development protects recharge zones and strengthens disaster resilience. By unlocking the secrets of the desert landscape, remote sensing and GIS can usher in an era of sustainable water management in Al-Ahsa, fostering agricultural productivity, combating desertification, and empowering communities to become stewards of their vital water resources.
However, it is important to acknowledge the limitations connected to such systems, including the uncertainty raised by the fact that groundwater recharge is a complex process influenced by numerous factors. Thus, this inherent uncertainty needs to be carefully considered when interpreting the results of any GIS model.
In future, studies are needed to confirm these findings and to determine how groundwater potential recharge can be determined in arid regions using geophysics methods. In particular, more efforts are needed to determine the effects of climate change and human activities on groundwater recharge. Moreover, to further understand groundwater potential in arid regions, the utilized model’s ability to incorporate subjective experts’ judgments and handle qualitative data alongside quantitative information when dealing with complex geospatial settings needs careful consideration.

Author Contributions

Conceptualization, A.S. and A.H.; methodology, A.H. and A.S.; software, A.S.; validation, A.H. and A.S.; formal analysis, A.S.; investigation, A.H.; resources, A.H.; data curation, A.S.; writing—original draft preparation, A.H. and A.S.; writing—review and editing, A.S.; visualization, A.S. and A.H.; supervision, A.H.; project administration, A.H.; funding acquisition, A.H. All authors have read and agreed to the published version of the manuscript.

Funding

This research was funded by the Deputyship for Research & Innovation, Ministry of Education in Saudi Arabia through project number INST138.

Data Availability Statement

Data only available upon request from corresponding author.

Acknowledgments

The authors extend their appreciation to the Deputyship for Research & Innovation, Ministry of Education in Saudi Arabia for funding this research work (project number INST138).

Conflicts of Interest

The authors declare no conflicts of interest.

References

  1. Abderrahman, W.A. Groundwater management for sustainable development of urban and rural areas in extremely arid regions: A case study. Int. J. Water Resour. Dev. 2005, 21, 403–412. [Google Scholar] [CrossRef]
  2. Burden, D.J. Hydro geological conditions in the Middle East. Q. J. Eng. Geol. 1982, 15, 71–81. [Google Scholar] [CrossRef]
  3. Water Atlas of Saudi Arabia, Ministry of Agriculture and Water. 1984. Available online: https://yle.fi/progressive/fynd/RSO/20181605_ruotsi.pdf (accessed on 14 November 2023).
  4. El Mahmoudi, A.S.; Al-Barrak, K.M.; Massoud, M.A. 2-D electrical tomography for mapping of aquifers at the new campus of King Faisl University, Al Hassa, KSA. Int. J. Water Resour. Arid Environ. 2011, 1, 397–410. [Google Scholar]
  5. British Arabian Advisory Company (BAAC). Water Resources of Saudi Arabia (Riyadh: Ministry of Agriculture and Water). 1980. Available online: https://faculty.kfupm.edu.sa/ES/Makkawi/ENVS%20521/Lectures/Module6.pdf (accessed on 17 October 2023).
  6. Al-Saleh, M.A. Declining groundwater level of the Minjur aquifer, Tebrak area, Saudi Arabia. Geogr. J. 1992, 158, 215–222. [Google Scholar] [CrossRef]
  7. Battal, H.S. Water Resources Allocation in Saudi Arabia: The Case Study of al Kharj District (Wheat Program, Short Run Water Demand Functions). Ph.D. Thesis, The University of Nebraska, Lincoln, Nebraska, 1986. [Google Scholar]
  8. Ministry of Planning. Fifth Development Plan, Riyadh: Ministry of Planning. 1990. Available online: https://mep.gov.sa/en (accessed on 1 December 2023).
  9. Al-Taher, A.A. Irrigation Efficiency and Production Energy Efficiency of Traditional and Modern Farms in the Al-Hassa Oasis, Saudi Arabia. Ph.D. Thesis, The University of Oklahoma, Norman, OK, USA, 1987. [Google Scholar]
  10. Chi, K.H.; Lee, B.J. Extracting potential groundwater area using remotely sensed data and GIS techniques. In Proceedings of the Regional Seminar on Integrated Application of Remote Sensing and GIS for Land and Water Resource Management, Bangkok, Thailand, November 1994. [Google Scholar]
  11. Shadid, K.; Nath, S.K.; Roy, J. Groundwater potential modelling in a soft rock using a GIS. Int. J. Remote Sens. 2000, 21, 1919–1924. [Google Scholar] [CrossRef]
  12. Chowdhury, A. Evaluation of Groundwater Potential in West Medinipur District Using Remote Sensing and GIS. Ph.D. Thesis, IIT Kharagpur, Kharagour, West Bengal, India, 2006. [Google Scholar]
  13. Chowdhury, A.; Jha, M.K.; Chowdary, V.M.; Mal, B.C. Integrated remote sensing and GIS-based approach for assessing groundwater potential in West Medinipur district, West Bengal India. Int. J. Remote Sens. 2009, 30, 231–250. [Google Scholar] [CrossRef]
  14. Adiat, K.; Nawawi, M.; Abdullah, K. Assessing the accuracy of GIS-based elementary multi criteria decision analysis as a spatial prediction tool. A case of predicting potential zones of suitable ground water resources. J. Hydrol. 2012, 440, 440–441. [Google Scholar]
  15. Rao, Y.S.; Jugran, D.K. Delineation of groundwater potential zones and zones of groundwater quality suitable for domestic purposes using remote sensing and GIS. Hydrol. Sci. J. 2003, 48, 821–833. [Google Scholar]
  16. Jha, M.K.; Chowdary, V.M.; Chowdhury, A. Groundwater assessment in Salboni Block, West Bengal (India) using remote sensing, geographical information system and multi-criteria decision analysis techniques. Hydrogeol. J. 2010, 18, 1713–1728. [Google Scholar] [CrossRef]
  17. Adiat, K.A.N. Development of Models for Predicting Groundwater Resources Potential of Alluvial Aquifer Using Artificial Intelligence Techniques. Ph.D. Thesis, University Sains Malaysia, Penang, Malaysia, 2013. [Google Scholar]
  18. Teeuw, R. Groundwater exploration using remote sensing and a low cost geographic information system. Hydrogeol. J. 1995, 3, 21–30. [Google Scholar] [CrossRef]
  19. Sander, P.; Chesley, M.; Minor, T. Groundwater assessment using remote sensing and GIS in a rural groundwater project in Ghana: Lessons learned. Hydrogeol. J. 1996, 4, 78–93. [Google Scholar] [CrossRef]
  20. Das, D. GIS application in Hydrogeological Studies. Available online: https://www.geospatialworld.net/article/gis-application-in-hydrogeological-studies/ (accessed on 28 November 2023).
  21. Sener, E.; Davraz, A.; Ozcelik, M. An integration of GIS and remote sensing in groundwater investigations: A case study in Burdur, Turkey. Hydrogeol. J. 2005, 13, 826–834. [Google Scholar] [CrossRef]
  22. Ganapuram, S.; Kumar, G.; Krishna, I.; Kahya, E.; Demirel, M. Mapping of groundwater potential zones in the Musi basin using remote sensing and GIS. Adv. Eng. Softw. 2008, 40, 506–518. [Google Scholar] [CrossRef]
  23. Moghaddam, D.D.; Rezaei, M.; Pourghasemi, H.R.; Pourtahghie, Z.S.; Pradhan, B. Groundwater spring potential mapping using bivariate statistical model and GIS in the Taleghan Watershed, Iran. Arab. J. Geosci. 2013, 8, 913–929. [Google Scholar] [CrossRef]
  24. Rahmati, O.; Samani, A.N.; Mahdavi, M.; Pourghasemi, H.R.; Zeinivand, H. Groundwater potential mapping at Kurdistan region of Iran using analytic hierarchy process and GIS. Arab. J. Geosci. 2015, 8, 7059–7071. [Google Scholar] [CrossRef]
  25. Zaidi, F.K.; Nazzal, Y.; Ahmed, I.; Naeem, M.; Jafri, M.K. Identification of potential artificial groundwater recharge zones in Northwestern Saudi Arabia using GIS and Boolean logic. J. Afr. Earth Sci. 2015, 111, 156–169. [Google Scholar] [CrossRef]
  26. Lezzaik, K.; Milewski, A. A quantitative assessment of groundwater resources in the Middle East and North Africa region. Hydrogeol. J. 2017, 26, 251–266. [Google Scholar] [CrossRef]
  27. Rizk, Z.S.; Alsharhan, A.S. Geographical Information System Modeling of Groundwater Potentiality in the Northeastern Part of the United Arab Emirates. In Proceedings of the Desertification in the Third Millennium, Dubai, UAE, 12–15 February 2000. [Google Scholar]
  28. Rizk, Z.S.; Garamoon, H.K. The influence of major lineaments on groundwater resources in the eastern region of the northern University of Sharjah. J. Pure Appl. Sci. 2006, 3, 83–111. [Google Scholar]
  29. Murad, A.A. An overview of conventional and non-conventional water resources in arid region: Assessment and constrains of the United Arab Emirates (UAE). J. Water Resour. Protect. 2010, 2, 181–190. [Google Scholar] [CrossRef]
  30. Murad, A.A.; Gerish, M.H.; Mahgoub, F.M.; Hussein, S. Physiochemical processes affecting the geochemistry of carbonate aquifer of southeastern Al-Ain area, United Arab Emirates (UAE). Water Air Soil Pollut. 2011, 214, 653–665. [Google Scholar] [CrossRef]
  31. Elmahdy, S.I.; Mohamed, M.M. Groundwater potential modelling using remote sensing and GIS: A case study of the Al Dhaid area, United Arab Emirates. Geocarto Int. 2013, 29, 433–450. [Google Scholar] [CrossRef]
  32. Al Tokhais, A.S.; Rausch, R. The Hydrogeology of Al Hassa Springs. In Proceedings of the 3rd International Conference on Water Resources and Arid Environments and the 1st Arab Water Forum, Riyadh, Saudi Arabia, 16–19 November 2008. [Google Scholar]
  33. Abrams, W.; Ghoneim, E.; Shew, R.; LaMaskin, T.; Al-Bolushi, K.; Hussein, S.; AbuBakr, M.; Al-Mulla, E.; Al-Awar, M.; El-Baz, F. Delineation of groundwater potential (GWP) in the northern United Arab Emirates and Oman using geospatial techniques in conjunction with Simple Additive Weight (SAW), Analytical Hierarchy Process (AHP), and Probabilistic Frequency Ratio (PFR) techniques. J. Arid Environ. 2018, 157, 77–96. [Google Scholar] [CrossRef]
  34. Andualem, T.G.; Demeke, G.G. Groundwater potential assessment using GIS and remote sensing: A case study of Guna tana landscape, upper blue Nile Basin, Ethiopia. J. Hydrol. Reg. Stud. 2019, 24, 100610. [Google Scholar] [CrossRef]
  35. Hamdani, N.; Baali, A. Characterization of groundwater potential zones using analytic hierarchy process and integrated geomatic techniques in Central Middle Atlas (Morocco). Appl. Geomat. 2020, 12, 323–335. [Google Scholar] [CrossRef]
  36. Chavez, P.S. Image-based atmospheric corrections-revisited and improved. Photogramm. Eng. Remote Sens. 1996, 62, 1025–1035. [Google Scholar]
  37. Congedo, L. Semi-Automatic Classification Plugin: A Python tool for the download and processing of remote sensing images in QGIS. J. Open Source Softw. 2021, 6, 3172. [Google Scholar] [CrossRef]
  38. Congedo, L. Semi-Automatic Classification Plugin Documentation. Available online: https://www.researchgate.net/profile/LucaCongedo/publication/344876862_SemiAutomatic_Classification_Plugin_Documentation_Release_7971/links/612950c1c69a4e48795ff8d2.pdf (accessed on 27 November 2023).
  39. Anderson, J.R. Land-use classification schemes. Photogramm. Eng. 1971, 37, 379–387. [Google Scholar]
  40. Congalton, R.G.; Green, K. Assessing the Accuracy of Remotely Sensed Data: Principles and Practices, 2nd ed.; CRC Press: Boca Raton, FL, USA, 2009. [Google Scholar]
  41. AlAli, A.M.; Salih, A.; Hassaballa, A. Geospatial-Based Analytical Hierarchy Process (AHP) and Weighted Product Model (WPM) Techniques for Mapping and Assessing Flood Susceptibility in the Wadi Hanifah Drainage Basin, Riyadh Region, Saudi Arabia. Water 2023, 15, 1943. [Google Scholar] [CrossRef]
  42. Naghibi, S.A.; Pourghasemi, H.R.; Dixon, B. GIS-based groundwater potential mapping using boosted regression tree, classification and regression tree, and random forest machine learning models in Iran. Environ. Monit. Assess. 2016, 188, 1–27. [Google Scholar] [CrossRef]
  43. Karimi-Rizvandi, S.; Goodarzi, H.V.; Afkoueieh, J.H.; Chung, I.M.; Kisi, O.; Kim, S.; Linh, N.T.T. Groundwater-potential mapping using a self-learning bayesian network model: A comparison among metaheuristic algorithms. Water 2021, 13, 658. [Google Scholar] [CrossRef]
  44. Venkateswaran, S.; Ayyandurai, R. Groundwater potential zoning in upper Gadilam river basin Tamil Nadu. Aquat. Procedia 2015, 4, 1275–1282. [Google Scholar] [CrossRef]
  45. Al Saud, M. Mapping potential areas for groundwater storage in Wadi Aurnah Basin, western Arabian Peninsula, using remote sensing and geographic information system techniques. Hydrogeol. J. 2010, 18, 148–195. [Google Scholar] [CrossRef]
  46. Yeh, H.F.; Cheng, Y.S.; Lin, H.I.; Lee, C.H. Mapping groundwater recharge potential zone using a GIS approach in Hualian River, Taiwan. Sustain. Environ. Res. 2016, 26, 33–43. [Google Scholar] [CrossRef]
  47. Leduc, C.; Favreau, G.; Schroeter, P. Long-term rise in a Sahelian water table: The Continental Terminal in south-west Niger. J. Hydrol. 2001, 243, 43–54. [Google Scholar] [CrossRef]
  48. Shaban, A.; Khawlie, M.; Abdallah, C. Use of remote sensing and GIS to determine recharge potential zones: The case of Occidental Lebanon. Hydrogeol. J. 2006, 14, 33–43. [Google Scholar] [CrossRef]
  49. Elewa, H.H.; Qaddah, A.A. Groundwater potentiality mapping in the Sinai Peninsula, Egypt, using remote sensing and GIS-watershed-based modeling. Hydrogeol. J. 2011, 19, 613. [Google Scholar] [CrossRef]
  50. O’leary, D.W.; Friedman, J.D.; Pohn, H.A. Lineament, linear, lineation: Some proposed new standards for old terms. Geol. Soc. Am. Bull. 1976, 87, 1463–1469. [Google Scholar] [CrossRef]
  51. Greenbaum, D. Review of Remote Sensing Applications to Groundwater Exploration in Basement and Regolith. 1985. Available online: https://nora.nerc.ac.uk/id/eprint/505150/1/WC_OG_85_1.pdf (accessed on 12 October 2023).
  52. Gintamo, T.T. Ground water potential evaluation based on integrated GIS and remote sensing techniques, in bilate River Catchment: South Rift Valley of Ethiopia. Res. J. Appl. Sci. Eng. Technol. 2015, 10, 85–120. [Google Scholar]
  53. Biswas, S.; Mukhopadhyay, B.P.; Bera, A. Delineating groundwater potential zones of agriculture dominated landscapes using GIS based AHP techniques: A case study from Uttar Dinajpur district, West Bengal. Environ. Earth Sci. 2020, 79, 1–25. [Google Scholar] [CrossRef]
  54. Beven, K.J.; Kirkby, M.J. A physically based, variable contributing area model of basin hydrology/Un modèle à base physique de zone d’appel variable de l’hydrologie du bassin versant. Hydrol. Sci. J. 1979, 24, 43–69. [Google Scholar] [CrossRef]
  55. ILWIS; ITC. 3.0 Academic User Guide; International Institute for Aerospace Survey and Earth Sciences (ITC): Enschede, The Netherlands, 2001. [Google Scholar]
  56. Al-Dakheel, Y.; Massoud, M. Towards sustainable development for groundwater in Al-Hassa and the role of geographic information systems. In Proceedings of the 2nd International Conference on Water Resources & Arid Environment, Reyad, Saudi Arabia, 27 November 2006. [Google Scholar]
  57. Hussein, A.A.; Govindu, V.; Nigusse, A.G.M. Evaluation of groundwater potential using geospatial techniques. Appl. Water Sci. 2017, 7, 2447–2461. [Google Scholar] [CrossRef]
  58. Hasanuzzaman, M.; Mandal, M.H.; Hasnine, M.; Shit, P.K. Groundwater potential mapping using multi-criteria decision, bivariate statistic and machine learning algorithms: Evidence from Chota Nagpur Plateau, India. Appl. Water Sci. 2022, 12, 58. [Google Scholar] [CrossRef]
  59. Napolitano, P.; Fabbri, A.G. Single-parameter sensitivity analysis for aquifer vulnerability assessment using DRASTIC and SINTACS. In Proceedings of the Application of Geographic Information System in Hydrology and Water Resources Management (Proceedings of the Vienna Conference), Vienna, Austria, 16–19 April 1996. [Google Scholar]
  60. Magesh, N.S.; Chandrasekar, N.; Soundranayagam, J.P. Delineation of groundwater potential zones in Theni district, Tamil Nadu, using remote sensing, GIS and MIF techniques. Geosci. Front. 2012, 3, 189–196. [Google Scholar] [CrossRef]
  61. Ghanim, A.A.J.; Al-Areeq, A.M.; Benaafi, M.; Al-Suwaiyan, M.S.; Aghbari, A.A.A.; Alyami, M. Mapping Groundwater Potential Zones in the Habawnah Basin of Southern Saudi Arabia: An AHP and GIS-based Approach. Sustainability 2023, 15, 10075. [Google Scholar] [CrossRef]
  62. Kabeto, J.; Adeba, D.; Regasa, M.S.; Leta, M.K. Groundwater Potential Assessment Using GIS and Remote Sensing Techniques: Case Study of West Arsi Zone, Ethiopia. Water 2022, 14, 1838. [Google Scholar] [CrossRef]
  63. Mulyadi, A.; Dede, M.; Widiawaty, M.A. Spatial interaction of groundwater and surface topographic using geographically weighted regression in built-up area. In Proceedings of the IOP Conference Series: Earth and Environmental Science, San Francisco, CA, USA, 24 January 2019. [Google Scholar]
  64. Ghosh, S.; Jana, R.K. Use of Remote Sensing and GIS for the Delineation of Groundwater Potential Zones: A Case Study from the Mewat District of Southern Haryana, India. Int. J. Adv. Geosci. 2017, 5, 258–265. [Google Scholar]
  65. Elmahdy, S.; Tarig, A.; Mohamed, M. Regional mapping of groundwater potential in ar rub al khali, arabian peninsula using the classification and regression trees model. Remote Sens. 2021, 13, 2300. [Google Scholar] [CrossRef]
  66. Mohamed, A.; Al Deep, M.; Othman, A.; Taha, A.I.; Alshehri, F.; Abdelrady, A. Integrated geophysical assessment of groundwater potential in southwestern Saudi Arabia. Front. Earth Sci. 2022, 937402. [Google Scholar] [CrossRef]
Figure 1. Location of the study site.
Water 16 00194 g001
Figure 2. Thematic parameters of GWP shown as: (a) elevation (m), (b) slope degrees, (c) curvature, (d) land cover, (e) lithology (geology), (f) lineament density, (g) soil texture, (h) geomorphology, (i) topographic wetness index (TWI), (j) rainfall (mm), and (k) drainage density, respectively.
Water 16 00194 g002
Figure 3. GWP thematic layers’ suitability values based on the assigned ratings and weights, in which (a) elevation (m), (b) slope degrees, (c) curvature, (d) soil texture, (e) drainage density, (f) topographic wetness index (TWI), (g) lineament density, (h) land cover, (i) lithology (geology), (j) rainfall (mm), respectively.
Water 16 00194 g003
Figure 4. A simplified framework for GWP zones mapping.
Water 16 00194 g004
Figure 5. The resultant GWP maps, presented as: GWP (a) and potential GWP map (b) of the study site. The potential GWP map was computed using three of the best combination of bands (Dd, LC, and TWI).
Water 16 00194 g005
Figure 6. GWP map validation using frequency ratio within the GWP zones: (a) GWP map and (b) the potential GWP map (produced using only three parameters containing Dd, LULC, and TWI).
Water 16 00194 g006
Figure 7. The spatial distribution of GWP and potential GWP zones over the study site (a) according to the original GWP index and (b) according to the potential GWP index.
Water 16 00194 g007
Table 1. Data used for extracting the GWP parameters (variables) along with their sources.
Type of DataSourcesStructureData SizeRelated Factor Maps (Application)
Annual rainfall (mean)http://pmm.nasa.gov/data access/download/gpm, (accessed on 12 November 2023)Digital Raster 0.1° × 0.1°Precipitation
Geology maphttps://certmapper.cr.usgs.gov/ (accessed on 12 November 2023)Digital Vector1:2,000,000Lineament density
Landsat-8 (OLI)https://earthexplorer.usgs.gov/, (accessed on 1 October 2023) Digital Raster30 × 30 mLand use/cover (LULC) and Geomorphology
Soil maphttps://www.fao.org/soils-portal/data-hub/, (accessed on 23 August 2023)Digital Raster30 arc-secondsSoil texture
SRTM–DEM (Digital Elevation Model)https://earthexplorer.usgs.gov/, (accessed on 23 October 2023) Digital Raster30 × 30 mElevation, Slope, Curvature, TWI, and Drainage Density (Dd)
Wells locationsMinistry of Environment, Water and Agriculture of Saudi Arabia https://www.mewa.gov.sa/en/Pages/default.aspx, (accessed on 18 November 2023) Table with (x, y)N/AValidation measure
Table 2. The parameters’ (variables) classes, ratings, and weights for the GWP mapping index.
Serial
Number
ThemeWeightNormalized WeightClassRankNormalized Rank
1Elevation (m)10.02≤118100.33
118–16680.27
166–21460.20
214–26240.13
>26220.07
2Slope (°)20.04 30
≤5.96100.33
5.96–11.9380.27
11.93–17.8960.20
17.89–23.8640.13
>23.8620.07
3Curvature30.06 30
≤−0.29100.33
−0.7180.27
0.42–1.1260.20
1.12–1.8340.13
>1.8320.07
4Drainage Density (km/km2)40.08
≤0.00018100.33
0.00018–0.0002780.27
0.00027–0.0003560.20
0.00035–0.0004440.13
>0.0004420.07
5TWI80.15
≤10.3220.07
10.32–10.9940.13
10.99–13.1060.20
13.10–17.7480.27
>17.74100.33
6Lineament Density (km/km2)70.13 30
≤0.3320.07
0.33–0.6640.13
0.66–0.9860.20
0.98–1.3180.27
>1.31100.33
7Land Cover50.09
Date Palm80.2
Crop Land100.25
Bare Land40.1
Urban Land20.05
Natural Vegetation60.15
Water Bodies100.25
8Geology90.17 40
Oligocene80.44
Quaternary100.56
9Rainfall (mm)100.19 18
≤4.4320.07
4.43–4.4740.13
4.47–4.5260.20
4.52–4.5880.27
>4.58100.33
10Soil Texture40.08
Clay20.04
Silty clay loam40.09
Silt60.13
Silt loam60.13
Loam100.22
Sandy loam100.22
Loamy sand80.17
Table 3. Summary of the statistical of the parameters used to compute the GWP and potential GWP maps.
ParameterMeanS.D.MinimumMaximumCV%
Elevation (m)7.42.1221028.7
Slope (°)8.351.8121021.7
Curvature4.751.8621039.2
Dd (km/km2)5.332.2221041.7
TWI72.2421032
Ld (km/km2)3.782.2321058.9
Land cover3.921.1621029.6
Geology8.770.9781011.1
Lithology6.052.7921046.1
Soil Texture8.921.3821015.5
Note: S.D. represents the standard deviation and CV % represents the coefficient of variation.
Table 4. Correlation coefficients between the parameters used for GWP mapping.
CurvatureDdElevation (m)Geology/LithologyLdLand CoverRainfallSlope (°)Soil TextureTWI
Curvature1.00
Dd0.011.00
Elevation (m)−0.06−0.54 *1.00
Geology/lithology−0.010.070.25 *1.00
Ld0.000.18 *0.07−0.27 *1.00
Land cover0.010.07−0.02−0.010.051.00
Rainfall0.01−0.000.01−0.45 *0.46 *0.021.00
Slope (°)−0.17 *−0.080.18 *0.06−0.02−0.01−0.081.00
Soil texture−0.01−0.22 *0.22 *0.12 *0.03−0.14 *−0.020.011.00
TWI−0.52 *−0.040.12 *0.030.00−0.02−0.030.66 *0.011.00
Note: * indicates significant correlation between the two parameters.
Disclaimer/Publisher’s Note: The statements, opinions and data contained in all publications are solely those of the individual author(s) and contributor(s) and not of MDPI and/or the editor(s). MDPI and/or the editor(s) disclaim responsibility for any injury to people or property resulting from any ideas, methods, instructions or products referred to in the content.

