Abstract
This study aimed to reduce the methane (CH4) emissions originating from dam lake treatment using malt dust-derived biochar, which is an agro-industrial byproduct of the brewery industry. Optimum operating and water quality parameters for CH4 reduction were determined using statistical analyses based on the Box–Behnken design method. Also, a Monte Carlo simulation was performed to determine the correlation between CH4 emissions and operating parameters. According to the simulation, dissolved oxygen (DO) and the oxidation–reduction potential (ORP) had the highest correlation with CH4 emissions, with values of 92.03% and 94.57%, respectively. According to the Box–Behnken design methodology, the optimum operating parameters were 4 mg/L of dissolved oxygen, −359 mV of ORP, and 7.5 pH for the minimum CH4 emissions. There was a reported reduction of up to 19.4% in CH4 emissions for the dam lake treatment using malt dust-derived biochar. Finally, a new methane capture index, based on the biochar application (MCI), was developed and validated. The largest methane capture capacity was related to the malt dust-derived biochar produced at the lowest temperature (M1).
Keywords:
methane; dam lake; reduction; malt dust; biochar; Box–Behnken design; Monte Carlo simulation 1. Introduction
Water resource treatment has been classified as a tertiary group by the European (EU) Green Deal, aiming to reduce greenhouse gas (GHG) emissions by 30% by 2030, owing to water resource treatment [1,2]. Furthermore, according to the Sixth Assessment Report, published by the International Panel on Climate Change (IPCC), water resource treatment has been regarded an important origin of GHG emissions [3]. There is a restricted point of view and limited methodology for the minimization of GHG emissions resulting from water resource treatment. From this point of view, this study presents an innovative methodology in order to reduce the GHG emissions resulting from dam lake treatment.
There are limited investigations on GHG emissions from dam lake treatment. Owing to the water reservoir structure, this resource is considered to have the potential to emit GHG emissions among water supplies, especially due to its physicochemical and biochemical processes. Methane (CH4) is one of the major greenhouse gasses released from a water reservoir mass [1,3,4]. Furthermore, carbon can be present in water reservoirs as methane, which should be disposed of to prevent microbial regrowth during treatment, transportation, and potable water distribution [5,6,7,8]. Many water reservoirs contain considerable quantities of methane, which mainly form as a result of geological interactions [4,8,9]. CH4 can be emitted from reservoirs in various ways, such as ebullition, plant-supported transport, diffusion across the water–atmosphere interface, and storage flux [10,11]. Methane can be released due to biological, geological, or mixed activities in reservoirs [12,13]. In particular, methane can occur as a result of anaerobic biological reactions in a reservoir [4].
When there is an anoxic condition in a deep reservoir, methanogenesis occurs, which produces CH4 [12,14]; both methane and carbon dioxide are generated by the decomposition of organic matter in a water reservoir. CH4 is also generated by bacteria, which accumulate over years in reservoir ecosystems and thrive in oxygen-free deep water and sediment [10]. Therefore, methane continues to be generated by reservoirs long after they are designed. Microbial methane is a biological resource and corresponds with the activity of various methanogenic bacteria that consume organic or inorganic substrates for methane production [15]. In anoxic deep-water reservoirs, CH4 generally accumulates and can reach excessive concentrations [16]. Methane is also available in the abiotic processes of inorganic substances at low temperatures and low pressures [4,17]. Also, eutrophication of the sediment is the main cause of CH4 production in a water reservoir [18,19]. Several processes and technologies have recently been developed to remove methane from a water reservoir [20,21]. Sediment flushing and remediation are the main techniques developed in recent years. This study presents a different water reservoir treatment technique. According to this study, biochar can be applied as an alternative methane reduction tool for water storage reservoir treatment.
Biochar is a carbon-rich byproduct of the pyrolysis and/or thermochemical processes of various biomass wastes, which can uptake GHG emissions [22,23]. Biochar is a carbonaceous solid material that is generated by the pyrolysis of various organic substances with no oxygen and is characterized by a well-developed porous structure with abundant functional groups [24,25,26,27]. Biochar is a significant material, as it can remove pollutants and be used as a carbon-negative technology [23]. Biochar is regarded as a carbon-rich material that can be generated using different organic and inorganic feedstocks [23]. Biochar has gained increasing significance due to its stable nature, higher carbon content, ion exchange capacity, larger surface area, and higher uptake capacity [23]. Biochar has gained great attention recently because of its significant role in environmental remedies [23]. It is cheaper than other treatment techniques and can easily adsorb various pollutants in water and wastewater [28,29]. Biochar can also adsorb recalcitrant pollutants and uptake greenhouse gasses from water masses.
This study is novel and unique in the sense that the biochar adsorption process was performed in order to reduce CH4 emissions from dam lake treatment in the context of the EU Green Deal. In the literature, there is no investigation corresponding to methane removal from a water reservoir using biochar application. Another originality of this work is that the biochar adsorption process was investigated as a GHG emission reduction technique for water resource treatment. There is a gap in the literature on this topic. Therefore, this study can be a guide for similar water treatment authorities in terms of reducing GHG emissions. Also, this study is original because it involves collecting CH4 emissions after treatment, and gas adsorption was performed using malt dust-derived biochar to determine the uptake capacity. Biochar can be derived from several raw materials, such as domestic, agricultural, and industrial substances. Malt dust is an agro-industrial byproduct of the brewery industry, which has been released in large amounts. According to the EU Green Deal, waste reduction should be achieved by recycling or reusing. This biochar application technique is a waste reduction and recycling technique for all brewery industries. An agro-industrial byproduct from the brewery industry was used as the feedstock, which can lead to cleaner production policies. The aim of this study is to use agro-industrial biochar in order to reduce methane emissions from dam lake treatment. The goal of this study was to reduce CH4 emissions using the biochar adsorption process in terms of the European Green Deal. The statistical and experimental results are theoretically discussed and modeled at the end of this study.
This study aimed to decrease the methane emissions originating from dam lake treatment using biochar. This study also statistically investigated the optimum operating and water quality parameters for a reduction in CH4 emissions based on the Box–Behnken design method. Also, a Monte Carlo simulation was performed to determine the correlation between the CH4 emission and operating parameters. The methane capture index (MCI) was developed based on the biochar adsorption process and validated by applying sensitivity analysis.
2. Materials and Methods
This research was carried out in five stages. The first stage was the biochar production process using malt dust, which is an agro-industrial feedstock, and the second stage was the biochar application for dam lake treatment and gas adsorption. The third stage was the statistical analysis based on the Box–Behnken design method to determine the optimum operating and water quality parameters for a reduction in CH4 emissions. The fourth stage was performing a Monte Carlo simulation to calculate the correlation of CH4 emissions and operating parameters. In the final stage, the methane capture index (MCI) was developed based on the biochar adsorption process and validated by performing the sensitivity analysis. In Figure 1, the experimental design and planning of the research are provided in detail. Figure 2 shows the conceptual framework and flow scheme of the study.
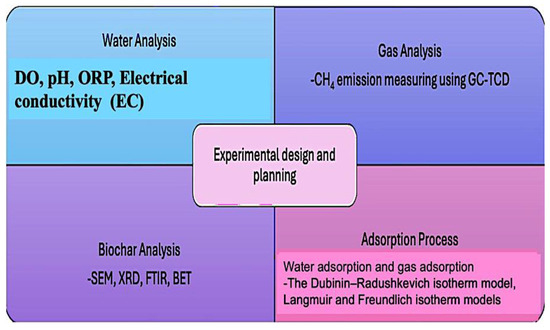
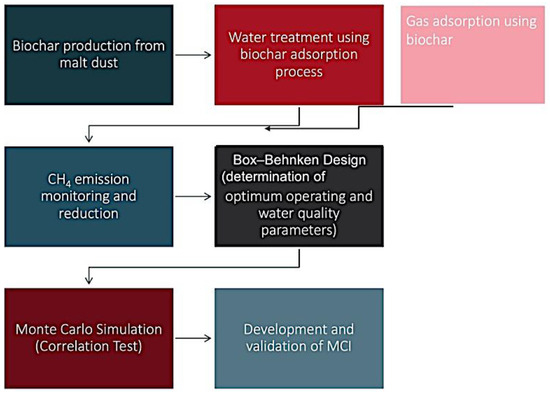
Figure 1.
Experimental design and planning of the research.
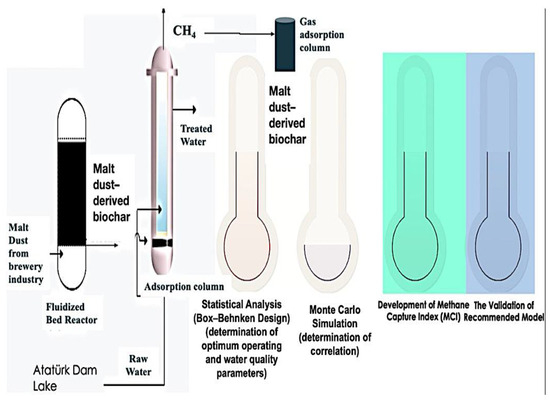
Figure 2.
Conceptual framework and flow diagram of the research.
The water samples were ensured from Ataturk Dam Lake (the inlet of Sanliurfa Irrigation Tunnels), which is located in southeastern Turkey seasonally. The water sampling dates were the 15 January, 15 March, 15 June, and 15 September for winter, spring, summer, and autumn, respectively. Water analyses were performed according to the standard methods [30]. DO, ORP, EC, and pH analyses were conducted.
2.1. Biochar Production and Adsorption Process
Brewery industries have generated large amounts of malt dust to prepare the feedstock for the production process. Biochar was derived from malt dust, which was obtained from a brewery industry in Türkiye using slow pyrolysis in a fluidized bed reactor under the operating conditions of 250 (M1), 300 (M2), and 500 °C (M3), respectively. From this perspective, renewable waste was used as the biochar’s feedstock, which could lead to cleaner production for brewery industries. X-ray diffraction (XRD), scanning electron microscope (SEM), Fourier transform infrared spectrometry (FTIR), and BET (Brunauer, Emmett, and Teller) (surface area analysis) analyses were performed to determine the characterization and the main properties of the adsorbents at the Harran University Application and Research Center for Science and Technology in Turkey. Microstructures of biochar were examined using the scanning electron microscope (SEM) Zeiss Evo 50 (Carl-Zeiss Gmbh, Oberkochen, Germany). Prior to analysis, the biochar was degassed in a vacuum at 120 °C for 6 h. Specific surface areas and pore size distributions were estimated using Brunauer–Emmett–Teller (BET). XRD analyses were performed using the Rigaku Ultima III to record crystalline structures in an X-ray diffractometer (Rigaku Holdings, Tokyo, Japan). The FTIR analyses were ensured by the IRTracer-100shimadzo. The characterization analyses were performed at 25 °C. Malt dust is a large byproduct of the brewery industries and is used as feedstock to produce biochar. It is a solid waste at the end of the production step. An approximately 1-liter glass adsorption column was designed and operated for the water adsorption. A total of 10 g of biochar was added to the adsorption column to determine the CH4 removal from the water storage reservoir. Three types of biochar (M1, M2, M3) were used for the dam lake treatment, separately and seasonally. Also, CH4 was collected, and a gas adsorption process was applied using M (1–3) to determine the CH4 uptake capacity of the biochar after the water treatment. An adsorption column with a volume of 0.75 L was used, and 10 g of biochar was separately added to the column for collected gas adsorption.
In this process, the adsorbents were malt dust-derived biochar, and the pollutant was CH4. The adapted gas adsorption calculation term is given in Equation (1) based on the main adsorption theory [31].
where
Co: CH4 concentration (mM) in the water sample before treatment using biochar;
Ce: CH4 concentration (mM) in the water sample after treatment using biochar;
V: Dam lake sample volume (L);
M: Biochar (adsorbent) dose (g);
qe: The amount of substance adsorbed on the adsorbent (mmol/g) (the estimated adsorption amount).
In this study, Dubinin–Radushkevich, Langmuir, and Freundlich isotherm models were performed to determine the experimental results (for the collected CH4 adsorption using biochar). The Langmuir isotherm model assumes that adsorption occurs on a homogeneous biochar surface area and monolayer. The Freundlich model accepts the adsorbing surface (biochar) is heterogeneous. The equilibrium isotherms of the Langmuir and Freundlich isotherm models are given in Equations (2) and (3) [31]. The Dubinin–Radushkevich isotherm model containing a pore-filling mechanism was used for the adsorption process. It can be used for the adsorption process on both homogeneous and heterogeneous surfaces. The linear form was given by Dubinin in Equation (4).
where qe and qm (mmol/g) are the equilibrium and the maximum monolayer adsorption capacity, respectively, KL (1/atm) is the Langmuir constant related to the free energy of adsorption, and P is the partial pressure of CH4 (atm). In Equation (3), KF is the Freundlich constant, and n is the Freundlich equation constant related to the adsorption density. Ke is the Dubinin–Radushkevich model constant. The Dubinin–Radushkevich, Langmuir, and Freundlich isotherm parameters for CH4 adsorption are given in Table 1. The fit of each model was determined by the correlation coefficient (R2). Looking at the values of R2, the best-fit isotherm for biochar adsorption is the Dubinin–Radushkevich isotherm model, with the highest R2. The Dubinin–Radushkevich (Equation (3)) isotherm model was used to analyze the equilibrium CH4 uptake of the adsorbents.
qe = KF P (1/n)
lnqe = lnqm − Ke2

Table 1.
Isotherm parameters for CH4 emission.
Also, pseudo-first- and second-order kinetic models were applied in order to investigate the kinetics of adsorption of CH4 onto the biochar (Equations (5) and (6)).
In Equations (5) and (6), qt and qe (mmol/g) are the adsorption capacities at time t (s) and at equilibrium, respectively; k1 (1/s) and k2 (g/mmol s) are the kinetic rate constants of the pseudo-first-order and pseudo-second-order kinetic models, respectively.
The error in kinetic modeling (7) shows the standard deviation-based argument between the experimental and estimated adsorption amounts. The qt (estimated) is based on the CH4 measurements according to Equation (1). The first measurement and the last measurement were calculated using the CH4 emission difference, while qt (experimental) is based on qe in experimental gas adsorption based on the Dubinin–Radushkevich isotherm model.
2.2. Estimation and Monitoring of CH4 Emissions
The concentration of CH4 was determined using the gas chromatography (GC) Shimadzu 2010 equipped with a thermal conductivity detector (TCD). The chromatographic column was a long tube (0.3 cm × 2 m) packed with molecular Sieve 5A, whose material was stainless steel. The gas measurement was applied at 25 °C. The duration of the CH4 measurement was 15 min. After 15 min, the gas concentration was fixed and remained the same. Therefore, the optimal gas retention time was 15 min.
In this study, the CH4 emission calculation methodology was derived based on the IPCC approach [3]. The main equation was given in Equation (8) [3]. In Equation (8), GHG represents the CH4 emission, CCH4 means the CH4 concentration, and GWP is the global warming potential of CH4. The GWP of CH4 is 27.9 [3]. CH4 measurements were performed seasonally before and after the biochar adsorption processes.
2.3. Development and Validation of Methane Capture Index (MCI)
The methane capture index (MCI) (Equation (10)) depended on the biochar adsorption process developed in this study. The removed amount of CH4 emissions (GHGR) (kgCO2eLd−1g−1) was developed (Equation (9)) based on the adsorption theory by Metcalf and Eddy (2014) [31]. In Equations (9) and (10), GHGR is the removed CH4 emissions (kg CO2e/d), GHG0 is the CH4 emissions before treatment (kg CO2e/d), GHGA is the CH4 emissions after biochar adsorption, V is the water storage reservoir sample volume (L), MD is the volumetric biochar amount (L), Q is the water flow rate (L/d), and T is the contact time (day). The MCI was developed based on these inputs.
After the development of the MCI, a Monte Carlo simulation was performed to validate the recommended model. A sensitivity analysis was applied using lognormal distribution. One simulation and 1000 iterations were performed. The simulation tool is given in Equation (11). The inputs are MD, Q, and T. The desirable output is CH4 emission reduction.
2.4. Statistical Analysis (Box–Behnken Design Methodology)
Among the variables, ORP, DO, and pH were selected as the independent variables due to their strong effects on the anaerobic conditions for CH4 triggering. Optimum operating and water quality parameters for CH4 reduction were determined using the Box–Behnken design methodology. The coefficients were also defined using the Box–Behnken design methodology. Firstly, the factors were selected for the experiments. ORP(x1), DO (x2), and pH (x3) were the main independent variables in this study. The desirable response (dependent variable) was the CH4 emissions. According to the sensitivity analysis, the objective function of the system is shown in Equation (11). It represents the correlation of the data. The regression models obtained through multiple linear regression were used as the objective function in MATLAB. The optimum responses obtained from the experiments proposed by the Box–Behnken design were correlated to the linear, interactive, and quadratic models to detect the regression equations. The empirical interaction between the optimum parameters and independent variables was derived by multi-regression analysis of the experimental data. The estimated operational parameter (y) can be calculated by the second-order polynomial function in terms of significant factors. A second-order regression formulation was ensured by analysis of variance (ANOVA) in Equation (12):
y = 2.063x12 − 2.049x2 − 2.027x3
The effects of the factors on surface tension were analyzed using ANOVA to determine the optimized operating parameters. Response surface methodology was performed using Statistica version 7.1. This study ensured an experimental matrix of 10 runs, and the test results were recorded. A multiple linear regression technique was applied to develop a mathematical model for the response.
2.5. Monte Carlo Simulation (Correlation Test)
The determination of the correlation between CH4 emissions and the operating parameters was obtained using Monte Carlo simulation. One simulation and 1000 iterations were applied using @RISK software (version 6). The simulation tool derived from the software algorithm is given in Equation (13). In Equation (13), C is the correspondence between CH4 (GHG) (desirable output) and the inputs, which are pH, ORP, DO, M, and T. For each parameter, the simulation was repeated to define the correlation.
After simulation, the correlation coefficients (R2) related to the inputs and desirable output were determined to obtain the correspondence. If R2 was higher, the input was closely related to the desirable output.
3. Results
3.1. Results of CH4 Emission Measurements
This study revealed that malt dust-derived biochar could uptake CH4 emissions from dam lake treatments. The CH4 removal capacity of the biochar generated at 250 °C was better than at 300 °C and 500 °C. This result overlapped with the experimental adsorption results in terms of gas adsorption. Figure 3 shows the seasonal variations in CH4 emissions before and after biochar adsorption. The CH4 emission values related to the biochar adsorption process were the average values (mean values) of the CH4 emissions after the biochar adsorption processes using three biochars (M1, M2, and M3) separately (Figure 3). According to the CH4 emission measurements, the CH4 emissions related to the biochar adsorption processes were lower than before treatment. This result confirmed that the biochar adsorption process could reduce the CH4 emissions resulting from dam lake treatment. The highest CH4 emissions were measured in the summer, with a value of 468.72 kg CO2e/d (with no biochar adsorption). This could be a result of the increasing activity of methanogenesis in the summer period as well as increasing evaporation. The lowest CH4 emissions were reported in the winter, which is related to the biochar adsorption process (248.31 kg CO2e/d). Temperature was the main factor in the reduction in CH4 emissions during the cold period.
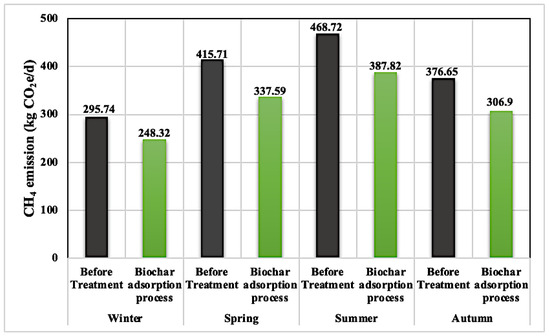
Figure 3.
Seasonal variations in CH4 emissions (a total of 4 water samples and 16 gas samples).
Table 2 shows the CH4 removal using M1, M2, and M3. This biochar removed the methane originating from the dam lake treatment. The highest CH4 removal belonged to the malt dust-derived biochar generated at the lowest temperature (250 °C) (M1) (19.4%, 19%, 18.5%, and 17.3%). The lowest CH4 removal rate corresponded to the malt dust-derived biochar produced at the highest temperature (500 °C) (M3) (14.8%, 16.28%, 18.06%, and 18.1%). The control sample was based on a raw water sample before treatment for each season. One sample was used for each biochar for each season. A total of four water samples were performed for four seasons. One water sample was applied for each season. There were no replicates. The results of the biochar analyses overlapped with the removal amounts. The biggest surface area and higher porosity corresponded to M1 among the three types of biochar. As seen, if the temperature of pyrolysis is increased, the capacity of uptake is decreased.

Table 2.
CH4 removal using malt dust-derived biochar (%) (a total of 4 water samples and 16 gas samples).
3.2. Results of Biochar Analyses and Adsorption
The results of the CH4 adsorption onto the biochar are given in Table 3. The highest CH4 capacity was related to M1, which was the biochar generated at the lowest pyrolysis temperature (250 °C) (5.85 mmol/g). The lowest CH4 adsorption capacity corresponded to M3, which was produced at the highest temperature (500 °C) (5.61 mmol/g). This could have originated, given that the biochar produced from malt dust contained many functional groups, as observed during the FTIR analyses. It is considered that containing functional groups triggered the CH4 adsorption.

Table 3.
Results of experimental adsorption (Dubinin–Radushkevich isotherm CH4 adsorption) and gas adsorption capacity of biochar.
Pseudo-first-order and pseudo-second-order kinetic models were applied to determine the adsorption kinetics of CH4 onto the biochar (Table 4). According to the R2 values, we decided which kinetic model was fitted. Considering the R2 values, the pseudo-first-order kinetic model was fitted for the adsorption of CH4 onto the biochar. According to the models, the results were compatible with the BET analyses for CH4 adsorption. The BET analysis results are given in Table 5. According to the BET analyses, the highest surface area corresponded to M1.

Table 4.
Kinetic model parameters for CH4 adsorption by biochar.

Table 5.
Textural properties of malt dust-derived biochar.
According to the biochar analyses, there was a decrease in the amount of biochar by increasing the pyrolysis temperature. The same amounts of malt dust were pyrolyzed at three different temperatures (250, 300, and 500 °C). As the temperature increased, the specific surface areas and the amount of biochar produced decreased. When the morphology and surface structures of the biochar were examined, porosity was increased by increasing the temperature for each biochar. Similarly, the SEM analysis results confirmed this result (Figure 4). When surface analysis was performed, the biochar had a flatter structure at the highest temperature of 500 °C. It can be said that the biochar produced at 250 °C had a morphologically higher number of pores and a fibrous structure. It was estimated that the biochar produced at 250 °C would be more efficient in terms of porosity, according to the SEM images. When the biochar was examined morphologically, it could be said that they showed a biogenic origin compatible with their raw materials. All three biochar types appeared to have fibrous, prismatic, and spherical structures. Additionally, the shapes of the pores were irregular.

Figure 4.
SEM images of malt dust-derived biochar.
Figure 5 shows the XRD patterns of each type of biochar. According to the XRD spectrum, an amorphous structure was observed in all samples. FTIR analyses (Figure 6) were also applied. According to the FTIR analyses, three types of biochar contained alkaline functional groups. Malt dust-derived biochar had a higher buffering capacity due to the alkaline functional groups. Due to the alkaline functional groups, CH4 could be captured by malt dust-derived biochar. Soluble organic and inorganic alkalis can reduce short-term shock when the functional groups obtain long-term pH stability.
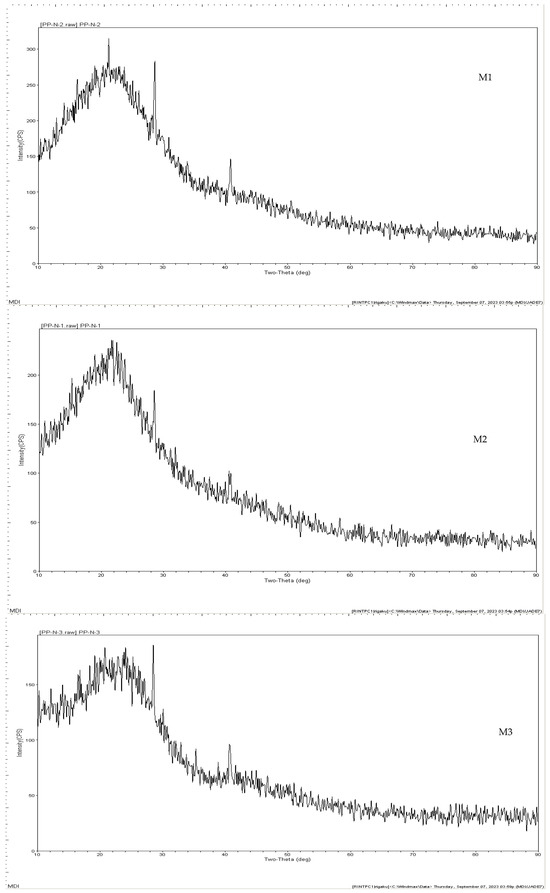
Figure 5.
XRD patterns of malt dust-derived biochar.
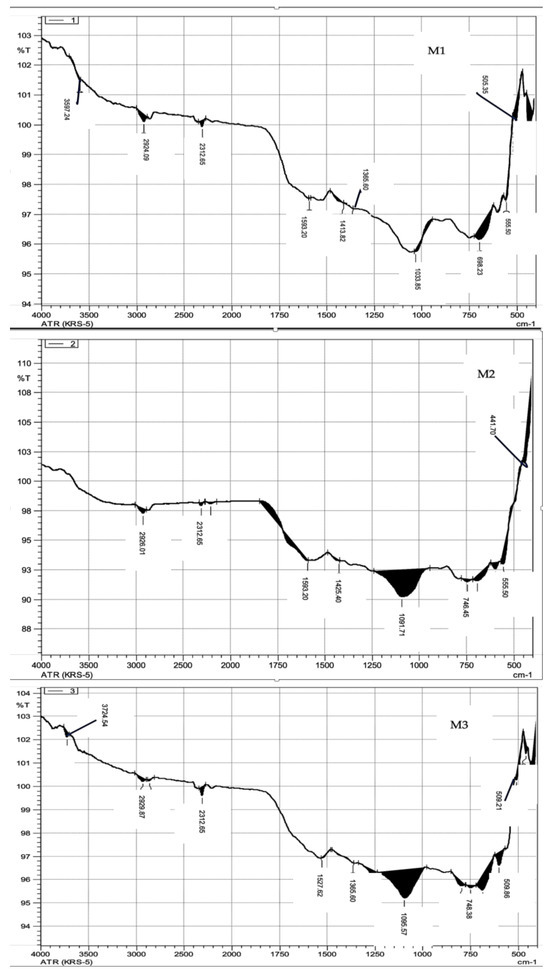
Figure 6.
FTIR spectra results of malt dust-derived biochar.
3.3. Results of Statistical Analysis and Correlation Test
The experimental design matrices for the three factors (ORP, DO, and pH) are given in Table 6. The quadratic model was selected as it had a low standard deviation (0.0055), high values of R2 (0.997), and an adjusted R2 (0.947). According to the Box–Behnken design, the optimum operating parameters for the minimum CH4 emissions were 4 mg/L of dissolved oxygen, −359 mV of ORP, and 7.5 pH (Table 6). Figure 7 demonstrates the converged plot of the recommended method. Figure 8 shows the empirical interaction between the optimum operating parameters and independent variables. According to Figure 7, a convergence of three responses was observed. This outcome carried significant meaning. According to the empirical interaction, DO had the highest optimal parameters for three responses.

Table 6.
Experimental design matrices for ORP, DO, and pH.
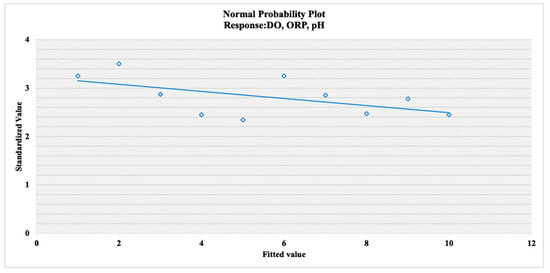
Figure 7.
Normal probability plot for recommended methodology.
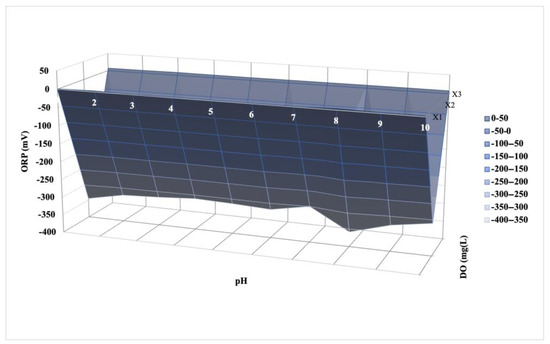
Figure 8.
Response surface (the experimental correlation between the optimum operating parameters and independent variables).
The significance test was performed. The degree of statistical significance was given by the p-value. The ANOVA results for the Box–Behnken regression model, which was designed for an optimum ORP, DO, and pH, are shown in Table 7. The statistical ANOVA test showed that the correspondence was higher, with an R2 (adjusted) value of 94.70%. According to the analysis, the optimum operating parameters were 4 mg/L of DO, −359 mV of ORP, and 7.5 pH. The developed model had a p-value of 0.015, which showed higher significance. Thus, it gained significance, as this model can also be applied to other dam lake treatment systems. Also, this p-value validated the correlation between the CH4 emissions and the DO, ORP, and pH.

Table 7.
ANOVA results for Box–Behnken regression model.
A Monte Carlo simulation was performed to determine the correlation between the CH4 emissions and operating parameters. According to the Monte Carlo simulation, the highest correlation (R2 = 0.99) was observed between the CH4 emissions and DO. The simulation and correlation results are given in Table 8 in detail. ORP followed the DO in terms of a higher correlation. The lowest correlation was observed between the CH4 emission and pH. The response surface overlapped with the simulation results. According to the empirical correlation, the DO and CH4 emissions had the highest correlation. According to the response surface, the pH had the minimum correlation with CH4 emissions according to the Monte Carlo simulation.

Table 8.
Results of Monte Carlo simulation related to the correlation between inputs and desirable output.
In the literature, a Monte Carlo simulation was performed for the water resources. Ballio et al. (2004) investigated the convergence in groundwater hydrology using Monte Carlo simulation [32]. They similarly conducted a simulation study [32]. They similarly found that the Monte Carlo simulation was the best tool for predicting uncertainty in water resources [32]. They performed 200.000 Monte Carlo flow iterations. Another study was applied by Schiavo (2024) and related to a Monte Carlo simulation for water resources [33]. They similarly used 1000 iterations for their study [33]. They used the hydrogeological numerical model for groundwater flow. In this study, this tool was used for the correlation analysis.
3.4. Results and Validation of MCI Based on Biochar Adsorption Process
Similarly, with the experimental adsorption and BET results, the most effective biochar was the M1, which was generated at the lowest temperature (250 °C) with the highest methane capture capacity. This indicator was more effective and was near to 1 (100% of the capture capacity). In summer, the values of the methane capture index were calculated at the highest value (79, 77.9, and 76%, respectively, for M1, M2, and M3) due to higher CH4 emissions (Figure 9). Seasonal changes in temperature affected the capture capacity. The average MCI values of M1, M2, and M3 were reported as 77.9, 76.9, and 74.2%, respectively. These values confirmed that agro-industrial biochar could capture CH4 emissions and reduce the activity of methanogenesis in the dam lake.
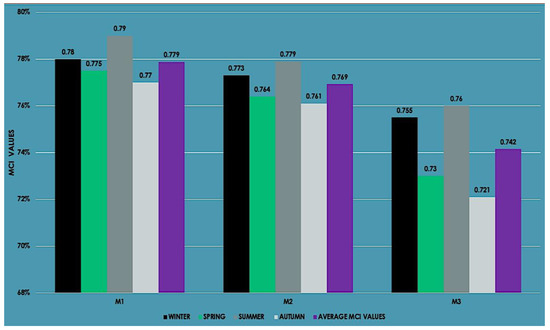
Figure 9.
MCI values based on the biochar adsorption process.
After the development of MCI, a Monte Carlo simulation was performed to validate the recommended models. A sensitivity analysis was applied to validate the indicator. The simulation results are given in Figure 10. The indicator was meaningful in the range of 93.97 and 95.07%. The standard deviation was 0.03. This result validated that this indicator could be applied to all methane-emitter water resources. One of these resources was dam lakes.
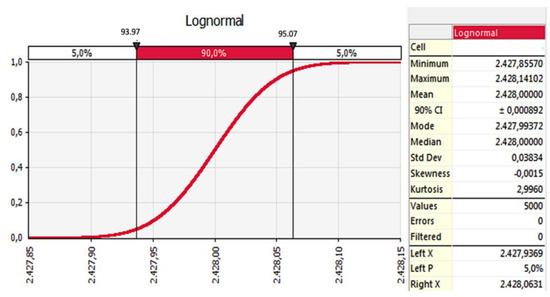
Figure 10.
Validation of recommended model (MCI) (simulation results).
4. Discussion
In the literature, there were limited studies related to this topic. Also, there was limited information related to the emissions and concentration of methane from water reservoir treatment. Gruca-Rokosz and Cieśla (2021) reported that the diffusive CH4 emission water–air interface in reservoirs varied in the range of 0.02 and 2500 mmol/m2d [18]. They only focused on reservoirs. They reported the effect of biogenic materials (expressed as phosphorus and nitrogen) on CH4 flux. Oppositely, Chaudhary et al. (2017) and Berberich et al. (2019) showed no correlation between the abundance of methanogens and CH4 production in reservoirs [34,35]. In this study, the highest CH4 emission was observed in summer at higher temperatures over 45 °C. Therefore, it could be said that thermophilic conditions triggered the CH4 emissions and the activity of methanogenic microorganisms. Similarly to this study, Beaulieu et al. (2016) reported the highest CH4 emissions in the summer season, with values of 4.8 (±2.1), 33.0 (±10.7), and 8.3 (±2.2) mg CH4 m−2 h−1 for a water reservoir [20]. Apart from these studies, this study concentrated on mitigating the CH4 emissions. In contrast with this study, biochar enhanced CH4 generation for the anaerobic configurations in many studies. The boosting impact could result in biochar easily adsorbing CO2 in the biogas in higher amounts. Indirectly, a reduction in CO2 could lead to an increase in CH4 in the biogas content. Lim et al. (2020) increased CH4 generation by 18% using wood chip-derived biochar [36]. A reduction in CO2 could trigger an increase in CH4 content and production in biogas formation. Yu et al. (2021) investigated the effects of rice husk-derived biochar on CH4 production [37]. They reported that the volumetric CH4 production rate enhanced in the range of 27.8–96.4% [37]. In this study, CH4 uptake capacity was investigated using malt dust-derived biochar. In comparison to the study by Lim et al. (2020), malt dust-derived biochar had a higher CH4 adsorption capacity than wood chip-derived biochar [36]. There were limited studies and restricted focus related to CH4 emissions reduction from drinking water treatment. Maksimavicius and Roslev (2020) investigated the amount of CH4 and the formation of methane-oxidizing bacteria in groundwater treatment plant removal [4].
5. Conclusions
Biochar derived from malt dust was evidenced to reduce the CH4 emissions resulting from dam lake treatment by reducing microbial activity and promoting buffering capacity. Due to its characterization, biochar has gained much attention in capturing and removing greenhouse gas emissions. A new methane capture index was developed and validated in this study. This study represented an experimental calculation methodology related to biochar application in order to reduce the CH4 emissions from water reservoir treatment. This study confirmed that agro-industrial biochar is a cost-effective and environmentally friendly application that can reduce CH4 emissions. DO, ORP, and pH were the most important operating parameters that affected the CH4 emissions. Therefore, case studies based on the practical application of biochar in full-scale water treatment systems should be increased in future research. Also, this study recommends cleaner production and waste reduction for brewery industries. Malt dust could be used as feedstock to produce biochar for various applications.
Author Contributions
Conceptualization, P.S.Y.; methodology, P.S.Y.; software, P.S.Y.; validation, P.S.Y.; investigation, P.S.Y.; data curation, M.İ.Y.; writing—original draft preparation, P.S.Y.; writing—review and editing, M.İ.Y.; visualization, P.S.Y.; supervision, M.İ.Y.; project administration, M.İ.Y. All authors have read and agreed to the published version of the manuscript.
Funding
This research received no external funding.
Data Availability Statement
The data presented in this study are available upon request from the corresponding author.
Conflicts of Interest
The authors declare no conflicts of interest.
References
- EU European (EU) Commission. A clean planet for all—A European strategic long-term vision for a prosperous, modern, competitive and climate neutral economy. In European Green Deal; (COM (2018) 773); European Commission: Brussels, Belgium, 2018. [Google Scholar]
- European Union (EU) Commission. Report on GREEN DEAL Framework and Fit for 55 Legislation Package; European Commission: Brussels, Belgium, 2021. [Google Scholar]
- IPCC Sixth Assessment Report. Climate Change 2022: Impacts, Adaptation and Vulnerability; IPCC: Cambridge, UK, 2022. [Google Scholar]
- Maksimavičius, E.; Roslev, P. Methane emission and methanotrophic activity in water storage reservoir-fed drinking water treatment plants. Water Supply 2020, 20, 819–827. [Google Scholar] [CrossRef]
- Kulongoski, J.T.; McMahon, P.B.; Land, M.; Wright, M.T.; Johnson, T.A.; Landon, M.K. Origin of methane and sources of high concentrations in Los Angeles water storage reservoir. J. Geophys. Res. Biogeosciences 2018, 123, 818–831. [Google Scholar] [CrossRef]
- Kulongoski, J.T.; Mcmahon, P.B. Methane emissions from water storage reservoir pumping in the USA. npj Clim. Atmos. Sci. 2019, 2, 11. [Google Scholar] [CrossRef]
- Saadabadi, S.A.; van Linden, N.; Heinsbroek, A.; Aravind, P.V. A solid oxide fuel cell fuelled by methane recovered from water storage reservoir. J. Clean. Prod. 2021, 291, 125877. [Google Scholar] [CrossRef]
- European (EU) Commission. Declerations on Blue Deal. In European Blue Deal; European Commission: Brussels, Belgium, 2023. [Google Scholar]
- Hedegaard, M.J.; Deliniere, H.; Prasse, C.; Dechesne, A.; Smets, B.F.; Albrechtsen, H.J. Evidence of co-metabolic bentazone transformation by methanotrophic enrichment from awater storage reservoir-fed rapid sand filter. Water Res. 2018, 129, 105–114. [Google Scholar] [CrossRef]
- Lessmann, O.; Encinas Fernández, J.; Martínez-Cruz, K.; Peeters, F. Methane emissions due to reservoir flushing: A significant emission pathway? Biogeosciences 2023, 20, 4057–4068. [Google Scholar] [CrossRef]
- Harrison, J.A.; Prairie, Y.T.; Mercier-Blais, S.; Soued, C. Year-2020 Global Distribution and Pathways of Reservoir Methane and Carbon Dioxide Emissions According to the Greenhouse Gas from Reservoirs (G-res) Model. Glob. Biogeochem. Cycles 2021, 35, e2020GB006888. [Google Scholar] [CrossRef]
- He, Z.; Shen, J.; Zhu, Y.; Gao, J.; Zhang, D.; Pan, X. Active Anaerobic Methane Oxidation in the Water storage reservoir Table Fluctuation Zone of Rice Paddies. Water Res. 2024, 258, 121802. [Google Scholar] [CrossRef]
- Christensen, S.C.; Lopato, L.; Quinzanos, S.; Hedegaard, M.J. Does Methane Contribute to Growth of Invertebrate Communities in Drinking Water? Water 2023, 15, 1044. [Google Scholar] [CrossRef]
- Skinner, J.; Delgado, A.G.; Hyman, M.; Chu, M.Y.J. Implementation of in situ aerobic cometabolism for water storage reservoir treatment: State of the knowledge and important factors for field operation. Sci. Total Environ. 2024, 925, 171667. [Google Scholar] [CrossRef]
- Keithley, A.E.; Ryu, H.; Gomez-Alvarez, V.; Harmon, S.; Bennett-Stamper, C.; Williams, D.; Lytle, D.A. Comprehensive characterization of aerobic water storage reservoir biotreatment media. Water Res. 2023, 230, 119587. [Google Scholar] [CrossRef]
- Ragg, R.B.; Peeters, F.; Ingwersen, J.; Teiber-Siessegger, P.; Hofmann, H. Interannual Variability of Methane Storage and Emission During Autumn Overturn in a Small Lake. J. Geophys. Res. Biogeosciences 2021, 126, e2021JG006388. [Google Scholar] [CrossRef]
- Pearce, J.K.; Hofmann, H.; Baublys, K.; Golding, S.D.; Rodger, I.; Hayes, P. Sources and concentrations of methane, ethane, and CO2 in deep aquifers of the Surat Basin, Great Artesian Basin. Int. J. Coal Geol. 2023, 265, 104162. [Google Scholar] [CrossRef]
- Gruca-Rokosz, R.; Cieśla, M. Sediment methane production within eutrophic reservoirs: The importance of sedimenting organic matter. Sci. Total Environ. 2021, 799, 149219. [Google Scholar] [CrossRef] [PubMed]
- Johnson, M.S.; Matthews, E.; Bastviken, D.; Deemer, B.; Du, J.; Genovese, V. Spatiotemporal methane emission from global reservoirs. J. Geophys. Res. Biogeosciences 2021, 126, e2021JG006305. [Google Scholar] [CrossRef]
- Beaulieu, J.J.; McManus, M.G.; Nietch, C.T. Estimates of reservoir methane emissions based on a spatially balanced probabilistic-survey. Limnol. Oceanogr. 2016, 61, S27–S40. [Google Scholar] [CrossRef]
- Chen, M.; Lu, Y.; Kang, Y.; You, L.; Chen, Z.; Liu, J.; Li, P. Investigation of enhancing multi-gas transport ability of coalbed methane reservoir by oxidation treatment. Fuel 2020, 278, 118377. [Google Scholar] [CrossRef]
- Ni, Z.; Zhou, L.; Lin, Z.; Kuang, B.; Zhu, G.; Jia, J.; Wang, T. Iron-modified biochar boosts anaerobic digestion of sulfamethoxazole pharmaceutical wastewater: Performance and microbial mechanism. J. Hazard. Mater. 2023, 452, 131314. [Google Scholar] [CrossRef]
- Qambrani, N.A.; Rahman, M.M.; Won, S. Biochar properties and eco-friendly applications for climate change mit-igation, waste management, and wastewater treatment: A review. Renew. Sustain. Energy Rev. 2017, 79, 255–273. [Google Scholar] [CrossRef]
- Chiappero, M.; Norouzi, O.; Hu, M.; Demichelis, F.; Berruti, F.; Di Maria, F.; Fiore, S. Review of biochar role as additive in anaerobic digestion processes. Renew. Sustain. Energy Rev. 2020, 131, 110037. [Google Scholar] [CrossRef]
- Zhang, L.; Chen, Z.; Zhu, S.; Li, S.; Wei, C. Effects of biochar on anaerobic treatment systems: Some perspectives. Bioresour. Technol. 2022, 367, 128226. [Google Scholar] [CrossRef] [PubMed]
- Wu, X.; Zhou, Y.; Liang, M.; Lu, X.; Chen, G.; Zan, F. Insights into the role of biochar on the acidogenic process and microbial pathways in a granular sulfatereducing up-flow sludge bed reactor. Bioresour. Technol. 2022, 355, 127254. [Google Scholar] [CrossRef] [PubMed]
- Xie, J.X.; Guo, M.L.; Xie, J.W.; Chang, Y.F.; Mabruk, A.; Zhang, T.C.; Chen, C.J. COD inhibition alleviation and anammox granular sludge stability improvement by biochar addition. J. Clean. Prod. 2022, 345, 131167. [Google Scholar] [CrossRef]
- Rajapaksha, A.U.; Chen, S.S.; Tsang, D.C.; Zhang, M.; Vithanage, M.; Mandal, S.; Ok, Y.S. Engineered/designer biochar for contaminant removal/immobilization from soil and water: Potential and implication of biochar modification. Chemosphere 2016, 148, 276–291. [Google Scholar] [CrossRef] [PubMed]
- Sadhu, M.; Bhattacharya, P.; Vithanage, M.; Sudhakar, P.P. Adsorptive removal of fluoride using biochar—A potential application in drinking water treatment. Sep. Purif. Technol. 2021, 278, 119106. [Google Scholar] [CrossRef]
- American Public Health Association; American Water Works Association. Standard Methods for the Examination of Water and Wastewater; American Public Health Association: Washington, DC, USA; American Water Works Association: Denver, CO, USA, 1999. [Google Scholar]
- Metcalf, E. Wastewater Engineering: Treatment and Resource Recovery, 5th ed.; McGraw-Hill: Boston, MA, USA, 2014. [Google Scholar]
- Chaudhary, P.P.; Rulik, M.; Blaser, M. Is the methanogenic community reflecting the methane emissions of river sediments?—Comparison of two study sites. Microbiol. Open 2017, 6, e454. [Google Scholar] [CrossRef] [PubMed]
- Berberich, M.E.; Beaulieu, J.J.; Hamilton, T.L.; Waldo, S.; Buffam, I. Spatial variability of sediment methane production and methanogen communities within a eutrophic reservoir: Importance of organic matter source and quantity. Limnol. Oceanogr. 2019, 65, 1336–1358. [Google Scholar] [CrossRef]
- Lim, E.Y.; Tian, H.; Chen, Y.; Ni, K.; Zhang, J.; Tong, Y.W. Methanogenic pathway and microbial succession during start-up and stabilization of thermophilic food waste anaerobic digestion with biochar. Bioresour. Technol. 2020, 314, 123751. [Google Scholar] [CrossRef]
- Ballio, F.; Guadagnini, A. Convergence assessment of numerical Monte Carlo simulations in groundwater hydrology. Water Resour. Res. 2004, 40, W04603. [Google Scholar] [CrossRef]
- Schiavo, M. Numerical impact of variable volumes of Monte Carlo simulations of heterogeneous conductivity fields in groundwater flow models. J. Hydrol. 2024, 634, 131072. [Google Scholar] [CrossRef]
- Yu, Q.; Sun, C.; Liu, R.; Yellezuome, D.; Zhu, X.; Bai, R.; Liu, M.; Sun, M. Anaerobic co-digestion of corn stover and chicken manure using continuous stirred tank reactor: The effect of biochar addition and urea pretreatment. Bioresour. Technol. 2021, 319, 124197. [Google Scholar] [CrossRef] [PubMed]
Disclaimer/Publisher’s Note: The statements, opinions and data contained in all publications are solely those of the individual author(s) and contributor(s) and not of MDPI and/or the editor(s). MDPI and/or the editor(s) disclaim responsibility for any injury to people or property resulting from any ideas, methods, instructions or products referred to in the content. |
© 2024 by the authors. Licensee MDPI, Basel, Switzerland. This article is an open access article distributed under the terms and conditions of the Creative Commons Attribution (CC BY) license (https://creativecommons.org/licenses/by/4.0/).