Abstract
This study investigates the impact of climate change on hydrological dynamics in the Ruzizi River Basin (RRB) by leveraging a combination of observational historical data and downscaled climate model outputs. The primary objective is to evaluate changes in precipitation, temperature, and water balance components under different climate scenarios. We employed a multi-modal ensemble (MME) approach to enhance the accuracy of climate projections, integrating historical climate data spanning from 1950 to 2014 with downscaled projections for the SSP2-4.5 and SSP5-8.5 scenarios, covering future periods from 2040 to 2100. Our methodology involved calibrating and validating the SWAT model against observed hydrological data to ensure reliable simulations of future climate scenarios. The model’s performance was assessed using metrics such as R2, NSE, KGE, and PBIAS, which closely aligned with recommended standards. Results reveal a significant decline in mean annual precipitation, with reductions of up to 37.86% by mid-century under the SSP5-8.5 scenario. This decline is projected to lead to substantial reductions in surface runoff, evapotranspiration, and water yield, alongside a marked decrease in mean monthly stream flow, critically impacting agricultural, domestic, and ecological water needs. The study underscores the necessity of adaptive water resource management strategies to address these anticipated changes. Key recommendations include implementing a dynamic reservoir operation system, enhancing forecasting tools, and incorporating green infrastructure to maintain water quality, support ecosystem resilience, and ensure sustainable water use in the RRB. This research emphasizes the need for localized strategies to address climate-driven hydrological changes and protect future water resources.
1. Introduction
Climate change has emerged as a global challenge with profound impacts on water resources, ecosystems, and socioeconomic stability. Its effects are visible in rising temperatures, altered precipitation patterns, and increasing extreme weather events, which disrupt the hydrological cycle and lead to freshwater scarcity [1]. This disruption has widespread consequences, from biodiversity loss and ecosystem degradation to economic damage and population displacement, especially in developing countries where adaptive capacity is limited [2,3].
The Intergovernmental Panel on Climate Change (IPCC) warns of increased risks of droughts, heatwaves, and intense storms, exacerbating existing vulnerabilities in regions dependent on rain-fed agriculture, such as Africa [4,5]. In the Great Lakes region, rising temperatures and erratic rainfall intensify water scarcity, compounding political and social tensions and contributing to climate-induced conflicts, food insecurity, and displacement [6]. Despite the recognized global impacts of climate change on water resources, there remains a gap in understanding its localized effects on smaller, transboundary river basins such as the Ruzizi River Basin (RRB).
Existing studies have provided important insights into the broader hydrological impacts of climate change. For example, ref. [7] examined climate change effects on the water balance in the Narmada River Basin using CORDEX projections and the SWAT model, demonstrating the value of climate models in simulating future water availability [8]. However, their focus on a large river basin does not address the localized hydrological dynamics of smaller basins such as the RRB. Similarly, ref. [9] highlighted projected temperature increases and precipitation decreases in the Zarrine River Basin, emphasizing the importance of understanding climate variability for water resource management [10]. Yet, their findings do not extend to transboundary basins where political and social complexities amplify the effects of climate stress.
Ref. [11] investigated the combined effects of climate and land-use change on river flows in Uganda’s Rwizi River Basin. This study underscored the distinct impacts of climate change on high-flow quantiles, while land-use changes predominantly affected low-flow events [12]. This dual-factor approach is particularly relevant to the RRB, which faces similar challenges because of its climatic and land-use characteristics. However, the RRB remains understudied compared with other basins in East Africa. Ref. [13] also focused on climate-induced water deficits in the Mahanadi River Basin, identifying a need for strategic water management. This work reinforces the importance of localized assessments, yet there is limited application of such methodologies to the RRB, which faces unique hydrological and socioeconomic challenges [14].
A critical gap in the current literature is the limited focus on the RRB, a transboundary basin located between Rwanda, Burundi, and the Democratic Republic of Congo. This region is particularly vulnerable to climate change, but few studies have applied downscaled climate models to assess its hydrological future. Additionally, many studies rely on coarse-scale climate models, which fail to capture localized hydrological responses, making it difficult to develop tailored water management strategies.
The significance of this research lies in its application of advanced climate modeling and hydrological simulation techniques to the RRB. By using downscaled General Circulation Models (GCMs) from the latest CMIP6 climate models, which offer higher resolution, and the Soil and Water Assessment Tool (SWAT), this study provides a comprehensive analysis of the impacts of climate change on key hydrological variables such as precipitation and temperature [15,16,17,18,19,20,21,22,23,24,25]. Moreover, the integration of satellite-derived precipitation datasets, such as CHIRPS, offers a more detailed understanding of rainfall patterns in this region, where observational data are sparse [26,27,28,29,30,31].
This research advances current knowledge by filling a critical gap in the understanding of climate change’s localized effects on the RRB. It builds on the methodologies of previous studies but introduces a finer-scale analysis tailored to the specific hydrological and climatic conditions of the basin. Furthermore, by focusing on a transboundary river basin, this study addresses the complex interplay between environmental changes and political, social, and economic factors, offering insights that extend beyond the scientific community to inform regional water management policies.
2. Materials and Methods
2.1. Study Area
The RRB is a strategically important transboundary watershed in the Great Lakes region, covering an area of approximately 5253.97 km2. It is shared by three countries: Rwanda and Burundi from the northeast to the southeast and the Democratic Republic of the Congo from the northwest to the southwest (Figure 1). The RRB serves as a crucial hydrological feature in this region, draining water from Lake Kivu and feeding into Lake Tanganyika through the Ruzizi River, which forms the southern and northern boundaries of the basin. The selection of this basin for our study is motivated by its transboundary significance, hydrological importance, and unique environmental challenges.
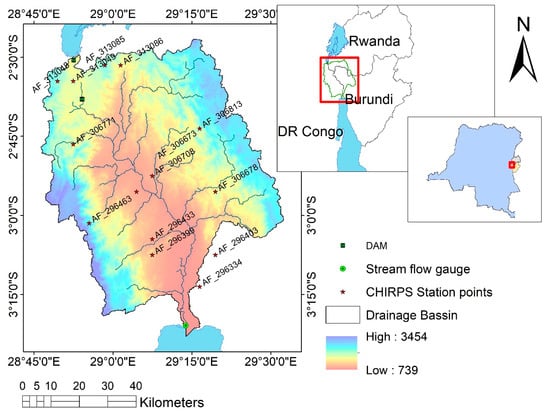
Figure 1.
Study Area.
The RRB plays a vital role in regional water security and energy production. Its transboundary nature requires coordinated water management between the three countries, making it a sensitive region in terms of both hydropolitics and environmental conservation. The Ruzizi River itself is a lifeline for millions of people in the region, serving as a source of water for domestic, agricultural, and industrial purposes. Additionally, the river supports crucial hydroelectric power generation, with the Ruzizi 1 (29.8 MW) and Ruzizi 2 (43.8 MW) dams, which have been operational since 1959 and 1989, respectively, providing much-needed electricity to the surrounding areas [32].
Furthermore, the basin is highly vulnerable to the impacts of climate change due to its diverse climatic conditions, complex topography, and socio-economic dependence on water resources. This makes the RRB an ideal case study for assessing climate variability and its effects on water availability, which is critical for the development of adaptive strategies for water resource management, agriculture, and energy production. The basin’s geopolitical and socio-economic importance further underscores the need for sustainable and cooperative management, especially given the potential for water-related conflicts in the future.
The RRB is located in a geologically active region shaped by the East African Rift, characterized by frequent seismic and volcanic activity that contributes to landslides and other hazards. The terrain consists primarily of basaltic rocks from the Cenozoic era, with sediment deposits and Precambrian gneisses prevalent in the valley. These geological factors influence the basin’s water retention and runoff patterns, making hydrological modeling especially complex.
Climatically, the basin experiences a diverse climate that affects precipitation and temperature patterns, with rainfall varying between 560 mm during the wettest months to 74.62 mm in the driest months. The temperature fluctuates from a high of 28.6 °C in warmer periods to a low of 14.6 °C during cooler times. This variability has profound implications for agriculture, water resource management, and energy production in the region, making it critical to study how these climatic factors will evolve under future climate change scenarios. The RRB is marked by varied land use and soil types that further complicate its environmental and hydrological dynamics. Forests and range-bush land cover 44.11% and 40.9% of the basin, respectively, while agricultural activities and built-up areas constitute 13.75%. The soils, including humic ferralsols and dystric nitosols, which cover 3.05% and 16.68% of the area, respectively, are vital for agricultural productivity but also present challenges in terms of water retention and erosion.
The basin’s land use patterns and soil composition, combined with its complex climate and topography, highlight an urgent need for integrated management approaches to address water availability, agricultural productivity, and energy security.
2.2. Data
Spatial data for this research were primarily derived from a Digital Elevation Model (DEM) obtained from HydroSHEDS (https://www.hydrosheds.org/, accessed on 5 February 2024) with a resolution of 90 m, chosen to optimize computation time in the HRUs processing for SWAT. This DEM facilitated the determination of subbasin parameters such as slope gradient, slope length, elevation bands, and the stream network. A multispectral image from Landsat 8, ensuring less than 10% cloud coverage, was sourced via the USGS Earth Explorer platform (https://earthexplorer.usgs.gov/, accessed on 14 January 2024) to supplement the spatial dataset. This imagery was pivotal in developing a comprehensive Land Use Land Cover (LULC) map through a detailed supervised classification process in ArcGIS 10.8.2 (Figure 2a). A soil map from the FAO’s official website, accessed on 14 January 2024 (https://www.fao.org/soils-portal/en/ https://earthexplorer.usgs.gov/, accessed on 14 January 2024), was also processed with ArcGIS 10.8.2 (Figure 2b) for integration into the SWAT model, enriching this study’s spatial analysis framework.
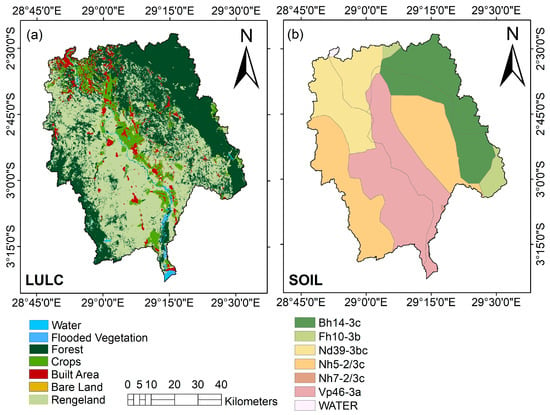
Figure 2.
LULC (a) and Soil map (b) of the RRB.
In exploring the response of the RRB to climate change, this study utilized advanced climate models from the Coupled Model Intercomparison Project Phase 6 (CMIP6), focusing on two scenarios: SSP2-4.5 and SSP5-8.5. Three General Circulation Models (GCMs) were selected for their accuracy in climate simulation: MIROC6, MRI-ESM2-0, and MPI-ESM1-2-LR, with spatial resolutions of 1.4° × 1.4°, 1.1° × 1.1°, and 0.94° × 0.94°, respectively. These models were used to downscale future climate data, as detailed in studies by [33,34,35]. The bias between observed and simulated data was corrected using the distribution mapping approach which has demonstrated better performance compared with other methods in previous studies [36,37]. Climate data covering daily precipitation and maximum and minimum temperatures for historical (1950–2014) and future periods (2040–2100) were sourced from CMIP6 projections via the Copernicus Climate Data Store. The analysis spans two future periods, mid-future (2040–2069) and far-future (2070–2100), with a historical baseline from 1983 to 2020 for comparative analysis.
Additionally, hydro-meteorological data were comprehensively collected from the Climate Hazards Group InfraRed Precipitation with Station data (CHIRPS) database, providing historical daily data on temperatures and precipitation. This database is produced through a multi-step synthesis that combines satellite observations with ground-based station data, ensuring its dependability and adaptability for scientific research in areas such as climate studies, hydrological modeling, and agricultural assessments. Designed to aid the United States Agency for International Development’s Famine Early Warning Systems Network (FEWS NET), CHIRPS utilizes techniques from effective thermal infrared (TIR) precipitation products, including the NOAA Rainfall Estimate (RFE2) and the African Rainfall Climatology [38]. Streamflow data for the Gatumba Bridge were obtained from the Institut Géographique Burundi (IGEBU), contributing to the calibration and validation of the Soil and Water Assessment Tool (SWAT) model. This meticulous data collection and application framework underscores this study’s comprehensive approach to accurately assess the impacts of climate change on the RRB’s water resources.
2.3. SWAT Model Setup
In this study, the SWAT model was employed to simulate hydrological processes within the RRB. SWAT is a sophisticated, process-based, semi-distributed model designed for hydrology and environmental quality assessment. It was chosen for its ability to comprehensively simulate the effects of land use, climate change, and water management practices on hydrological systems, which is crucial for understanding the RRB. The capacity of SWAT to handle diverse data inputs, such as precipitation, temperature, and land use, makes it particularly well-suited for assessing climate change impacts, including projections based on CMIP6 data [39,40]. The model has been extensively validated in similar studies, especially in transboundary and complex hydrological settings such as the RRB [41,42], which increases confidence in its results. Its flexibility, integration with GIS, and open-source nature also make it highly accessible and customizable for specific research needs, further justifying its selection for this study. Detailed operational aspects of the model are thoroughly outlined in the works of ref. [43,44].
Three essential inputs were required to develop the SWAT model: a soil map, a land use/land cover (LULC) map, and a digital elevation model (DEM). The DEM facilitated the delineation of the watershed into 30 subbasins, covering an area of 5253.9 square kilometers. Hydrological Response Units (HRUs) were defined by overlaying soil, land use, and slope maps. Slope categories were chosen to include ranges of 0–5%, 5–20%, 20–30%, and over 50% within the Ruzizi Basin. This process resulted in the formation of 376 HRUs after setting the threshold for land use, soil, and slope combinations to 10%. The SWAT model was then executed using observed climate data for precipitation and temperature, while the model’s built-in weather generator produced the remaining climatic variables. The model underwent calibration before being used to evaluate the impacts of climate change on the RRB. This comprehensive approach ensured a detailed representation of the basin’s hydrological behavior, enabling a nuanced assessment of climate change’s potential effects.
2.3.1. SWAT Model Sensitivity Analysis, Calibration and Validation
The parameter sensitivity analysis is crucial for identifying key flow parameters for the calibration and validation of the SWAT model. This analysis was facilitated using the SWAT-CUP tool, specifically the Sequential Uncertainty Fitting version 2 (SUFI-2) method, known for its effectiveness in numerous global studies [43,44]. To conduct the streamflow sensitivity analysis, average daily streamflow data from 2009 to 2014 were collected from a hydrological station at the MUTIMBUZI bridge, provided by the Institut Géographique du Burundi (IGEBU). The analysis involved selecting 22 hydrological parameters identified from the literature for their potential impact on model output and performing a global sensitivity analysis within SWAT-CUP (Table 1). This process utilized multiple regression methods and Latin hypercube sampling of the objective function [45]. Parameters were assessed based on t-statistics and p-values across 1000 simulations, where large absolute t-statistics and p-values near zero indicated high sensitivity.

Table 1.
SWAT-CUP parameters with their initial range.
The SWAT model was calibrated over a six-year period and validated over a subsequent three-year period (2015–2017). Before application, the quality of streamflow data was assessed rigorously. Calibration and validation were designed to cover a range of hydrological conditions, ensuring that the mean and variance of streamflow data during these periods aligned closely to capture both wet and dry years. The calibration process involved six iterations of 500 simulations each to minimize discrepancies between observed and simulated streamflow data. This comprehensive approach ensured that the SWAT model was finely tuned, incorporating both highly sensitive and less sensitive parameters to simulate the hydrological dynamics of the study area accurately.
2.3.2. SWAT Model Performance
To assess the performance of SWAT, the Nash–Sutcliffe Efficiency (NSE), Coefficient of Determination (R2), Kling–Gupta Efficiency (KGE), and Percentage Bias (PBIAS) (Table 2) were used as performance metrics [46,47]. The goodness of fit between the observed and estimated streamflow determined model performance. Specifically, NSE and R2, with values ranging from 0.70 to 0.80, indicate satisfactory streamflow simulation. Additionally, NSE values between 0.5 and <0.65 are considered satisfactory. PBIAS, with an optimal value of 0, quantifies the propensity of simulated data to predict observed data accurately, and a low-magnitude PBIAS indicates a more accurate model simulation. For monthly time steps, PBIAS < ±10 is considered very good [48]. For KGE, a value of 1 is considered ideal, above 0.75 is good, and between 0.5 and 0.75 is intermediate.

Table 2.
Calibration Performance metrics.
2.4. Model Application and Scenario Analysis
The calibrated and validated SWAT model was used to conduct a detailed scenario analysis to evaluate the impacts of climate change on hydrological processes within the RRB. This analysis compared historical baseline conditions (1983–2014) with projections under two Shared Socioeconomic Pathways (SSPs): SSP2-4.5 (middle of the road) and SSP5-8.5 (high emissions), covering mid-term (2040–2069) and far-term (2070–2100) periods. These scenarios offer a range of plausible futures based on varying levels of greenhouse gas emissions and socioeconomic developments, which are critical for assessing potential impacts on regional hydrology [49]. Initially, the SWAT model simulated historical baseline conditions using past climate data. This phase established a reference point for assessing future changes. Model inputs included observed precipitation and temperature collected from the CHIRPS dataset. Outputs provided baseline data on key hydrological components such as streamflow, water yield, and runoff, which were used to benchmark against future scenarios.
Following the baseline simulation, the model applied downscaled climate projections under SSP2-4.5 and SSP5-8.5 to predict hydrological responses for the mid and far-term periods. This involved adjusting climate inputs to reflect expected changes in temperature and precipitation patterns according to each SSP scenario. The primary focus was to examine how these changes could affect water resources, particularly the water balance components of the basin. The core of the scenario analysis involved contrasting simulated future conditions against the historical baseline to discern the hydrological impacts of climate change.
2.5. Mann–Kendall (MK) Test
The primary techniques for analyzing time series data in climate change research involve trend analysis [36]. This approach aims to identify overarching patterns of increases or decreases in the dataset. There are two main categories of trend analysis: nonparametric and parametric methods. Nonparametric methods, such as the Mann–Kendall trend test and Spearman’s rho, are popular because of their simplicity and ease of implementation [50]. However, parametric methods, such as quantile regression, are gaining popularity because they offer a more detailed description of the trend [51]. Despite their advantages, parametric methods often require assumptions that are not feasible for most hydroclimatological time series data. In contrast, nonparametric methods can be applied to time series data that are more independent and less influenced by outliers [52]. For this study, the Mann–Kendall (MK) test was chosen to assess the trend in stream flow data for both historical and future periods because of its reliability in detecting monotonic trends in hydroclimate–climate time series data because of its reliability in detecting monotonic trends in hydroclimate–climate time series data [36,53], and because it is easy to calculate and not affected by a few outliers. Table 3 shows the interpretation of the Z value (ZMK) of the MK test at a significance level of 0.05 that was used for this investigation [54]. The details about the MK test computation are further detailed by ref. [55].

Table 3.
Description of the concept Mann–Kendall trend test at p = 0.05 of significant level based on ZMK [56].
3. Results
3.1. Downscaling and Climate Projection
The spatial distribution of the ensemble mean annual rainfall and temperature across the Ruzizi watershed for the period 1983–2014 was analyzed using both observed and simulated data (Figure 3) to assess the reliability of the GCMs and the effectiveness of bias correction. The maps showed consistent patterns for mean annual precipitation, minimum temperature (Tmin), and maximum temperature (Tmax). For rainfall (Figure 3a,b), the upper, eastern, and western regions of the watershed, characterized by higher elevations, received more rainfall (1337 to 1582 mm) compared with other areas. This distribution pattern was consistent in both observed and modeled data, highlighting the models’ accuracy in capturing the watershed’s hydroclimatic dynamics. In terms of temperature distribution, both observed and simulated data (Figure 3c,d for Tmax and Figure 3e,f for Tmin) displayed similar spatial patterns. Tmax ranged from 23 °C to 31 °C, and Tmin ranged from 12 °C to 20 °C. Higher temperatures were found in the lower and mid-lower regions of the watershed, while cooler temperatures prevailed in the elevated eastern and western sections. This temperature gradient reflects the influence of elevation on the watershed’s thermal regime.
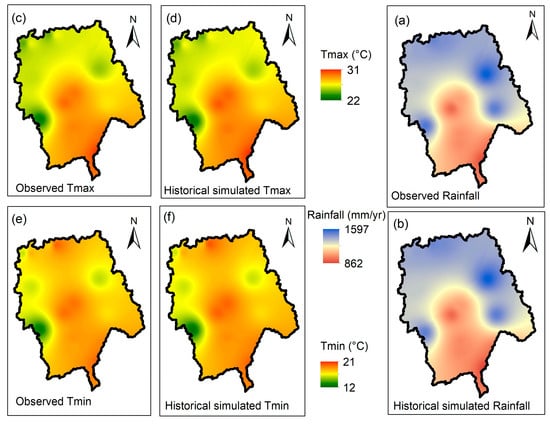
Figure 3.
Spatial analysis in the RRB (1983–2014): Panels (a,b) show observed and ensemble average rainfall, (c,d) detail Tmax, and (e,f) Tmin, presenting comprehensive climate data comparison.
The observed mean values for rainfall (1253.43 mm), maximum temperature (27.30 °C), and minimum temperature (17.93 °C) closely matched the simulated values from the MME of rainfall (1242.74 mm), maximum temperature (27.30 °C), and minimum temperature (17.93 °C). The percent biases (Pbias) for these measurements were −0.0002%, −0.0004%, and −0.85%, respectively, indicating a slight underestimation, particularly for rainfall. However, these biases were insignificant. The normalized root mean square error (NRMSE) values of 1.09, 1.67, and 1.31 further demonstrated a strong agreement between observed satellite-derived data from CHIRPS and historical downscaled data [57].
3.2. Hydrological Model Performance Evaluation
The model’s performance was quantitatively assessed using statistical indices alongside the P-factor and R-factor, derived from the calibration and validation results. The P-factor quantifies the proportion of observed data enveloped by the 95% prediction uncertainty (95PPU), signifying the reliability of the model predictions. Conversely, the R-factor, representing the relative width of the 95PPU interval, is calculated as the ratio of the average width of the 95PPU to the standard deviation of observed data, as outlined by [45]. The calibration phase yielded P-factor and R-factor values of 1 and 0.71, respectively, aligning with the acceptable standards [45].
The model elucidated heightened sensitivity for five paramount flow parameters in a comprehensive global sensitivity analysis of 22 distinct streamflow parameters, namely V__GW_DELAY.gw (Groundwater Delay), R__SOL_AWC.sol (Soil Available Water Content), V__GWQMN.gw (Minimum Groundwater Threshold for Flow), R__GW_REVAP.gw (Groundwater Revap Coefficient), and R__SURLAG.bsn (Surface Runoff Lag Coefficient), as evidenced by their t-statistics and p-values (Table 4). Despite having the five most sensitive parameters, it was understood that all the selected 22 parameters played a pivotal role in streamflow modulation within the SWAT model’s computational architecture. All 22 parameters were meticulously adjusted through iterative refinement within scientifically justifiable bounds to enhance the model’s fidelity. This iterative calibration aimed to achieve an optimal congruence between observed and simulated streamflow outputs.

Table 4.
Statistical Analysis of SWAT CUP Parameters: Evaluating Model Sensitivity and Reliability through t-Statistics and p-Values.
The comparison of observed monthly mean streamflows at the RRB outlet with the corresponding simulated discharges, as illustrated in Figure 4, was pivotal for the calibration and validation phases of the SWAT model. The statistical analysis during both calibration and validation phases indicated robust model performance, with calibration statistics of R2 = 0.76, NSE = 0.64, KGE = 0.74, and PBIAS = 0.2%, and validation period statistics of NSE = 0.70, PBIAS = 0.1%, KGE = 0.63, and R2 = 0.74. These findings underscore the SWAT model’s efficacy in simulating streamflow within the RRB, adhering to the established benchmarks for hydrological modeling accuracy.
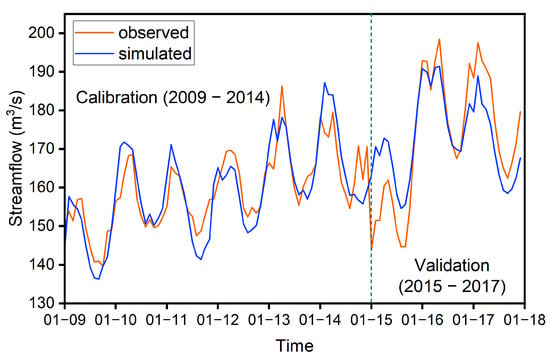
Figure 4.
Temporal Evaluation of SWAT Model Calibration (2009–2014) and Validation (2015–2017) Phases: Analyzing Model Performance Over Two Distinct Timeframes.
3.3. Climate Change Impacts on the Water Budget
The SWAT model’s simulations provide a foundational baseline and forward-looking annual and monthly estimates of water balance components, which are crucial for understanding hydrological dynamics within the watershed. Figure 5 elucidates the mean annual simulated water balance components and the average monthly basin values (Figure 5b) derived from the baseline model execution spanning 1987–2020, correlating these components directly with precipitation levels. Consequently, the analysis delineated an average annual precipitation of 1326.26 mm from 1987 to 2020 (Figure 5a). Of this, 26.827% (equivalent to 355.8 mm) was attributable to evapotranspiration (ET) losses within the watershed. The groundwater return flow (GW_Q) constituted 69.158% (917.22 mm) of the annual rainfall, juxtaposed with a minuscule surface runoff (SURQ) rate of 0.023% (0.31 mm), alongside a 3.64% (48.28) recharge to the deep aquifer, and 0.002% (0,02 mm) to lateral flow.
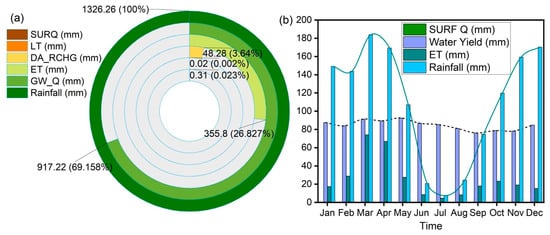
Figure 5.
Comprehensive Overview of the Annual Water Budget (a) and Monthly Distribution (b) in the Ruzizi Basin: Average Annual and Monthly Basin Values Spanning from 1983 to 2020.
Further scrutiny into the mean monthly distribution of the simulated water balance components for the baseline period, as depicted in Figure 5b, unveils that the zenith of rainfall (183.8 mm) occurred in March. Surface runoff (SURF_Q), despite its overall minor role across the annual spectrum, emerged as a notable component of water loss monthly, overshadowed by the other water balance elements due to the watershed’s low curve number and elevated actual evapotranspiration rates, thereby relegating surface runoff beneath the groundwater contributions from shallow aquifers. The analysis also noted a relatively stable water yield (WYLD) across the months, underscoring the nuanced interplay between surface and subsurface hydrological processes.
3.3.1. Impact of Climate Change on Monthly Water Budget
The primary water balance components within the watershed were evaluated under projected monthly climate conditions, focusing on evapotranspiration (ET), lateral flow, and water yield, crucial parameters predicted by the SWAT model for effective water management and planning in the study area. The mean monthly rainfall (Figure 6a) was also examined, revealing a consistent decrease across all months under SSP2-4.5 and SSP5-8.5 scenarios compared with the baseline period (1983–2020).
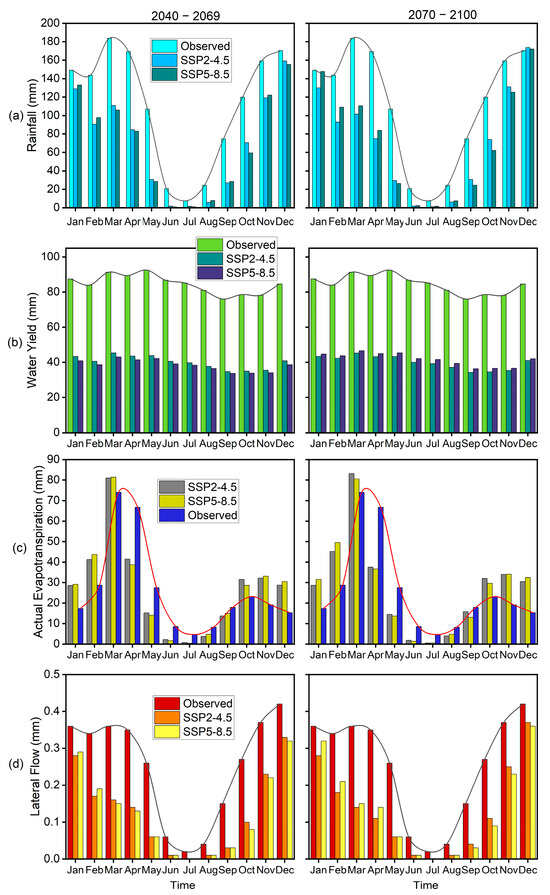
Figure 6.
Monthly Hydrological Components under Future Climate Scenarios in the Ruzizi Watershed: (a) rainfall, (b) water yield, (c) actual evapotranspiration, and (d) lateral flow for both mid and far-term future periods.
Furthermore, under both scenarios, water yield (Figure 6b) exhibited a nearly halved decrease across all months in both mid and far-term futures. Actual evapotranspiration (Figure 6c) demonstrated an increase from January to March and October to December, coupled with a decline from April to September, in both future periods (2040–2069 and 2070–2099) under both SSP2-4.5 and SSP5-8.5 scenarios compared with the baseline. Moreover, the mean monthly lateral flow (Figure 6d) showed a decrease in the future under both scenarios compared with the baseline. This decrease in water yield within the Ruzizi watershed was attributable to the projected temperature increase and future fluctuations, particularly during wet months.
3.3.2. Impact of Climate Change on Annual Water Budget
The SWAT model projections illuminate the anticipated alterations in water balance components due to climate change impacts under the Representative Concentration Pathways SSP2-4.5 and SSP5-8.5 scenarios compared with historical baselines (Table 5). The analysis underscores a notable reduction in mean annual precipitation from the baseline value of 1326.30 mm across all future periods, specifically during the mid-century (2040–2069) and late-century (2070–2100) under both scenarios. Under the SSP2-4.5 scenario, the mean annual precipitation is projected to decrease by 37.35% (equivalent to a reduction of 495.40 mm) between 2040 and 2069 and 36.29% (481.30 mm) between 2070 and 2100. Evapotranspiration (ET) is anticipated to exhibit a slight decrease of 1.24% (4.40 mm) from 2040 to 2069, followed by a marginal increase of 0.28% (1 mm) towards the end of the century (2070–2100). Water yield (WYLD) is expected to significantly decrease by 51.80% (475.31 mm) in the mid-term and by 50.66% (464.85 mm) in the late-century period, relative to the historical records. For the more severe SSP5-8.5 scenario, projections indicate a greater reduction in precipitation by 37.86% (502.2 mm) for the mid-century and 34.43% (456.7 mm) for the late-century. Evapotranspiration is forecasted to decrease by 0.96% in the mid-century and increase by 1.04% towards the end of the century. Similarly, compared with historical averages, water yield is projected to decrease significantly by 52.10% in the mid-century and by 48.59% in the late century. These projections elucidate a significant downward trend in rainfall, which critically affects the other water balance components across both scenarios. Specifically, surface runoff is anticipated to decrease markedly in future periods, illustrating a substantial divergence from historical patterns. This quantification of climate change impacts on hydrological processes within the SWAT model framework provides crucial insights for water resource management and adaptation strategies in changing climatic conditions.

Table 5.
SWAT Model Water Balance Analysis Under SSP2-4.5 and SSP5-8.5: Comparative table details shifts in annual precipitation, evapotranspiration (ET), and water yield (WYLD) for mid (2040–2069) and late (2070–2100) century versus baseline.
It is important to clarify that SUR_Q refers to surface runoff, GW_Q denotes the groundwater contribution to streamflow, LAT_Q represents lateral flow, and WYLD signifies water yield. These terms are critical for understanding the hydrological processes modeled in the study.
The analysis of spatial distribution for mean annual evapotranspiration (ET) and water yield across the Ruzizi watershed was meticulously conducted for the baseline period (1987–2020) and projected into future periods (2040–2069 and 2070–2100) under both SSP2-4.5 (Figure 7 and Figure 8) and SSP5-8.5 climate scenarios (Figures S1 and S2), utilizing the SWAT hydrological model. Under the SSP2-4.5 scenario, the investigation unveiled a distinct spatial variation in mean annual ET and water yield patterns between the baseline and future periods. The baseline distribution showed a high ET around the west and the northwestern part of the Ruzizi basin, ranging from 349 to 425 mm, whereas the projected future scenarios suggested minimal deviations to the north relative to baseline figures. Consequently, the distribution between the mid-term (2040–2069) and far-term (2070–2100) future periods displayed remarkable consistency for WYLD. According to the results depicted in Figure 8 and Figure S2, the eastern sector of the watershed experienced a higher water yield (WYLD) during the baseline period, a trend that is anticipated to shift towards the northeastern quadrant under future scenarios.
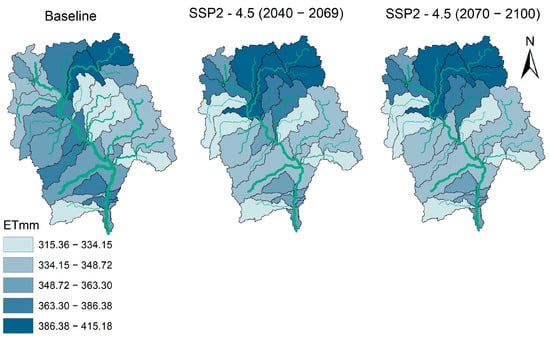
Figure 7.
SWAT Actual ET Analysis: Depicts baseline (1987–2020) and future actual ET for mid (2040–2069) and far-term (2070–2100) under SSP2-4.5, showing changing ET patterns, climate impacts on water availability, and ecosystem dynamics in the watershed.
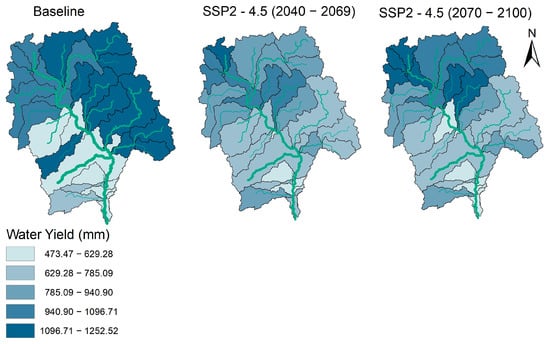
Figure 8.
SWAT Water Yield Analysis in Ruzizi Watershed: Tri-panel figure maps water yield for baseline (1987–2020) and projects changes for mid (2040–2069) and far-term (2070–2100) under SSP2-4.5, illustrating shifts in hydrological patterns and climate impact on water resources.
Furthermore, a significant reduction in water yield in future scenarios when compared with baseline data was observed, indicating a pronounced impact of climate change on hydrological dynamics within the watershed. A comparative analysis, encapsulated in a difference map (Figure 9), was executed to elucidate the disparities in water yield between SSP2-4.5 and SSP5-8.5 scenarios for both mid and far-term future periods throughout the Ruzizi watershed. This analysis highlighted a pronounced discrepancy in water yield on the northern flank of the basin, with the mid-term period exhibiting a more significant deviation than the far-term, suggesting temporal variations in hydrological responses to climate change scenarios. This comprehensive analysis underscores the critical need for adaptive water resource management strategies in the Ruzizi watershed in light of evolving hydrological patterns influenced by projected climate scenarios.
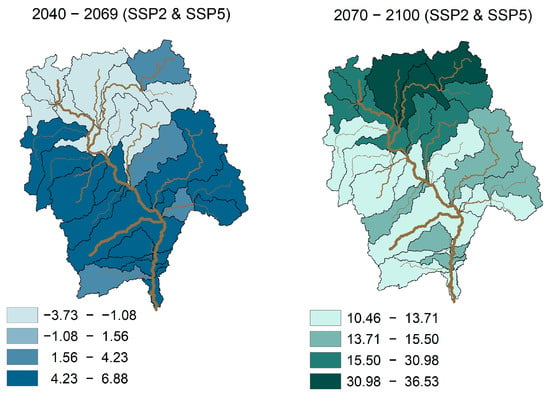
Figure 9.
Water Yield Difference Map: Showcases contrasts in Ruzizi watershed’s water yield for mid (2040–2069) and far-term (2070–2100) between SSP2-4.5 and SSP5-8.5, illustrating variance in hydrological impacts under different climate scenarios.
3.3.3. Impact of Climate Change on Streamflow
The comprehensive analysis of streamflow trends over various temporal scales encompassing historical simulation (1983–2020), mid-future (2040–2069), and far-future (2070–2100) periods under the SSP2-4.5 and SSP5-8.5 scenarios reveals critical insights into hydrological responses to climate change. The methodological approach, employing the Mann–Kendall trend test, enabled the identification of temporal changes in streamflow patterns, both monthly and annually. The results, encapsulated in Table 6, delineate streamflow dynamics under evolving climate conditions, offering a granular view of anticipated hydrological variability. During the historical period (1983–2020), the analysis indicated a non-significant decreasing trend in monthly streamflow, persisting across all months and on an annual scale. This trend underscores relative hydrological stability within the historical context, albeit with a slight decline, suggesting minimal alterations in water availability and potentially reflecting the resilience or inertia of the hydrological system to short-term climatic fluctuations.

Table 6.
Trends in Monthly and Annual Streamflow under Historical (1983–2020), Mid-Future (2040–2069), and Far-Future (2070–2100) Periods Analyzed Using the Mann–Kendall Test for SSP2-4.5 and SSP5-8.5 Scenarios, where “*” indicates significant increase or decrease trends.
In contrast, under the SSP2-4.5 scenario, a notable shift towards significant increasing trends in streamflow is observed for the mid-future (2040–2069) across all months. However, the far-future period (2070–2100) exhibits a nuanced pattern, with significant increasing trends in January and April, while other months show non-significant increases. Under the more severe SSP5-8.5 scenario, the mid-future period (2040–2069) reflects a non-significant upward trend in streamflow, indicating an uncertain but generally increasing hydrological response. This trend evolves into a significant ascending trend across all months in the far-future period, highlighting a stronger hydrological reaction to intensified climatic changes. The year-to-year trend analyses further supplement these findings, with non-significant trends in the near term gradually transitioning to significant trends in the far term, underscoring the progressive nature of hydrological changes in response to climate change.
Figure 10 and Figure 11 and Figure S3 illustrate the mean monthly discharge rates and their spatial distribution, observed historically (1983–2020) and projected for the mid-future (2040–2069) and far-future (2070–2100) periods under the SSP2-4.5 and SSP5-8.5 climate scenarios, respectively. The historical analysis indicates that discharge reaches a high in February and a nadir in August, a pattern consistent across all projected future scenarios (Figure 11a,b). This consistency implies stable seasonal discharge cycles within the RRB despite anticipated climate changes. However, the analysis also reveals a pronounced reduction in mean monthly discharge rates in future projections compared with the historical baseline (Figure 10 and Figure S3). For instance, historical discharge in the river’s lower reaches ranged from 176.5 to 233.7 m3/s, whereas future scenarios project a significant decrease, with discharges ranging from 133.4 to 151.5 m3/s under SSP2-4.5 and from 123.7 to 154.2 m3/s under SSP5-8.5.
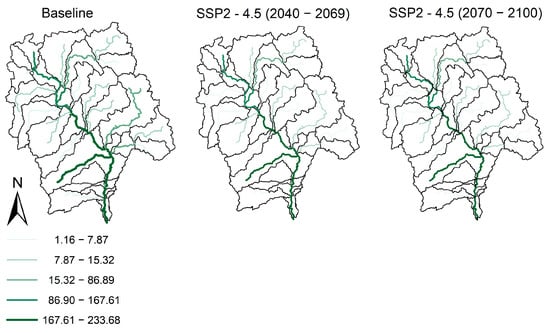
Figure 10.
Maps illustrating the flow distribution across the watershed reaches, comparing historical simulations (1983–2020) with projections for the mid-future (2040–2069) and far-future (2070–2100) periods under the SSP2-4.5 scenarios.
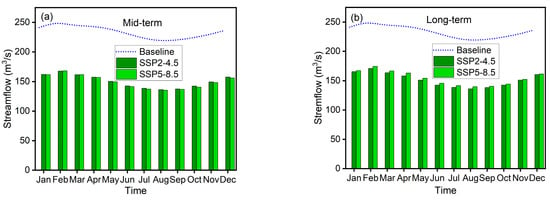
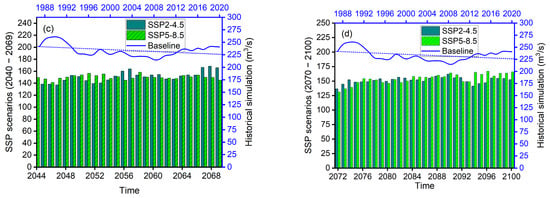
Figure 11.
Streamflow Comparison Bar Graphs: Four panels compare historical simulated flow (1983–2020) with mid (2040–2069) and far-future (2070–2100) projections at basin outlet under SSP2-4.5 and SSP5-8.5. The upper panels (a,b) show monthly flows, and the lower panels (c,d) show annual flows, illustrating seasonal and long-term water availability changes.
Furthermore, an analysis of mean annual flow rates (Figure 11c,d) for both future periods under each scenario revealed a decrease compared with the historical maximum mean annual discharge recorded in 2008 (213.96 m3/s). This anticipated reduction in streamflow could significantly impact the hydrological regime of the RRB, with potential implications for water resource management, ecosystem services, and climate resilience strategies. These findings underscore the necessity for adaptive management approaches to mitigate the adverse effects of climate change on river discharge patterns and to ensure sustainable water resource utilization within the basin.
3.3.4. Impact of Climate Change on Runoff
The analysis of surface runoff across the RRB, using the Man-Kendall trend analysis (Figure 12a), revealed predominantly non-significant monthly trends. Notably, marginal declines were observed in February, March, September, and November, while a slight upward trend was characterized in the other months. This nuanced monthly behavior is complemented by an overall annual trend, which, though marginally increasing, was statistically insignificant according to the Mann–Kendall test. The examination of monthly surface runoff dynamics (Figure 12b,c) within the historical dataset highlighted notable peaks in May and December, contrasting sharply with the minimal runoff, almost negligible observed in July, August, and September. This pattern suggests a variable annual response to surface runoff, with some years showing negligible reaction, indicating complex interactions within the watershed.
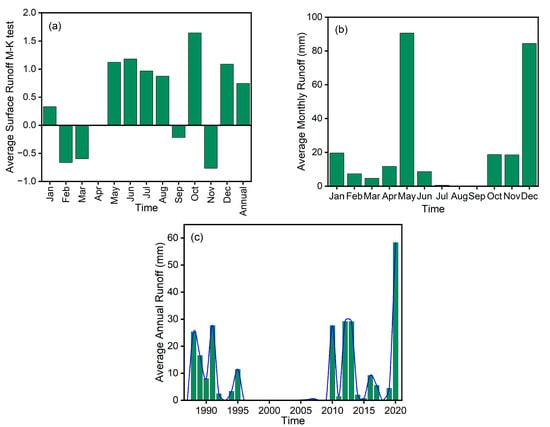
Figure 12.
(a) Mann–Kendall Trend for monthly surface runoff (1983–2020), (b) Monthly and (c) Annual surface runoff dynamics for the baseline period (1983–2020).
Future projections under SSP2-4.5 and SSP5-8.5 scenarios, as detailed in Table 5 and Figure 13, forecast a stark reduction in surface runoff, converging towards zero. This prediction underscores the potential impacts of climate change on hydrological processes within the RRB, hinting at significant alterations in water availability and ecosystem dynamics under changing climatic conditions.
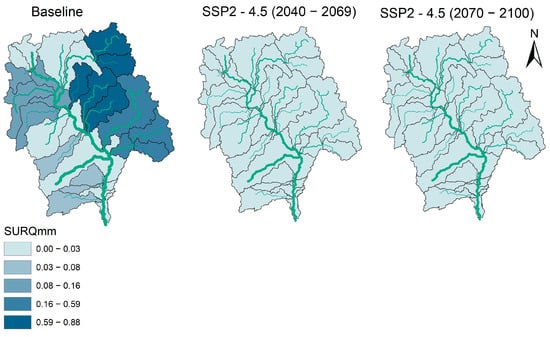
Figure 13.
Three-Panel Comparative Visualization: Assessing Runoff at the Basin Level Across Historical Data and Future Scenarios SSP2-4.5 and SSP5-8.5 within the RRB.
4. Discussion
The comprehensive analysis of climate data within the RRB, through a comparison of observational historical data and downscaled model outputs, offers valuable insights into the region’s complex climate dynamics. Using a multi-modal ensemble (MME), as recommended by studies such as [58,59,60], we achieved more accurate climate projections. Our findings showed substantial correlations between historical data and downscaled projections, particularly in rainfall and temperature variations, with minimal biases. The spatial distribution of rainfall and temperature, consistent with ref. [61,62] underscores the significant influence of elevation on precipitation and temperature gradients, indicating nuanced climate modulation across varied topographical contexts.
4.1. Model Performance and Impact Analysis
The SWAT model’s calibration and validation across the RRB hydrological dynamics confirm the model’s accuracy and reliability, with performance metrics such as R2, NSE, KGE, and PBIAS aligning closely with recommended standards by ref. [60,63]. These results provide a robust foundation for utilizing the SWAT model in analyzing future climate scenarios and assessing potential impacts on water balance components, which, according to ref. [64,65], are critical for effective water resource management under changing climatic conditions.
The projected climate change scenarios under SSP2-4.5 and SSP5-8.5 are set to profoundly impact the water balance components of the RRB (Table 5), underscoring a critical shift towards drier conditions that echo global concerns about water scarcity [66,67]. We anticipate a significant decrease in mean annual precipitation, which is projected to lead to marked reductions in surface runoff, evapotranspiration, and water yield (Table 5). These shifts are likely to exacerbate the challenges of water scarcity, aligning with the findings of ref. [68], which discuss the broader implications of such hydrological changes on global water resources. Further analysis suggests a pronounced reduction in mean monthly streamflow under future climate scenarios (Figure 11), signifying a significant alteration in the basin’s hydrological regime. Dissimilar to the findings of ref. [69], which projected a marginal increase in streamflow; our results align closely with those of ref. [70], who observed a significant decrease in flow during the dry season. Particularly, the projected decrease in runoff depicted in Table 5, along with Figure 12 and Figure 13, holds substantial implications for the basin’s agricultural, domestic, and ecological needs. These reductions could critically affect the ecological health of the river system, water quality, and the provision of ecosystem services, supporting findings by ref. [69,71], who emphasize the need for innovative water resource management and conservation strategies to address climate change-induced alterations in hydrological patterns. Interestingly, our study also observes a basin-wide decrease in soil erosion due to a significant reduction in runoff a potentially positive outcome. Lower soil erosion rates can enhance water quality, reduce sedimentation in water bodies, and improve soil health, thereby benefiting agricultural productivity and ecosystem resilience [72].
4.2. Proposed Management Strategy for Sustainable Development
In response to the flow regime changes identified in our study, we have developed a conceptual framework and corresponding adaptive measures to advance sustainable development in the RRRB. These measures aim to mitigate the detrimental impacts of changes in the basin’s water regime while ensuring the balanced use of resources (Figure 14).
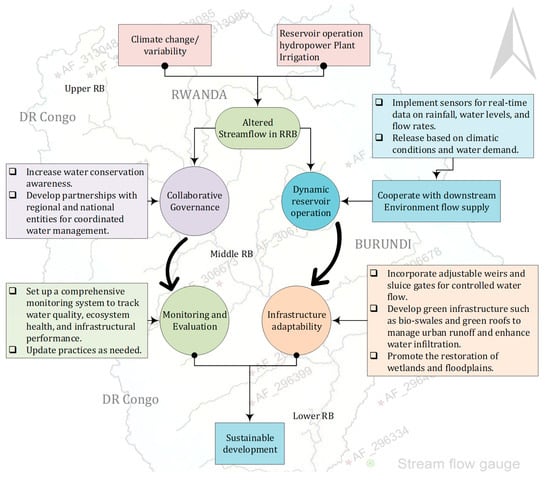
Figure 14.
Suggested Strategy and Measures for Sustainable Development in the Ruzizi Basin (RB).
4.2.1. Hydraulic Infrastructure and Water Management Objectives
To enhance the adaptive management of the RRB, it is crucial to implement a dynamic reservoir operation system that considers the basin’s hydrological and geopolitical complexity. The RRB, shared by Rwanda, Burundi, and the Democratic Republic of Congo (DRC), currently operates two medium hydropower schemes: Ruzizi I (with a catchment of 32 km2 and a reservoir volume of 1.46 million cubic meters) and Ruzizi II (90 km2 catchment, 1.75 million cubic meters). The third project, Ruzizi III, which is currently under development, will have a catchment of 224 km2 and a reservoir volume of 1.9 million cubic meters. A fourth project, Ruzizi IV, is also planned [73]. These projects are critical for energy production in the region, making water management a vital transboundary issue. Given the basin’s shared nature and the competing demands on its water resources, the dynamic reservoir operation system must balance hydropower generation with other critical needs, including agriculture, ecosystem protection, and sediment management. Sedimentation, particularly in Ruzizi II, poses a significant threat to reservoir capacity and long-term operational efficiency due to high turbidity and sediment loads from the steep slopes of the surrounding region [74]. Managing sediment transport is, therefore, essential to ensuring the longevity of these reservoirs [75,76,77].
While the existing hydropower schemes, Ruzizi I, II, and the upcoming Ruzizi III, are central to water management, the development of additional off-channel reservoirs or small-scale storage systems should be explored. These systems could help mitigate seasonal water variability and improve water availability for agricultural irrigation and municipal use while reducing pressure on the main reservoirs by buffering sediment loads and stabilizing water supply during dry periods. The primary water management objectives for the basin are hydropower generation, agricultural support, ecosystem preservation, and sediment management. Hydropower generation focuses on optimizing water releases from the Ruzizi dams to maximize energy production while maintaining long-term operational efficiency. At the same time, agricultural needs demand the expansion of irrigation systems to support local agriculture, which is vital for rural livelihoods. Ecosystem preservation is also key, with an emphasis on maintaining environmental flows to support aquatic ecosystems and protect biodiversity, particularly in the lower basin. Sediment management is crucial in addressing the erosion and sediment deposition challenges that threaten reservoir capacity, and implementing adaptive measures, such as erosion control practices and sediment flushing systems, will be essential in maintaining their efficiency [74,75,76,77].
4.2.2. Dynamic Reservoir Operation System
A dynamic reservoir operation system for the RRB should be supported by a real-time monitoring network that tracks rainfall, flow rates, water levels, and sediment transport across the basin. This data can be integrated into predictive hydrological models such as SWAT, allowing water managers to optimize dam operations in real-time. For example, during periods of high inflow, sedimentation levels can be monitored, and preemptive sediment flushing can be triggered in Ruzizi I and II to maintain their storage capacity without compromising energy production. Ruzizi III, with its larger reservoir capacity, can play a critical role in coordinating water releases across all three dams, ensuring excess water storage during wet seasons while providing much-needed flows during dry periods. By integrating real-time monitoring with dynamic reservoir operations, the system will be better equipped to manage seasonal fluctuations in water availability, optimize hydropower generation, and prevent sediment buildup.
Furthermore, sediment management is a key challenge in the RRB. High turbidity levels and significant sediment loads, especially in Ruzizi II, emphasize the need for adaptive sediment management measures. These could include the installation of sediment traps and flushing systems in both existing and future dams, as well as upstream erosion control practices, such as terracing and reforestation, to reduce the amount of sediment entering the rivers. These efforts will help maintain reservoir capacities and ensure the continued efficiency of hydropower operations [73,78].
4.2.3. Governance and Collaborative Management
In terms of infrastructure adaptability, transitioning towards low-impact, flexible systems is critical to meet future water needs. The public-private partnership (PPP) structure of Ruzizi III provides a model for adaptive governance, ensuring that local communities and stakeholders are involved in decision-making processes. This approach guarantees that the benefits of hydropower development are distributed equitably, while Livelihood Restoration Plans and local development funds provide long-term support for populations affected by dam operations [73,79,80]. Expanding irrigation systems and developing additional small-scale storage projects will further reduce pressure on the main reservoirs, ensuring efficient water use across sectors. These measures will enhance the adaptability of the basin’s infrastructure, allowing it to respond to changing water demands.
To wrap this up, the adaptive strategies proposed in this research are designed to ensure sustainable water resource management in the RRB, with a focus on balancing hydropower production, agricultural needs, sediment management, and ecosystem preservation. By integrating real-time data with predictive hydrological models and incorporating flexible infrastructure and collaborative governance frameworks, these strategies provide a robust approach to managing the basin’s water resources effectively. Further quantitative analysis of potential infrastructure developments, particularly regarding their capacity to manage sediment loads and optimize water storage, will be necessary to refine these strategies and ensure their long-term viability.
5. Conclusions
This study provides a comprehensive assessment of the impacts of climate change on the hydrological dynamics of the Ruzizi River Basin (RRB) using the SWAT model and CMIP6 climate projections under SSP2-4.5 and SSP5-8.5 scenarios. Our results indicate that mean annual precipitation could decline by up to 37.86% by mid-century under the SSP5-8.5 scenario. This reduction is projected to lead to significant decreases in surface runoff, evapotranspiration, and water yield, which will critically affect water availability for agriculture, domestic needs, and ecosystems in the basin.
These findings underscore the urgent need for adaptive water management strategies that can effectively respond to the anticipated challenges. Dynamic reservoir operations, coupled with real-time monitoring systems, will be essential to mitigate the adverse effects of fluctuating water availability. Additionally, the integration of green infrastructure offers opportunities to buffer the impacts of climate variability. The geopolitical complexity of the basin, shared by Rwanda, Burundi, and the Democratic Republic of Congo, further emphasizes the importance of transboundary cooperation in ensuring equitable and sustainable water resource management.
While the SWAT model has provided valuable insights into the hydrological processes of the RRB, future research should focus on incorporating more localized data and socio-economic factors such as population growth and land-use changes to improve model precision. Additionally, sediment management must be prioritized to address the impact of erosion and sediment deposition on reservoir capacity, which could be exacerbated by changes in runoff patterns. The interplay between sediment control measures and water resource management is crucial for maintaining the basin’s long-term hydrological balance.
The findings of this study provide a strong foundation for the development of proactive water management strategies in the RRB. By addressing the evolving challenges posed by climate change, policymakers and stakeholders can ensure the long-term security and sustainability of the region’s water resources through informed decision-making and collaborative efforts.
Supplementary Materials
The following supporting information can be downloaded at: https://www.mdpi.com/article/10.3390/w16192783/s1, Figure S1: ET under SSP5; Figure S2: Water yield under SSP5; Figure S3: Streamflow under SSP5.
Author Contributions
Conceptualization, B.S.A., B.Q.N. and V.R.P.; methodology, B.S.A., B.Q.N. and V.R.P.; software, B.S.A. and V.R.P.; validation, S.A.K., B.Q.N. and C.A.; data curation, B.S.A., B.Q.N., S.A.K. and C.A.; writing—original draft preparation, B.S.A.; writing—review and editing, S.A.K., B.Q.N. and C.A.; supervision, S.A.K.; project administration, B.S.A. and V.R.P.; funding acquisition, S.A.K., B.Q.N., C.A. and B.S.A. All authors have read and agreed to the published version of the manuscript.
Funding
This research was funded by the African Union Member States through a scholarship grant, supported by the German Government, and administered by the Pan African University Institute for Water and Energy Sciences (PAUWES) under Grant Number PAUWES/2022/MWE13.
Data Availability Statement
CHIRPS data are openly available for download from the Open Access Hub, https://data.chc.ucsb.edu/products/CHIRPS-2.0/ (accessed on 5 February 2024). GCM models are available on the CMIP6 open-access website: https://pcmdi.llnl.gov/CMIP6 (accessed on 1 February 2024). The DEM is available from the open-access website of HydroSHEDS (https://www.hydrosheds.org/, accessed on 5 February 2024). Soil data was sourced from the FAO’s official website (https://www.fao.org/soils-portal/en/, accessed on 14 January 2024). The multispectral image from Lansat8 was retrieved from https://earthexplorer.usgs.gov/ (accessed on 14 January 2024), and the streamflow data used in this study are available on request from the corresponding author due to ethical reasons.
Acknowledgments
This work was supported by the Japan-ASEAN Science, Technology and Innovation Platform (JASTIP), Research Unit for Realization of Sustainable Society (RURSS) at Kyoto University, JSPS Core-to-Core Program (Grant Number: JPJSCCB20220004). Binh Quang Nguyen is supported by the JSPS Postdoctoral Fellowships Program (Fellowship ID: P24064).
Conflicts of Interest
The authors declare no conflicts of interest.
References
- Shi, W.; Qiao, F.; Zhou, L. Identification of ecological risk zoning on qinghai-tibet plateau from the perspective of ecosystem service supply and demand. Sustainability 2021, 13, 5366. [Google Scholar] [CrossRef]
- Bodian, A.; Dezetter, A.; Diop, L.; Deme, A.; Djaman, K.; Diop, A. Future climate change impacts on streamflows of Two Main West Africa River Basins: Senegal and Gambia. Hydrology 2018, 5, 21. [Google Scholar] [CrossRef]
- Gori Maia, A.; Cesano, D.; Cesar Brito Miyamoto, B.; Santos Eusebio, G.; Andrade de Oliveira Silva, P. Climate change and farm-level adaptation: The Brazilian Sertão. Int. J. Clim. Chang. Strateg. Manag. 2018, 10, 1756–8692. [Google Scholar] [CrossRef]
- Masson-Delmotte, V.; Zhai, P.; Pirani, A.; Connors, S.L.; Péan, C.; Berger, S.; Caud, N.; Chen, Y.; Goldfarb, L.; Gomis, M.I.; et al. Climate Change 2021: The Physical Science Basis; Contribution of Working Group I to the Sixth Assessment Report of the Intergovernmental Panel on Climate Change; Cambridge University Press: Cambridge, UK, 2021; Volume 2, p. 2391. [Google Scholar] [CrossRef]
- Roberts, D.C. Climate Change 2022: Impacts, Adaptation and Vulnerability; Working Group II Contribution to the Sixth Assessment Report of the Intergovernmental Panel on Climate Change. Intergovernmental Panel on Climate Change; Cambridge University Press: Cambridge, UK, 2022. [Google Scholar] [CrossRef]
- Cirimwami, J.-P.K.; Ramananarivo, S.; Mutabazi, A.N.; Bisimwa, E.B.; Ramananarivo, R.; Razafiarijaona, J. Changement climatique et production agricole dans la région du Sud-Kivu montagneux à l’Est de la RD Congo. Int. J. Innov. Appl. Stud. 2019, 26, 526–544. Available online: http://www.ijias.issr-journals.org/ (accessed on 14 January 2024).
- Pandey, B.K.; Poonia, V.; Khare, D.; Goyal, M.K. Understanding of Future Water Challenges in a River Basin Under Ensemble of CORDEX Simulated Projections. In Hydro-Meteorological Extremes and Disasters; Springer Nature: Singapore, 2022; pp. 225–242. [Google Scholar] [CrossRef]
- Mahato, A.; Upadhyay, S.; Sharma, D. Global water scarcity due to climate change and its conservation strategies with special reference to India: A review. Plant Arch. 2022, 22, 64–69. [Google Scholar] [CrossRef]
- Hosseini Baghanam, A.; Seifi, A.J.; Sheikhbabaei, A.; Hassanzadeh, Y.; Besharat, M.; Asadi, E. Policy-making toward integrated water resources management of Zarrine River Basin via system dynamics approach under climate change impact. Sustainability 2022, 14, 3376. [Google Scholar] [CrossRef]
- Zhang, Y.; Mao, G.; Chen, C.; Shen, L.; Xiao, B. Population exposure to compound droughts and heatwaves in the observations and era5 reanalysis data in the gan river basin, china. Land 2021, 10, 1021. [Google Scholar] [CrossRef]
- Sempewo, J.I.; Kyeyune, J.; Nyenje, P.M.; Nkwasa, A.; Mugume, S.N.; Tsegaye, S.; Eckart, J. Distinct and combined impacts of future climate and land use change on the flow of river Rwizi in Uganda, East Africa. J. Water Clim. Chang. 2024, 15, 1667–1692. [Google Scholar] [CrossRef]
- Banerjee, A.; Chen, R.E.; Meadows, M.; Singh, R.B.; Mal, S.; Sengupta, D. An analysis of long-term rainfall trends and variability in the uttarakhand himalaya using google earth engine. Remote Sens. 2020, 12, 709. [Google Scholar] [CrossRef]
- Kumar, M.D.; Bassi, N. The climate challenge in managing water: Evidence based on projections in the Mahanadi River basin, India. Front. Water 2021, 3, 662560. [Google Scholar] [CrossRef]
- Gebrechorkos, S.H.; Hülsmann, S.; Bernhofer, C. Long-term trends in rainfall and temperature using high-resolution climate datasets in East Africa. Sci. Rep. 2019, 9, 11376. [Google Scholar] [CrossRef] [PubMed]
- Getachew, B.; Manjunatha, B.R. Potential climate change impact assessment on the hydrology of the Lake Tana Basin, Upper Blue Nile River Basin, Ethiopia. Phys. Chem. Earth Parts A B C 2022, 127, 103162. [Google Scholar] [CrossRef]
- Isinkaralar, O. Bioclimatic comfort in urban planning and modeling spatial change during 2020–2100 according to climate change scenarios in Kocaeli, Türkiye. Int. J. Environ. Sci. Technol. 2023, 20, 7775–7786. [Google Scholar] [CrossRef]
- Ahmadalipour, A.; Rana, A.; Moradkhani, H.; Sharma, A. Multicriteria evaluation of CMIP5 GCMs for climate change impact analysis. Theor. Appl. Clim. 2017, 128, 71–87. [Google Scholar] [CrossRef]
- Alaminie, A.A.; Tilahun, S.A.; Legesse, S.A.; Zimale, F.A.; Tarkegn, G.B.; Jury, M.R. Evaluation of Past and Future Climate Trends under CMIP6 Scenarios for the UBNB (Abay), Ethiopia. Water 2021, 13, 2110. [Google Scholar] [CrossRef]
- Hofer, S.; Lang, C.; Amory, C.; Kittel, C.; Delhasse, A.; Tedstone, A.; Fettweis, X. Greater Greenland Ice Sheet contribution to global sea level rise in CMIP6. Nat. Commun. 2020, 11, 6289. [Google Scholar] [CrossRef] [PubMed]
- Kamruzzaman, M.; Shahid, S.; Islam, T.; Hwang, S.; Cho, J.; Zaman, A.U.; Ahmed, M.; Rahman, M.; Hossain, B. Comparison of CMIP6 and CMIP5 model performance in simulating historical precipitation and temperature in Bangladesh: A preliminary study. Theor. Appl. Climatol. 2021, 145, 1385–1406. [Google Scholar] [CrossRef]
- Wyser, K.; Kjellström, E.; Koenigk, T.; Martins, H.; Döscher, R. Warmer climate projections in EC-Earth3-Veg: The role of changes in the greenhouse gas concentrations from CMIP5 to CMIP6. Environ. Res. Lett. 2020, 15, 054020. [Google Scholar] [CrossRef]
- Song, Y.H.; Chung, E.S.; Shahid, S. Spatiotemporal differences and uncertainties in projections of precipitation and temperature in South Korea from CMIP6 and CMIP5 general circulation models. Int. J. Climatol. 2021, 41, 5899–5919. [Google Scholar] [CrossRef]
- Pu, Y.; Liu, H.; Yan, R.; Yang, H.; Xia, K.; Li, Y.; Dong, L.; Li, L.; Wang, H.; Nie, Y.; et al. CAS FGOALS-g3 model datasets for the CMIP6 scenario model intercomparison project (ScenarioMIP). Adv. Atmos. Sci. 2020, 37, 1081–1092. [Google Scholar] [CrossRef]
- Estoque, R.C.; Ooba, M.; Togawa, T.; Hijioka, Y. Projected land-use changes in the Shared Socioeconomic Pathways: Insights and implications. Ambio 2020, 49, 1972–1981. [Google Scholar] [CrossRef] [PubMed]
- Yokoi, R.; Watari, T.; Motoshita, M. Future greenhouse gas emissions from metal production: Gaps and opportunities towards climate goals. Energy Environ. Sci. 2022, 15, 146–157. [Google Scholar] [CrossRef]
- Paredes-Trejo, F.J.; Barbosa, H.A.; Kumar, T.L. Validating CHIRPS-based satellite precipitation estimates in Northeast Brazil. J. Arid Environ. 2017, 139, 26–40. [Google Scholar] [CrossRef]
- Nkunzimana, A.; Bi, S.; Alriah, M.A.A.; Zhi, T.; Kur, N.A.D. Comparative analysis of the performance of satellite-based rainfall products over various topographical unities in Central East Africa: Case of Burundi. Earth Space Sci. 2020, 7, e2019EA000834. [Google Scholar] [CrossRef]
- Dinku, T.; Funk, C.; Peterson, P.; Maidment, R.; Tadesse, T.; Gadain, H.; Ceccato, P. Validation of the CHIRPS satellite rainfall estimates over eastern Africa. Q. J. R. Meteorol. Soc. 2018, 144, 292–312. [Google Scholar] [CrossRef]
- Macharia, J.M.; Ngetich, F.K.; Shisanya, C.A. Comparison of satellite remote sensing derived precipitation estimates and observed. Agric. For. Meteorol. 2019, 284, 107875. [Google Scholar] [CrossRef]
- Mulungu, D.M.; Mukama, E. Evaluation and modelling of accuracy of satellite-based CHIRPS rainfall data in Ruvu subbasin, Tanzania. Model. Earth Syst. Environ. 2023, 9, 1287–1300. [Google Scholar] [CrossRef]
- Ngoma, H.; Wen, W.; Ojara, M.; Ayugi, B. Assessing current and future spatiotemporal precipitation variability and trends over Uganda, East Africa, based on CHIRPS and regional climate model datasets. Meteorol. Atmos. Phys. 2021, 133, 823–843. [Google Scholar] [CrossRef]
- Muvundja, F.A.; Riziki, W.J.; Marie-Claire, D.; Lufungula, A.G.; Busanga, K.A.; Christian, A.; Joachim, E.; Alfred, W. The land–water–energy nexus of Ruzizi River Dams (Lake Kivu outflow, African Great Lakes Region): Status, challenges, and perspectives. Front. Environ. Sci. 2022, 10, 892591. [Google Scholar] [CrossRef]
- Shiru, M.S.; Kim, J.H.; Chung, E.S. Variations in projections of precipitations of CMIP6 global climate models under SSP 2–45 and SSP 5–85. KSCE J. Civ. Eng. 2022, 26, 5404–5416. [Google Scholar] [CrossRef]
- Agyekum, J.; Annor, T.; Quansah, E.; Lamptey, B.; Amekudzi, L.K.; Nyarko, B.K. Extreme temperature indices over the Volta Basin: CMIP6 model evaluation. Clim. Dyn. 2023, 61, 203–228. [Google Scholar] [CrossRef]
- Kamruzzaman, M.; Shahid, S.; Roy, D.K.; Islam, A.R.M.T.; Hwang, S.; Cho, J.; Zaman, A.U.; Sultana, T.; Rashid, T.; Akter, F. Assessment of CMIP6 global climate models in reconstructing rainfall climatology of Bangladesh. Int. J. Climatol. 2022, 42, 3928–3953. [Google Scholar] [CrossRef]
- Hordofa, A.T.; Leta, O.T.; Alamirew, T.; Chukalla, A.D. Spatiotemporal trend analysis of temperature and rainfall over Ziway Lake Basin, Ethiopia. Hydrology 2022, 9, 2. [Google Scholar] [CrossRef]
- Teutschbein, C.; Seibert, J. Bias correction of regional climate model simulations for hydrological climate-change impact studies: Review and evaluation of different methods. J. Hydrol. 2012, 456–457, 12–29. [Google Scholar] [CrossRef]
- Novella, N.S.; Thiaw, W.M. African rainfall climatology version 2 for famine early warning systems. J. Appl. Meteorol. Climatol 2013, 52, 588–606. [Google Scholar] [CrossRef]
- Jodar-Abellan, A.; Pardo, M.Á.; Asadollah, S.B.H.S.; Bailey, R.T. Assessing current and future available resources to supply urban water demands using a high-resolution SWAT model coupled with recurrent neural networks and validated through the SIMPA model in karstic Mediterranean environments. Environ. Sci. Pollut. Res. 2024, 31, 49116–49140. [Google Scholar] [CrossRef]
- Waheed, A.; Jamal, M.H.; Javed, M.F.; Muhammad, K.I. A CMIP6 multi-model-based analysis of potential climate change effects on watershed runoff using SWAT model: A case study of kunhar river basin, Pakistan. Heliyon 2024, 10, e28951. [Google Scholar] [CrossRef]
- Akoko, G.; Le, T.H.; Gomi, T.; Kato, T. A review of SWAT model application in Africa. Water 2021, 13, 1313. [Google Scholar] [CrossRef]
- Tan, M.L.; Gassman, P.W.; Yang, X.; Haywood, J. A review of SWAT applications, performance and future needs for simulation of hydro-climatic extremes. Adv. Water Resour. 2020, 143, 103662. [Google Scholar] [CrossRef]
- Nasiri, S.; Ansari, H.; Ziaei, A.N. Simulation of water balance equation components using SWAT model in Samalqan Watershed (Iran). Arab. J. Geosci. 2020, 13, 421. [Google Scholar] [CrossRef]
- Taia, S.; Erraioui, L.; Arjdal, Y.; Chao, J.; El Mansouri, B.; Scozzari, A. The application of SWAT model and remotely sensed products to characterize the dynamic of streamflow and snow in a mountainous watershed in the High Atlas. Sensors 2023, 23, 1246. [Google Scholar] [CrossRef] [PubMed]
- Abbaspour, K.C.; Rouholahnejad, E.; Vaghefi, S.; Srinivasan, R.; Yang, H.; Kløve, B. A continental-scale hydrology and water quality model for Europe: Calibration and uncertainty of a high-resolution large-scale SWAT model. J. Hydrol. 2015, 524, 733–752. [Google Scholar] [CrossRef]
- Budhathoki, A.; Babel, M.S.; Shrestha, S.; Meon, G.; Kamalamma, A.G. Climate change impact on water balance and hydrological extremes in different physiographic regions of the West Seti River basin, Nepal. Ecohydrol. Hydrobiol. 2021, 21, 79–95. [Google Scholar] [CrossRef]
- Brighenti, T.M.; Bonumá, N.B.; Grison, F.; de Almeida Mota, A.; Kobiyama, M.; Chaffe, P.L.B. Two calibration methods for modeling streamflow and suspended sediment with the swat model. Ecol. Eng. 2019, 127, 103–113. [Google Scholar] [CrossRef]
- Abesh, B.F.; Jin, L.; Hubbart, J.A. Predicting climate change impacts on water balance components of a mountainous watershed in the northeastern USA. Water 2022, 14, 3349. [Google Scholar] [CrossRef]
- Eyring, V.; Bony, S.; Meehl, G.A.; Senior, C.A.; Stevens, B.; Stouffer, R.J.; Taylor, K.E. Overview of the coupled model intercomparison project phase 6 (CMIP6) experimental design and organization. Geosci. Model Dev. 2016, 9, 1937–1958. [Google Scholar] [CrossRef]
- Jamali, M.; Eslamian, S. Parametric and Nonparametric Methods for Analyzing the Trend of Extreme Events. In Handbook of Hydroinformatics; Elsevier: Amsterdam, The Netherlands, 2023. [Google Scholar] [CrossRef]
- Almazroui, M.; Şen, Z. Trend analyses methodologies in hydro-meteorological records. Earth Syst. Environ. 2020, 4, 713–738. [Google Scholar] [CrossRef]
- Wang, W.; Li, W. Research on trend analysis method of multi-series economic data based on correlation enhancement of deep learning. Neural Comput. Appl. 2021, 33, 4815–4831. [Google Scholar] [CrossRef]
- Daba, M.H.; Ayele, G.T.; You, S. Long-Term Homogeneity and Trends of Hydroclimatic Variables in Upper Awash River Basin, Ethiopia. Adv. Meteorol. 2020, 2020, 8861959. [Google Scholar] [CrossRef]
- Zhang, X.; Xu, Y.; Hao, F.; Li, C.; Wang, X. Hydrological components variability under the impact of climate change in a semi-arid river basin. Water 2019, 11, 1122. [Google Scholar] [CrossRef]
- Posite, V.R.; Saber, M.; Ahana, B.S.; Abdelbaki, C.; Bessah, E.; Appiagyei, B.D.; Maouly, D.K.; Danquah, J.A. Modeling Spatio-Temporal Rainfall Distribution in Beni–Irumu, Democratic Republic of Congo: Insights from CHIRPS and CMIP6 under the SSP5-8.5 Scenario. Remote Sens. 2024, 16, 2819. [Google Scholar] [CrossRef]
- Alashan, S. Non-monotonic trend analysis using Mann–Kendall with self-quantiles. Theor. Appl. Climatol. 2023, 155, 901–910. [Google Scholar] [CrossRef]
- Shi, F.; Wang, Z.; Qi, L.; Chen, R. An Assessment of GCM Performance at a Regional Scale Using a Score-Based Method. Adv. Meteorol. 2018, 2018, 7641019. [Google Scholar] [CrossRef]
- Woyessa, Y. Assessment of Climate Change Impact and Comparison of Downscaling Approaches: A Case Study in a Semi-arid River Basin (No. IAHS2022-253). Proc. Int. Assoc. Hydrol. Sci. 2024, 385, 97–102. [Google Scholar] [CrossRef]
- Samuel, S.; Dosio, A.; Mphale, K.; Faka, D.N.; Wiston, M. Comparison of multimodel ensembles of global and regional climate models projections for extreme precipitation over four major river basins in southern Africa—assessment of the historical simulations. Clim. Chang. 2023, 176, 57. [Google Scholar] [CrossRef]
- Do, S.K.; Nguyen, B.Q.; Tran, V.N.; Grodzka-Łukaszewska, M.; Sinicyn, G.; Lakshmi, V. Investigating the Future Flood and Drought Shifts in the Transboundary Srepok River basin Using CMIP6 Projections. IEEE J. Sel. Top. Appl. Earth Obs. Remote Sens. 2024, 17, 7516–7529. [Google Scholar] [CrossRef]
- Lehner, F.; Klisho, T.; Formayer, H. Downscaling of climate indicators to 10 × 10 m resolution 2023, (No. EMS2023-132). In Proceedings of the EMS Annual Meeting 2023, Bratislava, Slovakia, 4–8 September 2023; pp. EMS2023–EMS2132. [Google Scholar] [CrossRef]
- Secor, M.; Sun, J.; Yang, F.; Zou, X.; Wu, Z. Global Warming and Topography Impact the Amplitude of the Synoptic-Scale Surface Temperature Variability across the US. Atmosphere 2023, 14, 979. [Google Scholar] [CrossRef]
- Moriasi, D.N.; Arnold, J.G.; Van Liew, M.W.; Bingner, R.L.; Harmel, R.D.; Veith, T.L. Model evaluation guidelines for systematic quantification of accuracy in watershed simulations. Trans. ASABE 2007, 50, 885–900. [Google Scholar] [CrossRef]
- Shigute, M.; Alamirew, T.; Abebe, A.; Ndehedehe, C.E.; Kassahun, H.T. Understanding Hydrological Processes under Land Use Land Cover Change in the Upper Genale River Basin, Ethiopia. Water 2022, 14, 3881. [Google Scholar] [CrossRef]
- Negewo, T.F.; Sarma, A.K. Estimation of water yield under baseline and future climate change scenarios in Genale Watershed, Genale Dawa River Basin, Ethiopia, using SWAT model. J. Hydrol. Eng. 2021, 26, 05020051. [Google Scholar] [CrossRef]
- Heyi, E.A.; Dinka, M.O.; Mamo, G. Assessing the impact of climate change on water resources of upper Awash River sub-basin, Ethiopia. J. Water Land Dev. 2022, 50, 232–244. [Google Scholar] [CrossRef]
- Rahvareh, M.; Motamedvaziri, B.; Moghaddamnia, A.; Moridi, A. Modeling runoff management strategies under climate change scenarios using hydrological simulation in the Zarrineh River Basin, Iran. J. Water Clim. Chang. 2023, 14, 2205–2226. [Google Scholar] [CrossRef]
- Chen, T.; Ye, Y.; Yang, K.; Zhang, X.; Ao, T. Study on the impact of future climate change on extreme meteorological and hydrological elements in the upper reaches of the Minjiang river. Adv. Meteorol. 2023, 2023, 9458678. [Google Scholar] [CrossRef]
- Tran, T.-N.-D.; Nguyen, B.Q.; Grodzka-Łukaszewska, M.; Sinicyn, G.; Lakshmi, V. The role of reservoirs under the impacts of climate change on the Srepok River Basin, Central Highlands Vietnam. Front. Environ. Sci. 2023, 11, 1304845. [Google Scholar] [CrossRef]
- Nguyen, B.Q.; Van Binh, D.; Tran TN, D.; Kantoush, S.A.; Sumi, T. Response of streamflow and sediment variability to cascade dam development and climate change in the Sai Gon Dong Nai River basin. Clim. Dyn. 2024, 62, 778–780. [Google Scholar] [CrossRef]
- Milly, P.C.; Dunne, K.A.; Vecchia, A.V. Global pattern of trends in streamflow and water availability in a changing climate. Nature 2005, 438, 347–350. [Google Scholar] [CrossRef]
- Luetzenburg, G.; Bittner, M.J.; Calsamiglia, A.; Renschler, C.S.; Estrany, J.; Poeppl, R. Climate and land use change effects on soil erosion in two small agricultural catchment systems Fugnitz–Austria, Can Revull–Spain. Sci. Total Environ. 2020, 704, 135389. [Google Scholar] [CrossRef]
- Dombrowsky, I.; Bastian, J.; Däschle, D.; Heisig, S.; Peters, J.; Vosseler, C. International and local benefit sharing in hydropower projects on shared rivers: The Ruzizi III and Rusumo Falls cases. Water Policy 2014, 16, 1087–1103. [Google Scholar] [CrossRef]
- Eisenberg, J.; Muvundja, F.A. Quantification of erosion in selected catchment areas of the Ruzizi River (DRC) using the (R) USLE model. Land 2020, 9, 125. [Google Scholar] [CrossRef]
- Nguyen, B.Q.; Kantoush, S.; Binh DVan Saber, M.; Vo, D.N.; Sumi, T. Quantifying the impacts of hydraulic infrastructure on tropical streamflows. Hydrol. Process. 2023, 37, e14834. [Google Scholar] [CrossRef]
- Nguyen, B.Q.; Kantoush, S.; Binh DVan Saber, M.; Vo, D.N.; Sumi, T. Understanding the anthropogenic development impacts on long-term flow regimes in a tropical river basin, Central Vietnam. Hydrol. Sci. J. 2023, 68, 341–354. [Google Scholar] [CrossRef]
- Nguyen, B.Q.; Kantoush, S.A.; Sumi, T. Quantifying the consequences of unsustainable sand mining and cascade dams on aspects in a tropical river basin. Sci. Rep. 2024, 14, 1178. [Google Scholar] [CrossRef] [PubMed]
- Bagula, E.M.; Majaliwa, J.-G.M.; Basamba, T.A.; Mondo, J.-G.M.; Vanlauwe, B.; Gabiri, G.; Tumuhairwe, J.-B.; Mushagalusa, G.N.; Musinguzi, P.; Akello, S.; et al. Water use efficiency of maize (Zea mays L.) crop under selected soil and water conservation practices along the slope gradient in Ruzizi watershed, eastern DR Congo. Land 2022, 11, 1833. [Google Scholar] [CrossRef]
- Lakshmi, V. Enhancing human resilience against climate change: Assessment of hydroclimatic extremes and sea level rise impacts on the Eastern Shore of Virginia, United States. Sci. Total Environ. 2024, 947, 174289. [Google Scholar] [CrossRef]
- Tapas, M.R.; Do, S.K.; Etheridge, R.; Lakshmi, V. Investigating the impacts of climate change on hydroclimatic extremes in the Tar-Pamlico River basin, North Carolina. J. Environ. Manag. 2024, 363, 121375. [Google Scholar] [CrossRef]
Disclaimer/Publisher’s Note: The statements, opinions and data contained in all publications are solely those of the individual author(s) and contributor(s) and not of MDPI and/or the editor(s). MDPI and/or the editor(s) disclaim responsibility for any injury to people or property resulting from any ideas, methods, instructions or products referred to in the content. |
© 2024 by the authors. Licensee MDPI, Basel, Switzerland. This article is an open access article distributed under the terms and conditions of the Creative Commons Attribution (CC BY) license (https://creativecommons.org/licenses/by/4.0/).