Article

Delineation of the Hydrogeological Functioning of a Karst Aquifer System Using a Combination of Environmental Isotopes and Artificial Tracers: The Case of the Sierra Seca Range (Andalucía, Spain)

by
Antonio Lope Morales-González
1,
Jorge Jódar
2,*,
Francisco Moral-Martos
3,
Rosario Jiménez-Espinosa
1,
Fernando Gázquez
4,5 and
Antonio González-Ramón
6
1
Department of Geology, University of Jaén, 23071 Jaén, Spain
2
Geological and Mining Institute of Spain (IGME-CSIC), 50059 Zaragoza, Spain
3
Departamento de Sistemas Físicos, Químicos y Naturales, Universidad Pablo de Olavide, 41013 Seville, Spain
4
Department of Biology and Geology, University of Almería, 04120 Almería, Spain
5
Andalusian Centre for the Global Change—Hermelindo Casto, ENGLOBA, University of Almería, 04120 Almería, Spain
6
Geological and Mining Institute of Spain (IGME-CSIC), 18006 Granada, Spain
*
Author to whom correspondence should be addressed.
Water 2024, 16(19), 2768; https://doi.org/10.3390/w16192768
Submission received: 7 August 2024 / Revised: 23 September 2024 / Accepted: 24 September 2024 / Published: 28 September 2024
(This article belongs to the Special Issue Stable Isotopes as Groundwater Discharge Tracers: Recent Developments)

Abstract

:
The Sierra Seca aquifer system is located in the northeast (NE) of the province of Granada, in the Prebetic Domain (Betic Cordillera). It is composed of different aquifer units hosted in the Lower Cretaceous and Upper Cretaceous limestones. The two aquifers are separated by a low permeability marl layer, which effectively acts as a barrier between them. To outline the behavior of the hydrogeological system, 407 samples of precipitation and 67 samples of groundwater were obtained from May 2020 to Oct. 2022 and isotopically ( δ 18 O and δ 2 H ) analyzed. For the estimation of the recharge elevation, a new methodology has been applied to estimate the isotopic content of recharge as a function of precipitation. This allowed the evaluation of the vertical gradient of both precipitation ( Z δ 18 O P = 2.9   / k m ) and aquifer recharge ( 4.4   / k m Z δ 18 O R 2.9   / k m ). Therefore, estimating (1) the recharge zone elevation associated with the aquifer system, which is comprised between 1500 and 1700 m a.s.l., and (2) the transit time of recharge to reach the outflow point of the aquifer system, which varies between 4 and 5 months, is possible. Additionally, three tracer tests were conducted to outline the hydrologic connection between the recharge and discharge zones of the aquifer system. The results show that the Fuente Alta spring drains the limestones of the Lower Cretaceous, while La Natividad spring does the same with the limestones of the Upper Cretaceous. In the case of the Enmedio spring, groundwater discharge is related to infiltration through the streambed of the watercourse fed by the Fuente Alta spring.

1. Introduction

Carbonate rocks outcrop on 15.2% of the Earth’s ice-free surface and are home to 16.5% of the planet’s population [1]. These rocks are exposed to weathering processes that give rise to a relief with an abundance of karst morphologies and generate important aquifers, on which 9.2% of the world’s population is totally dependent [2], although this proportion increases to 20–25% when the dependence is not complete from these aquifers [3]. Karst terrain is not only relevant in terms of water resources, but also contains a variety of other natural resources and provides vital ecosystem functions, especially in headwater catchments in semi-arid mountain areas, where environmental conditions are more demanding and surface water availability is critical.
The meteoric water that flows superficially through karst areas infiltrates, moving rapidly through the more conductive structures of the karst, which favors the direct connection between the surface and the saturated zone of the aquifer. This makes karst aquifers highly vulnerable to the impact of human activities on land use changes, especially in terms of pollution [4]. To protect such aquifers, it is necessary to delimit activities in the recharge zones and to define protection perimeters for the main springs [5]. The success in the design and implementation of these measures depends profoundly on the degree of characterization of the functioning of these aquifers.
Karst aquifers behave in a complex manner. They typically exhibit a hydrodynamic duality that is a function of the flow pattern within the hydrogeological system: On the one hand, there is a fast flow component through the main karst conduits of the system, which typically exhibit fast response times to recharge in the springs draining the aquifer (i.e., short transit times). On the other hand, a slower groundwater flow component flows through the fractured rock matrix, which typically has a lower hydraulic conductivity. This groundwater flow component has longer travel times than those associated with the fast flow component. Various methods have been used to analyze such complex behavior from the perspective of the hydrodynamic and hydrogeochemical/isotopic composition of groundwater [1,6].
In mountain areas, environmental tracers, and, in particular, stable isotopes of the water molecule, have become a fundamental tool to characterize the functioning of aquifers [7]. The isotopic content of meteoric water is intrinsically temperature-dependent [8], and, therefore, it shows a seasonal variation [9]. Furthermore, such a dependence is propagated by altitude given the relationship between altitude and atmospheric temperature, which drives the altitudinal variation of both the mean isotopic content of precipitation [10] and the amplitude of the seasonal variation of the isotopic content of precipitation [11]. The isotopic signal of the meteoric water is transmitted through the aquifer from the recharge zone to the discharge zone. The aquifer modifies the environmental tracer input signal more significantly with longer transit times [12]. The isotopic content time series analysis of the aquifer inflows (i.e., recharge) and outflows (i.e., discharge) allows the joint estimation of the aquifer mean recharge rate, the associated elevation of the recharge zone, and the corresponding groundwater renewal time [11,13,14].
Artificial tracers allow the profiling of the solute transport processes that control contaminant migration in the aquifer and the connectivity of the karst flow network [15]. Obtaining this information is essential given the limitations often imposed by the lack of detailed characterization of the geology and geomorphology associated with these aquifers. The information obtained from the analysis of tracer breakthrough curves allows the establishment of conceptual models for the behavior of such aquifers that are consistent with the aquifer structure and groundwater flow patterns [16,17]. This provides a solid basis to numerically simulate the behavior of such aquifers [14,18].
Given their applicability, chemical and environmental tracers have long been used, along with aquifer discharge, to characterize the functioning of karst systems in mountain areas. Andreo et al. (2004) [5] analyzed the origin of the groundwater recharge in the aquifer karst system of Yunquera-Nieves (South Spain) by applying stable isotopes of the water molecule ( δ 18 O and δ 2 H ). Lauber and Goldscheider (2014) [19] used both artificial and isotopic tracers, to assess the groundwater transit time distribution of the Wetterstein Mountains (Germany). Jódar et al. (2020) [17] used both dye tracers and stable isotopes to characterize the role of both diffuse and focused recharge with respect to total recharge in the aquifer system of Ordesa y Monte Perdido National Park, which is the highest karst system in Western Europe. Luo et al. (2023) [20] used the thermal responses of groundwater to reveal the recharge–discharge process and characterize the structure associated with the Huangliang karst system (South China). Zhang et al. (2024) [21] used temperature and isotopic tracers of groundwater discharge to estimate the transit time distribution of the aquifer system, which is the cornerstone for stimulating the hydrodynamic response of the aquifer system [12].
This work focuses on the hydrogeological characterization of the Sierra Seca aquifer karst system, using both artificial and environmental tracers: The former (i.e., uranine and eosin) are used to delineate the recharge zones of the two aquifers that integrate the hydrogeological system. The isotopic content of recharge ( δ R ) is used to define the aquifer recharge zones and to estimate the groundwater renewal time in the aquifer system [11,12]. Moreover, δ R is a key factor driving the isotopic content of groundwater. Despite this, it is not easy to characterize δ R , and the isotopic content of precipitation ( δ P ) is often used as a proxy of δ R [7]. This work considers some hypotheses regarding the precipitation events that generate recharge, and thus estimate δ R as a function of δ P . Additionally, two lumped models are combined in series to simulate the observed evolution of the isotopic content of the groundwater discharge: (1) an HBV model [22,23] that estimates the hydrological balance terms taking into account the elevation dependencies of different hydrometeorological variables (i.e., precipitation and temperature) and associated processes (e.g., snow accumulation and ablation), and (2) a FlowPC model [24] that estimates the mean transit time of the hydrological system while simulating the evolution of the environmental tracer content in the discharge of the system. This multidisciplinary approach, combining experimental and modeling techniques, has enabled a consistent conceptual model of the hydrogeological system to be established. The methodology used can be generally applied to other mountain karst aquifers, thus favoring a better assessment and management of the water resources of these aquifers.

2. Location, Geological, and Hydrogeological Context

The study area is at the southwestern foothills of the Sierra del Segura (Figure 1), which constitutes the upper part of both the Segura and Guadalquivir River basins. The study zone is bounded by two protected natural areas: the Biosphere Reserve of “Sierras de Cazorla, Segura y las Villas” Natural Park, which is the largest protected area in Spain and second in Europe, and the Natural Park of “Sierra de Castril”, which is a Site of Community Importance (SCI) since 2006.
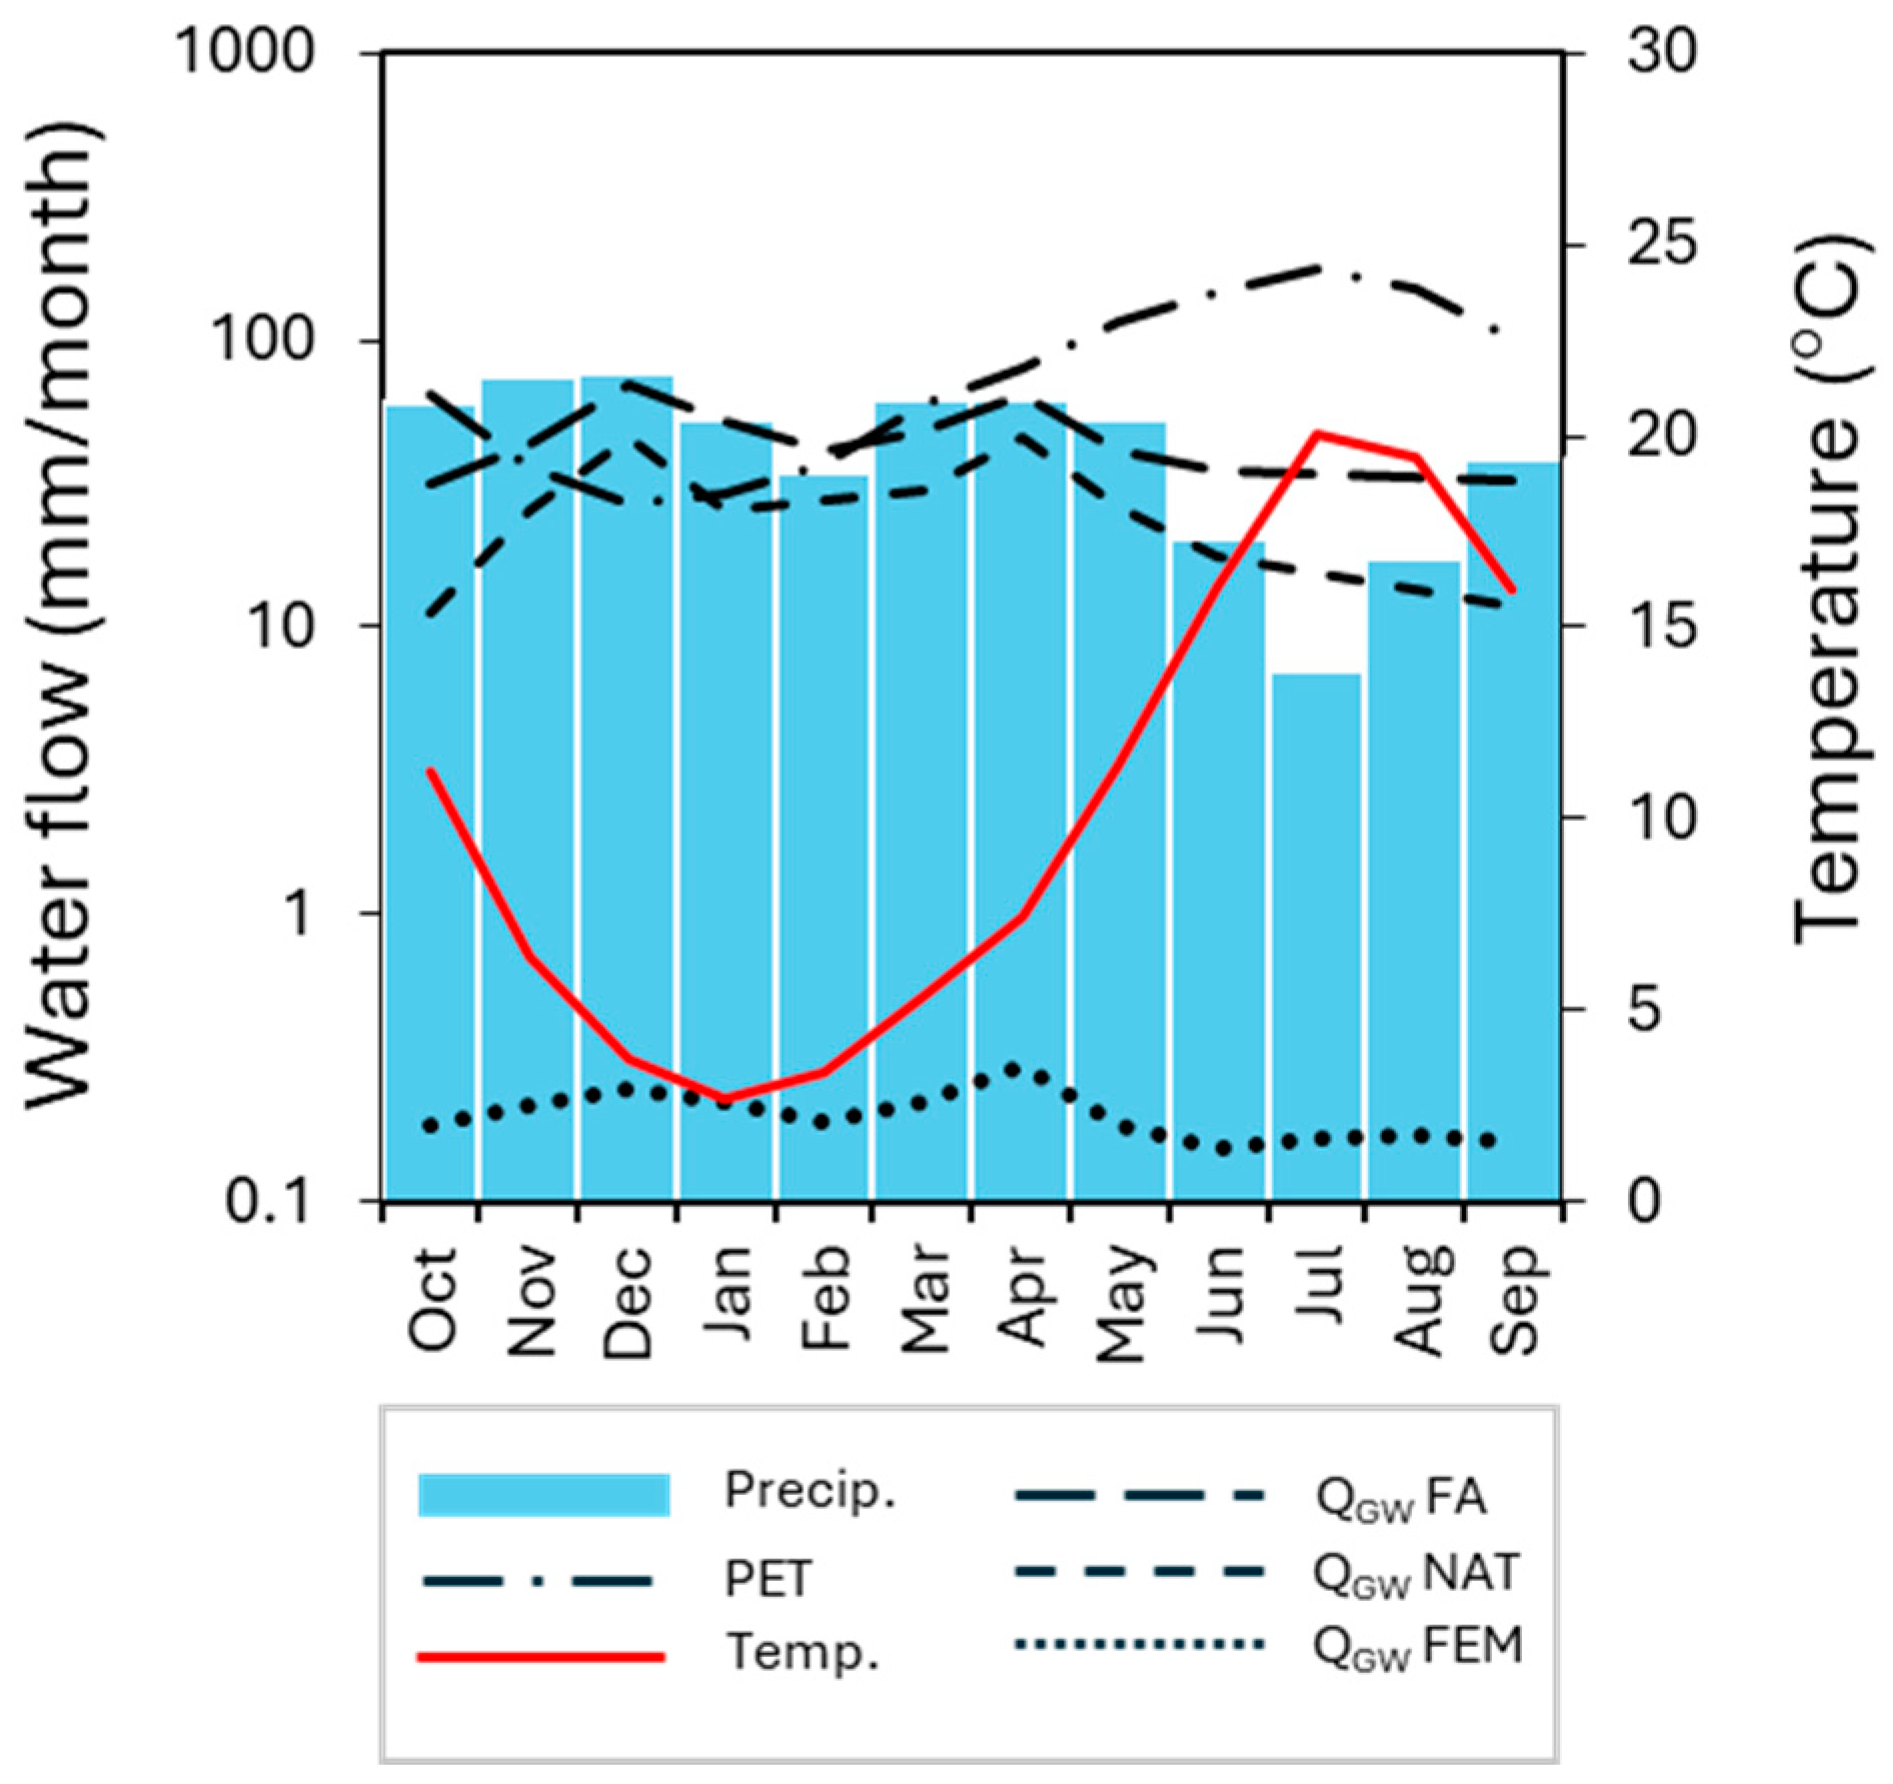
The climate in the study zone is temperate Mediterranean [26]. This means there are no very hot temperatures, a cold and rainy winter and autumn, and a mild spring and a hot summer. Precipitation is the highest in autumn and spring and the lowest in summer (Figure 2). From 1996 to 2022, the average temperature, precipitation, and potential evapotranspiration at the Don Domingo meteorological station (1538 m; Figure 1A) were 10.3 °C, 560 mm/year, and 1029 mm/year, respectively.
The Sierra Seca range, which is made up of rocks of Cretaceous to Miocene age (Figure 3), is located within the Internal Prebetic Domain of the Betic Cordillera, and extends northward to the most developed karstic plateau in the Iberian Peninsula, which is known as the Campos de Hernán Pelea [27]. The karst development is especially abundant and widespread in the recharge zone, where karren, poljés, and large dolines can be found.
The structure of Sierra Seca range consists of an asymmetric anticlinal fold with gentle dips of about 30° on the eastern flank (Figure 3), while the western flank is affected by faults and a thrust that superimposes Cretaceous limestones on Miocene marls [27,28]. In the core of the anticline, the older materials outcrop, consisting of dolomites and dolomitized calcarenites belonging to the Lower Cretaceous and are approximately 200 m thick. Above them, there is a stretch of marls and sands (Utrillas Facies) with a thickness that varies between 20 and 70 m [29]. This section is easy to identify as it generates aligned depressions between sections of greater resistance to erosion.
From a hydrogeological perspective, two different aquifers can be found in the Sierra Seca range:
  • The Lower Cretaceous aquifer developed in carbonate materials, predominantly limestones with rudists, and exhibits a thickness of 400 m. These carbonates are partially sealed at the roof in the slope break zone by a low permeability level of marls and marl limestones of variable thickness [29]. The primary hydrogeological drainage zone of this aquifer is the Fuente Alta (FA) spring, which is situated at the interface between the carbonate aquifer and the sealing low-permeability level.
  • The Upper Cretaceous aquifer is formed by limestones with an average thickness of 150 m. This aquifer is drained by two springs, Natividad (NAT) and Fuente de Enmedio (FEM). The former spring drains this aquifer while discharging through a contact between the Upper Cretaceous limestone and the Paleocene marls. FEM drains a small sector of the Upper Cretaceous aquifer, although some of the associated groundwater discharge is probably generated by surface water infiltration along the Fuente Alta riverbed, as suggested by González-Ramón et al. (2024) [25].
FA and NAT represent the main groundwater discharge points of the Sierra Seca aquifer system. Both springs have associated an important karst conduit network (Figure S1; Supplementary Materials), which is currently being explored [25,30].
The recharge zones associated with both the Upper and Lower Cretaceous aquifers coincide with the corresponding limestone outcrop area shown in Figure 3. In the highest zones of the Sierra Seca range, karst development is especially important. Here, large dolines can be found, some with open sinkholes, karren, or poljes, such as the Laguna polje, with several associated ponors (Figure S2; Supplementary Materials). Additionally, karstification affects the discharge zones of both aquifers, creating the endokarst structures with galleries of several hundred meters with springs at the end [2]. During precipitation events, a very rapid flow augmentation response occurs, with a large volume of water drained, depending on the intensity and form of precipitation (i.e., rain or snow). In the case of FA, up to four overflows can be observed, which are activated consecutively depending on the volume of water reaching the spring, while at NAT, the excess water is drained through an artificial gallery (Figure S3; Supplementary Materials).

3. Methodology and Materials

3.1. Rainfall and Groundwater Sampling

During the research period (December 2019–September 2022), eight rainfall monitoring stations were installed at different elevations in the study zone (Figure 1). The installation was implemented considering the difficulty of taking precipitation samples for each event, both in terms of access and due to typical winter snow events. Groundwater samples were also taken from the FA, NAT, and FEM. A total of 474 samples between springs and precipitation (Table S1; Supplementary Materials) were collected. All the water samples were subsequently filtered in the laboratory and stored in 5 mL polypropylene tubes without air inside and refrigerated until the isotopic analysis ( δ 18 O and δ 2 H ). In addition, paraffin oil was used in the rainfall collectors to avoid evaporation during the period between rainfall events and sampling.
The oxygen and hydrogen isotope composition ( δ 18 O and δ 2 H ) of rainwater were measured by cavity ring-down spectroscopy (CRDS) [31] using a Picarro L2140-i isotope analyzer at the Laboratory of Stable Isotopes of the University of Almería, Spain. The results were normalized to the V-SMOW scale by analyzing internal standards before and after a set of measurements of 15–20 samples [32]. All isotopic deviations are reported in parts per thousand (‰) relative to V-SMOW [31]. The in-sample reproducibility of oxygen and hydrogen isotope analyses were evaluated by measuring each sample 10 consecutive times. Memory effect from previous samples was minimized by rejecting the 3 first injections. The in-sample reproducibility was better than ±0.05 and ±0.4‰ for δ 18 O and δ 2 H , respectively. The long-term reproducibility was evaluated by measuring an internal water standard (BOTTY) for every 5–6 samples in all the analytical sequences that extended from January 2020 to March 2023. The long-term reproducibility of 128 analyses was ±0.1 and ±0.9‰ for δ 18 O and δ 2 H , respectively [32].

3.2. Estimation of Aquifer Recharge Elevation

To estimate the elevation of the recharge zone associated with a spring discharge, it is assumed that the average isotope content of the spring discharge corresponds to that of recharge (i.e., the meteoric water entering the aquifer) at the corresponding elevation [33], so defining the altitudinal dependence of the isotopic content of recharge allows estimating the elevation of the recharge zone associated with the sampled spring. Nevertheless, aquifer recharge is a complex phenomenon that is not easy to characterize, as is the corresponding isotopic composition [7]. To overcome this problem, the isotopic content of precipitation is often used as if it was that of recharge [11]. This is an interesting approach because there is a linear relationship between the isotopic content of precipitation and topographic elevation [34], which is known as the isotopic altitudinal line (IAL). Such a relationship is characterized, locally, as a regression line between the average isotopic content of precipitation at different sampling points and the elevation associated with such sampling points. Characterizing IAL allows estimating the recharge elevation associated with a given spring. This is performed by projecting the average isotopic content of the spring discharge in the estimated IAL [11].
However, in semi-arid and arid areas, it is not straightforward to apply such an approach because during the warm seasons, especially in summer, when most of the rainfall is evaporated and recharge approaches zero. Therefore, using the isotopic composition of precipitation as that of recharge may introduce a bias in the estimated isotopic composition of recharge and in any other variable estimated based on such isotopic composition of recharge. Additionally, groundwater recharge drives the hydrodynamic response of the aquifer observed in the discharge points. Karst aquifers tend to show a rapid response to precipitation events. The response of the hydrological system to an input hydrological signal depends on both the internal structure of the karst system and the strength of the input hydrological signal. In the case of the aquifer system of Sierra Seca, a minimum precipitation length of 20 mm is needed to trigger a groundwater discharge response in the monitored springs [35]. Such a rainfall threshold driving the aquifer recharge may modify, in turn, the mean isotopic composition of recharge with respect to precipitation.
The hydrogeological response, in terms of groundwater flow discharge and corresponding isotopic content, depends at least on the recharge input function. The isotopic content of precipitation is traditionally used as if it was that of recharge. This is business as usual because it is very complex to measure the isotopic content of recharge. In this paper, different hypotheses are made about which precipitation events produce recharge in order to estimate the mean isotopic content of recharge and thus profile the corresponding IAL.
The mean isotopic content of recharge ( δ R   [-]), at a given elevation, is estimated as a rainfall weighted average function of the isotopic content of precipitation at that elevation. Five cases are considered to estimate δ R :
A1.
All the precipitation samples are considered.
δ R = j = 1 N δ P j P j j = 1 N P j
where δ P j [-] and P j [L] are isotopic content and precipitation length of the j-th sampled precipitation event, respectively, and N [-] is the total number of precipitation events sampled. This case assumes that δ R = δ P .
A2.
The same approach as A1 without considering the summer rainfall samples.
A3.
The same approach as A2 without considering any water sample from rainfall events lower than 20 mm.
A4.
The same approach as A2 without considering any water sample from rainfall events lower than 30 mm.
A5.
The same approach as A2 without considering any water sample from rainfall events lower than 40 mm.

3.3. Estimation of Groundwater Transit Times

For the estimation of the transit time of the discharge water in the springs, the methodology presented by [14] is applied, in which the temporal variation of the isotopic content in the discharge at the spring is simulated with FlowPC [24,36]. FlowPC is a lumped parameter model that allows for estimating the transit time of groundwater. The program solves the convolution integral (Equation (2)) and transforms the isotopic signal of the aquifer recharge water (i.e., input function; δ i n ) into the isotopic signal of the aquifer water at the point of discharge (i.e., output function; δ o u t ):
δ o u t t = t δ i n t g t t d t
where t [T] is the time of tracer input as recharge, t′[T] is the integration variable, and g t is a weighting function describing the Transit Time Distribution (TTD) in the aquifer. FlowPC includes, among others, two parametric TTDs that are particularly suitable for simulating karst aquifer systems: (A) the exponential model (EM), which is applied in systems where subsurface flow lines converge, such as in springs [37,38,39] and (B) the exponential piston model (EPM), which combines, in series, two flow systems, one upstream in which recharge enters the aquifer by percolation from the surface, one in which an exponential distribution of transit times is assumed, and another downstream system in which the flow pattern is piston-like [38]. The weighting function for EPM is described by the following expression:
g t = 0                              t < τ 1 1 η t τ 1 τ η e η τ + η 1            t t τ                         
τ = 0 t g t d t = V d   Q R  
where η [-] is the ratio between the total volume of the hydrogeological system and the volume of the system in which the exponential TDD exists. From the definition of η , it is inferred that 1 η , where η = 1 is the value of the parameter associated with the EM flow scheme. τ [T] is the average transit time. In the case of aquifers with a natural (i.e., uninfluenced) piezometric gradient, τ corresponds to the average time taken for groundwater to travel from the recharge zone to the discharge source. In this situation, τ is related to the recharge flow of the aquifer Q R and the dynamic storage of the aquifer V d , as shown in the last right term of Equation (4) [7]. The parameters of the convolution integral (i.e., η and τ ) are calibrated manually by minimizing the Root Mean Squared Error (RMSE) function.
FlowPC requires two time series for its operation:
  • Monthly recharge flow to the aquifer. This time series is obtained as one of the terms of the water balance, calculated by numerical modeling of the hydrodynamic behavior of the aquifer. An HBV model has been implemented for both the Lower Cretaceous aquifer and the Upper Cretaceous aquifer drained by FA and NAT springs, respectively, HBV is a conceptual rainfall-runoff model for hydrodynamic modeling of hydrological basins, which solves a general water balance equation. This model has been used in different hydrological research studies in mountain areas [40,41,42,43,44,45].
  • Average isotopic content of the monthly recharge, which is obtained from the monthly precipitation samples accumulated in the rainfall monitoring stations installed in the study area. For the months in which precipitation samples could not be obtained in the study area, they were estimated using the machine learning model developed by [46], which generates, for any location in Europe, monthly time series of isotope content in precipitation for the period 1950–2019. Outside this period, the monthly values associated with a given month (e.g., January) are estimated as the average of all the time series values associated with that month.

3.4. Artificial Tracers

3.4.1. Instrumentation

To measure the flowrate discharge in FA, NAT, and FEM, a OTT T800 unit, a SEBA logger (SEBA Hydrometrie, Kaufbeuren, Germany) and an ODYSSEY (Stamford, CT, USA) capacitance logger were installed, respectively.
The discharge of each spring is obtained by a function of the measured water column and the point gauging data, from which the discharge curve of each gauging station was obtained empirically [18].
For each tracer test, a GGUN-FL24 fluorometer (Albillia, Auvernier, Switzerland) [47] was installed at each spring. This equipment was calibrated by making 17 standards with concentrations between 1 ppm and 1 ppb. All the equipment was programmed to measure the corresponding variables every 30 min. In addition, during the tracer tests, additional samples were taken every 12 h from the three springs to rule out or demonstrate the possibility that the tracer was detected in more than one spring. These samples were subsequently analyzed in the laboratory of the University of Jaén using the same GGUN-FL24 fluorometer used in the tracer tests.

3.4.2. Tracer Injection and Transport Modeling

Three tracer injection tests were carried out to verify hydrogeological connections between different lithologies and to be able to estimate and delimit possible recharge areas for each spring. The first test was conducted on 11 December 2020 in the Lower Cretaceous (LC) limestones outcropping to the S of the Sierra Seca summit. A total of 1.5 kg of eosin (Table 1) was injected into an active sinkhole at 1881 m a.s.l. (site α in Figure 3), which is in the lower part of a large doline. The tracer entered the hydrogeological system and dissolved in the water collected by such a doline during a precipitation event (75 mm) that occurred while the tracer was being injected (Figure 4A).
The second test was carried out on 6 February 2021, in the Upper Cretaceous (UC) carbonate rocks outcropping to the N and E of Sierra Seca. In these tests, 1.5 kg of uranine was injected into a sinkhole at 1850 m a.s.l. (site β in Figure 3). The injection procedure was different from the first case. This was a forced injection, using 8 m3 of water from a tanker (Figure 4B). The subsequent precipitation of about 70 mm provided additional injection water to push the tracer to the saturated zone.
The third tracer injection test was carried out on 16 February 2022 by injecting 200 g of uranine along a water-losing section of the Fuente Alta river (site ε in Figure 3), corresponding to a UC limestone outcrop in the riverbed (Figure 4C).
All the three tracer tests conducted in the Sierra Seca aquifer system consisted of a direct pulse tracer injection in a sinkhole. This type of instantaneous tracer injection, with initial concentration C 0 [ML−3], is mathematically represented by a Dirac delta function δ t [-] as expressed by the following equation:
C i n t = C 0 δ t      t
The aquifer output is given by the convolution integral (Equation (2)), where the output and input isotopic content functions are replaced, without loss of validity, by C o u t t [ML−3] and C i n t [ML−3], respectively. In this case, the considered system response function is given by the dispersion flow model [37] which is given by
g t = Γ · t 3 / 2 e 1 4 P D τ t + t τ t 0
Γ = τ 4 π P D e 1 2 P D
where P D [-] is the inverse of the Péclet number ( P e [-]), which is a dimensionless number defined as the ratio of the advective and the dispersion-diffusion characteristic times. When P e > 1 , the advective flux is the dominant transport mechanism, and vice versa.
By considering Equations (5) and (6) in the convolution integral, the aquifer output function is described by the following analytical expression [12]:
C o u t t = C 0 · Γ · t 3 / 2 e 1 4 P D τ t + t τ              t 0

4. Results and Discussion

4.1. Hydrodynamic Data

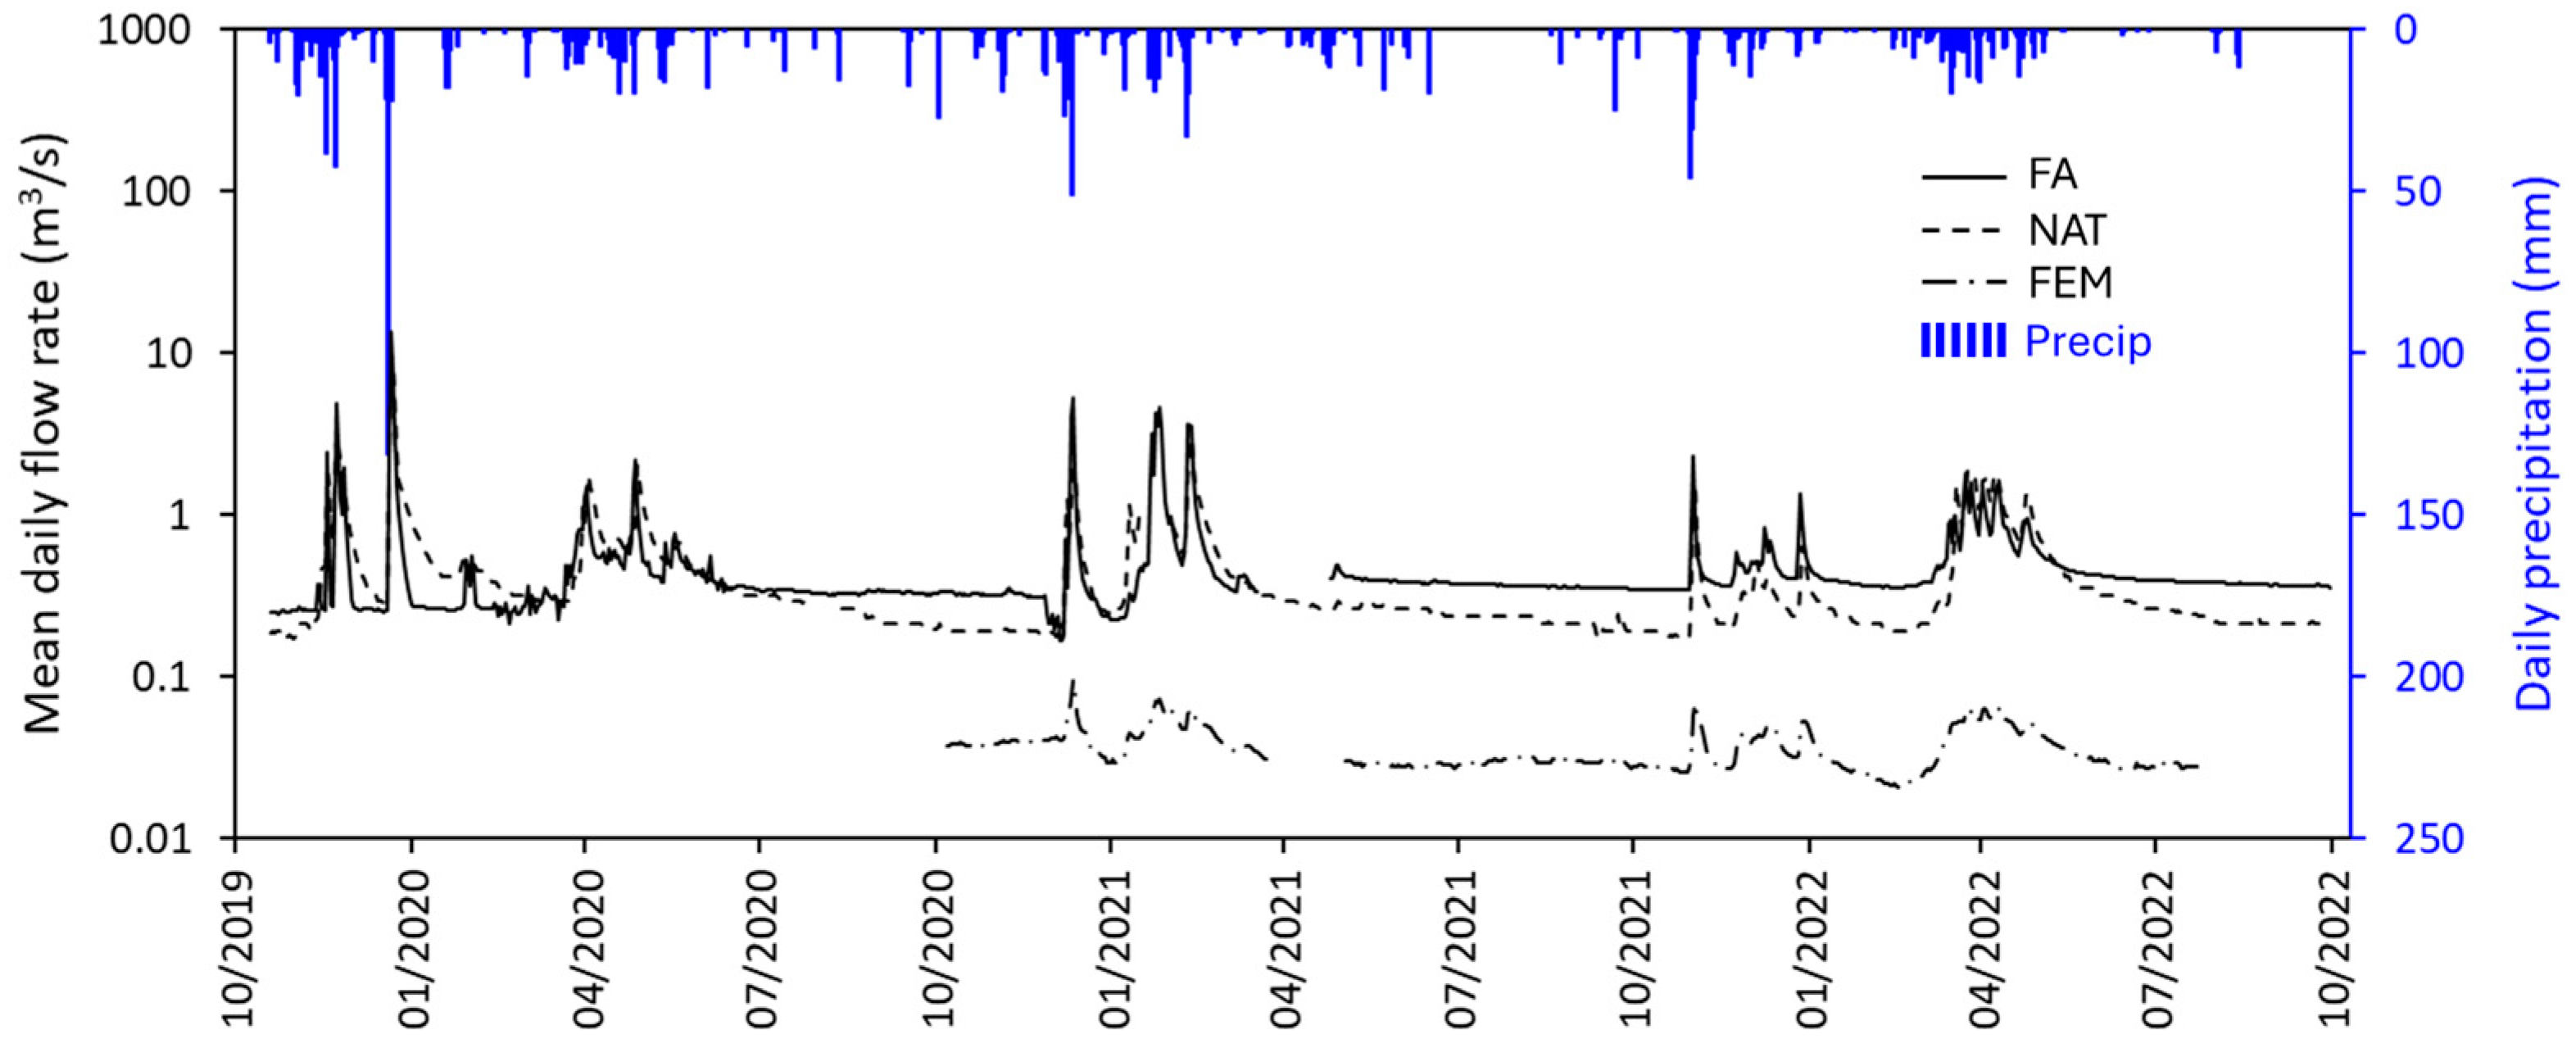
The observed groundwater discharge in FA and NAT shows a karstic behavior with a fast response to precipitation events (Figure 5) and short recessions that depend on the karstification degree of the corresponding aquifer [25]. The hydrological response of FEM is more inertial than that of the other two springs. This behavior may be due to the presence of induced and permanent recharge generated by direct infiltration into the Fuente Alta riverbed, through which the discharge of FA circulates [25]. The median value (i.e., 50th percentile) of the flow rate discharge in FA, NATm and FEM is 369 L/s, 272 L/s, and 31 L/s, respectively [25]. Considering the arid conditions of the study area, it is worth noting that precipitation events of less than 20 mm do not generate a hydrological response in terms of spring discharge [35]. Such a depth of precipitation is small enough to be absorbed by the existing vegetation, but also to be retained by the soils of poljes and dolines and in the epikarst.

4.2. Environmental Tracers ( δ 18 O , δ 2 H and d - e x ) in Precipitation and Groundwater

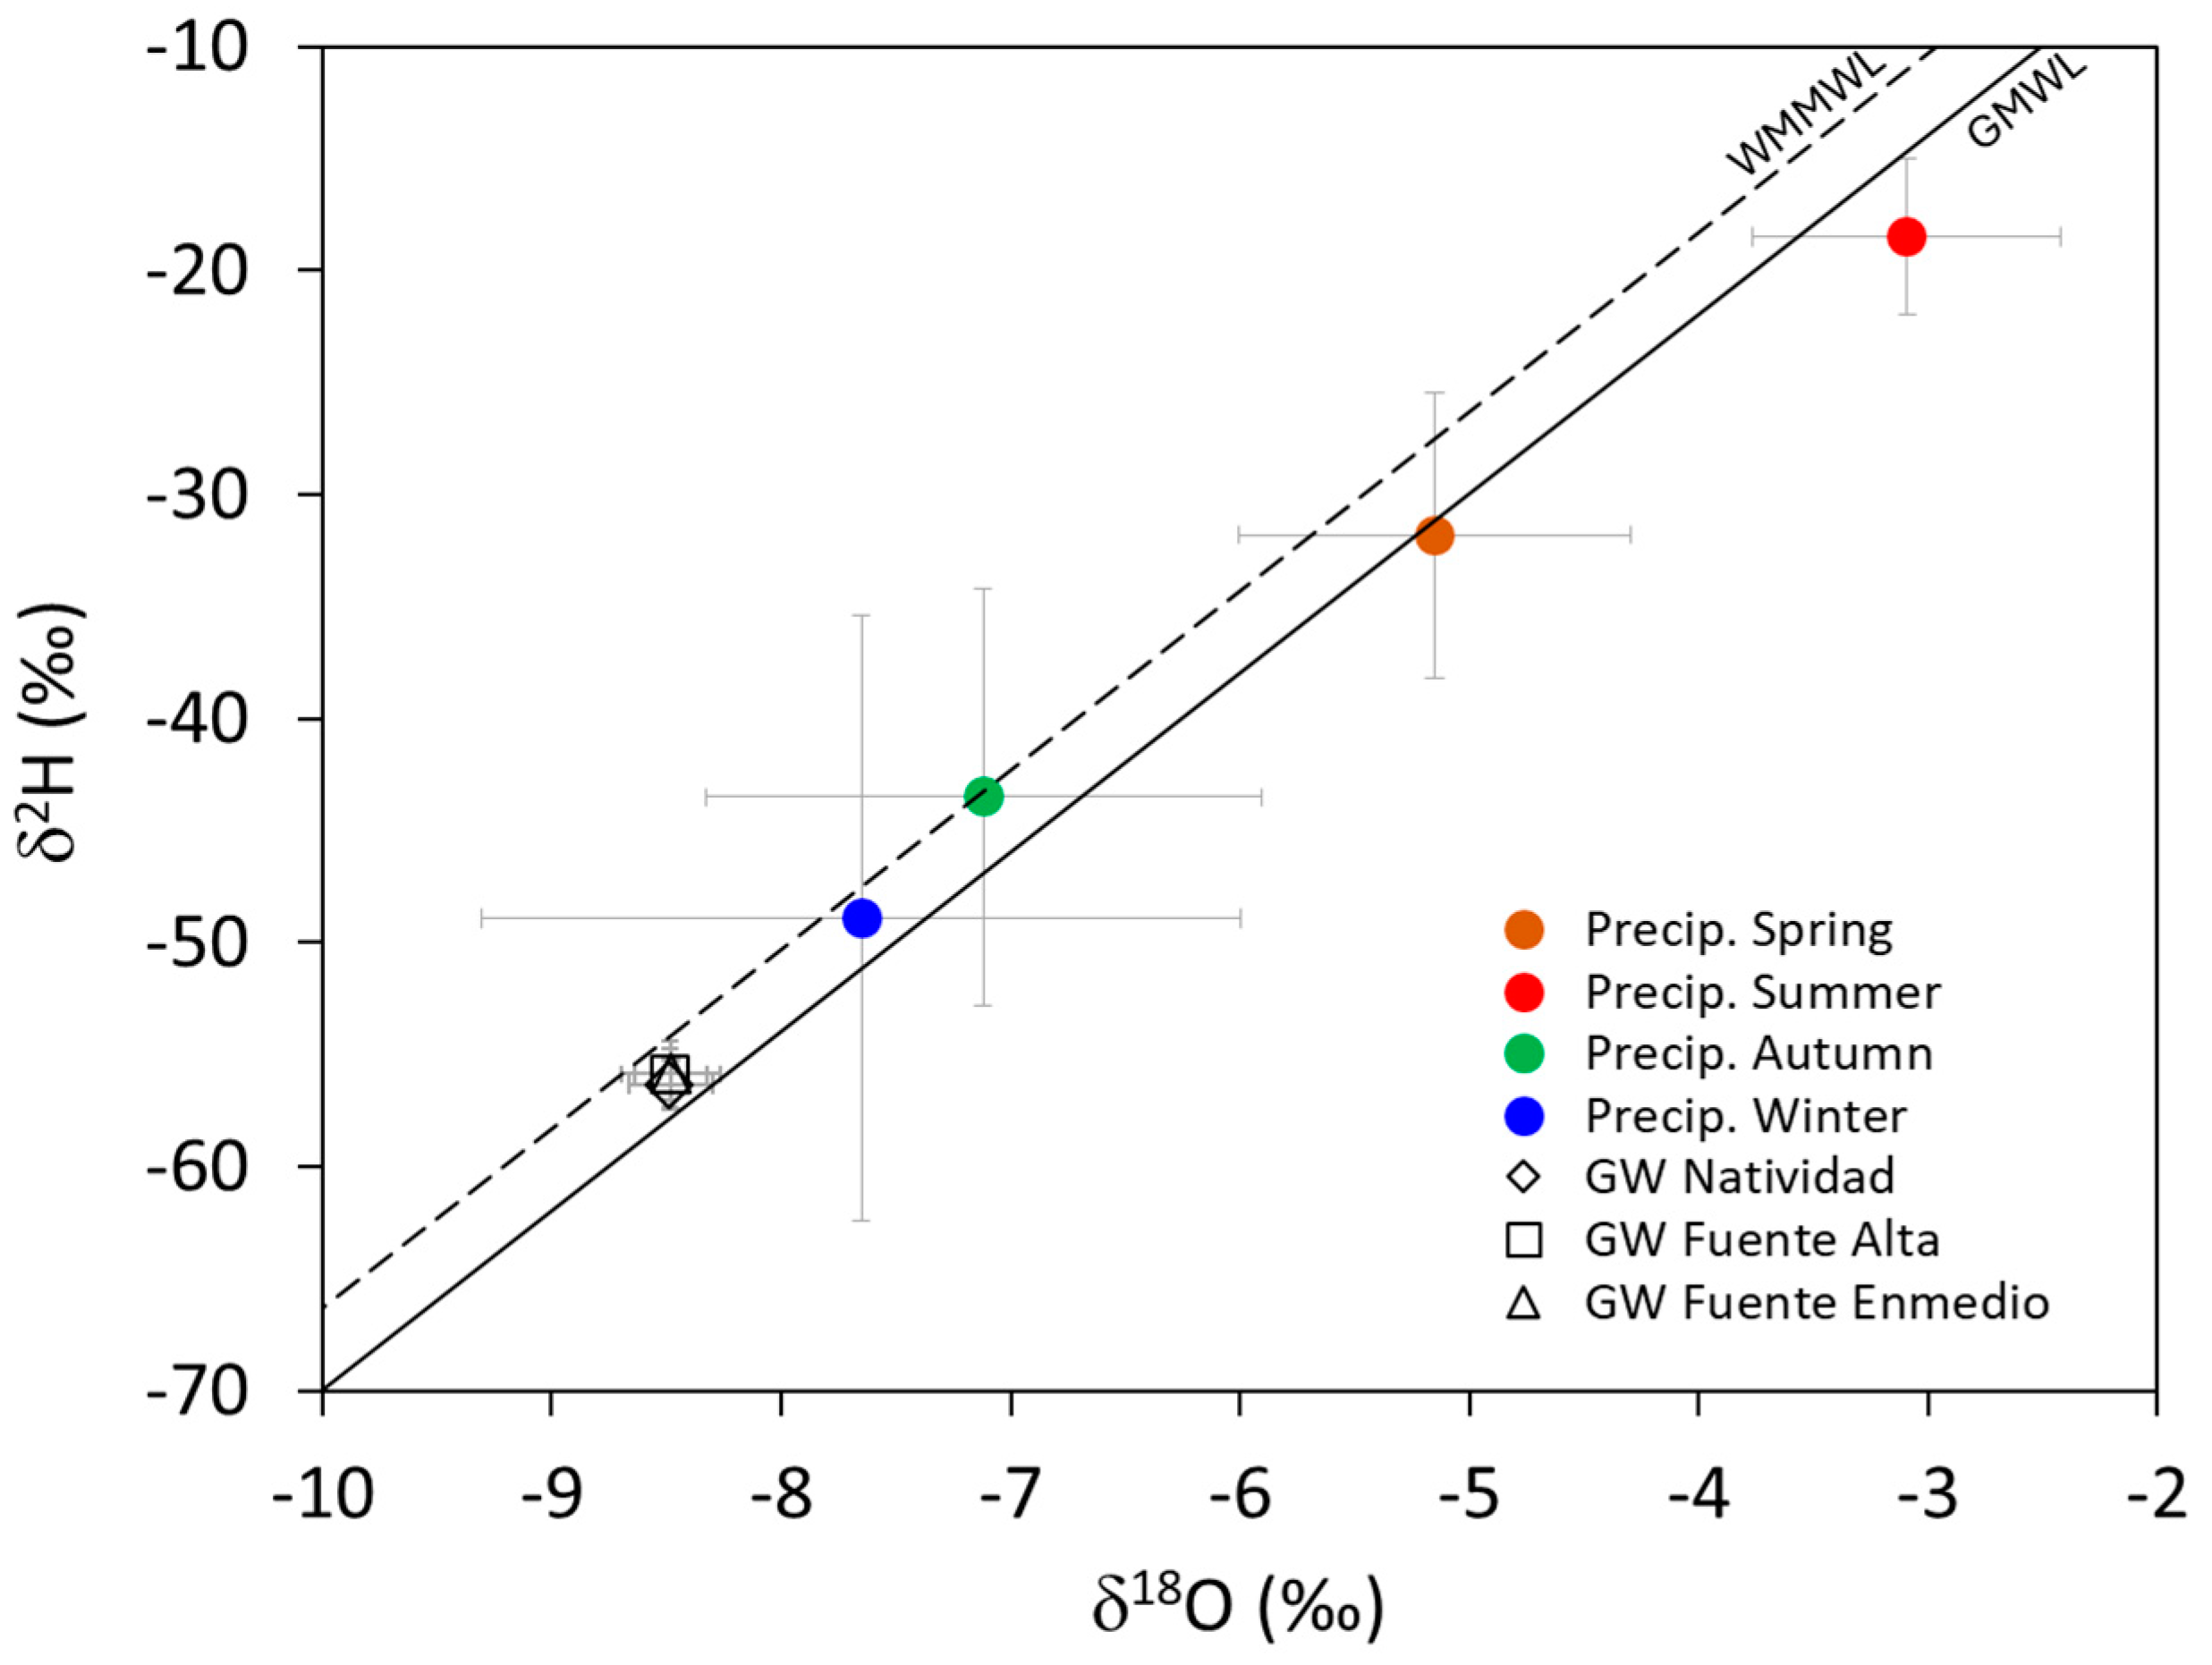
The precipitation samples obtained in Sierra Seca present a mean isotopic composition (i.e., case A1) of −6.9‰ and −42.5‰ for δ 18 O and δ 2 H , respectively. From a seasonal perspective, such isotopic composition shows a seasonal variation with heavier and lighter isotopic contents in summer and winter, respectively (Figure 6).
The mean isotopic content of groundwater is lighter than that of precipitation (Figure 6). This behavior is driven by recharge. This process is the highest from October to March, coinciding with the rainiest period in the study zone. During the warm seasons, especially in summer, most of the rainfall is evapotranspired (Figure S4 in Supplementary Materials); therefore, recharge decreases, and the average isotopic content of groundwater tends towards light compositions, resembling the isotopic composition of recharge in the rainy seasons (i.e., autumn and winter; Figure 6).
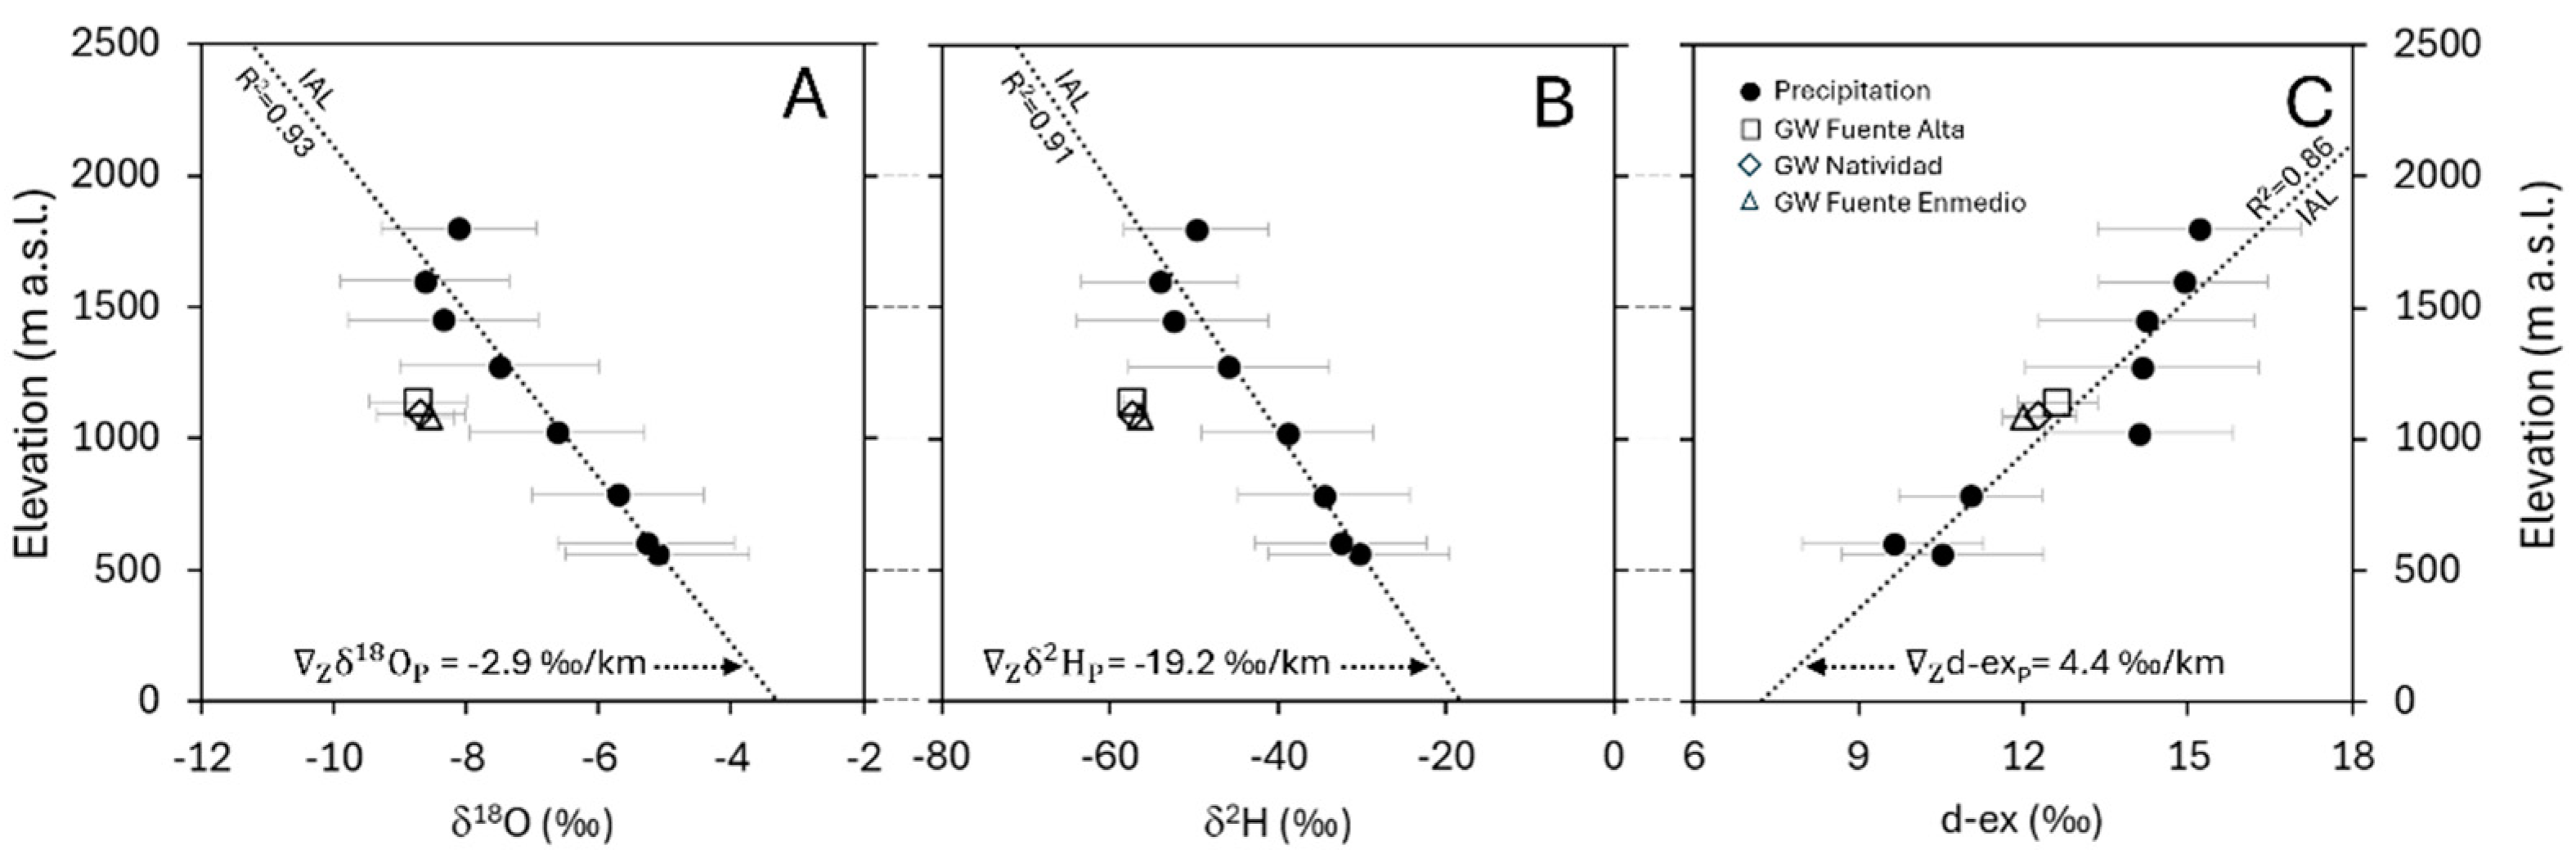
The estimated mean isotopic content of precipitation δ P presents a linear relationship with elevation (Figure 7, and Figure S5 in Supplementary Materials). Additionally, the estimated mean isotopic content of recharge δ R presents a linear relationship with elevation (Figure S6 in Supplementary Materials) with vertical gradients ( Z δ R ) of −3.4‰/km, −23.2‰/km, and 4.2‰/km for the environmental tracers δ 18 O R , δ 2 H R , and d - e x R , respectively. Regardless of such tracers, Z δ R is higher than Z δ P (Table 2) as would be expected for isotopic tracers entering a sloping unconfined aquifer by diffuse recharge [33]. It is important to keep this in mind because, from an empirical point of view, it is not easy to characterize δ R and therefore it is not easy to estimate Z δ R . This is the reason why Z δ P is often used as a proxy for Z δ R . The estimated values of Z δ 18 O P and Z δ 18 O R in Sierra Seca are −2.9‰/km and −3.1‰ /km, respectively.
The vertical gradient of the isotopic content of recharge Z δ R is needed to estimate the elevation of the recharge zone ( Z R ) associated with the springs draining the aquifer. As can be seen in Table 2, the mean Z R value obtained for FA, NAT, and FEM is 1661 m a.s.l., 1650 m a.s.l., and 1608 m a.s.l., respectively (Table 2). For every spring, Z R does not present large discrepancies along the ensemble of cases regarding the elevation of the recharge zone estimated using Z δ P ( c a s e A 1 ), with variations ranging between 6.2% and 7.1%. Despite that, Z δ 18 O R shows variations, with respect to Z δ 18 O P , of up to 61% (case A5). Such a discrepancy in the vertical gradient does not translate into a large discrepancy in the estimation of Z R because the karstification degree of the aquifer system outcrop zones. Indeed, there is a diffuse recharge along the slope of such outcropping zones (i.e., sloping recharge; [33]), which makes the isotopic content of the groundwater heavier than that obtained if the recharge entered the aquifer through a well-defined recharge zone located at a given elevation in the upper part of the massif.
There are no remarkable differences between cases A1 and A2 in terms of both Z R and Z δ R (Table 2). In the first case, the isotopic composition of all the rainfall events recorded in the study area is considered to estimate the IAL, while in the second case, summer rainfall events are excluded. Certainly, summer precipitation events are rare and, in terms of recharge, not relevant as suggested by the isotopic composition of groundwater (Figure 6). There are no remarkable differences between cases A1 and A2 in terms of both Z R and Z δ R . Moreover, such discrepancies are even greater for the other cases considered, where the excluded rainfall events have a greater precipitation length. It is difficult to apply a criterion, other than the hydrological response of the springs, to select the best scenario between cases A3, A4, and A5. In this line, it should be noted that there is no hydrological response in terms of spring discharge to precipitation events of less than 20 mm [35]. Therefore, case A3 stands out as the most plausible working hypothesis in terms of hydrological response to estimate the IAL for recharge. However, accepting case A3 as the most appropriate to represent the isotopic content of the recharge does not imply that the other cases considered are not also applicable. This has a direct impact on the uncertainty associated with the recharge height, as there is a discrepancy of up to ±85 m between the different cases with respect to the recharge height obtained with case 3.
Given the difficulty of estimating Z δ R , this value is often approximated by Z δ P . In Sierra Seca Z δ R ~ Z δ R . (Table 2), the Z δ 18 O P values obtained by other authors for southern Spain differ only slightly from that of the Sierra Seca: In the Subbetic Unit of the Betic Cordillera, Liñán-Baena (2003) [48] obtained a value of −3.1‰/km. 1‰/km; in the area of Chorros de Río Mundo, located in the northeastern foothills of the Sierra de Segura, Hornero-Díaz (2018) [49] obtained a vertical gradient of −4.5‰/km. Moral-Martos (2005) [27] estimated the vertical isotope gradient for the whole Sierra de Segura Range and obtained a value of −2.8‰/km. In this line, and extending the precipitation sampling area for isotopic characterization, Yanes (2022) [50] estimated a vertical gradient of −3.1‰/km for southern Spain. Similar values have been found in other areas in Spain and most mountain regions of the world ([50] and references therein). Table S2 (Supplementary Materials [5,11,27,32,48,49,50,51,52,53,54]) provides more information on Z δ 18 O P values estimated in other geographical areas).
Indeed, the uncertainty associated with the estimation of the aquifer recharge height can be large when using IAL (i.e., based on Z δ P ). This uncertainty increases when there is a large difference in elevation between the lower and upper aquifer zones, or even when there is a vertical isotope gradient ( Z δ R or even Z δ P ). Furthermore, in sloping aquifers, where the carbonate outcrops through the slope, the uncertainty may be further increased because diffuse recharge along the slope may be greater than concentrated recharge [17], thus calling into question the applicability of the IAL to estimate the height of the aquifer recharge zone.

4.3. Groundwater Transit Time

Groundwater transit time gives an indication of the hydraulic connection between the aquifer recharge zone and the naturally occurring groundwater discharge points (i.e., springs). Such a connection is provided by (1) the network of highly permeable drainage channels associated with karst development and (2) the structure of the associated primary porosity, including small joints and fractures, present in the limestone formations hosting the aquifer system. The transit time associated with the most conductive karst features ( τ K F ), which is associated with the fast flows through the aquifer, is typically measured by conducting dye tracer tests, whereas the transit time associated with the limestone formation hosting the aquifer ( τ i T R ), which provides information on how long it takes for in-transit recharge to reach the outflow point of the system, is estimated by analyzing the input and output functions of environmental tracers in the aquifer. τ K F   < τ i T R because they correspond to different flow paths with different velocities through the aquifer system.

4.3.1. Determination of τ K F Using Dye Tracer Tests

The objective of the tracer tests was to gain a deeper understanding of the highly conductive features of the karst system that facilitate fast recharge and to establish a hydrologic connection between the injection point and the different springs draining the aquifer system. In all the three cases, the injection point corresponds to a sinkhole of the karst system. Tracer test 1 was conducted in December 2020, injecting the tracer in the Lower Cretaceous limestones (site α in Figure 3). The tracer outflow was only observed in FA. Tracer test 2 was conducted in February 2021. The tracer was injected in the Upper Cretaceous limestones (site β in Figure 3), and the tracer outflow was only detected in NAT. Finally, tracer test 3 was conducted in February 2022. The tracer injection was conducted in the Upper Cretaceous limestones outcropping at the Fuente Alta riverbed (site ε in Figure 3). In this last case, the tracer outflow was only observed in FEM.
The three tracer tests were interpreted by calibrating the parameters τ and P D (Equation (8)). Table 2 includes the calibrated parameters τ K F and Péclet number ( P e = 1 / P D ) for each tracer test, while Figure 8 shows the observed and computed concentrations for every tracer test. In each case, the concentrations are normalized in accordance with the observed maximum concentration of the test. As shown, the breakthrough curves of all the tracer tests are left skewed, indicating that the injection and the sampling points were well connected by conduits. Such a connection has been confirmed by the current speleological explorations in Sierra Seca [30,55], which provide direct information of the internal geometry and actual functioning of the karts systems.
The hydrological conditions in Sierra Seca during the three tracer tests were different as reflected in the spring discharge measured in FA, NAT, and FEM during such tracer tests (Table 1). These conditions directly impact the time of the first tracer arrival ( t F A ; Table 3) and the transit time estimated for the different tracer tests. τ K F holds 1, 17, and 31 days for tracer tests 1, 2, and 3 respectively. Similar results, in terms of short transit times, were obtained by Lauber and Goldscheider (2014) [19] and Jódar et al. (2020) [17] for a number of tracer tests conducted in the alpine karst systems of the Wetterstein Mountains and the PNOMP, respectively. The short transit times of the karst conduits minimize the degradation and dilution of possible contaminants entering the system. These include fecal bacteria from agricultural practices, which would be transported to the springs within a relatively short period of time, highlighting the vulnerability of such karst systems to groundwater contamination problems.
Despite the disparity of the hydrological conditions driving the different tracer tests, it is possible to infer information of the internal structure of the karst system directly from the breakthrough curves. If the whole karst conduit network draining the system is conceptualized as a unique cylindrical conduit, an effective ratio ( R e f f [L]) for such a conduit can be estimated in terms of the distance between the tracer injection and outflow points (L; Table 1), the time of the tracer first arrival ( t F A ; Table 3), and the mean groundwater discharge in the interval between the tracer injection ( t = 0 ) and t = t F A , which is given by Q G W ¯ F A (Table 1). As can be shown in Table 3, R e f f is similar for tracer tests 1 and 2, indicating that the Upper and Lower Cretaceous aquifers have a similar development in terms of highly conductive karst features. This result is consistent with the estimated Peclet numbers, which are greater than one in all cases, indicating that advection is the main transport mechanism in the aquifer system. An advective tracer transport should be likely related with simple conduits geometries (Figure S1; Supplementary Materials), as it happens in the alpine Paleocene-Eocene limestone aquifer of the PNOMP and in the Central Southern sector of the Pyrenees, which is the highest karst system of Western Europe [16].
Tracer recovery is low for tracer tests 1 and 2, reaching only 26% and 4% of the mass of tracer injected, respectively. This result may be due to the large distance between the tracer injection and the tracer recovery points in both tracer tests. Such a distance favors the role played by localized karst features (e.g., channel junctions and bypasses) diverting groundwater, and hence the dissolved tracer, from the mainstream and thereby feeding uncontrolled diffuse discharge zones in the hydrogeological basin. In the case of tracer test 3, the tracer recovery increases up to 75%. A very low tracer recovery, which depends on both the hydrodynamic state of the aquifer (e.g., low flow rates) and the internal geometry of the aquifer (e.g., complex tectonic structure of the carbonate massif hosting the aquifer), may prevent the application of this technique in other aquifer systems.

4.3.2. Determination of τ i T R Using Environmental Tracers

The evolution of the isotope content in the discharge of FA and NAT has been simulated with FlowPC (Figure 9). According to the hydrogeological framework, it is assumed that the EPM flow model can describe the behavior of the aquifers drained by FA and NAT, and, therefore, the parameters η and τ i T R have been estimated. The obtained value of η is 1 for both aquifers, indicating that the flow scheme is that of a perfect mixing system with an exponential distribution of groundwater flow lines (i.e., exponential model [37], which is consistent with the behavior of a karst aquifer system discharging through a main spring.
The estimated τ i T R values for FA and NAT are 5 and 4 months, respectively. These values are similar to those obtained for other karst aquifers in mountain areas, such as in the aquifer system of the Schneealpe massif, whose discharge represents the main drinking water resource of Vienna (Austria). In this karst aquifer, Steig et al. (2014) [31] and Schoenemann et al. (2013) [56] obtained τ i T R values between 1.2 and 2 months. Another example is the karstic aquifer system of the Wetterstein Mountains, where Angert et al. (2004) [57] estimated τ i T R values ranging between 3 and 5 months for the main springs draining the system. These values may seem small when compared to values obtained for other karst aquifers also located in mountain areas, such as, for example, the karst aquifer system of the Parque Nacional de Ordesa and Monte Perdido (PNOMP; Central Pyrenees, Spain), which is the highest limestone massif in Western Europe. Here, Jódar et al. (2020) [17] estimated τ i T R for the most important springs in the aquifer, obtaining values between 1.12 and 4.48 years. Similarly, Herms et al. (2019) [14] characterized the transit time of the springs draining the karstic massif of Port del Comte (Eastern Pyrenees, Spain), obtaining τ i T R values between 1.69 and 2.85 years. Both in the case of Ordesa and in the case of Port del Comte, the long transit times may be conditioned by the strength of the unsaturated zone, which in both cases exceeds 1000 m in thickness.

4.4. Definition of Hydrogeological Boundaries:

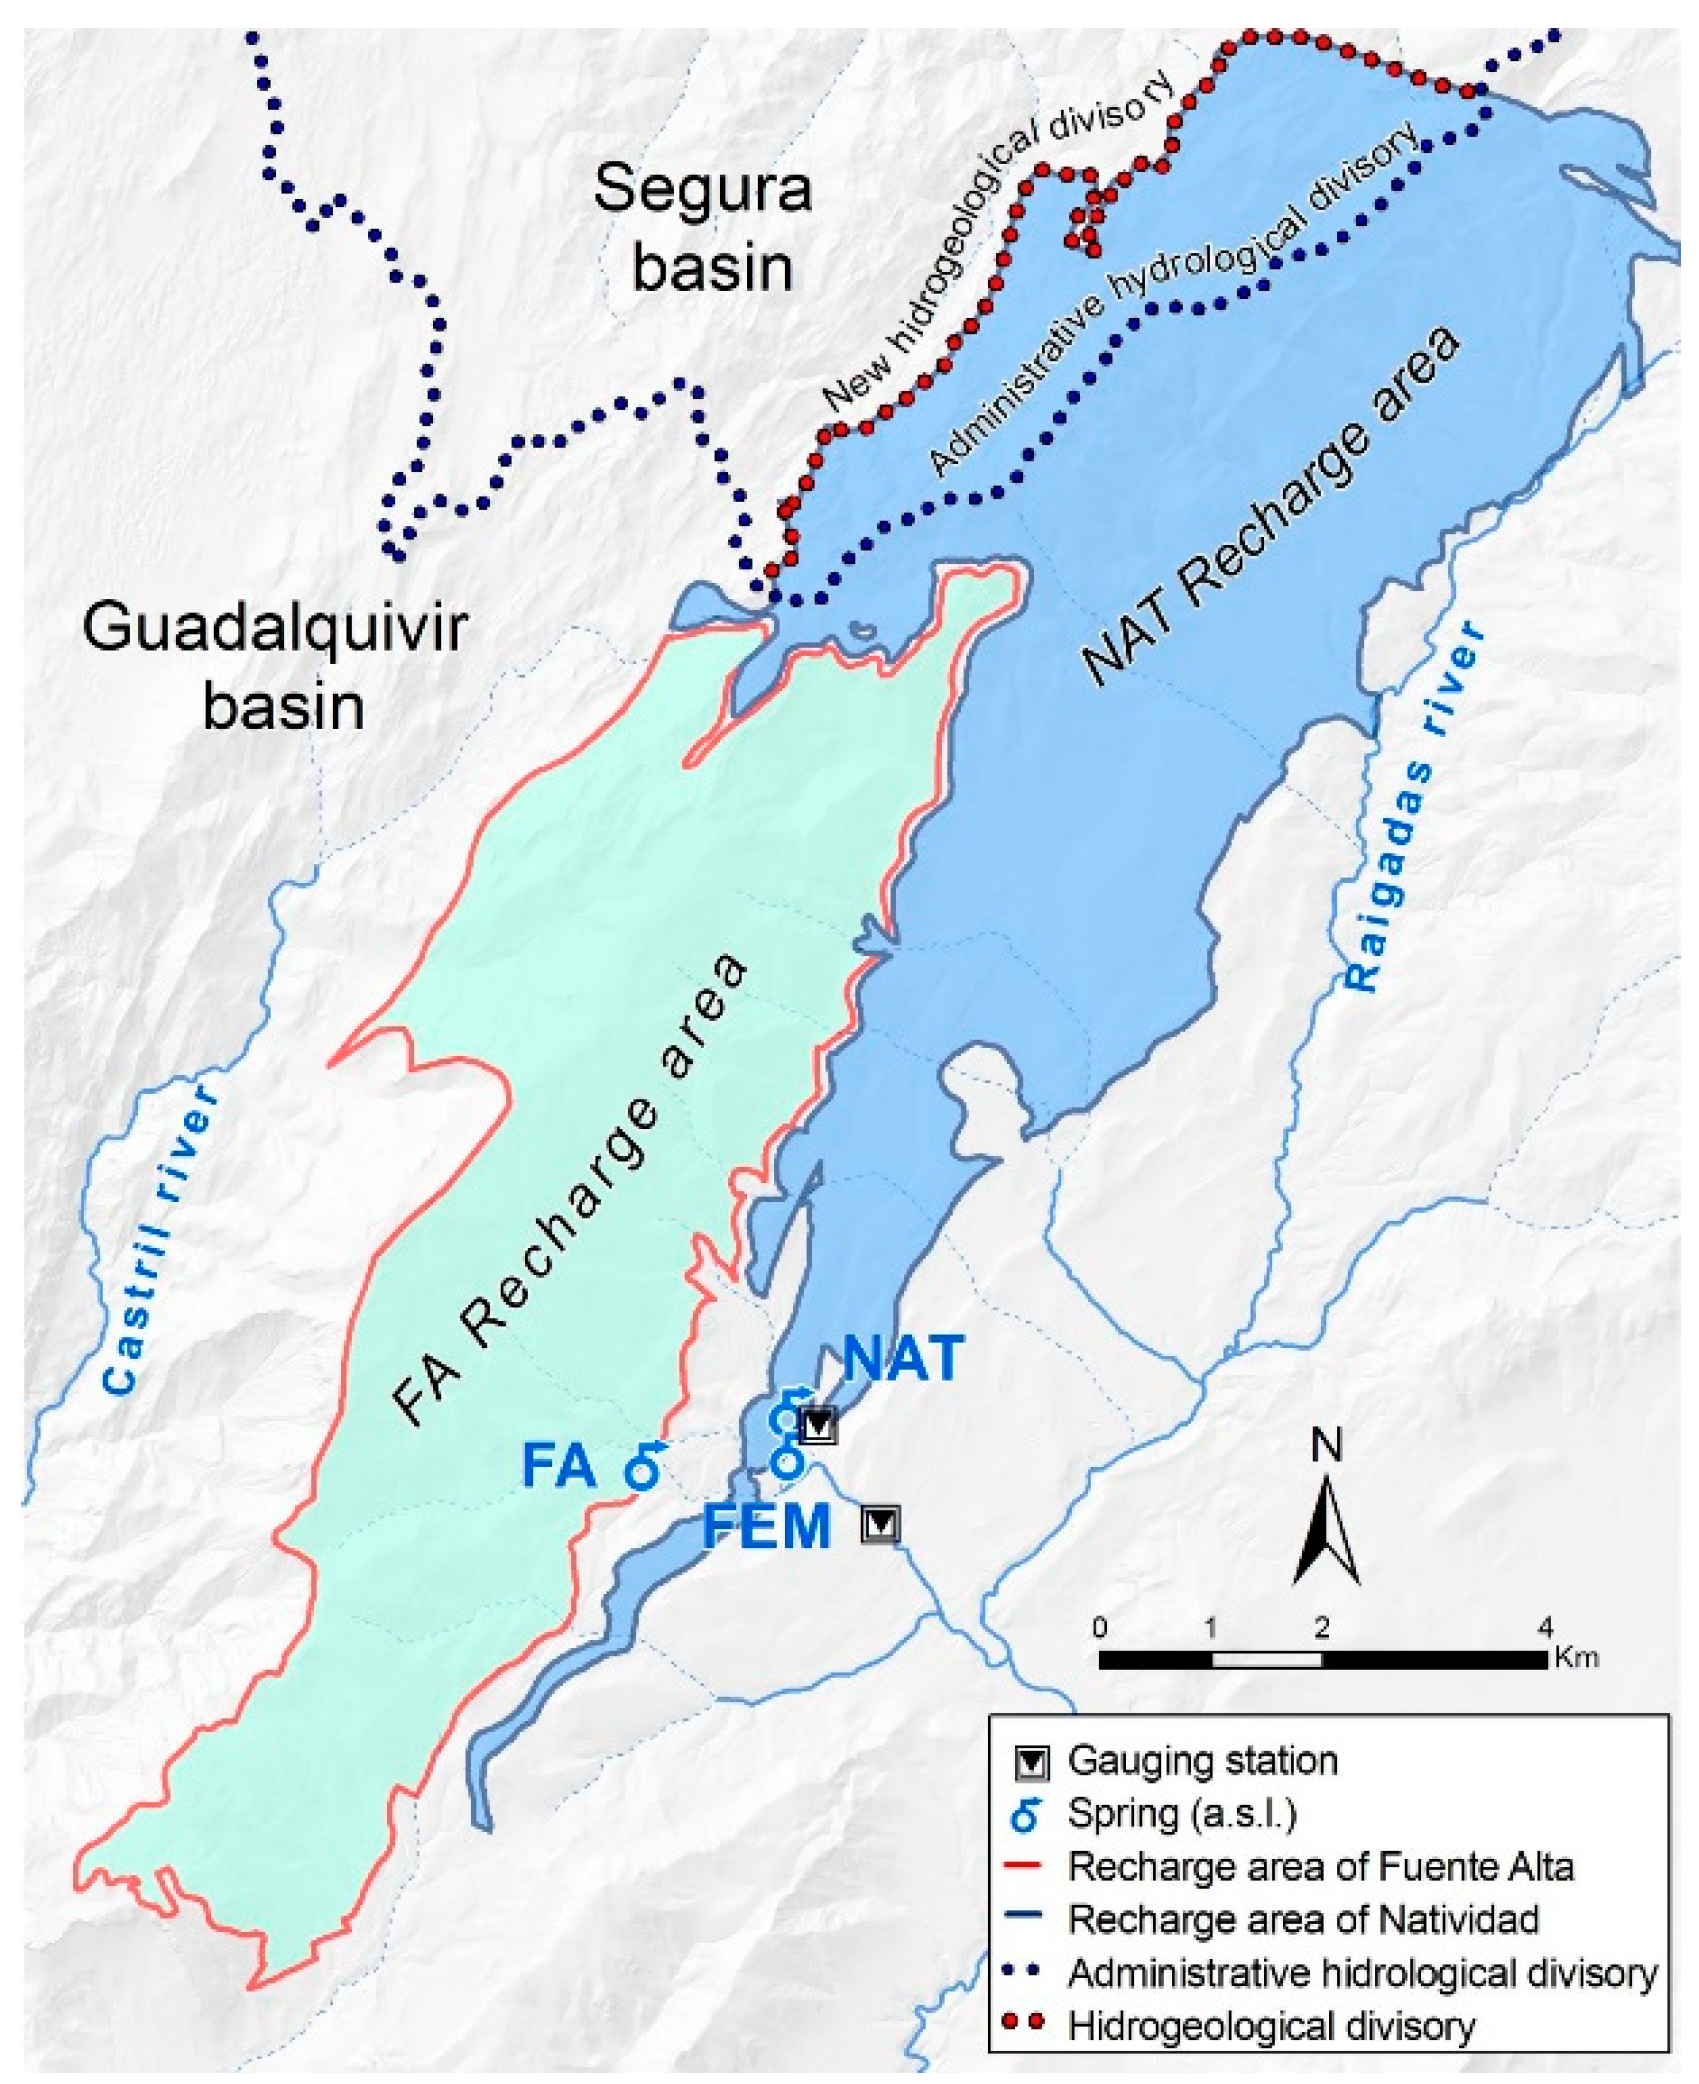
In hydrogeological sciences, one of the most common problems is the delineation of hydrological and hydrogeological basins, as they often do not coincide [58] given the complexity of the geological structure of the aquifers. Based on the geological structure (Figure 3) and recharge elevation zones estimated for the aquifer system of Sierra Seca (Section 4.2), this work allows defining the boundaries associated with the hydrogeological system (Figure 10). Indeed, the hydrological boundary of the Segura and Guadalquivir basins crosses the study area along the mountain range that defines the Sierra Seca. This geographical boundary, which theoretically separates the hydrological basins of both rivers, is larger, and hence different from the hydrogeological boundary that defines the Sierra Seca aquifer system, which drains entirely into the Guadalquivir basin. This result may be relevant and should be considered by the water authorities responsible for the management of water resources in both river basins (i.e., Confederación del Guadalquivir and Confederación del Segura). Additionally, the obtained results may be used be used to include the recharge areas of the FA and NAT aquifers in the Catalogue of Underground Natural Reserves of Spain [59].

5. Conclusions

In the aquifer system of Sierra Seca, the vertical gradient of recharge Z δ R may be larger than that of precipitation Z δ P Despite that, the estimation of the recharge zone elevation ( Z R ) associated with the aquifer system is not very sensitive with respect to Z δ R , obtaining the range of Z R between 1500 and 1700 m a.s.l.
The aquifer system behaves as a dual-porosity aquifer, with a highly permeable domain created by (1) the most conductive karst features and (2) a connected porosity domain integrated with small fractures and primary porosity. The first structure controls the system response during rainfall events, whereas the second one does it during the long and abundant dry spells occurring in the study zone.
The Upper and Lower Cretaceous aquifers exhibit similar behavior in terms of tracer transport. From the perspective of environmental tracers, both aquifers exhibit similar transit times between 4 and 5 months, for recharge to reach the outflow point of the system. Moreover, in terms of a hypothetic karst conduit draining the aquifer system, the artificial tracers point to a conduit of similar effective radius ( R e f f ) for both the Upper and Lower Cretaceous aquifers, highlighting a similar development of the most conductive karst features in such aquifers.
The low transit times observed in both the high conductive karst features (tracers tests) and the connected porosity domains (isotopic data) highlight the significant vulnerability of the karst system to contamination risks.
Mountain karst aquifers are ideal watchtowers for monitoring the effects of climate change on hydrological systems. More research is needed to characterize the behavior of such aquifers, especially in the Mediterranean basin, which is a hotspot for climate change impacts. This research will allow adaptation measures to be designed to minimize the severity of such impacts.

Supplementary Materials

The following supporting information can be downloaded at https://www.mdpi.com/article/10.3390/w16192768/s1, Figure S1: Karst Network of FA and Natividad springs. (A) Flooded conduit of Natividad spring. (B) Aerial conduit of Natividad spring. (C) Collapsed chamber in the FA karst network. (D) Karst gallery associated with FA. (E) Drainage conduit of FA spring; Figure S2: Kast development of study area. (A) Uvala “La Laguna” with ponor. (B) Lapiaz. (C) kastified surface. (D) Fuente Alta Spring. (E) Natividad Spring. (F) La Natividad Gauging station; Figure S3: Activation sequence of the Fuente Alta Trop Pleins. (A) Trop Plein 1 inactive. (B) Trop Plein 1 active with low discharge flow rate (600 L/s). (C) Trop Plein 1 active with high discharge flow rate (4000 l/s). (D) Trop Plein 2 active. (E) Trop Plein 3 active. (F) Trop Plein 3 active; Figure S4: Seasonal variation of the isotopic content of precipitation. WMMWL, GMLW and Evap. L indicate West Mediterranean Meteoric Water Line (d-excess = 13.7‰), Global Meteoric Water Line (d-excess = 10‰), and Evaporation Line (slope d δ 2 H / d δ 18 O = 5 ), respectively; Figure S5: Mean isotopic content (δ18O) of precipitation in the rainfall monitoring stations. The numbers indicate the elevation of the rainfall monitoring stations. The two-sided error bars indicate one standard deviation. WMMWL and GMLW indicate West Mediterranean Meteoric Water Line (d-excess = 13.7‰), and Global Meteoric Water Line (d-excess = 10‰), respectively; Figure S6: Isotopic (δ18O and d-ex) Altitudinal Lines (IALs) of recharge for the different cases (i.e., A1 to A5) considered to estimate the mean isotopic content of recharge from that of precipitation; Table S1: Mean isotopic content of precipitation at the sampling sites. Such isotope averages are obtained by excluding water samples from precipitation events of less than 20 mm; Table S2: Vertical isotopic gradient of precipitation obtained by other authors. References from [5,11,27,32,48,49,50,51,52,53,54] are mentioned in the Supplementary Materials document.

Author Contributions

Conceptualization, A.L.M.-G., A.G.-R. and J.J.; Methodology, J.J., A.L.M.-G. and A.G.-R.; Software, J.J.; Validation, J.J., R.J.-E. and F.M.-M.; formal analysis, J.J.; Investigation, A.L.M.-G. and A.G.-R.; Resources, A.L.M.-G. and F.G.; Data curation, A.L.M.-G. and J.J.; Writing—Original draft preparation, J.J., A.L.M.-G. and A.G.-R.; Writing—Review and editing, J.J. and A.L.M.-G.; visualization, J.J. and A.L.M.-G.; supervision, J.J., R.J.-E., F.M.-M., F.G. and A.G.-R.; project administration, A.L.M.-G.; funding acquisition, R.J.-E. All authors have read and agreed to the published version of the manuscript.

Funding

This research received the economic contribution of the research group RNM-325 of the University of Jaén, the Geological and Mining Institute of Spain (IGME-CSIC), the fish farm “Las Fuentes”, and the research group RNM-189 of the Department of Biology and Geology of the University of Almería. F.G acknowledges the Ramón y Cajal fellowship, RYC2020-029811-I of the Agencia Estatal de Investigación of the Ministerio de Ciencia e Innovación of Spain and the grant PPIT-UAL, Junta de Andalucía-FEDER 2022-2026 (RyC-PPI2021-01).

Data Availability Statement

Dataset available on request from the authors.

Acknowledgments

This research was carried out thanks to the collaboration of the University of Jaén (RNM-325), Manuel López Chicano (University of Granada), the University of Almería, the Geological and Mining Institute of Spain (CSIC-IGME), the Hydrographic Confederation of the Guadalquivir, and especially Raúl Viedma, who is in charge of the Piscifactoría las Fuentes, for his great commitment and collaboration since the beginning of this research. We would also like to thank Juan Espejo, Mari Carmen García Moreno, and Antonio Domínguez for their support and help. Besides, we would like to thank the Confederación Hidrográfca del Guadalquivir for providing data from the gauging stations, and the support of AEMET who provided meteorological data. The authors would also like to thank the anonymous reviewers for their constructive comments and suggestions which led to a substantial improvement of the paper.

Conflicts of Interest

The authors declare no conflicts of interest. The funders had no role in the design of the study; in the collection, analyses, or interpretation of data; in the writing of the manuscript; or in the decision to publish the results.

References

  1. Goldscheider, N.; Chen, Z.; Auler, A.S.; Bakalowicz, M.; Broda, S.; Drew, D.; Hartmann, J.; Jiang, G.; Moosdorf, N.; Stevanovic, Z.; et al. Global Distribution of Carbonate Rocks and Karst Water Resources. Hydrogeol. J. 2020, 28, 1661–1677. [Google Scholar] [CrossRef]
  2. Stevanović, Z. Karst Waters in Potable Water Supply: A Global Scale Overview. Environ. Earth Sci. 2019, 78, 662. [Google Scholar] [CrossRef]
  3. Ford, D.; Williams, P.D. Karst Hydrogeology and Geomorphology; John Wiley & Sons: Hoboken, NJ, USA, 2007; ISBN 9780470849965. [Google Scholar]
  4. Hartmann, A.; Jasechko, S.; Gleeson, T.; Wada, Y.; Andreo, B.; Barbera, J.A.; Brielmann, H.; Bouchaou, L.; Charlier, J.B.; Darling, W.G.; et al. Risk of Groundwater Contamination Widely Underestimated Because of Fast Flow into Aquifers. Proc. Natl. Acad. Sci. USA 2021, 118, e2024492118. [Google Scholar] [CrossRef] [PubMed]
  5. Andreo, B.; Liñán, C.; Carrasco, F.; Jiménez de Cisneros, C.; Caballero, F.; Mudry, J. Influence of Rainfall Quantity on the Isotopic Composition (18O and 2H) of Water in Mountainous Areas. Application for Groundwater Research in the Yunquera-Nieves Karst Aquifers (S Spain). Appl. Geochem. 2004, 19, 561–574. [Google Scholar] [CrossRef]
  6. Stroj, A.; Briški, M.; Lukač Reberski, J.; Frangen, T. Regional Analysis of Tracer Tests in the Karstic Basin of the Gacka River (Croatian Dinaric Karst). Hydrology 2023, 10, 106. [Google Scholar] [CrossRef]
  7. Custodio, E. Recarga Natural a Los Acuíferos, Metodología y Soporte de La Isotopía Del Agua: Aplicación a La Planificación Hidrológica y Conocimiento de Las Aguas Subterráneas En España: Informe RAEMIA; Iniciativa Digital Politècnica; Oficina de Publicacions Acadèmiques Digitals de La UPC: Barcelona, Spain, 2019. [Google Scholar]
  8. Dansgaard, W. Stable Isotopes in Precipitation. Tellus A Dyn. Meteorol. Oceanogr. 2012, 16, 436–468. [Google Scholar] [CrossRef]
  9. Allen, S.T.; Jasechko, S.; Berghuijs, W.R.; Welker, J.M.; Goldsmith, G.R.; Kirchner, J.W. Global Sinusoidal Seasonality in Precipitation Isotopes. Hydrol. Earth Syst. Sci. 2019, 23, 3423–3436. [Google Scholar] [CrossRef]
  10. Liu, F.; Conklin, M.H.; Shaw, G.D. Altitudinal Control of Isotopic Composition and Application in Understanding Hydrologic Processes in the Mid Merced River Catchment, Sierra Nevada, California, USA. Hydrol. Earth Syst. Sci. 2023, 28, 2239–2258. [Google Scholar] [CrossRef]
  11. Jódar, J.; Custodio, E.; Lambán, L.J.; Martos-Rosillo, S.; Herrera-Lameli, C.; Sapriza-Azuri, G. Vertical Variation in the Amplitude of the Seasonal Isotopic Content of Rainfall as a Tool to Jointly Estimate the Groundwater Recharge Zone and Transit Times in the Ordesa and Monte Perdido National Park Aquifer System, North-Eastern Spain. Sci. Total Environ. 2016, 573, 505–517. [Google Scholar] [CrossRef]
  12. Jódar, J.; Lambán, L.J.; Medina, A.; Custodio, E. Exact Analytical Solution of the Convolution Integral for Classical Hydrogeological Lumped-Parameter Models and Typical Input Tracer Functions in Natural Gradient Systems. J. Hydrol. 2014, 519, 3275–3289. [Google Scholar] [CrossRef]
  13. Lambán, L.J.; Jódar, J.; Custodio, E.; Soler, A.; Sapriza, G.; Soto, R. Isotopic and Hydrogeochemical Characterization of High-Altitude Karst Aquifers in Complex Geological Settings. The Ordesa and Monte Perdido National Park (Northern Spain) Case Study. Sci. Total Environ. 2015, 506–507, 466–479. [Google Scholar] [CrossRef] [PubMed]
  14. Herms, I.; Jódar, J.; Soler, A.; Vadillo, I.; Lambán, L.J.; Martos-Rosillo, S.; Núñez, J.A.; Arnó, G.; Jorge, J. Contribution of Isotopic Research Techniques to Characterize High-Mountain-Mediterranean Karst Aquifers: The Port Del Comte (Eastern Pyrenees) Aquifer. Sci. Total Environ. 2019, 656, 209–230. [Google Scholar] [CrossRef] [PubMed]
  15. Mudarra, M.; Andreo, B.; Marín, A.I.; Vadillo, I.; Barberá, J.A. Combined Use of Natural and Artificial Tracers to Determine the Hydrogeological Functioning of a Karst Aquifer: The Villanueva Del Rosario System (Andalusia, Southern Spain). Hydrogeol. J. 2014, 22, 1027–1039. [Google Scholar] [CrossRef]
  16. González-Ramón, A.; Jódar, J.; Samsó, J.M.; Martos-Rosillo, S.; Heredia, J.; Zabaleta, A.; Antigüedad, I.; Custodio, E.; Lambán, L.J. Hydrometeorological Factors Determining the Development of Water Table Cave Patterns in High Alpine Zones. The Ordesa and Monte Perdido National Park, Ne Spain. Int. J. Speleol. 2020, 49, 249–270. [Google Scholar] [CrossRef]
  17. Jódar, J.; González-Ramón, A.; Martos-Rosillo, S.; Heredia, J.; Herrera, C.; Urrutia, J.; Caballero, Y.; Zabaleta, A.; Antigüedad, I.; Custodio, E.; et al. Snowmelt as a Determinant Factor in the Hydrogeological Behaviour of High Mountain Karst Aquifers: The Garcés Karst System, Central Pyrenees (Spain). Sci. Total Environ. 2020, 748, 141363. [Google Scholar] [CrossRef]
  18. Chen, Z.; Goldscheider, N. Modeling Spatially and Temporally Varied Hydraulic Behavior of a Folded Karst System with Dominant Conduit Drainage at Catchment Scale, Hochifen–Gottesacker, Alps. J. Hydrol. 2014, 514, 41–52. [Google Scholar] [CrossRef]
  19. Lauber, U.; Goldscheider, N. Use of Artificial and Natural Tracers to Assess Groundwater Transit-Time Distribution and Flow Systems in a High-Alpine Karst System (Wetterstein Mountains, Germany). Hydrogeol. J. 2014, 22, 1807–1824. [Google Scholar] [CrossRef]
  20. Luo, M.; Wan, L.; Liao, C.; Jakada, H.; Zhou, H. Geographic and Transport Controls of Temperature Response in Karst Springs. J. Hydrol. 2023, 623, 129850. [Google Scholar] [CrossRef]
  21. Zhang, Z.; Wang, X.; Chen, X.; Xie, Y.; Cheng, Q.; He, Q.; Peng, T.; Chen, B.; Soulsby, C. Can Temperature Be a Low-Cost Tracer for Modelling Water Age Distributions in a Karst Catchment? J. Hydrol. 2024, 643, 131947. [Google Scholar] [CrossRef]
  22. Bergström, S. Development and Application of a Conceptual Runoff Model for Scandinavian Catchments; RHO 7; SMHI: Norrköping, Sweden, 1976. [Google Scholar]
  23. Seibert, J. HBV Light. User’s Manual; Uppsala University, Institute of Earth Science, Department of Hydrology: Uppsala, Sweden, 1996. [Google Scholar]
  24. Maloszewski, P.; Zuber, A. Lumped Parameter Models for the Interpretation of Environmental Tracer Data. In Manual on Mathematical Models in Isotope Hydrogeology, TECDOC-910; International Atomic Energy Agency, Ed.; International Atomic Energy Agency Publishing Section: Vienna, Austria, 1996. [Google Scholar]
  25. González-Ramón, A.; Jódar, J.; Morales-González, A.L.; Moral-Martos, F.; Jiménez-Espinosa, R. Characterising the Discharge of Hillslope Karstic Aquifers from Hydrodynamic and Physicochemical Data (Sierra Seca, SE Spain). Hydrogeol. J. 2024. [Google Scholar] [CrossRef]
  26. Chazarra Bernabé, A.; Flórez García, E.; Peraza Sánchez, B.; Tohá Rebull, T.; Lorenzo Mariño, B.; Criado Pinto, E.; Moreno García, J.V.; Romero Fresneda, R.; Botey Fullat, R. Mapas Climáticos de España (1981–2010) y ETo (1996–2016); Agencia Estatal de Meteorología: Madrid, Spain, 2018. [Google Scholar]
  27. Moral, F. Contribución al Conocimiento de Los Acuíferos Carbonáticos de La Sierra de Segura (Alto Guadalquivir y Alto Segura). Doctoral Dissertation, Universidad Pablo de Olavide, Sevilla, Spain, 2005. [Google Scholar]
  28. Instituto Geológico y Minero de España. Mapa geológico de España, Escala 1:50.000. San Clemente. 2007. Available online: https://info.igme.es/cartografiadigital/datos/magna50/memorias/MMagna0929.pdf (accessed on 27 September 2024).
  29. García-Hernández, M. El Jurásico Terminal y El Cretácico Inferior En Las Sierras de Cazorla y Del Segura (Zona Prébetica). Doctoral Dissertation, Universidad de Granada, Granada, Spain, 1978. [Google Scholar]
  30. González-Ramón, A.; Rodríguez-Cerezuela, B. Prospección En Sierra Seca, Sierra de Castril y Buceo Del Sifón Pedro Jiménez (Granada). Andalucía Subterránea. 2023, Volume 36. Available online: https://espeleo.com/publicaciones/andalucia-subterranea-36-2 (accessed on 27 September 2024).
  31. Steig, E.J.; Gkinis, V.; Schauer, A.J.; Schoenemann, S.W.; Samek, K.; Hoffnagle, J.; Dennis, K.J.; Tan, S.M. Calibrated High-Precision 17O-Excess Measurements Using Cavity Ring-down Spectroscopy with Laser-Current-Tuned Cavity Resonance. Atmos. Meas. Tech. 2014, 7, 2421–2435. [Google Scholar] [CrossRef]
  32. Giménez, R.; Bartolomé, M.; Gázquez, F.; Iglesias, M.; Moreno, A. Underlying Climate Controls in Triple Oxygen (16O, 17O, 18O) and Hydrogen (1H, 2H) Isotopes Composition of Rainfall (Central Pyrenees). Front. Earth. Sci. 2021, 9, 633698. [Google Scholar] [CrossRef]
  33. Custodio, E.; Jódar, J. Simple Solutions for Steady–State Diffuse Recharge Evaluation in Sloping Homogeneous Unconfined Aquifers by Means of Atmospheric Tracers. J. Hydrol. 2016, 540, 287–305. [Google Scholar] [CrossRef]
  34. Matheswaran, K.; Khadka, A.; Dhaubanjar, S.; Bharati, L.; Kumar, S.; Shrestha, S. Delineation of Spring Recharge Zones Using Environmental Isotopes to Support Climate-Resilient Interventions in Two Mountainous Catchments in Far-Western Nepal. Hydrogeol. J. 2019, 27, 2181–2197. [Google Scholar] [CrossRef]
  35. Morales-González, A.L.; Jódar, J.; Jiménez-Espinosa, R.; González-Ramón, A. Comparison between Two Methodologies for the Determination of the Recharge Heights in Springs of the Sierra de Segura (Jaén) Based on Environmental Isotopes. In Proceedings of the 76th Scientific Session, Segura de La Sierra, Spain, 7–8 June 2024; Available online: https://sociedadgeologica.org/sesiones-cientificas/76-sesion-cientifica-2 (accessed on 27 September 2024).
  36. Maloszewski, P.; Stichler, W.; Zuber, A.; Rank, D. Identifying the Flow Systems in a Karstic-Fissured-Porous Aquifer, the Schneealpe, Austria, by Modelling of Environmental 18o and 3h Isotopes. J. Hydrol. 2002, 256, 48–59. [Google Scholar] [CrossRef]
  37. Małoszewski, P.; Zuber, A. Determining the Turnover Time of Groundwater Systems with the Aid of Environmental Tracers. 1. Models and Their Applicability. J. Hydrol. 1982, 57, 207–231. [Google Scholar] [CrossRef]
  38. Zuber, A. Chapter 1. Mathematical models for the interpretation of environmental radioisotopes in groundwater systems. In Handbook of Environmental Isotope Geochemistry; Fritz, P., Fontes, J.C., Eds.; Elsevier: Amsterdam, Netherlands, 1986; Volume 2. [Google Scholar]
  39. Amin, I.E.; Campana, M.E. A General Lumped Parameter Model for the Interpretation of Tracer Data and Transit Time Calculation in Hydrologic Systems. J. Hydrol. 1996, 179, 1–21. [Google Scholar] [CrossRef]
  40. Epting, J.; Page, R.M.; Auckenthaler, A.; Huggenberger, P. Process-Based Monitoring and Modeling of Karst Springs—Linking Intrinsic to Specific Vulnerability. Sci. Total Environ. 2018, 625, 403–415. [Google Scholar] [CrossRef]
  41. Hottelet, C.; Braun, L.N.; Leibundgut, C.; Rieg, A. Simulation of Snowpack and Discharge in an Alpine Karst Basin. In Snow and Glacier Hydrology. Proceedings of the International Symposium, Kathmandu, 1992; IAHS Publication: Wallingford, UK, 1993. [Google Scholar]
  42. Barberá, J.A.; Jódar, J.; Custodio, E.; González-Ramón, A.; Jiménez-Gavilán, P.; Vadillo, I.; Pedrera, A.; Martos-Rosillo, S. Groundwater Dynamics in a Hydrologically-Modified Alpine Watershed from an Ancient Managed Recharge System (Sierra Nevada National Park, Southern Spain): Insights from Hydrogeochemical and Isotopic Information. Sci. Total Environ. 2018, 640–641, 874–893. [Google Scholar] [CrossRef]
  43. Konz, M.; Seibert, J. On the Value of Glacier Mass Balances for Hydrological Model Calibration. J. Hydrol. 2010, 385, 238–246. [Google Scholar] [CrossRef]
  44. Merz, R.; Blöschl, G. Regionalisation of Catchment Model Parameters. J. Hydrol. 2004, 287, 95–123. [Google Scholar] [CrossRef]
  45. Staudinger, M.; Stoelzle, M.; Seeger, S.; Seibert, J.; Weiler, M.; Stahl, K. Catchment Water Storage Variation with Elevation. Hydrol. Process. 2017, 31, 2000–2015. [Google Scholar] [CrossRef]
  46. Nelson, D.B.; Basler, D.; Kahmen, A. Precipitation Isotope Time Series Predictions from Machine Learning Applied in Europe. Proc. Natl. Acad. Sci. USA 2021, 118, e2024107118. [Google Scholar] [CrossRef] [PubMed]
  47. Richter, D.; Goeppert, N.; Goldscheider, N. New Insights into Particle Transport in Karst Conduits Using Comparative Tracer Tests with Natural Sediments and Solutes during Low-Flow and High-Flow Conditions. Hydrol. Process. 2022, 36, e14472. [Google Scholar] [CrossRef]
  48. Liñán Baena, C. Hidrología de Acuíferos Carbonatados En La Unidad Yunquera -Nieves (Málaga). Doctoral Dissertation, Universidad de Granada, Granada, Spain, 2003. [Google Scholar]
  49. Hornero-Díaz, J.E. Contribución de Las Técnicas Hidroquímicas, Isotópicas e Hidrodinámicas a La Caracterización de Acuíferos Carbonatados y Su Relación Con La Red de Flujo Superficial. Aplicación al Acuífero de Alcadozo (Cuenca Del Segura). Doctoral Dissertation, Universidad Politécnica de Cartagena, Cartagena, Spain, 2018. [Google Scholar]
  50. Yanes, J.L.; Moral, F. Relief and Climate Influence on Isotopic Composition of Atlantic-Mediterranean Karst Spring Waters (Andalusia, Southern Spain). Hydrol. Process. 2022, 36, e14669. [Google Scholar] [CrossRef]
  51. Poage, M.A.; Chamberlain, C.P. Empirical Relationships between Elevation and the Stable Isotope Composition of Precipitation and Surface Waters: Considerations for Studies of Paleoelevation Change. Am. J. Sci. 2001, 301, 1–15. [Google Scholar] [CrossRef]
  52. Cruz-Sanjulián, J.; Araguas, L.; Rozanski, K.; Benavente, J.; Cardenal, J.; Hidalgo, M.C.; García-Lopez, S.; Martínez-Garrido, J.C.; Moral, F.; Olías, M. Sources of Precipitation over South-Eastern Spain and Groundwater Recharge. An Isotopic Study. Tellus B 1992, 44, 226–236. [Google Scholar] [CrossRef]
  53. Vallejos, A.; Díaz-Puga, M.A.; Sola, F.; Daniele, L.; Pulido-Bosch, A. Using Ion and Isotope Characterization to Delimitate a Hydrogeological Macrosystem. Sierra de Gádor (SE, Spain). J. Geochem. Explor. 2015, 155, 14–25. [Google Scholar] [CrossRef]
  54. Díaz-Teijeiro, M.F.; Rodríguez-Arévalo, J.; Castaño, S. La Red Española de Vigilancia de Isótopos En La Precipitación (REVIP): Distribución Isotópica Espacial y Aportación al Conocimiento Del Ciclo Hidrológico. Ing. Civ. 2009, 155, 87–97. [Google Scholar]
  55. González-Ramón, A.; Cortés Cortés, M.; López Ramón, I.; Carra Vélez, R.; Ávila Alba, J.B.; Santaella Alba, A.; Rodríguez Saez, D. Evolución Del Relieve y Espeleogénesis. Las Cavidades Del Nacimiento Del Río Guardal, Sierra Seca (Granada); Proceedings Espeleo Meeting Ciudad de Villacarrillo, Caving Congress, 39-44. Grupo de Espeleología de Villacarrillo, 2016; pp. 13–15. Available online: https://www.researchgate.net/profile/Jose-Antonio-Lopez-Saez/publication/330135425_Registro_paleoambiental_del_Pleistoceno_superior_a_partir_del_relleno_sedimentario_de_la_Cueva_del_Cucu_Almeria_SE_de_Espana/links/5c2f43aa458515a4c70b03bd/Registro-paleoambiental-del-Pleistoceno-superior-a-partir-del-relleno-sedimentario-de-la-Cueva-del-Cucu-Almeria-SE-de-Espana.pdf#page=186 (accessed on 27 September 2024).
  56. Schoenemann, S.W.; Schauer, A.J.; Steig, E.J. Measurement of SLAP2 and GISP δ17O and Proposed VSMOW-SLAP Normalization for δ17O and 17Oexcess. Rapid Commun. Mass Spectrom. 2013, 27, 582–590. [Google Scholar] [CrossRef]
  57. Angert, A.; Cappa, C.D.; DePaolo, D.J. Kinetic 17O Effects in the Hydrologic Cycle: Indirect Evidence and Implications. Geochim. Cosmochim. Acta 2004, 68, 3487–3495. [Google Scholar] [CrossRef]
  58. Pešić, V.; Paunović, M.; Kostianoy, A.G. The Rivers of Montenegro; Springer International Publishing: Cham, Switzerland, 2020; Volume 93, ISBN 978-3-030-55711-9. [Google Scholar]
  59. Commission Directive 2014/80/UE of 20 June 2014 Amending Annex II to Directive 2006/118/EC of the European Parliament and of the Council on the Protection of Groundwater against Pollution and Deterioration. Off. J. Eur. Union L 182/52. 2014. Available online: https://eur-lex.europa.eu/eli/dir/2014/80/oj (accessed on 27 September 2024).
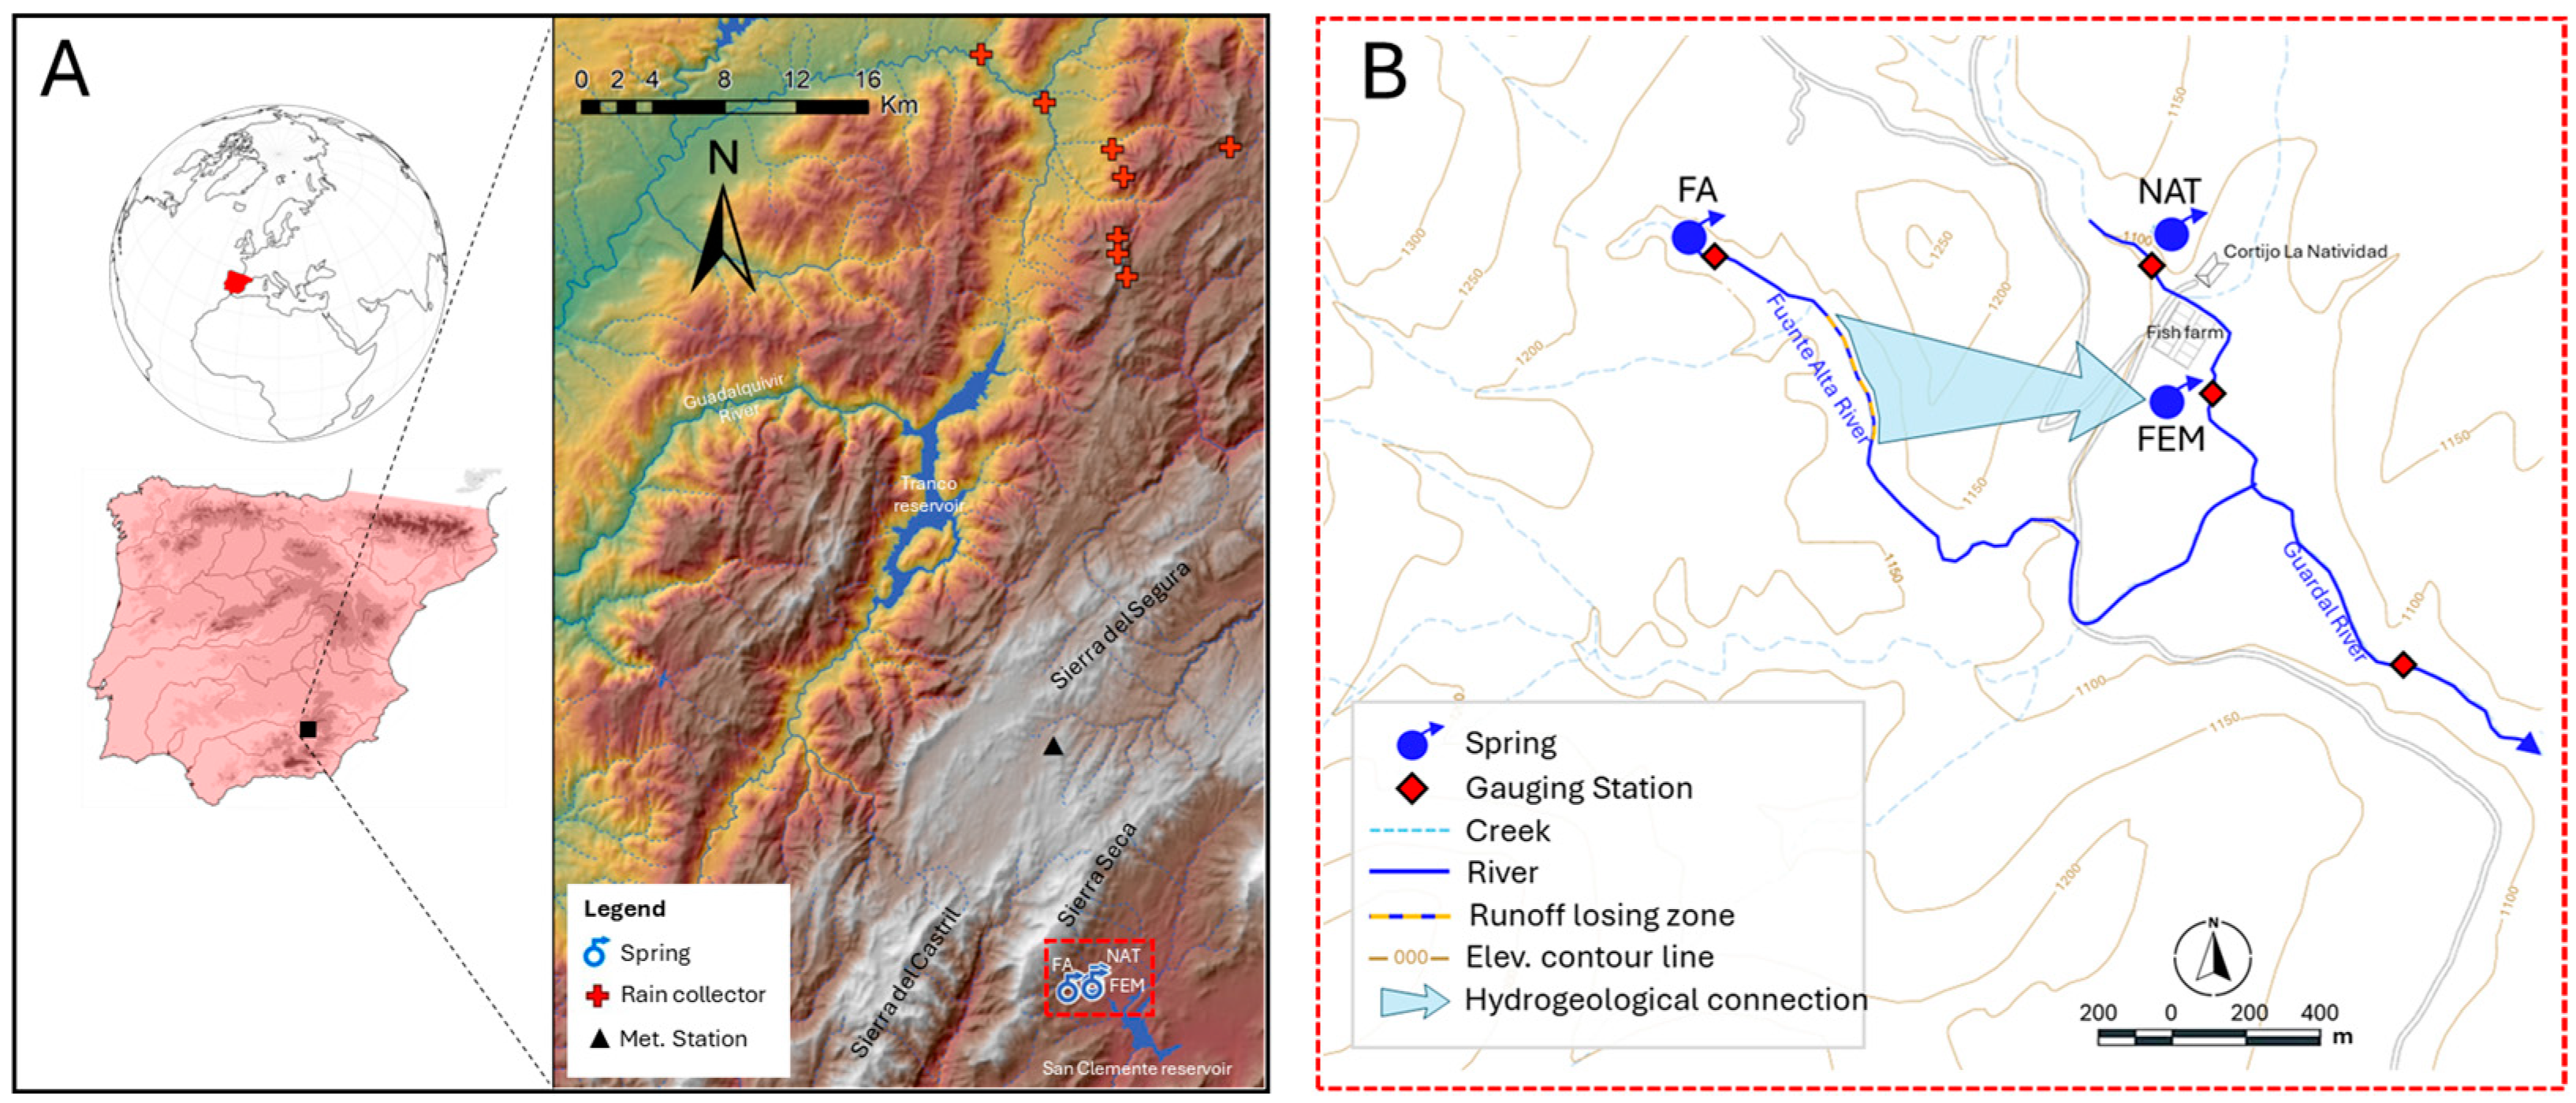
Figure 1. (A) Geographical location of the study area within the southwestern foothills of Sierra del Segura range. The cross and the triangle symbols indicate the location of the rain samplers and the meteorological station, respectively. Digital terrain model PNOA-IGN. (B) The geographical area of the Fuentes del Guardal spring system (i.e., FA, NAT and FEM springs) is framed by the dashed red line. (B) Spatial distribution, at the local scale, of FA, FEM, and NAT (modified from González-Ramón et al. 2024 [25]).
Water 16 02768 g001
Figure 2. Mean monthly precipitation, potential evapotranspiration, and temperature at Don Domingo weather station for the period 1996–2022 and mean monthly groundwater discharge (QGW) in Fuente Alta (FA), Natividad (NAT) and Fuente de Enmedio (FEM) springs for the period 2019–2022.
Water 16 02768 g002
Figure 3. (A) Geological map of Sierra Seca range modified base from GEODE-IGME. The dotted white lines mark the position of the two geological transects shown in the other two insets of this figure. The sinkholes α, β and ε correspond to the tracer injection points of the tracer tests conducted in FA, NAT, and FEM, respectively. (B) Geological cross section A1-A2. (C) Geological cross section B1-B2-B3.
Water 16 02768 g003
Figure 4. Tracer injection in the tracer tests conducted in Sierra Seca. (A) Eeosin in FA hydrogeological basin. (B) Uranine in NAT hydrogeological basin. (C) Uranine in the riverbed of FA River.
Water 16 02768 g004
Figure 5. Hydrographs of FA, NAT, and FEM springs and precipitation for the period October 2021–October 2022.
Water 16 02768 g005
Figure 6. Seasonal mean isotopic content of precipitation and mean isotopic content of groundwater discharge in FA, NAT, and FEM. WMMWL and GMLW indicate West Mediterranean Meteoric Water Line (d-ex = 13.7‰) and Global Meteoric Water Line (d-ex = 10‰), respectively. The two-sided error bars indicate one standard deviation.
Water 16 02768 g006
Figure 7. Relationship between elevation and both isotopic content in precipitation (solid symbols) and groundwater (empty symbols). The two-sided error bars indicate one standard deviation. The dotted line is the IAL of precipitation. (A) δ 18 O . (B) δ 2 H . (C) d-ex. In every case, it includes the obtained vertical gradient of the isotopic content of precipitation.
Water 16 02768 g007
Figure 8. Observed (circles) and calibrated (continuous and dashed lines) breakthrough curves for the tracer tests conducted in Sierra Seca. In all cases, a two-flow path model is used. C1 and C2 correspond to the breakthrough curves associated with each flow path, while C1 + C2 corresponds to the total breakthrough curve measured at the monitored groundwater source. (A) Tracer test 1, (B) Tracer test 2, (C) Tracer test 3.
Water 16 02768 g008
Figure 9. Measured against simulated isotope content evolution in FA (left) and NAT (right) springs.
Water 16 02768 g009
Figure 10. Hydrogeological scheme of the study area, administrative basin boundary, and proposed hydrogeological divide based on the results obtained in this work.
Water 16 02768 g010
Table 1. Characteristics of the tracing tests.
Tracer TestInjection Point Lithology aInjected TracerInjected Mass (g)Tracer Outflow PointTracer Test Distance b L (km) Q G W ¯ F A c
(m3/s)
1LCEosine1500FA6.073.698
2UCUranine2500NAT7.450.883
3UCUranine200FEM0.840.013
Notes: a Lower Cretaceous (LC); Upper Cretaceous (UC); b Distance between the tracer injection and tracer outflow points; c Mean groundwater discharge flow rate between the tracer injection and the first tracer arrival times.
Table 2. Recharge elevation ( Z R ) for FA, NAT, and FEM, vertical gradient of the isotopic content of recharge ( Z δ R ) for the five cases considered to estimate the mean isotopic content of recharge from that of precipitation (A1 to A5).
Z R (m a.s.l.)Isotopic Content Vertical Gradient in Recharge
CaseFANATFEM Z δ 18 O R (‰/km) Z δ 2 H R (‰/km) Z d - e x R (‰/km)
A1171016981650−2.9−19.54.0
A2170816961648−2.9−19.14.4
A3167316621617−3.1−20.64.3
A4162616161578−3.7−25.24.1
A5158915801548−4.4−31.44.0
ξ ¯  a166116501608−3.4−23.24.2
σ ξ  b5351450.75.20.2
Δ ξ ¯ M a x (%) c7.16.96.261.010.051.7
Notes: a Average of variable ξ for the whole ensemble values (i.e., A1 to A5); b Standard deviation of variable ξ for the whole ensemble values (i.e., A1 to A5); c Maximum variation of variable ξ with respect ξ ¯ A 1 , obtained as ξ ¯ M a x = m a x ξ A i ξ ¯ A 1 ξ ¯ A 1 ;   i   1,5 .
Table 3. Calibrated parameters of the solute transport equation for the different breakthrough measured in the different tracer test conducted in Sierra Seca.
Pe (-) τ K F (d)
Trace Test t F A  a (Days) R e f f  b (m)Mass Recovery (%)Flow Path 1Flow Path 2AverageFlow Path 1Flow
Path 2
Average
10.5830.726.11000105050.8091.2001.005
23.2833.64.422.221.722.011.11021.88316.500
314.5620.3375.437.030.338.724.27138.18731.230
Notes: a Time first tracer arrival since tracer injection; b Karst gallery effective radio assuming a cylindrical shape R e f f = Q G W ¯ F A π τ F A L .
Disclaimer/Publisher’s Note: The statements, opinions and data contained in all publications are solely those of the individual author(s) and contributor(s) and not of MDPI and/or the editor(s). MDPI and/or the editor(s) disclaim responsibility for any injury to people or property resulting from any ideas, methods, instructions or products referred to in the content.