Abstract
In this study, urban wastewater was treated by flocculation, ozone pre-oxidation and denitrification for efficient purification. Polymeric aluminum chloride (PAC) and polymeric aluminum ferric sulfate (PAFS) were added to the wastewater at different levels to remove the COD, turbidity, TP and TN of the wastewater. A better flocculant was selected and its optimum ozone pre-oxidation concentration was determined by changing the ozone concentration and measuring the effluent quality. Denitrification was further enhanced by varying the C/N ratio of the wastewater. The results show that, with the increase in flocculant dosage, the removal rates of COD, turbidity, TP and TN by PAC and PAFS were improved. The purification effect of PAC was better than that of PAFS and the optimum removal of COD, turbidity, TP and TN was obtained at a dosage of 80 mg L−1 by PAC, at 55.9%, 55.6%, 90.0% and 13.3%, respectively. Ozone pre-oxidation enhanced the removal of COD, turbidity and TN by PAC, and the optimal ozone dosage was 1.2 mg L−1, which resulted in 64.8%, 57.1% and 24.8% removal of COD, turbidity and TN, respectively. With the increase in the C/N ratio from 2.0 to 4.0, the NO3−-N concentration of PAC-treated water gradually decreased, but when the C/N ratio was 4.0, the COD concentration increased, so the optimal C/N ratio should be 3.5. Overall, the combination of ozone pre-oxidation, denitrification and flocculation was an effective method to treat urban wastewater, which has a strong application prospect.
1. Introduction
The total annual output of urban wastewater in China is approximately 62 billion cubic meters, and this value shows an upward trend year by year [1]. The amount of wastewater discharged in 2022 had a significant increase of about 23% compared to the previous five years [2]. Moreover, the pollutants in urban wastewater are complicated, including various substances such as COD, nitrogen, phosphorus, etc. [3,4]. The release of substantial amounts of urban wastewater results in serious consequences, like eutrophication of water bodies and disruption of ecological balance [5]. Many methods have been tried for treating urban wastewater.
Commonly used methods for urban wastewater treatment include flocculation, activated sludge, membrane filtration, adsorption and advanced oxidation [6,7,8,9,10]. However, the activated sludge method has a large footprint, low volumetric loading, poor shock load resistance and a large amount of residual sludge [11]. Filtration suffers from clogging of the filter membrane [7]. Adsorbents are difficult to recycle. Advanced oxidation is costly and produces secondary pollution [8]. Flocculation is a chemical process that uses a flocculant to neutralize charged particles, thereby overcoming electrostatic repulsion; then, the particles and dissolved substances in wastewater are flocculated or precipitated through particle bridging [12]. Flocculation is widely used due to its simplicity, low cost and high efficiency [13]. Specifically speaking, the advantages of coagulation mainly include the following: (1) coagulation technology has high treatment efficiency, which can effectively reduce turbidity and improve water transparency [14]; (2) coagulation technology occupies a small area, as the system occupies about half of the conventional process or even less [15]; (3) coagulation technology has short hydraulic retention time and fast settling speed [16]; (4) coagulation technology does not produce secondary pollution in the treatment process, protecting the environment [17]; (5) coagulation technology daily maintenance is simple, with a short construction cycle; (6) coagulation technology has a strong resistance to shock loads and adapts to various working conditions. The type of flocculant has a decisive influence on treatment effect. Organic polymer flocculants [18] include polyacrylic amide, alginic acid, farina and β-2-amino-2-deoxy-D-glucose, etc., and inorganic salt flocculants include aluminum salts, iron salts and polymers, such as PAC, PAFS, FeCl3, AlCl3, etc. [19,20,21]. Among them, PAC is an inorganic polymer with fast settling performance and strong adaptability, and PAFS is composed of polymers with strong bridging and adsorption ability [22]. Thus, PAC and PAFS are proposed to be selected as flocculants in this study. Although increasing the flocculant dosage can substantially improve the flocculation efficiency, due to the large amount of Al or Fe contained in PAC and PAFS [23], excessive Al can damage human bones and increase the risk of Alzheimer’s disease [24], and excessive Fe residue can increase the color of the effluent and corrode the pipeline and equipment [22]. Therefore, the dosage of PAC and PAFS must be strictly controlled within a reasonable range, and the determination of the optimal dosage is crucial.
In addition to controlling the dosage of flocculant, incorporating pre-oxidation facilities before flocculation and microbial nitrogen removal facilities after flocculation are two effective approaches. Pre-oxidation of wastewater with oxidizing agents such as ozone, KMnO4, HClO, etc., can significantly reduce the content of COD and other pollutants in wastewater [25]. Among them, ozone is a potential pre-oxidizer due to its high oxidizing capacity and its own easy degradation [24]. The C/N ratio affects the efficiency of denitrification, as previous wastewater treatments generally have the disadvantage of insufficient carbon source and a low C/N ratio, which directly leads to a low rate of denitrification. It is necessary to use an additional carbon source, like CH3COONa, as an electron donor for denitrification [26,27]. This study proposed to add ozone pre-oxidation before flocculation and denitrification after flocculation to enhance the wastewater treatment effect, while exploring the optimal dosage of flocculant and the optimal concentration of ozone.
In summary, the objective of this study is to treat urban wastewater by flocculation, combined with ozone pre-oxidation and denitrification, and finally achieve the efficient purification of wastewater. In order to achieve this goal, a series of experiments were conducted: (1) investigate the flocculation removal effect of PAC and PAFS on turbidity, COD, TN and TP in urban wastewater, and determine the optimal dosage; (2) clarify the effectiveness of ozone pre-oxidation for the removal of turbidity, COD, TN and TP from wastewater, and determine the optimal concentration of ozone; (3) explore the optimal C/N ratio for denitrification by adding CH3COONa to regulate the C/N ratio. The above results could provide a theoretical basis and scientific support for realizing the efficient purification of urban wastewater.
2. Materials and Methods
2.1. Materials and Chemical
The wastewater was the influent taken from a municipal wastewater treatment plant in Shanghai, and the initial COD, turbidity, TN and TP levels were of 14.5 mg L−1, 4.5 mg L−1, 10.2 mg L−1 and 0.21 mg L−1, respectively, and the pH was 7.49. Two flocculants, PAC and PAFS, and the CH3COONa, which was used to regulate the C/N ratio, were purchased from Sinopharm Chemical Reagent Co. in Shanghai of China, and the ozone was prepared by an ozone generator.
2.2. Flocculation, Ozone Pre-Oxidation and Denitrification Experiments
Flocculation experiments were carried out using a six flocculation stirrer, which could stir six samples at the same time at the same stirring speed. PAC and PAFS were added to the wastewater according to the dosages of 0 mg L−1, 20 mg L−1, 40 mg L−1, 60 mg L−1, 80 mg L−1, 120 mg L−1 and 160 mg L−1 and stirred at a rate of 20 rpm for 15 min. Then, the upper layer of water samples was taken after 30 min of rest. The pH meter and turbidimeter were used to determine pH and turbidity, respectively [28]. Water samples were passed through a 0.45 μm filter membrane. The COD, TN and TP levels were determined by K2Cr2O7 oxidation, K2S2O8 oxidation and (NH4)2MoO4 spectrophotometry, respectively. The removal rates of turbidity, COD, TN and TP were calculated by measured value.
Through the above experiments, it was possible to determine which flocculation effect was better, PAC or PAFS, as well as the optimal dosage. An ozone pre-oxidation experiment was carried out with this flocculant. Pre-experiment results show that 0.4 mg L−1~1.6 mg L−1 was a suitable ozone concentration range. Ozone with levels of 0.4 mg L−1, 0.8 mg L−1, 1.2 mg L−1 and 1.6 mg L−1 were introduced into the wastewater at a flow rate of 200 mL min−1 for 10 min before flocculation. In flocculation, the flocculant was added to the oxidized water at dosages of 0 mg L−1, 20 mg L−1, 40 mg L−1, 60 mg L−1, 80 mg L−1, 120 mg L−1 and 160 mg L−1. Wastewater was stirred for 15 min at a rate of 20 rpm, and then left to stand for 30 min. Upper water samples were taken and the pH, turbidity, COD, TN and TP were determined.
The C/N ratio of wastewater was adjusted by adding different amounts of CH3COONa to the wastewater, namely 2.0, 3.0, 3.5 and 4.0, and the COD and NO3−-N of the effluent water were measured to determine the optimal C/N ratio. Figure 1 shows part of the setup during the experiment, and Figure 2 is a schematic diagram for each part of the experimental unit.
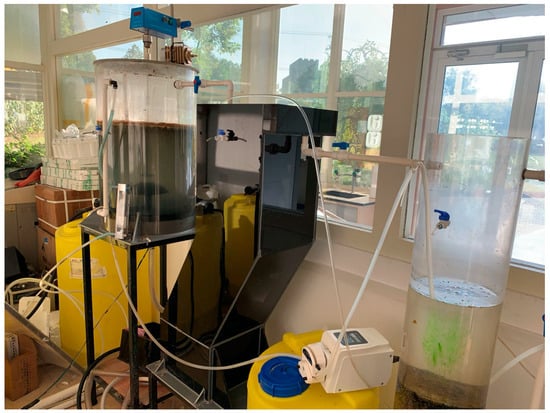
Figure 1.
Photographs of the experimental process.
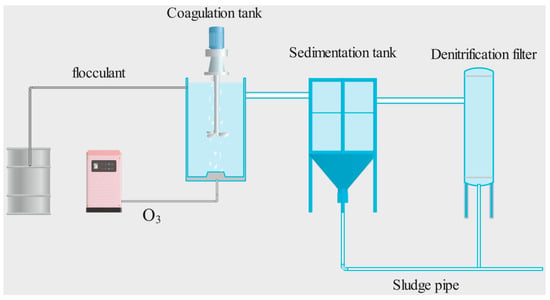
Figure 2.
Schematic diagram for each part of the experimental unit.
2.3. Statistical Analysis
The experiments were performed in triplicate to provide adequate replication for statistical analysis, and the collected data were analyzed using Origin Pro 8.5.1 software. All significant differences were reported at 0.05 probability level and all experimental data were presented as mean values ± standard deviations (n = 3).
3. Results and Discussion
3.1. Compare Two Flocculants and Explore the Optimal Dosage
As can be seen from Figure 3, the pH of the wastewater showed a decreasing trend with the increasing dosage of the two flocculants. However, the pH of PAC decreased more rapidly from the original value of 7.5 to 4.91, leading the water body to be acidic, while that of PAFS finally reduced to 6.75, and the water was still neutral. The reason for this difference was that PAC released a large amount of Al3+ and underwent hydrolysis after being added to the water [28], producing a large amount of colloidal precipitation Al(OH)3 and obtaining a large amount of H+, which led to a rapid and continuous decrease in pH. PAFS contained Fe, and the presence of Fe altered the polymer’s morphology and increased the polymer’s complexation ratio [22]. Although PAC could reduce the pH value of wastewater, the pH drop is not significant and will not have a big impact on water treatment. The removal rate of COD in wastewater increased with the increasing dosage of both flocculants (Figure 4), reaching a plateau at a dosage of 80 mg L−1. With the increase in PAC dosage, the COD concentration decreased from 14.5 mg L−1 to 6.3 mg L−1, while the PAFS treatment decreased from 14.5 mg L−1 to 7.9 mg L−1. Accordingly, the removal of COD with PAC was higher than that with PAFS, and the optimal dosage was 80 mg L−1. The outstanding flocculation behavior of PAC was attributed to the fact that it mainly used the compression bi-layer effect and adsorption electro-neutralization of the high valence polynuclear complexes produced during hydrolytic condensation [28]. When PAC was added to wastewater, a large number of positive charges would be generated to neutralize the negative charges carried on the surface of colloidal particles, reducing the electrostatic repulsion between the colloids, thus promoting the flocculation of colloids into particles and the formation of larger flocs through the adsorption, sweeping, etc., and then precipitation [29]. However, excessive dosing of PAC may lead to the re-stabilization of colloidal particles by changing their surface charge, reducing the flocculation effect [28,29]. In the case of PACS, higher removal rates were due to the sweep flocculation mechanism [30].
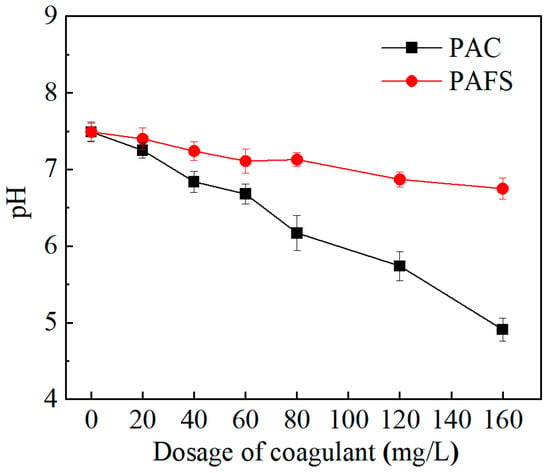
Figure 3.
Changes in pH value of effluent with increasing dosage of two flocculants.
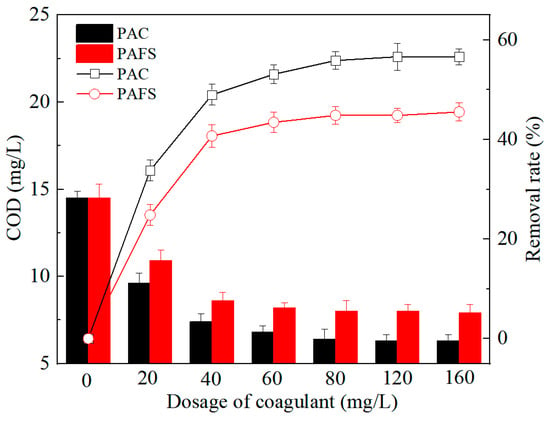
Figure 4.
Changes in COD concentration in effluent and its removal rate with increasing dosage of two flocculants.
The turbidity of the wastewater was reduced with the increasing dosage of flocculant (Figure 5). The turbidity under PAC and PAFS treatments decreased from 4.5 mg L−1 to 1.9 mg L−1, and from 4.5 mg L−1 to 2.8 mg L−1, respectively. It could be seen that the removal efficiency of PAC was higher than that of PAFS. The removal mechanism for PAC and PAFS was a combination of swept flocculation and charge neutralization. The removal was most likely due to charge neutralization after correlation analysis [20]. When the dosage was 80 mg L−1, the reduction in turbidity reached the plateau, so 80 mg L−1 was the optimal dosage.
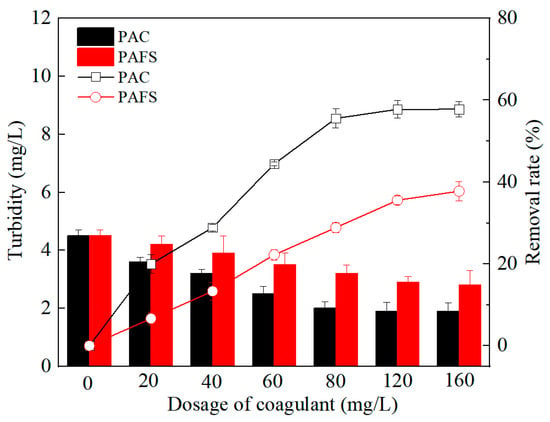
Figure 5.
Changes in turbidity in effluent and its removal rate with increasing dosage of two flocculants.
Similar situations were also observed for TN and TP. The removal rates of TP increased with the increasing dosage of both flocculants (Figure 6). PAC was better than PAFS from the beginning to the end, and the final removal rate was maintained at 32%. In the early stage, the removal rate of TP by two flocculants increased rapidly, but after 60 mg L−1, it increased slowly until reaching the plateau. Figure 7 shows the removal rates of TN with the dosage increase. It can be seen that the TN treated with PAC decreased from the initial 10.2 mg L−1 to 8.8 mg L−1, while the TN treated with PAFS decreased from 10.2 mg L−1 to 8.95 mg L−1. The TN decreased with the increase in flocculant dosage. Its removal rate increased rapidly in the early stage, then decreased slowly in the later stage and remained stable after 80 mg L−1. The removal rate under PAC treatment was always higher than that under PAFS treatment, eventually stabilized at about 2.0%. Due to the fact that phosphorus-containing ionic had a negative charge, it could easily charge neutrality with the PAC which had a positive charge, so as to make colloid off and precipitate [31].
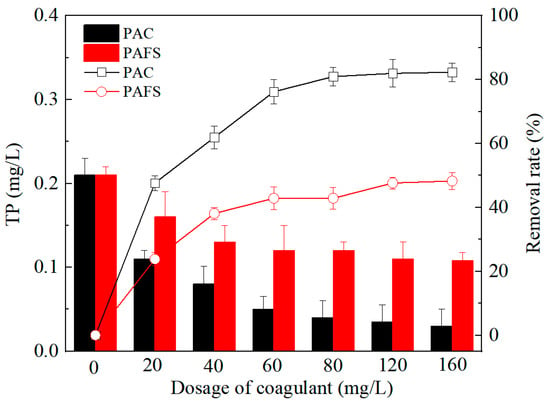
Figure 6.
Changes in total phosphorus in effluent and its removal rate with increasing dosage of two flocculants.
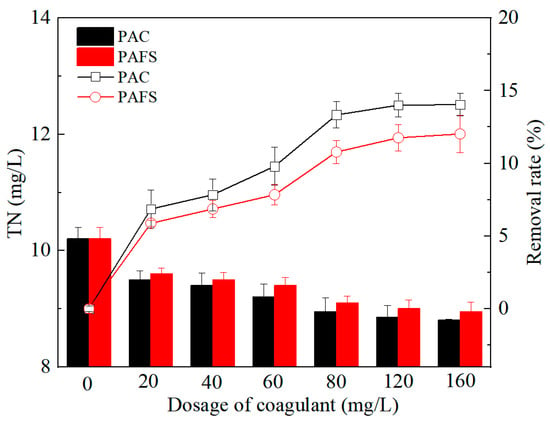
Figure 7.
Changes in total nitrogen in effluent and its removal rate with increasing dosage of two flocculants.
3.2. Enhance the Wastewater Treatment through Ozone Pre-Oxidation
The removal rates of COD after ozone pre-oxidation are shown in Figure 8. The COD concentration decreased with the increase in PAC dosage. When the ozone amount was 0.4 mg L−1, as the dosage of PAC increased from 0 to 160 mg L−1, the COD concentration decreased from 13.6 mg L−1 to 5.1 mg L−1 and the removal rate increased from 6.21% to 64.8%. At the ozone dosage of 0.8 mg L−1, the COD content decreased from 13.2 mg L−1 to 4.8 mg L−1, and its removal rate increased from 8.96% to 66.9%. For enhanced organic removal performance in the flocculation, pre-oxidation produced some hydrophobic neutral and the intermediate molecular weight dissolved organic matter at suitable ozone dosages [32]. Pre-oxidation could improve the concentration of O-containing functional groups, such as -OH and -COOH groups, which could interact and complex with flocculants to promote flocculation [33]. At the ozone dosage of 1.2 mg L−1, the COD content decreased from 12.5 mg L−1 to 4.5 mg L−1 and the removal rate increased from 13.9% to 68.9%. At the ozone dosage of 1.6 mg L−1, the COD content decreased from 12.7 mg L−1 to 4.3 mg L−1, and the removal rate increased from 12.4% to 70.3%. Organic matter usually contains C-C and C-H bonds, while ozone molecules contain O atoms in the higher energy states. When ozone comes into contact with organic matter and reacts, the ozone breaks down into free O atoms. Free O atoms have a high oxidizing capacity and are able to react with the C-C and C-H bonds in organic matter to form C-O and C-O-O bonds. These oxidation reactions result in the decomposition of organic matter. The COD removal rate increased sharply to more than 40% when PAC was set as 20 mg L−1, but when PAC was set as 80 mg L−1, the COD removal rate after 1.2 mg L−1 of ozone pre-oxidation had already reached a relatively high level. Ozone pre-oxidation increased the removal rate of COD by PAC. The TN content decreased gradually with the increase in PAC dosage (Figure 9). At an ozone concentration of 0.4 mg L−1, with the increase in PAC dosage, the TN content decreased from 9.6 mg L−1 to 8.7 mg L−1 and the removal rate increased from 5.71% to 14.3%. When the ozone concentration was of 0.8 mg L−1, the TN content decreased from 9.3 mg L−1 to 7.5 mg L−1 and the removal rate increased from 8.57% to 25.7%. At an ozone concentration of 1.2 mg L−1, the TN content decreased from 9.2 mg L−1 to 7 mg L−1 and the removal rate increased from 9.52% to 30.5%. As for 1.6 mg L−1 ozone, the TN content decreased from 8.7 mg L−1 to 6.7 mg L−1, and the removal rate increased from 14.3% to 33.3%. It could be seen that the 0.4 mg L−1 ozone concentration had little effect on TN removal, 1.2 mg L−1 could achieve a better TN removal rate and 1.6 mg L−1 of ozone was comparable to 1.2 mg L−1. Ozone pre-oxidation significantly improved the effect of PAC on TN removal. Zhao et al. [34] showed that, after ozone pre-oxidation, the reactor’s nitrogen removal performance experienced a significant decline, and it remained stable after one week with a nitrogen loading rate (NLR) of 0.60 ± 0.05 kg N/(m3·d). Zhang et al. [35] showed that, at an ozone concentration of 40 mg L−1, the concentrations of TN and NH4+-N in sludge supernatant were of 144.3 mg L−1 and 38.8 mg L−1, respectively.
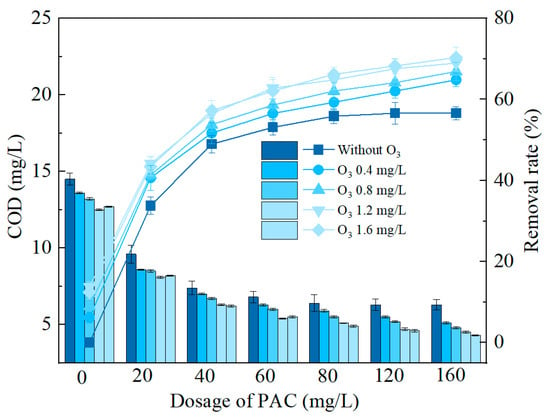
Figure 8.
Changes in COD concentration in effluent and its removal rate with increasing dosage of PAC under different O3 pre-oxidation conditions.
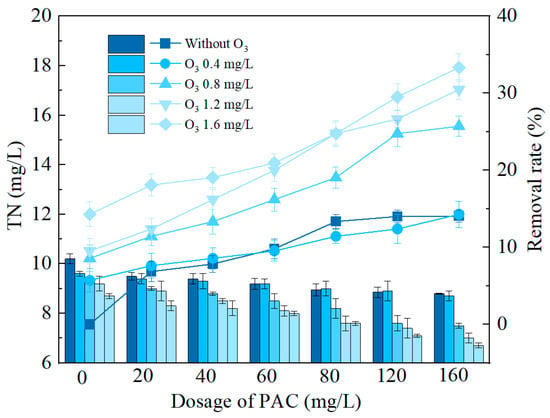
Figure 9.
Changes in total nitrogen concentration in effluent and its removal rate with increasing dosage of PAC under different O3 pre-oxidation conditions.
The content of TP decreased with the increase in PAC dosage (Figure 10). At an ozone concentration of 0.4 mg L−1, the TP content decreased from 0.2 mg L−1 to 0.11 mg L−1 as the PAC dosage increased, and the removal rate increased from 9.01% to 50%. As for 0.8 mg L−1, the TP content decreased from 0.19 mg L−1 to 0.06 mg L−1 and the removal rate increased from 13.6% to 72.7%. As for 1.2 mg L−1, the TP content decreased from 0.18 mg L−1 to 0.05 mg L−1 and the removal rate increased from 18.2% to 77.3%. As for 1.6 mg L−1, the TP content decreased from 0.15 mg L−1 to 0.05 mg L−1 and the removal rate increased from 31.8% to 77.3%. The removal of TP by PAC decreased by 32.3% when the ozone concentration was of 0.4 mg L−1. As the ozone concentration increased, the effect of PAC on TP removal increased. This was because TP was present in the secondary effluent as orthophosphate or polyphosphate in phosphate-accumulating organisms [24]. When aluminum salts were dispersed into the wastewater, PO43− reacted with Al3+ to form a precipitate which was removed from the water [36]. In the secondary effluent, residual organic compounds adsorbed to the surface of small phosphorus-containing particles, forming a coating that hindered the flocculation reaction [37]. While the polyphosphorus in cells could not react with Al3+, O3 could react with the organic compounds to lift the coating, exposing the phosphorus and improving the flocculation process [38]. In addition, O3 was a good disinfectant, which could destroy and dissolve the cell wall and release the cytoplasm [36], while the polyphosphorus in the cells was released and reacted with Al3+ [24].
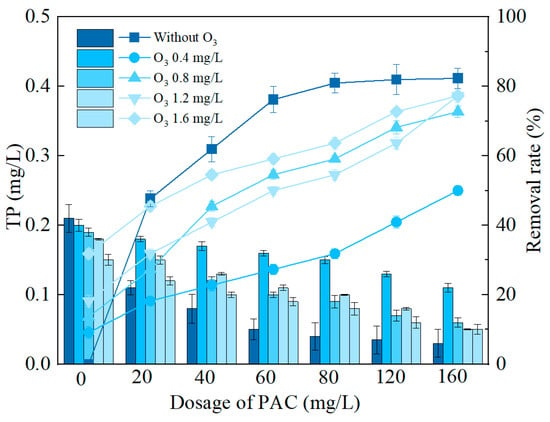
Figure 10.
Changes in total phosphorus concentration in effluent and its removal rate with increasing dosage of PAC under different O3 pre-oxidation conditions.
Turbidity decreased with the increase in ozone concentration (Figure 11). At an ozone concentration of 0.4 mg L−1, turbidity decreased from 4.1 mg L−1 to 2.6 mg L−1 with the increase in PAC dosage, and the removal rate increased from 2.38% to 38.1%. As for 0.8 mg L−1, turbidity decreased from 3.7 mg L−1 to 2.3 mg L−1 and the removal rate increased from 11.9% to 45.2%. As for 1.2 mg L−1, the turbidity content decreased from 3.2 mg L−1 to 1.6 mg L−1, and the removal rate increased from 23.8% to 61.9%. As for 1.6 mg L−1, turbidity decreased from 2.9 mg L−1 to 1.5 mg L−1 and the removal rate increased from 31.0% to 64.3%. Ozone pre-oxidation improved the turbidity removal by PAC, and the best performance of turbidity was achieved when the ozone concentration was of 1.2 mg L−1. Mehrnaz et al. [39] showed that an ozone pre-oxidation process prior to flocculation with a dosage of 0.6 and 0.8 mg O3 mg−1 DOC improved the removal efficiency of DOM, and when the ozone dosage was only of 0.2 mg O3 mg−1 DOC, there was little or no subsequent flocculation process. When the ozone dosage was only of 0.2 mg O3 mg−1 DOC, it had almost no effect on the subsequent flocculation process. Mingquan Yan et al. [32] investigated the effect of ozone pre-oxidation on flocculation using FeCl3 and HPAC as flocculants, and the results showed that ozone dosage played a crucial role on the subsequent flocculation process. For FeCl3, ozone pre-oxidation could improve the removal of turbidity in the subsequent flocculation process when the ozone dosage was of 1.0 mg L−1. When PAC was used as the flocculant, ozone pre-oxidation could aggregate fine particulate matter and break up large particulate matter at the same time at a lower ozone dosage, which made the particulate pollutants easier to remove by flocculation.
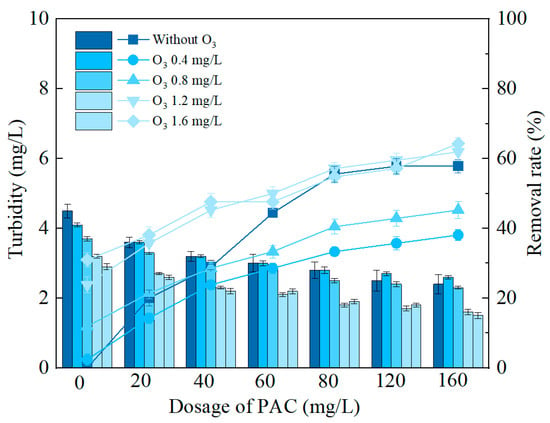
Figure 11.
Changes in turbidity in effluent and its removal rate with increasing dosage of PAC under different O3 pre-oxidation conditions.
3.3. Promote the Denitrification through Adjusting C/N Ratio
Figure 12 shows the concentration of effluent COD with time under different C/N conditions. When the C/N ratio was 4.0, the concentration of effluent COD was raised from 4.5 mg L−1 to 11.0 mg L−1. Meanwhile, in the other C/N conditions, the effluent COD concentration finally remained at a concentration similar to the initial concentration. Kargi et al. [40] showed that the removal efficiencies of COD, NH4+-N and NO3−-N were maximum at the levels of 96%, 87% and 81%, respectively. Zhu et al. [41] concluded that an increase in the C/N ratio led to an increase in the removal of TN, NO3−-N and COD, which reached a maximum when the C/N ratio was 5. The trend of NO3−-N over time under different C/N conditions is shown in Figure 13. Initial values for each group of treatments were different because the water samples were detected after one day of treatment, which suggested that the C/N ratio worked on the first day. At C/N = 2.0, the NO3−-N concentration decreased from 6.52 mg L−1 to 5.17 mg L−1. As for C/N = 3.0, the NO3−-N concentration decreased from 5.8 mg L−1 to 4.5 mg L−1. As for C/N = 3.5, the NO3−-N concentration decreased from 4.4 mg L−1 to 2.97 mg L−1. As for C/N = 4.0, the NO3−-N concentration decreased from 4.4 mg L−1 to 2.97 mg L−1. As for C/N = 4.0, the NO3−-N concentration decreased rapidly from 3.19 mg L−1 to 1.79 mg L−1. It can be seen that, with the increase in the C/N ratio, the NO3−-N removal effect became better. The most significant decrease in NO3−-N concentration was observed at a C/N ratio of 4.0. Gu et al. [42] showed that a high C/N ratio increased the nitrogen removal efficiency of the heterotrophic nitrification–aerobic denitrification process. Yang et al. [40] used pig manure hydrolysate as a carbon source, and the results showed that, when the C/N ratio was 5.5, there was a high NO3−-N concentration in the effluent, and the lack of nitrite reductase inhibited the heterotrophic denitrification process, resulting in incomplete denitrification. The C/N ratio suitable for denitrification was 6.5, which corresponded to 3.8% of the added amount. Under this condition, TN removal was up to 90%, and the performance of swine manure hydrolysate was better than that of sodium acetate. Schroeder et al. [43] reported that, when the C/N ratio was increased from 1:1 to 3:1, the TN removal rate increased from 49.0% to 72.0%, when glycerol was used as an external carbon source. The above results suggest that increasing carbon inputs could improve denitrification efficiency.
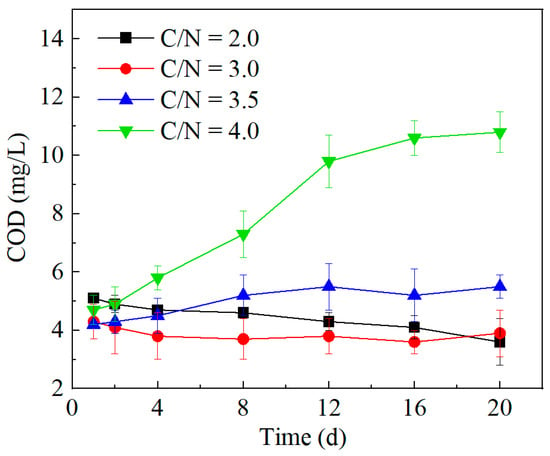
Figure 12.
Changes in COD concentration in tail water with time under different C/N ratios.
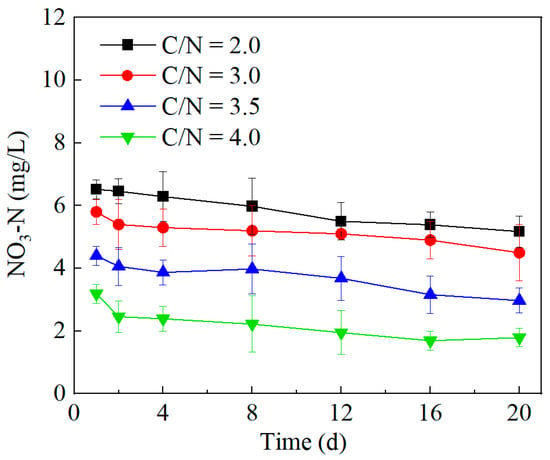
Figure 13.
Changes in NO3-N concentration in tail water with time under different C/N ratios.
3.4. Economic and Future Research Perspectives
The method to treat wastewater used in this study is less costly (Table 1). The production of 1 kg of ozone consumes 16 kilowatt–hour of electricity, electricity costs US$ 0.14 per kilowatt–hour, the ozone dosage is 2 mg L−1, so the ozone costs US$ 0.00448 per ton of water. The price of flocculant is US$ 350 per ton, the dosage is 80 mg L−1, so the cost of flocculant is US$ 0.028 per ton of water. The price of sodium acetate is US$ 280 per ton, the dosage is 80 mg L−1, so the cost of sodium acetate is US$ 0.0224 per ton of water. Considering ozone, flocculant and sodium acetate, the total cost is US$ 0.05488 per ton of water.

Table 1.
Economic cost analysis.
There are still some limitations in this study, which can be further investigated in the future: (1) PAC could reduce the pH value of wastewater; for example, when the addition of PAC is 80 mg L−1, the pH of the wastewater was reduced from the initial 7.5 to 6.0, which was weakly acidic, and the reduction in pH may affect the denitrification rate of denitrifying sludge. Future studies should explore whether the addition of coagulants can affect the growth of sludge by determination of the structure of the microbial community; (2) This study lacks the analysis of the coagulation mechanism of the coagulant, and future research can study the surface adsorption and co-precipitation of the coagulant; (3) Only one pre-oxidant ozone was used in this study. More oxidants, such as calcium hypochlorite and hydrogen peroxide, could be used in future studies.
4. Conclusions
This study treated urban wastewater by flocculation, supplemented with ozone pre-oxidation and denitrification. The results show that, with the increase in flocculant dosage, the removals of COD, turbidity, TP and TN were increased by both PAC and PAFS. PAC was more effective than PAFS in purifying the wastewater, and at the optimal concentration of 80 mg L−1, the removal rates of COD, turbidity, TP and TN were of 55.9%, 55.6%, 90.0% and 13.3%, respectively. Ozone pre-oxidation increased the removal effects under PAC flocculation, and 1.2 mg L−1 was the optimal addition of ozone, which resulted in 64.8%, 57.1% and 24.8% removal rates of COD, turbidity and TN, respectively. However, ozone pre-oxidation reduced the removal of TP from 90.0% to 54.5%. The removal rate of NO3−-N in PAC-treated water gradually increased as the C/N ratio increased from 2.0 to 4.0; however, the removal rate of COD decreased sharply when the C/N ratio was 4.0; thus, the optimal C/N ratio was 3.5. This study provides a method of urban wastewater treatment combining ozone pre-oxidation, denitrification and flocculation, which has a wide range of application prospects.
Author Contributions
Formal analysis, W.Z., N.F., Y.G., X.L. and Z.L.; Funding acquisition, N.F.; Methodology, W.Z. and N.F.; Project administration, N.F.; Writing—original draft, Y.G., F.Y. and X.L.; Writing—review and editing, F.Y. All authors have read and agreed to the published version of the manuscript.
Funding
This work was supported by Research on Biological Denitrification Technology for Low Concentration Urban Wastewater Based on Sulfur Iron Autotrophic Denitrification (No. 2023HJ(83)-004), and National Natural Science Foundation of China “Mediating effect and mechanism of algae on occurrence and aquatic toxicity of microplastics in freshwater environments” (No. 42477405).
Data Availability Statement
The datasets used and/or analyzed during the current study are available from the corresponding author upon reasonable request.
Acknowledgments
The authors extend their gratitude to Shuchun Wang from Shiyanjia Lab (www.shiyanjia.com, accessed on 10 May 2024) for providing invaluable assistance with the COD analysis.
Conflicts of Interest
Author Weiqi Zhou, Ning Fang and Yali Guo were employed by the Shanghai Investigation, Design & Research Institute Co., Ltd and YANGTZE Eco-Environment Engineering Research Center (Shanghai), China Three Gorges Corporation. The remaining authors declare that the research was conducted in the absence of any commercial or financial relationships that could be construed as a potential conflict of interest.
References
- Zhang, Y.; Wang, Z.; Hu, J.; Pu, C. Intelligent Management of Carbon Emissions of Urban Domestic Sewage Based on the Internet of Things. Environ. Res. 2024, 251, 118594. [Google Scholar] [CrossRef] [PubMed]
- Wang, Z.; Man, Y.; Hu, Y.; Li, J.; Hong, M.; Cui, P. A Deep Learning Based Dynamic COD Prediction Model for Urban Sewage. Environ. Sci. Water Res. Technol. 2019, 5, 2210–2218. [Google Scholar] [CrossRef]
- Asl, S.M.H. Porous Adsorbents Derived from Coal Fly Ash as Cost-Effective and Environmentally-Friendly Sources of Aluminosilicate for Sequestration of Aqueous and Gaseous Pollutants: A Review. J. Clean. Prod. 2019, 208, 1131–1147. [Google Scholar]
- Mushtaq, F. Possible Applications of Coal Fly Ash in Wastewater Treatment. J. Environ. Manag. 2019, 240, 27–46. [Google Scholar] [CrossRef]
- Chen, M.; Zeng, W.; Wang, G.; Lu, F.; Zhang, J.; Ding, J. Study on the Operation Effect of Constructed Wetland Project for Tailwater Treatment—An Example from a Sewage Plant in Zhejiang Province. In E3S Web of Conferences; EDP Sciences: Les Ulis, France, 2020; p. 04030. [Google Scholar]
- Shabanizadeh, H. A Sustainable Approach for Industrial Wastewater Treatment Using Pomegranate Seeds in Flocculation-Coagulation Process: Optimization of COD and Turbidity Removal by Response Surface Methodology (RSM). J. Water Process Eng. 2023, 53, 103651. [Google Scholar] [CrossRef]
- Taghavijeloudar, M. A New Approach for Modeling Flux Variation in Membrane Filtration and Experimental Verification. Water Res. 2019, 166, 115027. [Google Scholar] [CrossRef]
- Chai, W.S. A Review on Conventional and Novel Materials towards Heavy Metal Adsorption in Wastewater Treatment Application. J. Clean. Prod. 2021, 296, 126589. [Google Scholar] [CrossRef]
- Abdolalian, S. Performance Evaluation and Optimization of ZnO-PVP Nanoparticles for Photocatalytic Wastewater Treatment: Interactions between UV Light Intensity and Nanoparticles Dosage. J. Clean. Prod. 2022, 365, 132833. [Google Scholar] [CrossRef]
- Nguyen, M.K. Fenton/Ozone-Based Oxidation and Coagulation Processes for Removing Metals (Cu, Ni)-EDTA from Plating Wastewater. J. Water Process Eng. 2021, 39, 101836. [Google Scholar] [CrossRef]
- Wang, X.; Li, M.; Liu, J.; Qu, J. Occurrence, Distribution, and Potential Influencing Factors of Sewage Sludge Components Derived from Nine Full-Scale Wastewater Treatment Plants of Beijing, China. J. Environ. Sci. 2016, 45, 233–239. [Google Scholar] [CrossRef]
- Taghavijeloudar, M. The Effects of Surfactants (Sodium Dodecyl Sulfate, Triton X-100 and Cetyl Trimethyl Ammonium Bromide) on the Dewaterability of Microalgae Biomass Using Pressure Filtration. Bioresour. Technol. 2019, 273, 565–572. [Google Scholar] [CrossRef] [PubMed]
- Wang, M. Effect of Fine Structure of Chitosan-Based Flocculants on the Flocculation of Bentonite and Humic Acid: Evaluation and Modeling. Chemosphere 2021, 264, 128525. [Google Scholar] [CrossRef]
- Zhao, C. Application of Coagulation/Flocculation in Oily Wastewater Treatment: A Review. Sci. Total Environ. 2021, 765, 142795. [Google Scholar] [CrossRef] [PubMed]
- Bagastyo, A.Y. The Role of Aeration and Pre-Chlorination Prior to Coagulation-Flocculation Process in Water Treatment: A Laboratory and Field Research in Indonesia. Case Stud. Chem. Environ. Eng. 2023, 7, 100352. [Google Scholar] [CrossRef]
- Jiang, J.-Q. The Role of Coagulation in Water Treatment. Curr. Opin. Chem. Eng. 2015, 8, 36–44. [Google Scholar] [CrossRef]
- Abujazar, M.S.S. Recent Advancement in the Application of Hybrid Coagulants in Coagulation-Flocculation of Wastewater: A Review. J. Clean. Prod. 2022, 345, 131133. [Google Scholar] [CrossRef]
- Coleman, C.K.; Mai, E.; Miller, M.; Sharma, S.; Williamson, C.; Oza, H.; Holmes, E.; Lamer, M.; Ly, C.; Stewart, J.; et al. Chitosan Coagulation Pretreatment to Enhance Ceramic Water Filtration for Household Water Treatment. Int. J. Mol. Sci. 2021, 22, 9736. [Google Scholar] [CrossRef]
- Zhang, M.; Cai, Z.; Xie, L.; Zhang, Y.; Tang, L.; Zhou, Q.; Qiang, Z.; Zhang, H.; Zhang, D.; Pan, X. Comparison of Coagulative Colloidal Microbubbles with Monomeric and Polymeric Inorganic Coagulants for Tertiary Treatment of Distillery Wastewater. Sci. Total Environ. 2019, 694, 133649. [Google Scholar] [CrossRef]
- Rajala, K.; Grönfors, O.; Hesampour, M.; Mikola, A. Removal of Microplastics from Secondary Wastewater Treatment Plant Effluent by Coagulation/Flocculation with Iron, Aluminum and Polyamine-Based Chemicals. Water Res. 2020, 183, 116045. [Google Scholar] [CrossRef]
- Zhu, G.; Zheng, H.; Chen, W.; Fan, W.; Zhang, P.; Tshukudu, T. Preparation of a Composite Coagulant: Polymeric Aluminum Ferric Sulfate (PAFS) for Wastewater Treatment. Desalination 2012, 285, 315–323. [Google Scholar] [CrossRef]
- Zhu, G.; Zheng, H.; Zhang, Z.; Tshukudu, T.; Zhang, P.; Xiang, X. Characterization and Coagulation–FLocculation Behavior of Polymeric Aluminum Ferric Sulfate (PAFS). Chem. Eng. J. 2011, 178, 50–59. [Google Scholar] [CrossRef]
- Keeley, J.; Jarvis, P.; Judd, S.J. Coagulant Recovery from Water Treatment Residuals: A Review of Applicable Technologies. Crit. Rev. Environ. Sci. Technol. 2014, 44, 2675–2719. [Google Scholar] [CrossRef] [PubMed]
- Cheng, L.H. Effect of Ozone Enhanced Flocculation on the Treatment of Secondary Effluent. Procedia Environ. Sci. 2011, 10, 555–560. [Google Scholar] [CrossRef][Green Version]
- Khajvand, M.; Drogui, P.; Arab, H.; Tyagi, R.D.; Brien, E. Hybrid Process Combining Ultrafiltration and Electro-Oxidation for COD and Nonylphenol Ethoxylate Removal from Industrial Laundry Wastewater. Chemosphere 2024, 363, 142931. [Google Scholar] [CrossRef]
- Zhao, B.; Sun, Z.; Liu, Y. An Overview of In-Situ Remediation for Nitrate in Groundwater. Sci. Total Environ. 2022, 804, 149981. [Google Scholar] [CrossRef]
- Shi, Y.; Liu, T.; Yu, H.; Quan, X. Enhancing Anoxic Denitrification of Low C/N Ratio Wastewater with Novel ZVI Composite Carriers. J. Environ. Sci. 2022, 112, 180–191. [Google Scholar] [CrossRef]
- Sudoh, R.; Islam, M.d.S.; Sazawa, K.; Okazaki, T.; Hata, N.; Taguchi, S.; Kuramitz, H. Removal of Dissolved Humic Acid from Water by Coagulation Method Using Polyaluminum Chloride (PAC) with Calcium Carbonate as Neutralizer and Coagulant Aid. J. Environ. Chem. Eng. 2015, 3, 770–774. [Google Scholar] [CrossRef]
- Ren, X.; Song, K.; Xiao, Y.; Zong, S.; Liu, D. Effective Treatment of Spacer Tube Reverse Osmosis Membrane Concentrated Leachate from an Incineration Power Plant Using Coagulation Coupled with Electrochemical Treatment Processes. Chemosphere 2020, 244, 125479. [Google Scholar] [CrossRef]
- Sadri Moghaddam, S.; Alavi Moghaddam, M.R.; Arami, M. Response Surface Optimization of Acid Red 119 Dye from Simulated Wastewater Using Al Based Waterworks Sludge and Polyaluminium Chloride as Coagulant. J. Environ. Manag. 2011, 92, 1284–1291. [Google Scholar] [CrossRef]
- Li, K.; Xu, H.; Gu, C. The Depth of Phosphorus Removal by Three Coagulations. Adv. Mater. Res. 2012, 356, 1575–1580. [Google Scholar] [CrossRef]
- Yan, M.; Wang, D.; Shi, B.; Wang, M.; Yan, Y. Effect of Pre-Ozonation on Optimized Coagulation of a Typical North-China Source Water. Chemosphere 2007, 69, 1695–1702. [Google Scholar] [CrossRef] [PubMed]
- Jin, X. Unraveling the Over-Oxidation Inhibition Mechanism during the Hybrid Ozonation-Coagulation Process: Immediate Entrapment and Complexation between Intermediate Organic Matter and Coagulants. Water Res. 2023, 232, 119692. [Google Scholar] [CrossRef] [PubMed]
- Zhao, H.; Zou, L.; Jiang, M.; Li, Y.-Y.; Liu, J. Ozone Pretreatment Combined with Partial Denitrification-Anammox Process for Efficient Nitrogen Removal from Nanofiltration Concentrate of Landfill Leachate. Chem. Eng. J. 2023, 471, 144641. [Google Scholar] [CrossRef]
- Zhang, Q.; Li, H.; Wang, X.; Yu, Z.; Zeng, M.; Wang, C. Ozone Combined with Mechanical Agitation to Enhance Sludge Cell Lysis and Provide an Alternative Carbon Source for Nitrogen Removal of Bioreactors. J. Water Process Eng. 2024, 57, 104607. [Google Scholar] [CrossRef]
- Dytczak, M.A.; Londry, K.L.; Siegrist, H.; Oleszkiewicz, J.A. Ozonation Reduces Sludge Production and Improves Denitrification. Water Res. 2007, 41, 543–550. [Google Scholar] [CrossRef]
- Li, Y. Regulation of Hydrogen Bonding on Microbubble Flocs in the Hybrid Ozonation-Coagulation (HOC) Process Enhances Organic Matter Removal. J. Clean. Prod. 2022, 352, 131617. [Google Scholar] [CrossRef]
- Xie, P. A Mini Review of Preoxidation to Improve Coagulation. Chemosphere 2016, 155, 550–563. [Google Scholar] [CrossRef]
- Sadrnourmohamadi, M.; Gorczyca, B. Effects of Ozone as a Stand-Alone and Coagulation-Aid Treatment on the Reduction of Trihalomethanes Precursors from High DOC and Hardness Water. Water Res. 2015, 73, 171–180. [Google Scholar] [CrossRef]
- Kargi, F. Effect of Carbon Source on Biological Nutrient Removal in a Sequencing Batch Reactor. Bioresour. Technol. 2003, 89, 89–93. [Google Scholar] [CrossRef] [PubMed]
- Zhu, H.; Yan, B.; Xu, Y.; Guan, J.; Liu, S. Removal of Nitrogen and COD in Horizontal Subsurface Flow Constructed Wetlands under Different Influent C/N Ratios. Ecol. Eng. 2014, 63, 58–63. [Google Scholar] [CrossRef]
- Gu, X.; Leng, J.; Zhu, J.; Zhang, K.; Zhao, J.; Wu, P.; Xing, Q.; Tang, K.; Li, X.; Hu, B. Influence Mechanism of C/N Ratio on Heterotrophic Nitrification- Aerobic Denitrification Process. Bioresour. Technol. 2022, 343, 126116. [Google Scholar] [CrossRef] [PubMed]
- Schroeder, A.; Souza, D.H.; Fernandes, M.; Rodrigues, E.B.; Trevisan, V.; Skoronski, E. Application of Glycerol as Carbon Source for Continuous Drinking Water Denitrification Using Microorganism from Natural Biomass. J. Environ. Manag. 2020, 256, 109964. [Google Scholar] [CrossRef] [PubMed]
Disclaimer/Publisher’s Note: The statements, opinions and data contained in all publications are solely those of the individual author(s) and contributor(s) and not of MDPI and/or the editor(s). MDPI and/or the editor(s) disclaim responsibility for any injury to people or property resulting from any ideas, methods, instructions or products referred to in the content. |
© 2024 by the authors. Licensee MDPI, Basel, Switzerland. This article is an open access article distributed under the terms and conditions of the Creative Commons Attribution (CC BY) license (https://creativecommons.org/licenses/by/4.0/).