1. Introduction
As the mining activities in lower coal seams in China continue to advance, encounters with increasingly numerous and voluminous aquifers have become more frequent. This is particularly evident in the typical large-scale water-bearing coal mines of North China, such as the Donghuantuo mine, where the hydrogeological conditions are extremely complex and the maximum water influx has reached 62.84 m³/min. Since the commencement of mining operations, numerous inrush water incidents have occurred, including 32 instances with water flow exceeding 10 m³/min, with the highest single face water influx recorded at 6.01 m³/min. With the continuous deepening of coal seam mining, the threat of water hazards has further intensified.
Water inrush identification methods involve using data such as water level, water temperature, hydrogeochemical distribution, migration, and transformation characteristics in different aquifer water qualities. In the early 20th century, researchers primarily relied on experience or simple mathematical methods to determine the source of mine water inrush [
1]. Subsequently, Italian researchers discovered that monitoring information such as changes in water level and gas concentration in mining areas could provide early warning of mine water inrush [
2]. By the 1990s, scholars successfully identified the source of water inrush by comparing the water quality characteristics of mine water with those of potential source waters, establishing a solid theoretical foundation for hydrochemical identification [
3]. Building on this, some scholars have achieved significant practical effects in identifying water inrush sources by utilizing the unique hydrogeochemical properties of environmental isotopes or trace elements [
4]. In addition, the theory of geothermal gradients has been employed to use water temperature as a factor in identifying sudden water inrush, proving effective in distinguishing water inrush sources [
5]. With the development of basic theory and computer science, models for identifying water sources based on mathematical principles such as multivariate statistics and nonlinear analysis, combined with computer technology, have become widely used and have demonstrated high accuracy [
6]. These developments have greatly enriched the theoretical framework for identifying sudden water inrush in mining operations.
Traditional methods for studying inrush water, which rely on inrush water data and physical parameters, have proven effective in distinguishing relatively simple water sources. However, in cases where the water quality is complex and physical parameters are similar, or where the water quality of different inrush sources is alike, traditional methods often fail. This necessitates the use of alternative approaches for identifying inrush water sources [
7,
8,
9,
10,
11,
12,
13]. By analyzing the basic components of aquifers and the chemical composition of water samples from inrush points, suitable discriminant functions are selected, and discriminant formulas are established based on specific criteria. These formulas are then used to classify unknown samples, employing methods such as fuzzy mathematics, grey relational analysis, extension identification, geographic information systems (GIS), support vector machines, and artificial neural networks [
14,
15,
16,
17,
18,
19,
20,
21,
22,
23].
In recent years, with the rapid advancement of computer technology, neural networks have increasingly been used to identify inrush water sources in mines. Common artificial neural network models include BP neural networks, RBF neural networks, ELM, and Elman neural networks, which are valuable for accurately identifying multiple water sources in mines. Deep learning algorithms represent an evolution of artificial neural networks, with common approaches including deep neural network (DNN) analysis, convolutional neural network (CNN) analysis, and probabilistic neural network (PNN) analysis. Scholars often use these methods to determine the origin of water samples. Optimization algorithms such as genetic algorithms, ant colony algorithms, and particle swarm algorithms are frequently used for function optimization and combinatorial optimization of discriminant models [
24,
25,
26,
27,
28,
29,
30]. For example, Zhang Di applied a genetic algorithm-optimized support vector machine to identify inrush water sources, which improved the accuracy of parameter selection for support vector machines in inrush water source identification. However, this method still has drawbacks, such as tracing detection times exceeding one hour, inability to trace mixed water and its proportions, and loss of the optimal rescue window post-inrush.
This study aims to explore a new method that abandons the traditional approach of concentration testing. Instead, it focuses on the rapid and accurate identification of inrush water sources, proposing a novel method for identifying mixed inrush water sources.
2. Materials and Methods
2.1. Study Area and Water Sampling
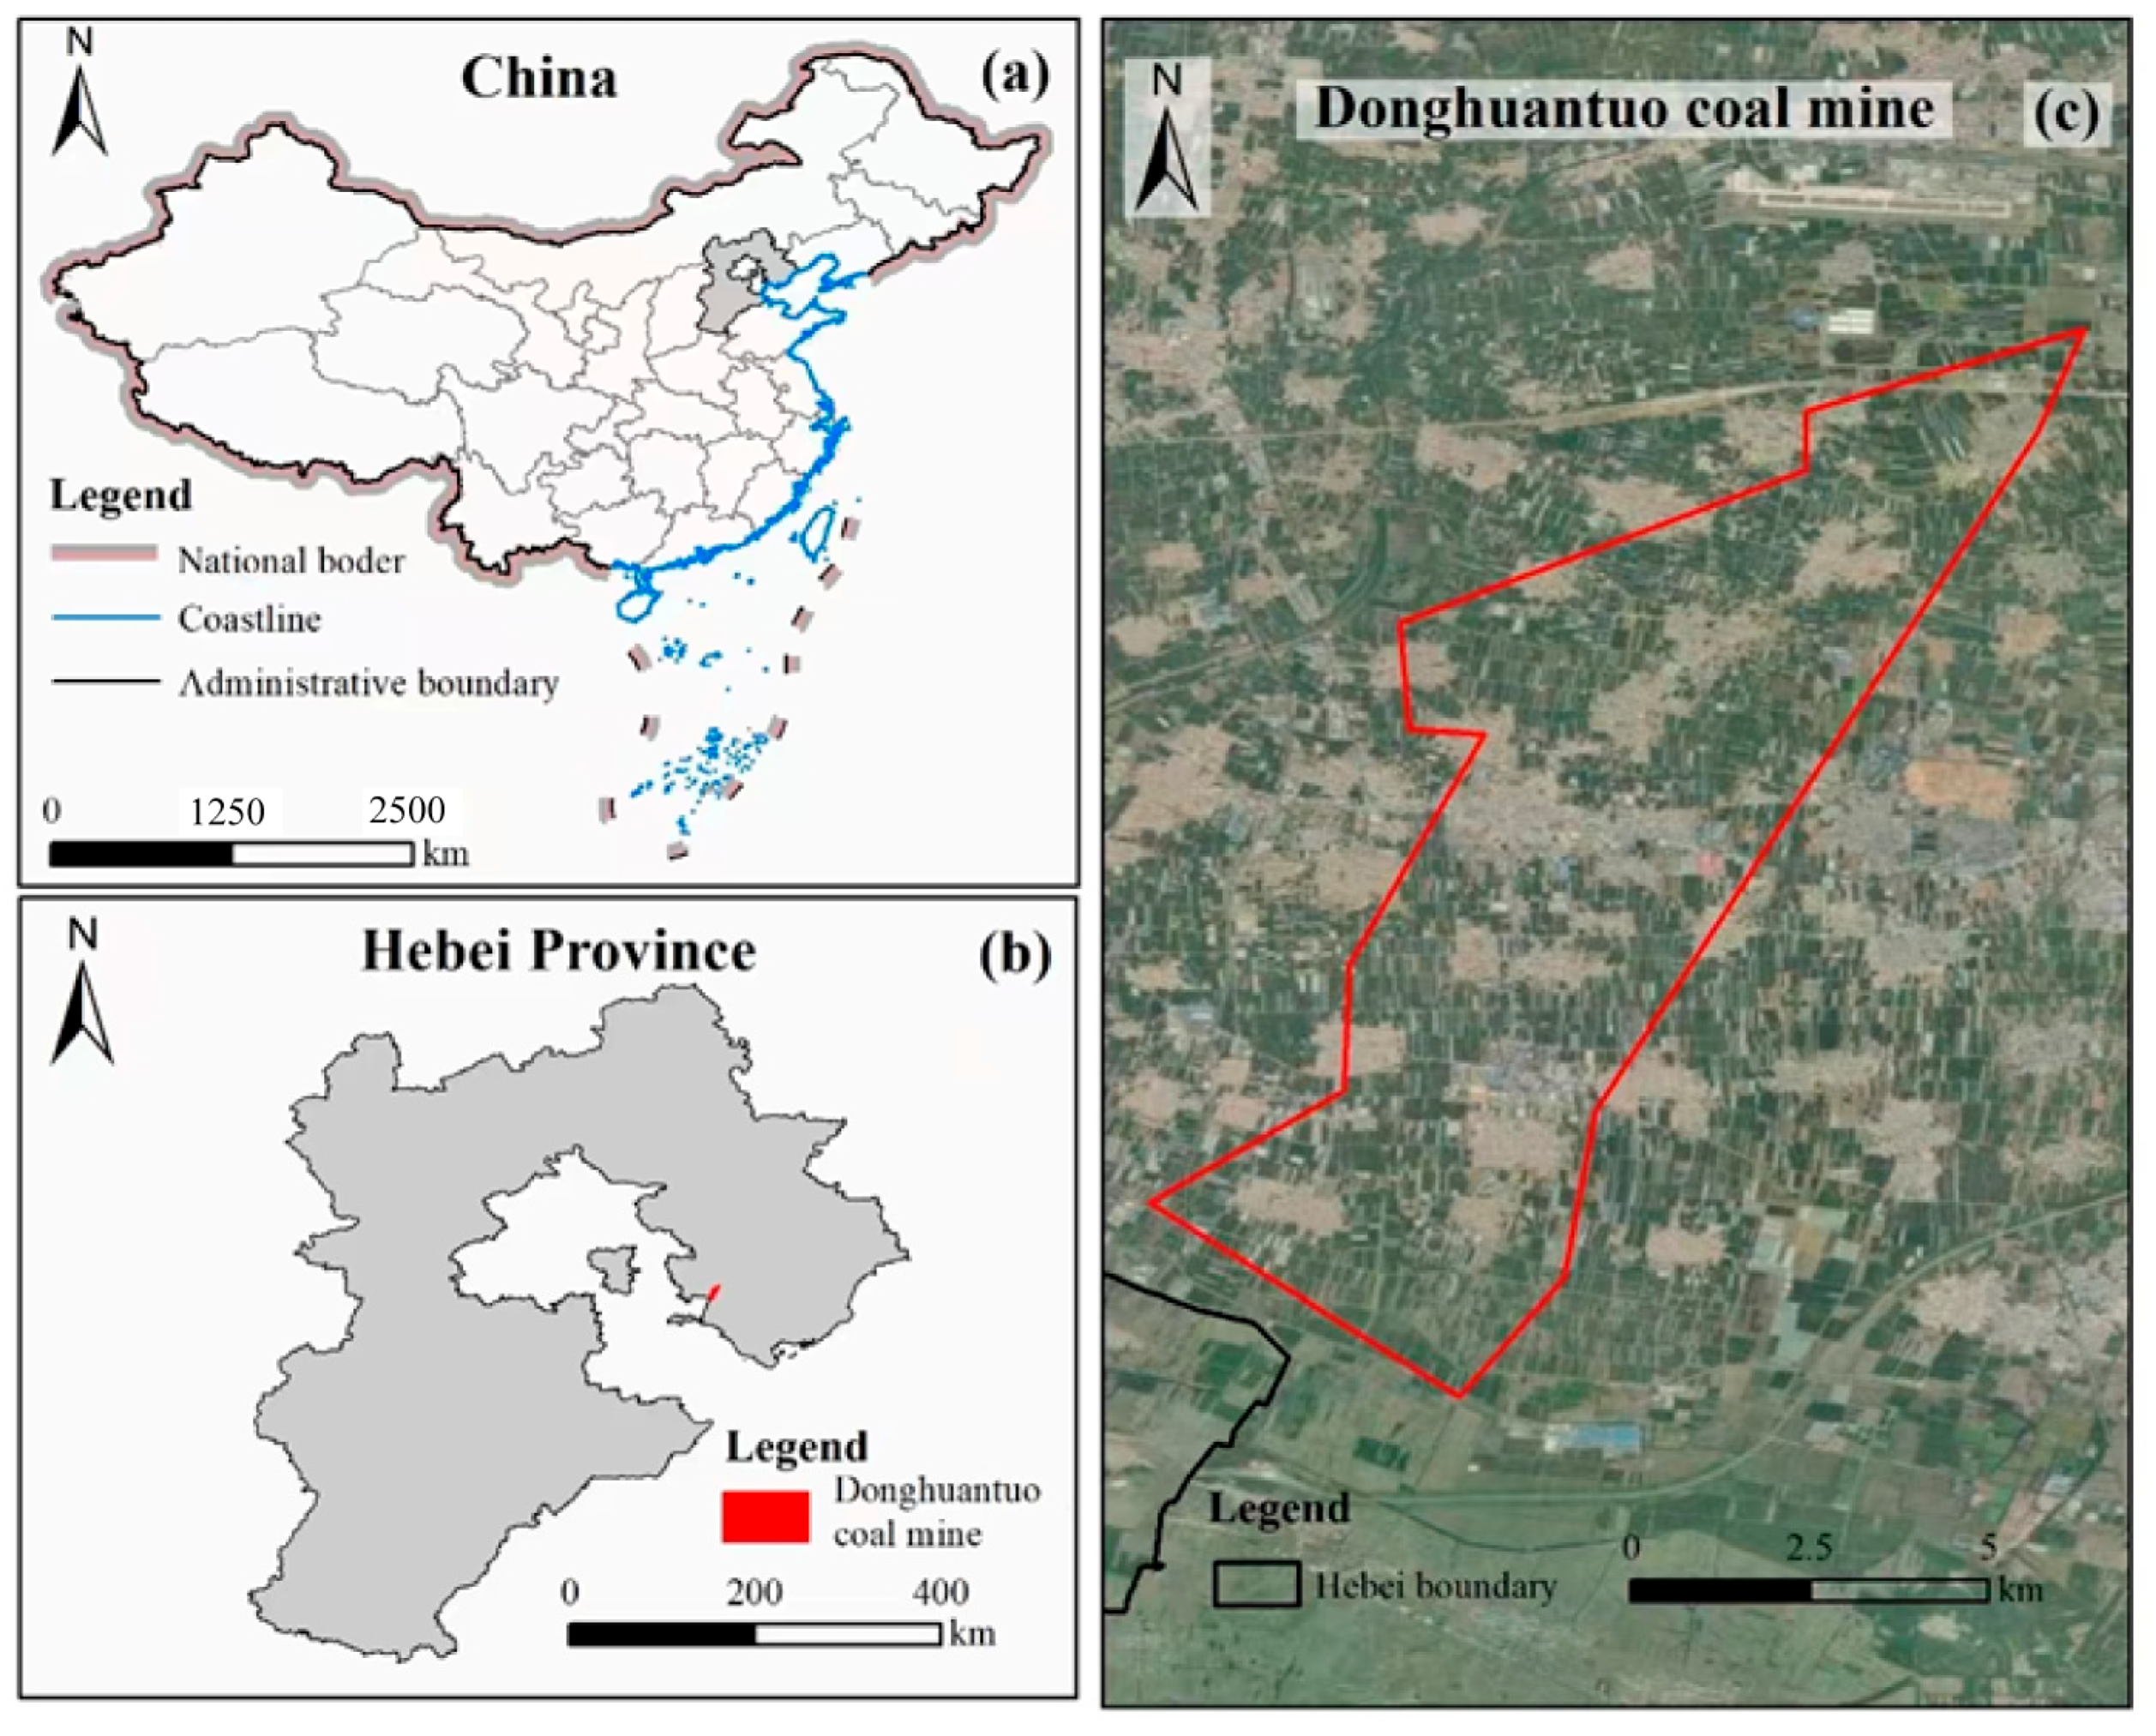
Donghuantuo mine is located in the city of Tangshan in North China’s Hebei Province. The southeast wing of the mine extends 13.5 km in strike length and 3 km in dip width, while the northwest wing stretches 8 km in strike length and 0.5 km in dip width. The mining area covers 40.5 km². The terrain within the mining boundary is quite flat, with no rivers traversing the area. Additionally, there are no surface water systems within the Donghuantuo mining boundary, as illustrated in
Figure 1.
The Donghuantuo mining field hosts multiple aquifers, including the Quaternary alluvial pore-confined aquifer, the Carboniferous–Permian sandstone fissure-confined aquifer, and the Middle Ordovician limestone karst fissure-confined aquifer. These aquifers are divided into seven aquifer groups, as shown in
Figure 2.
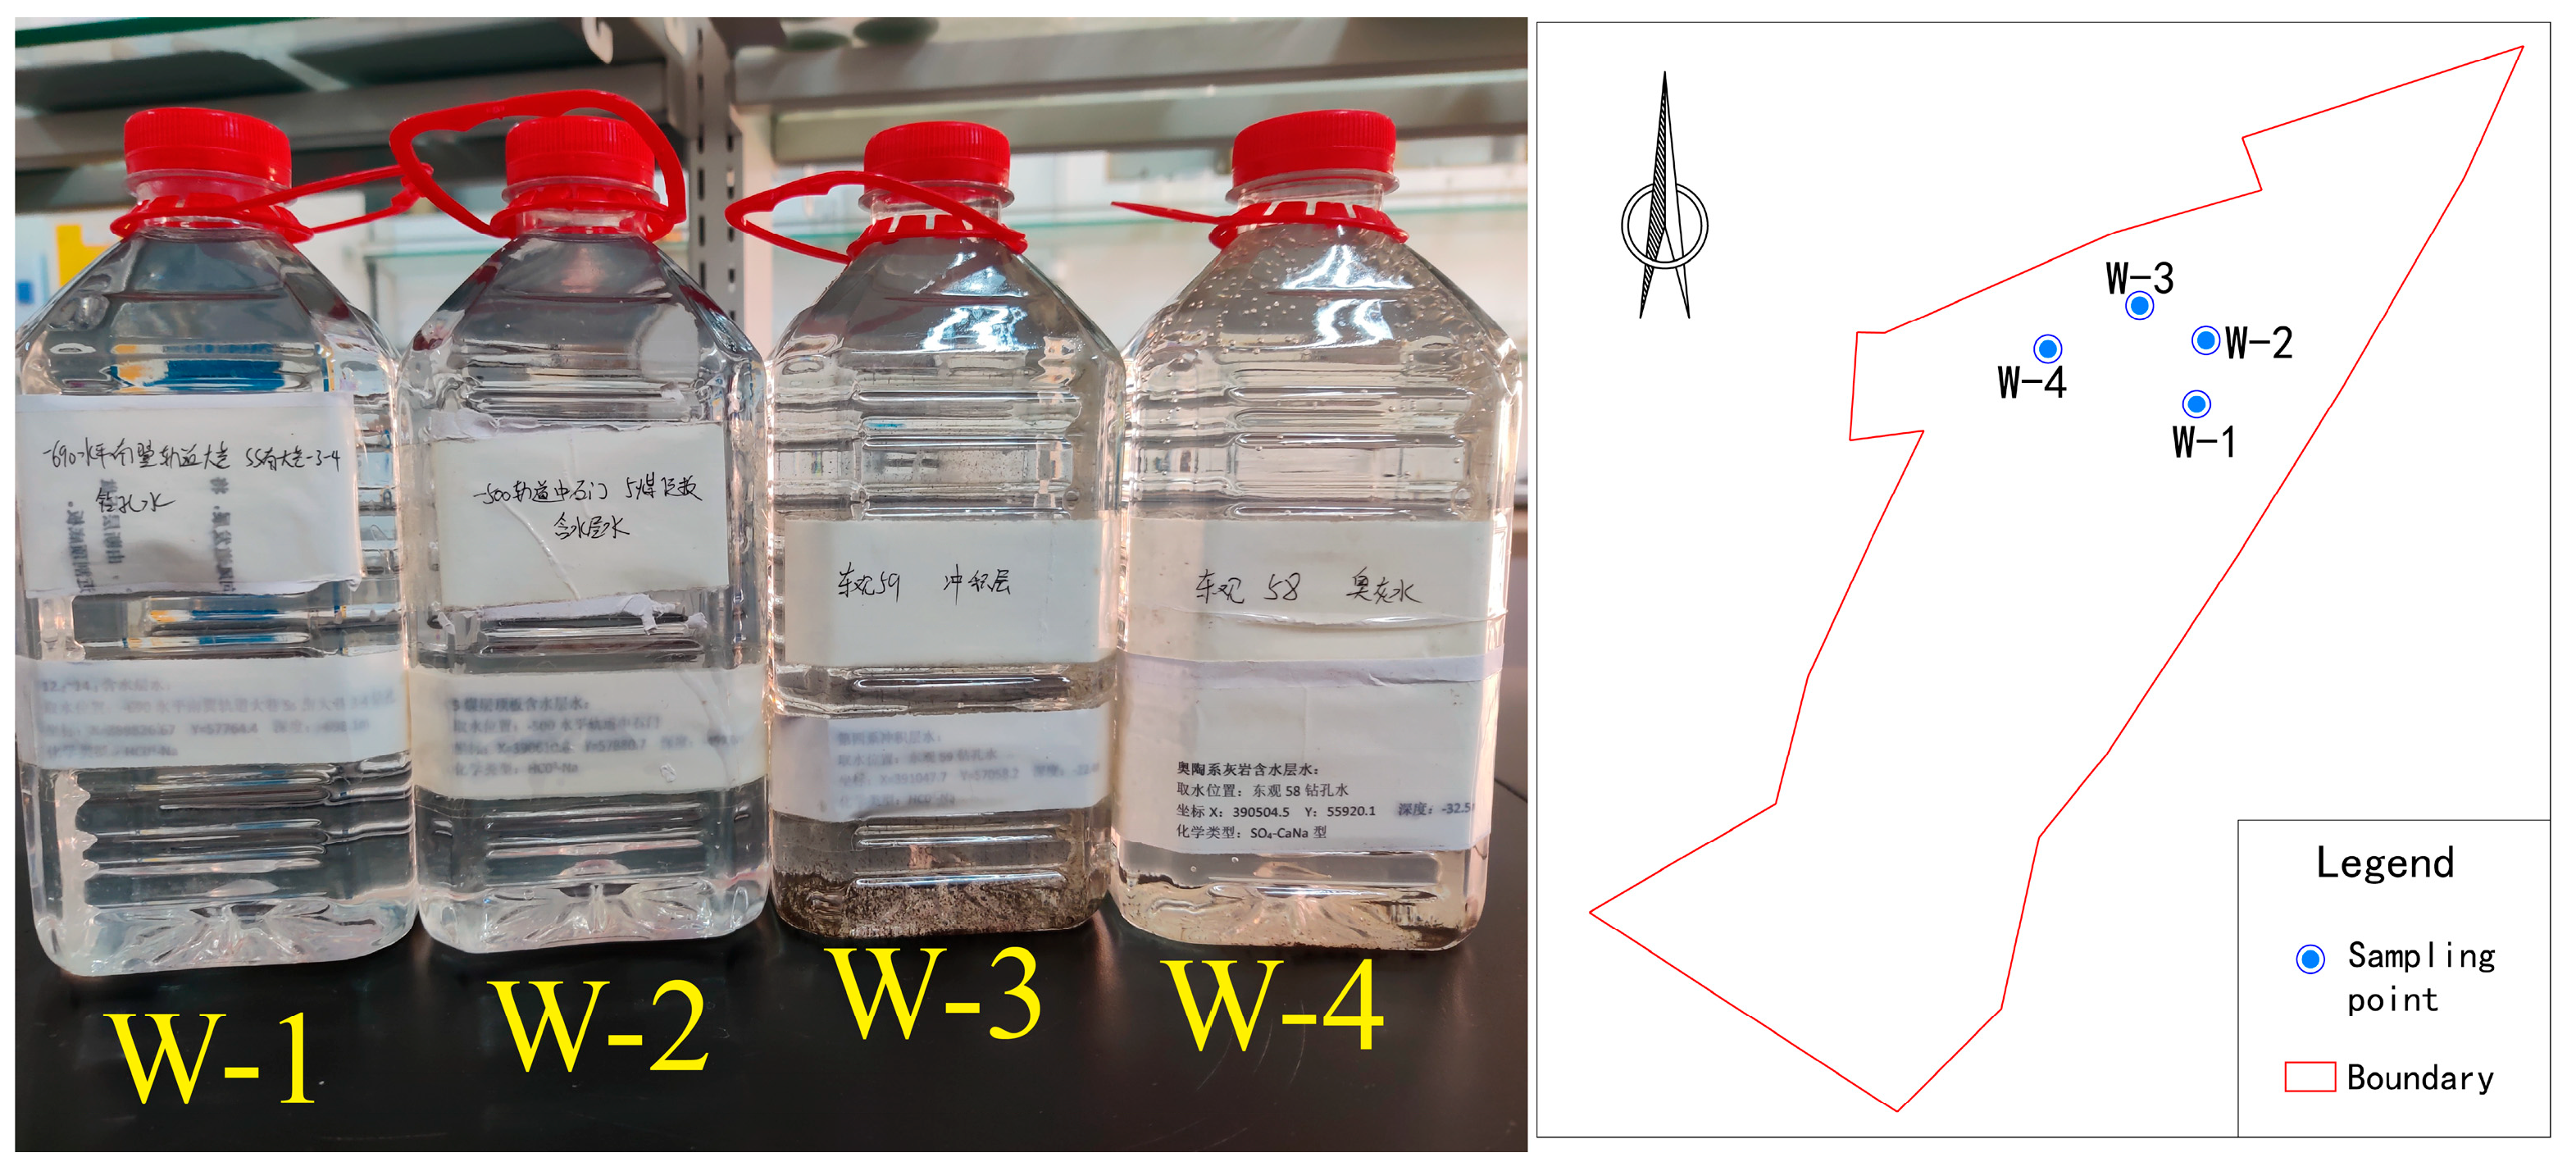
In the preliminary phase of this study on spectral tracing of inrush water sources, four water samples were collected from the primary aquifers of the Donghuantuo mine. These samples were taken from the 12-2~14-1 aquifer, the 5 coal roof aquifer, the Quaternary aquifer, and the Ordovician limestone aquifer, with each sample measuring 1000 mL (
Figure 3). Each of the four samples was labeled and numbered accordingly. The detailed information for each water sample is provided in
Table 1.
2.2. Transient Electromagnetic Method for Inrush Water Sources
In this study, the enhanced TEM67 transient electromagnetic method was employed. The transmitter used was the TEM57-Mk2, augmented with two TEM67 power modules, capable of reaching an emission voltage of up to 240 V and a maximum emission current of 28 A. This configuration allowed the use of large-size or large effective area transmitter coils, achieving greater exploration depths. The table below compares the transmission power of the TEM67 and the enhanced TEM67. It shows that with a transmission frame size of 2000 m × 2000 m (equivalent to an exploration depth of 2000 m), the magnetic moment M (I×S) of the enhanced TEM67 can reach up to 36,363,636 A·m².
2.3. Full-Spectrum Beer–Lambert Tracing Method Using Spectrophotometry
The spectrophotometer operates based on the Beer–Lambert law, which posits that molecular substances can selectively absorb certain wavelengths of light within the ultraviolet-visible (UV–Vis) spectrum under radiation, causing electronic transitions. Due to the unique electronic orbitals of different substances, the energy required for these transitions varies, leading to differences in the wavelengths of light they can absorb. Thus, the degree of light absorption at different wavelengths can be used to identify the substance.
The spectrophotometer measures the relative transmittance or absorbance (Abs, indicating the degree of light absorption) of the test sample, using a blank reference solution (commonly ultrapure water, air, or specific solutions) assumed to have 100% transmittance. By irradiating the measurement solution with incident light across a defined wavelength range, the absorbance at each wavelength can be recorded. These data allow the creation of a wavelength–absorbance spectrum in a Cartesian coordinate system.
Different substances exhibit distinct absorption characteristics at various wavelengths, resulting in unique spectral line shapes and peak absorption wavelengths. The spectrophotometer consists of several key components: a light source, a monochromator, an absorption cell, a detector, and a processing and display system. The operational schematic of these components is illustrated in
Figure 4.
The light source in the spectrophotometer provides a continuous spectrum. The monochromator’s function is to separate the continuous light emitted by the light source into various high-purity monochromatic lights of single wavelengths for irradiating the sample. The absorption cell, which holds the sample, uses a quartz cuvette for this experiment, as the detection range spans the visible and ultraviolet regions (320 nm to 1100 nm). The detector converts the light signal passing through the absorption cell into an electrical signal. The processing and display system is primarily used for instrument operation control and data processing, displaying the result data and the spectral line graph of the tested sample.
2.4. Chaos Sparrow Search Optimization Algorithm
The sparrow search algorithm (SSA) faces challenges such as a tendency to get trapped in local optima, a lack of randomness in the search process, and slow convergence. To address these issues, researchers including Xin introduced the tent chaotic sequence and Gaussian distribution into the SSA, forming the chaos sparrow search optimization algorithm (CSSOA). This method uses tent chaotic mapping during the population initialization stage to maintain a uniform distribution of initial individuals. When the population exhibits convergence or divergence, chaotic perturbations and Gaussian mutations are applied to alleviate local optima problems. The implementation steps are as follows:
Population Initialization: Randomly generate a group of sparrows (individuals), with each sparrow representing a potential solution. Each sparrow is randomly assigned an initial solution position.
Objective Function Evaluation: Define the optimization problem to be solved and calculate the objective function value at the current position of each sparrow, representing the quality of the solution.
Chaotic Perturbation: Introduce chaotic perturbation using chaotic mapping to disturb the positions of the sparrows, enhancing the diversity of solutions and reducing the likelihood of local optima.
Neighborhood Search: Each sparrow performs a dynamic search based on its current position to find better solutions. Sparrows communicate with each other to aggregate the best solutions found in their respective neighborhoods (optimal positions).
Position Update: Update the position of each sparrow based on the optimal positions found so far, generating new solutions.
Global Best Solution Update: Aggregate the optimization results from all sparrows to determine the best solution among them, representing the global optimal solution.
Termination Condition Check: Check whether the termination conditions are met, such as reaching the maximum number of iterations or the objective function value meeting a specified threshold. If the conditions are not met, return to step 3; otherwise, terminate the algorithm.
Return Best Optimization Result: Output the global optimal solution as the result of the algorithm.
This study focuses on optimizing four critical parameters that significantly impact the model generation of the random forest (RF) algorithm: ‘n_estimators’, ‘max_depth’, ‘min_samples_leaf’, and ‘min_samples_split’. The ‘n_estimators’ parameter is crucial as it controls the number of decision trees in the random forest. A too-small value can lead to underfitting, while a too-large value can slow down the model’s running speed, hence the need for an appropriate ‘n_estimators’ value. ‘Max_depth’ sets the maximum depth of the decision trees, controlling the number of features selected for each tree. Excessive depth can cause overfitting. ‘Min_samples_leaf’ specifies the minimum number of samples required to be at a leaf node, indicating the minimum number of samples each child node must have after a split. ‘Min_samples_split’ represents the minimum number of samples required to split an internal node, indicating that a node must have at least ‘min_samples_split’ samples to be split.
2.5. Random Forest (RF) Algorithm
Random forest (RF) is an ensemble learning algorithm commonly applied to classification tasks. It constructs a large number of decision trees from training samples to form a collective discriminative model, which is then used for classifying unknown samples (Equation (1)). In UV–Visible spectrum classification, RF can effectively handle non-linear relationships and, through its built-in feature importance metrics, select the most informative features from large datasets (Equation (2)), thus enabling efficient processing of high-dimensional spectral data while ensuring classification accuracy.
The classification result of RF is a synthesis of the individual classifications from all decision trees, with the mode of these results serving as the final RF classification output.
where
T represents the number of decision trees, and
is the classification result of the
t-th decision tree. This method effectively reduces overfitting caused by individual trees, enhancing the model’s generalization capability.
RF also computes the contribution of each feature (dimension) to the classification decision.
where
f represents a specific feature, and
denotes the consistency gain brought by feature
f in the
t-th decision tree. Higher consistency often leads to better classification performance. Analyzing feature contributions can also aid in dimensionality reduction for high-dimensional data.
3. Electrical Characteristics of Water-Rich Inrush Water Sources
3.1. Electrical Characteristics of Water-Rich Inrush Water Sources at the 20223 and 3015 Working Face
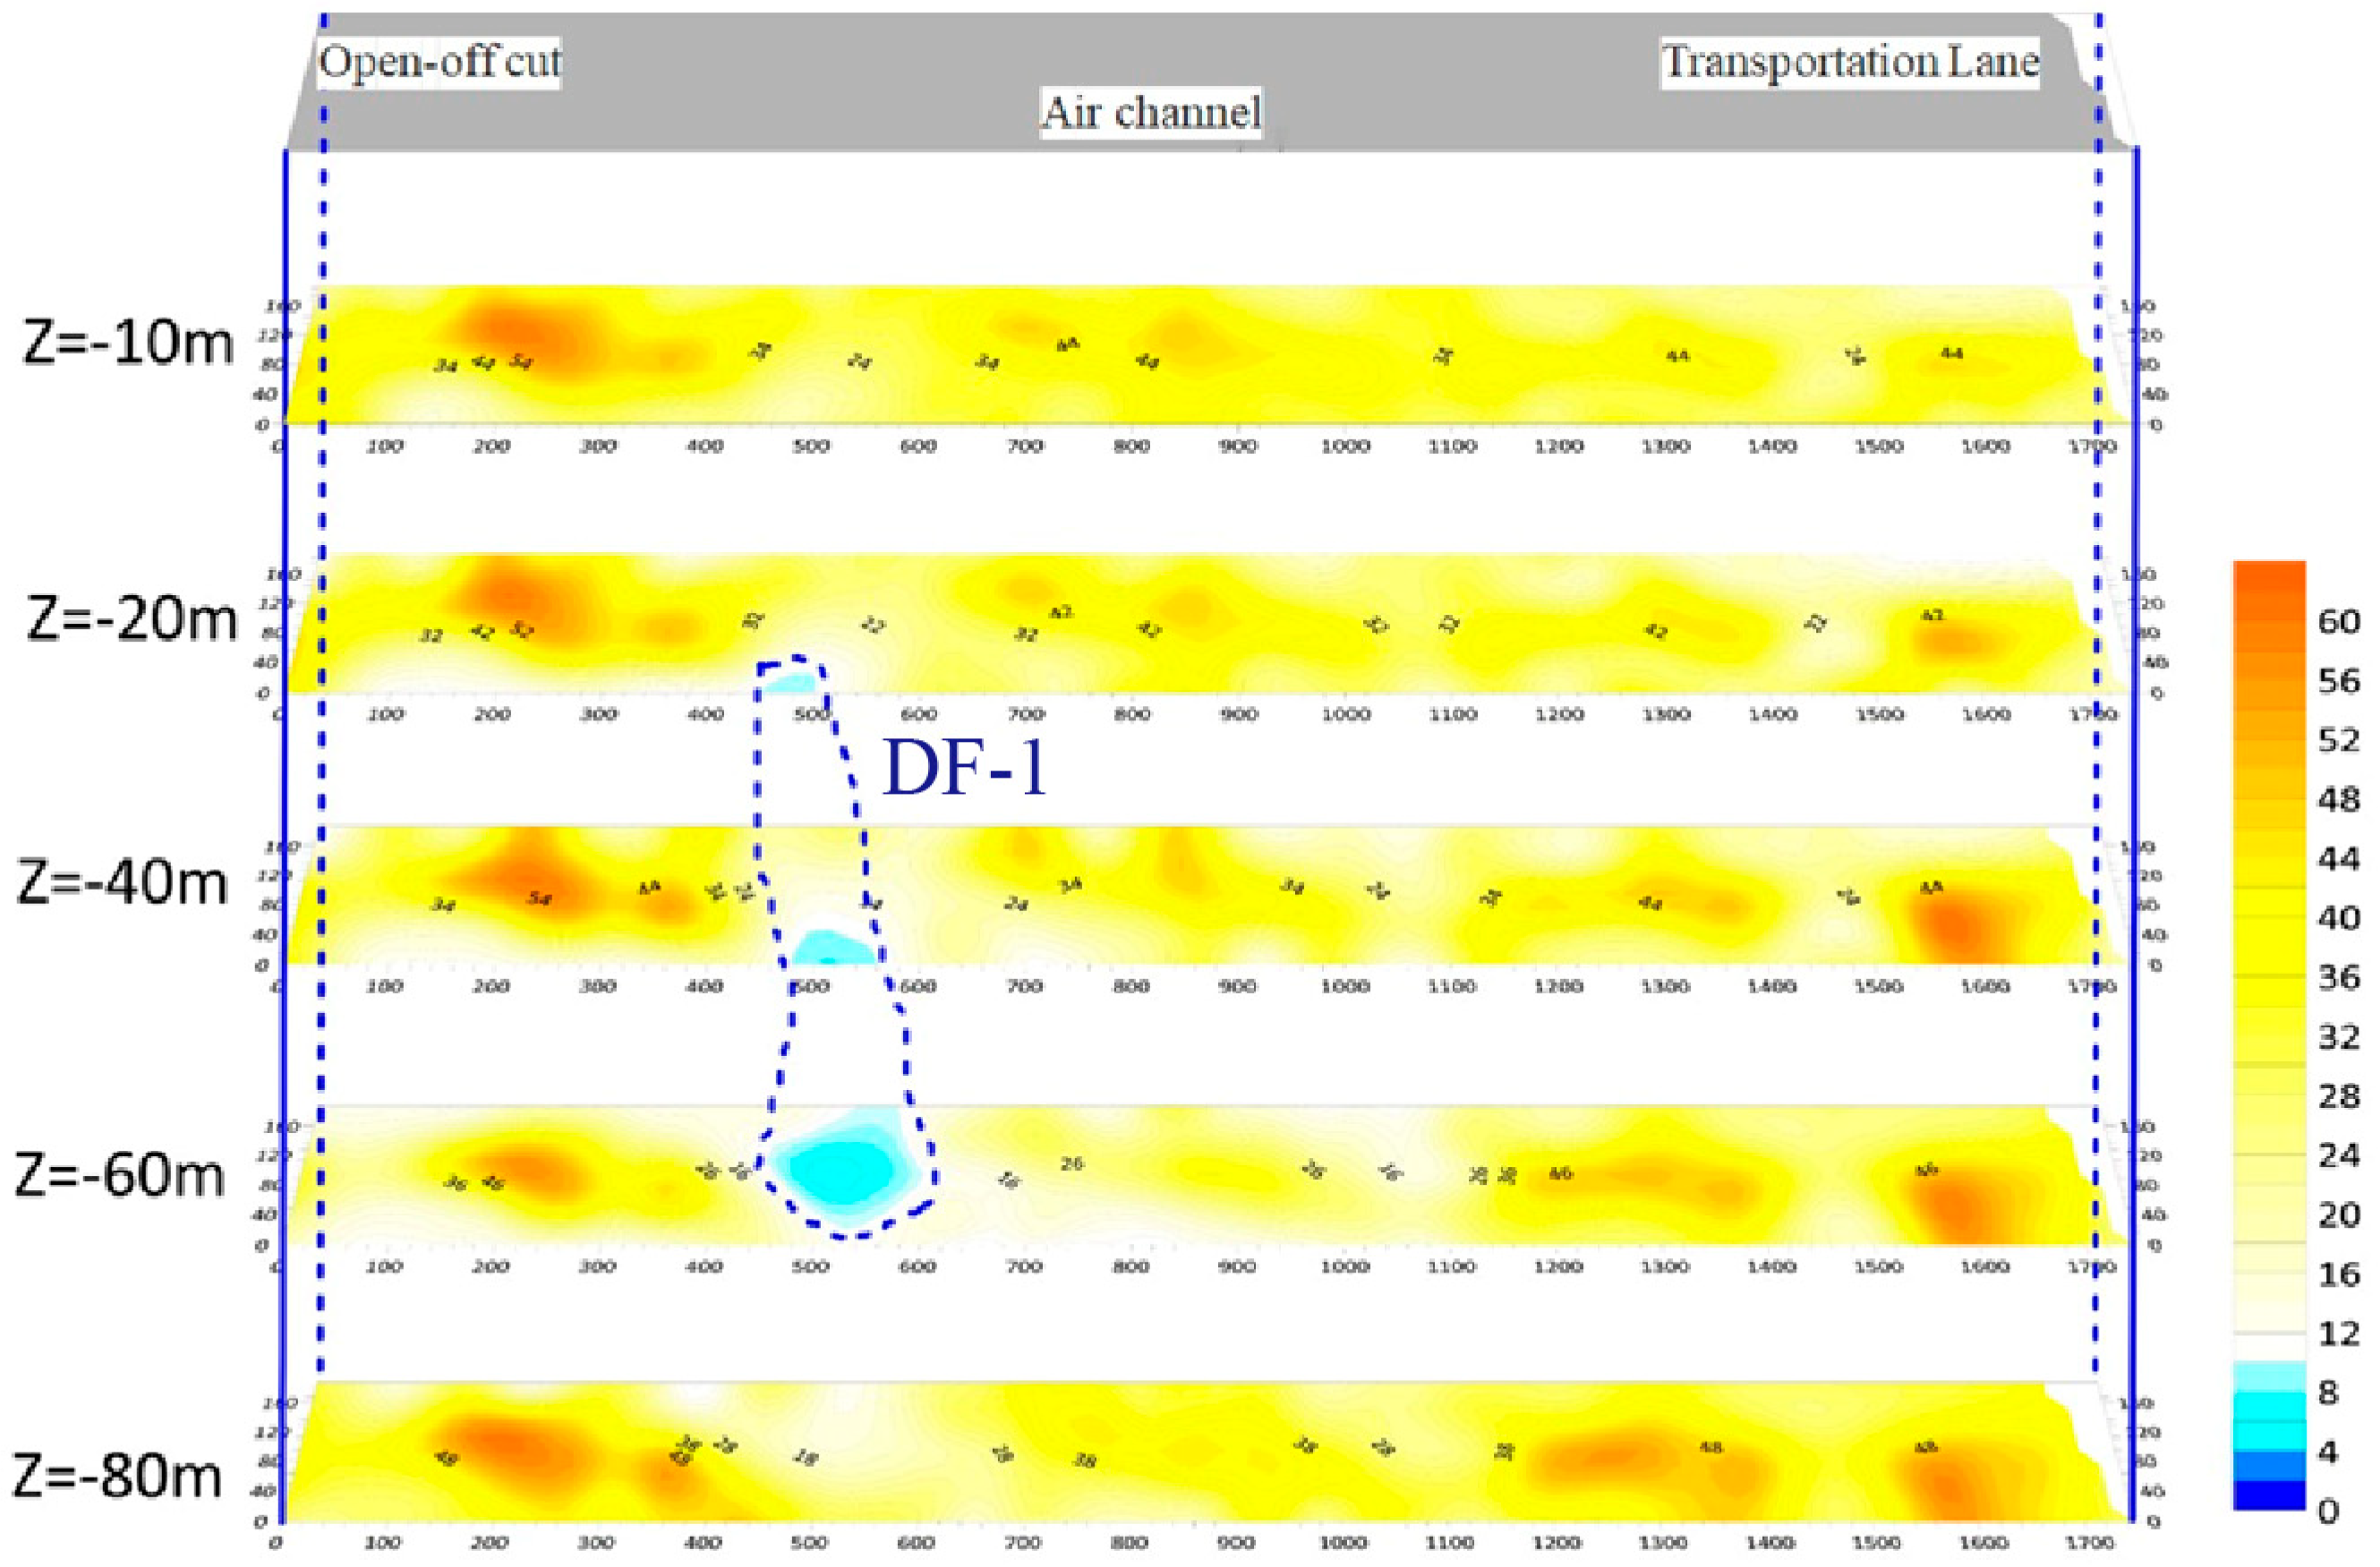
The current retreating working faces are 20223 and 3015. To ensure safe and efficient mining, it is necessary to conduct electrical resistivity surveys on the roof and floor of these working faces to accurately delineate their water-bearing properties. The enhanced TEM67 transient electromagnetic method was used to detect water-rich areas at the 20223 and 3015 working faces. These surveys were complemented by data from four drill holes and tunnel exposure data. The water-bearing characteristics of the roof and floor of these working faces are illustrated in the following
Figure 5 and
Figure 6.
According to
Figure 5, a relatively low-resistivity zone, designated as DF-1, was identified within the 0 to 80 m vertical detection range of the floor at the 20223 working face. Analysis of related hydrogeological data suggests that this zone corresponds to a sandstone fissure-confined aquifer. Comparisons with the fault lines in the profile and cross-section diagrams indicate that this zone is likely connected by faults, warranting focused investigation. Verification through four drill holes confirmed that this is indeed a fault zone.
According to
Figure 6, a fault f548 was exposed in the region where anomaly DF1 is located, suggesting that the anomaly may reflect the sandstone aquifer conducted by the fault. Anomaly DF2 corresponds to water from sandstone fissures in the roof and floor or water accumulated in the goaf of the overlying ninth coal seam, indicating weak to moderate water-bearing properties, which could impact the retreating operations at working face 3015.
In the area of anomaly DF3, fault f550 was identified, implying that this anomaly might also represent the sandstone aquifer conducted by the fault. Similarly, anomaly DF4 reflects water from sandstone fissures in the roof and floor or water accumulated in the goaf of the overlying ninth coal seam, with weak to moderate water-bearing properties, potentially affecting the retreating operations at the working face.
3.2. Spectral Characteristics of Various Inrush Water Sources
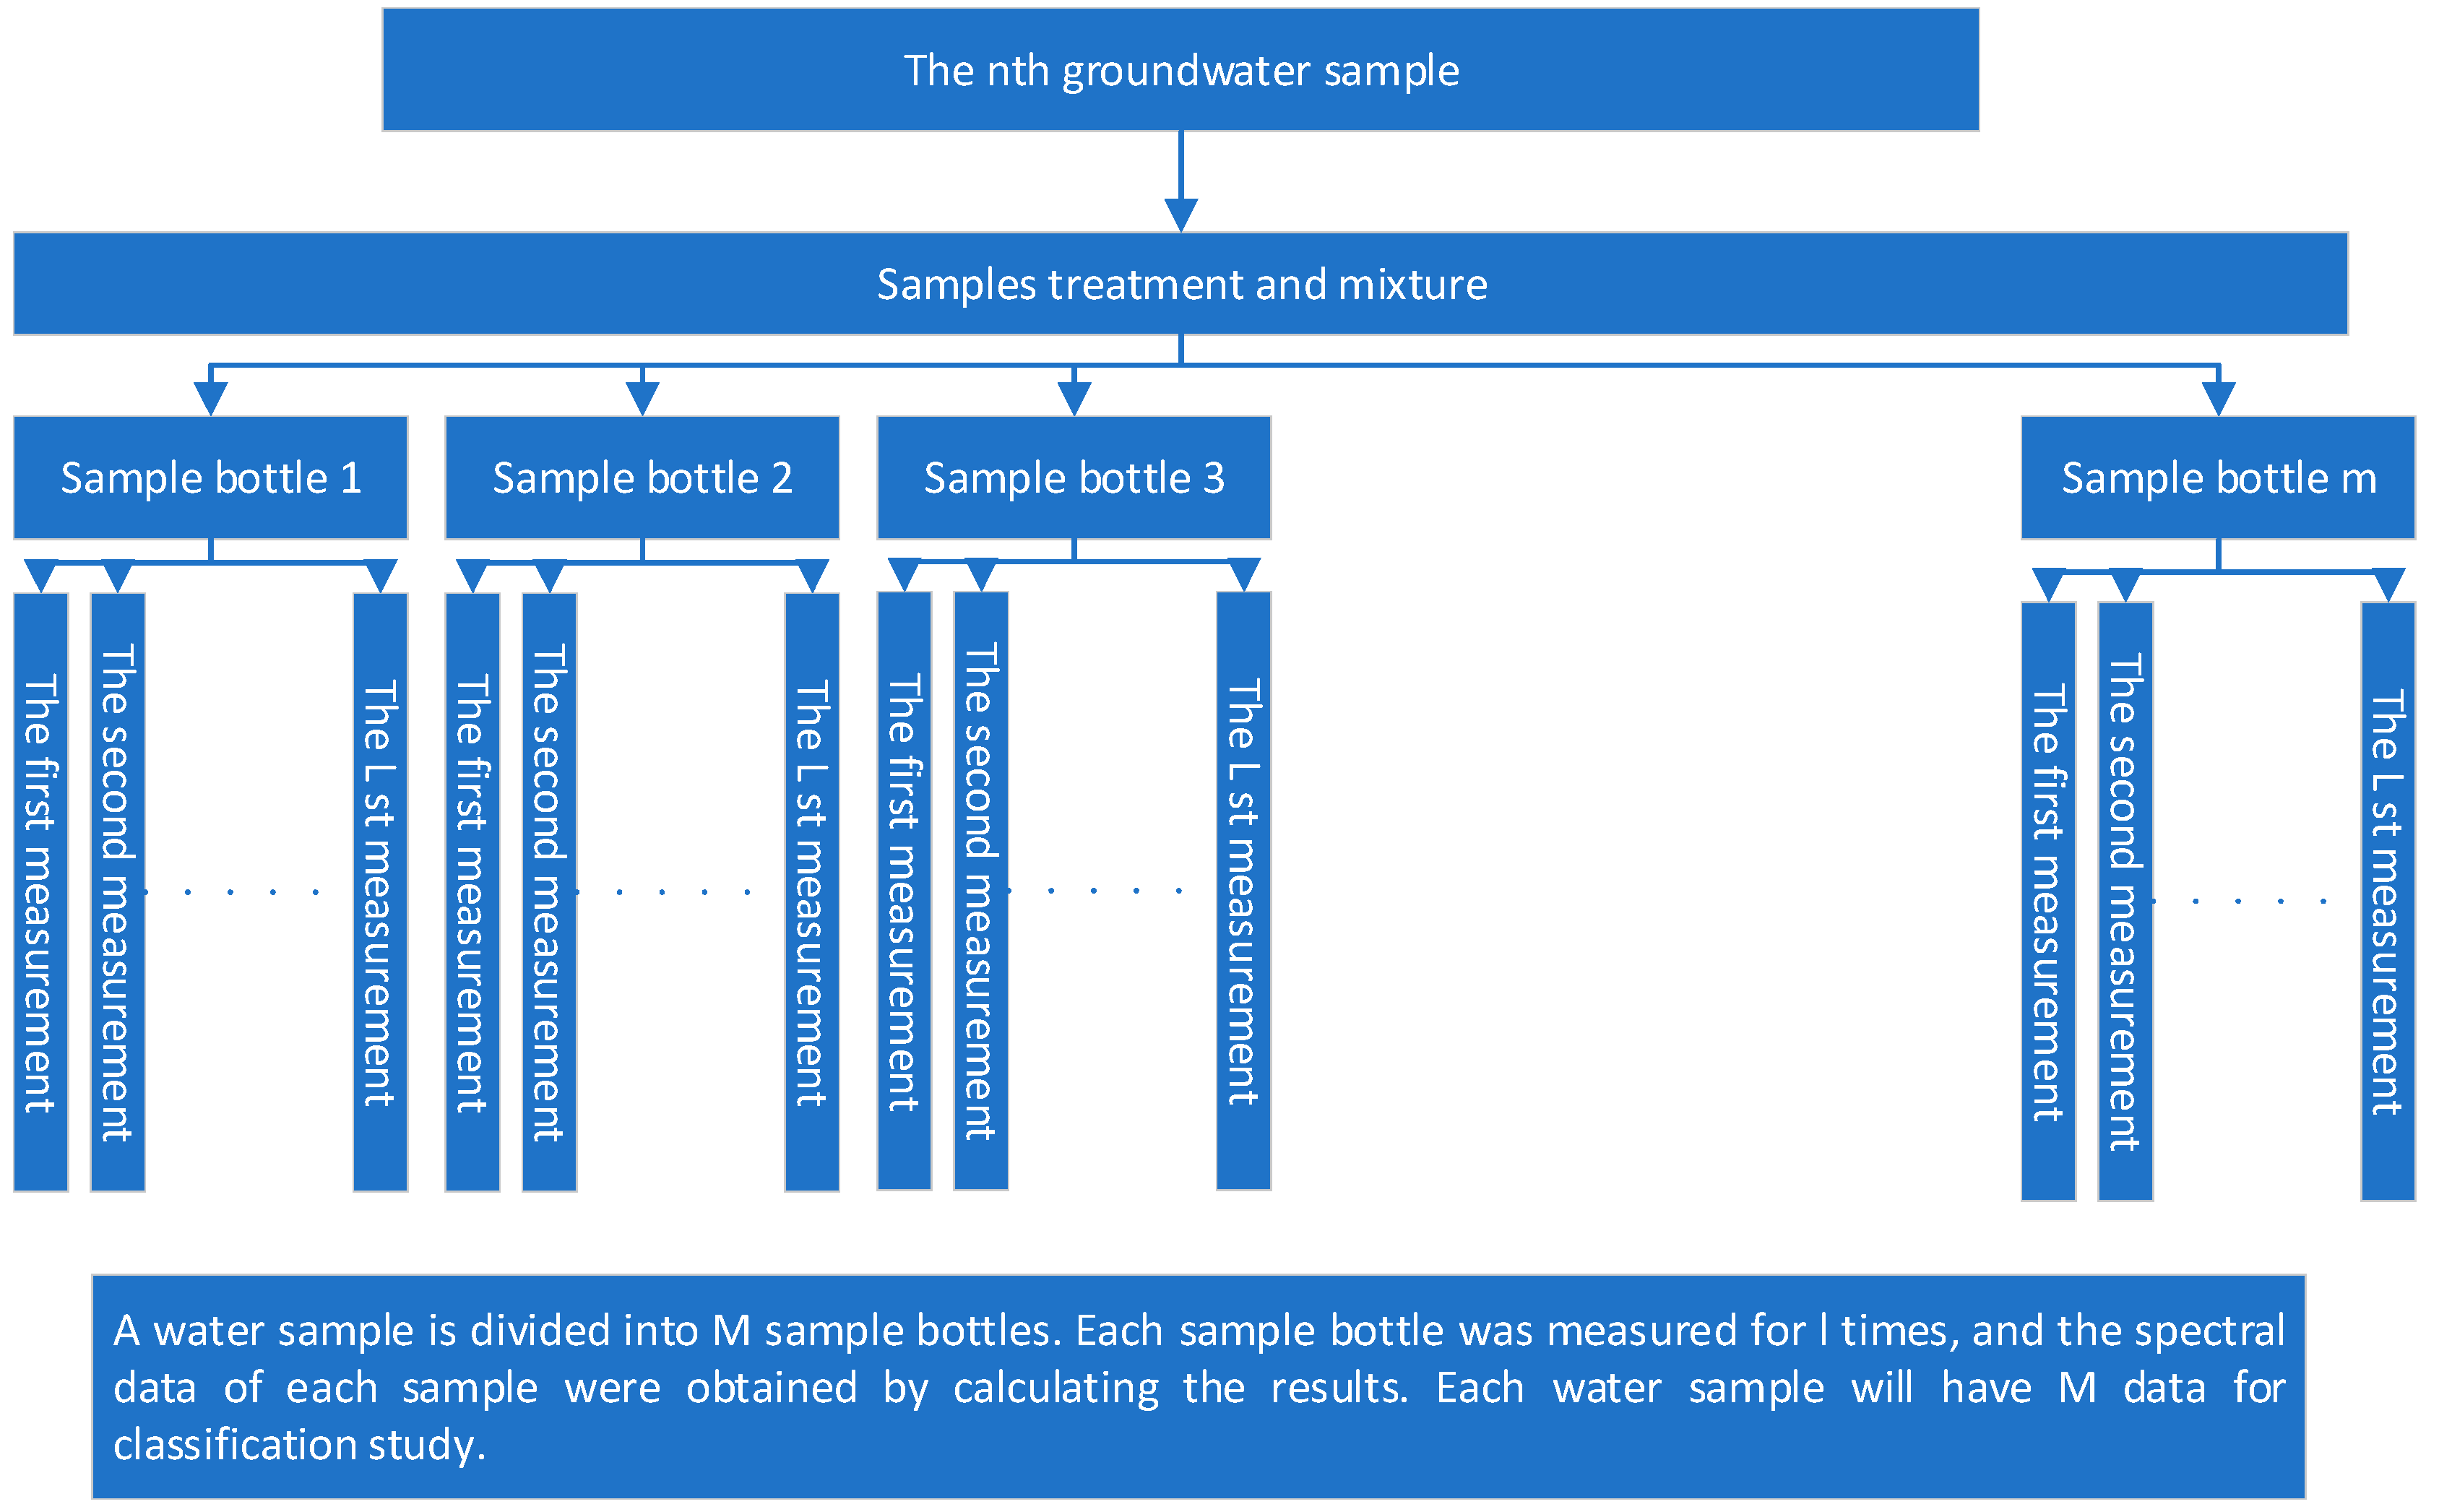
A vacuum filtration apparatus was used to filter each water sample solution through a 0.45 μm PTFE hydrophilic filter membrane to remove particulate impurities. The filtered water samples were then dispensed into sample bottles that had been washed with ultrapure water and air-dried. To increase the sample size for subsequent machine learning, each type of water sample was divided into eight sample bottles, resulting in eight sets of spectral data for each type of water sample.
Since the cuvette capacity of the DR-3900 spectrophotometer is 20 mL, each measurement was standardized to 15 mL to ensure measurement quality while conserving the sample. To ensure accuracy, each sample was measured three times, and the arithmetic mean of these measurements was used as the spectral curve data for that sample. For ease of data processing and result interpretation, samples were assigned hierarchical numbers, e.g., the first sample of water sample type 1 was labeled 1-1, and its two repeated measurements were labeled 1-1-1 and 1-1-2, respectively. The detailed preparation steps are illustrated in
Figure 7. In total, 32 sets of water samples were prepared for subsequent classification model training in this tracing study.
The prepared samples were subjected to spectrophotometric measurement. After the instrument completed its self-check and warm-up, the measurement parameters of the spectrophotometer were set: the starting wavelength was set to 320 nm, the ending wavelength to 650 nm, and the scanning interval to 1.0 nm. Zero-line calibration was then performed. Each sample was measured sequentially, with three repeated measurements. The data were then imported into a computer using a USB drive and labeled accordingly. After measuring each type of sample, the cuvette and other instruments were cleaned with ultrapure water.
Upon completing the measurements of all water samples, the repeated measurement data for each sample were organized and averaged arithmetically, resulting in 32 sets of single-source spectral data, as shown in
Figure 8.
Analysis of
Figure 8 reveals significant differences in the spectral data of the four aquifer types within the measured wavelength range of 320–650 nm. The absorbance fluctuations for water samples W-1 and W-2 are minimal, distributed within the range of 0 to 0.005, with most absorbance values being 0. Specifically, the absorbance for W-1 drops to 0 after 429 nm and remains unchanged, while for W-2, it remains at 0 beyond 335 nm. In contrast, water samples W-3 and W-4 exhibit significant absorbance variations, with both reaching maximum absorbance values around 320 nm and then gradually decreasing to their minimum values. The absorbance range for W-3 is between 0 and 0.015, while for W-4, it is between 0 and 0.0325. The absorbance variations for all four water samples are concentrated in the ultraviolet region (<400 nm), aligning with the visual characteristics of colorless and transparent water samples.
Water samples W-3 and W-4, which are from shallower locations, experience more frequent water–rock interactions compared to the deeper W-1 and W-2 samples. As a result, W-3 and W-4 have higher ion concentrations and more complex ionic compositions, leading to more pronounced spectral variations. The distinct spectral differences among the four water samples ensure the accuracy of the subsequent machine learning tracing model’s classification and identification.
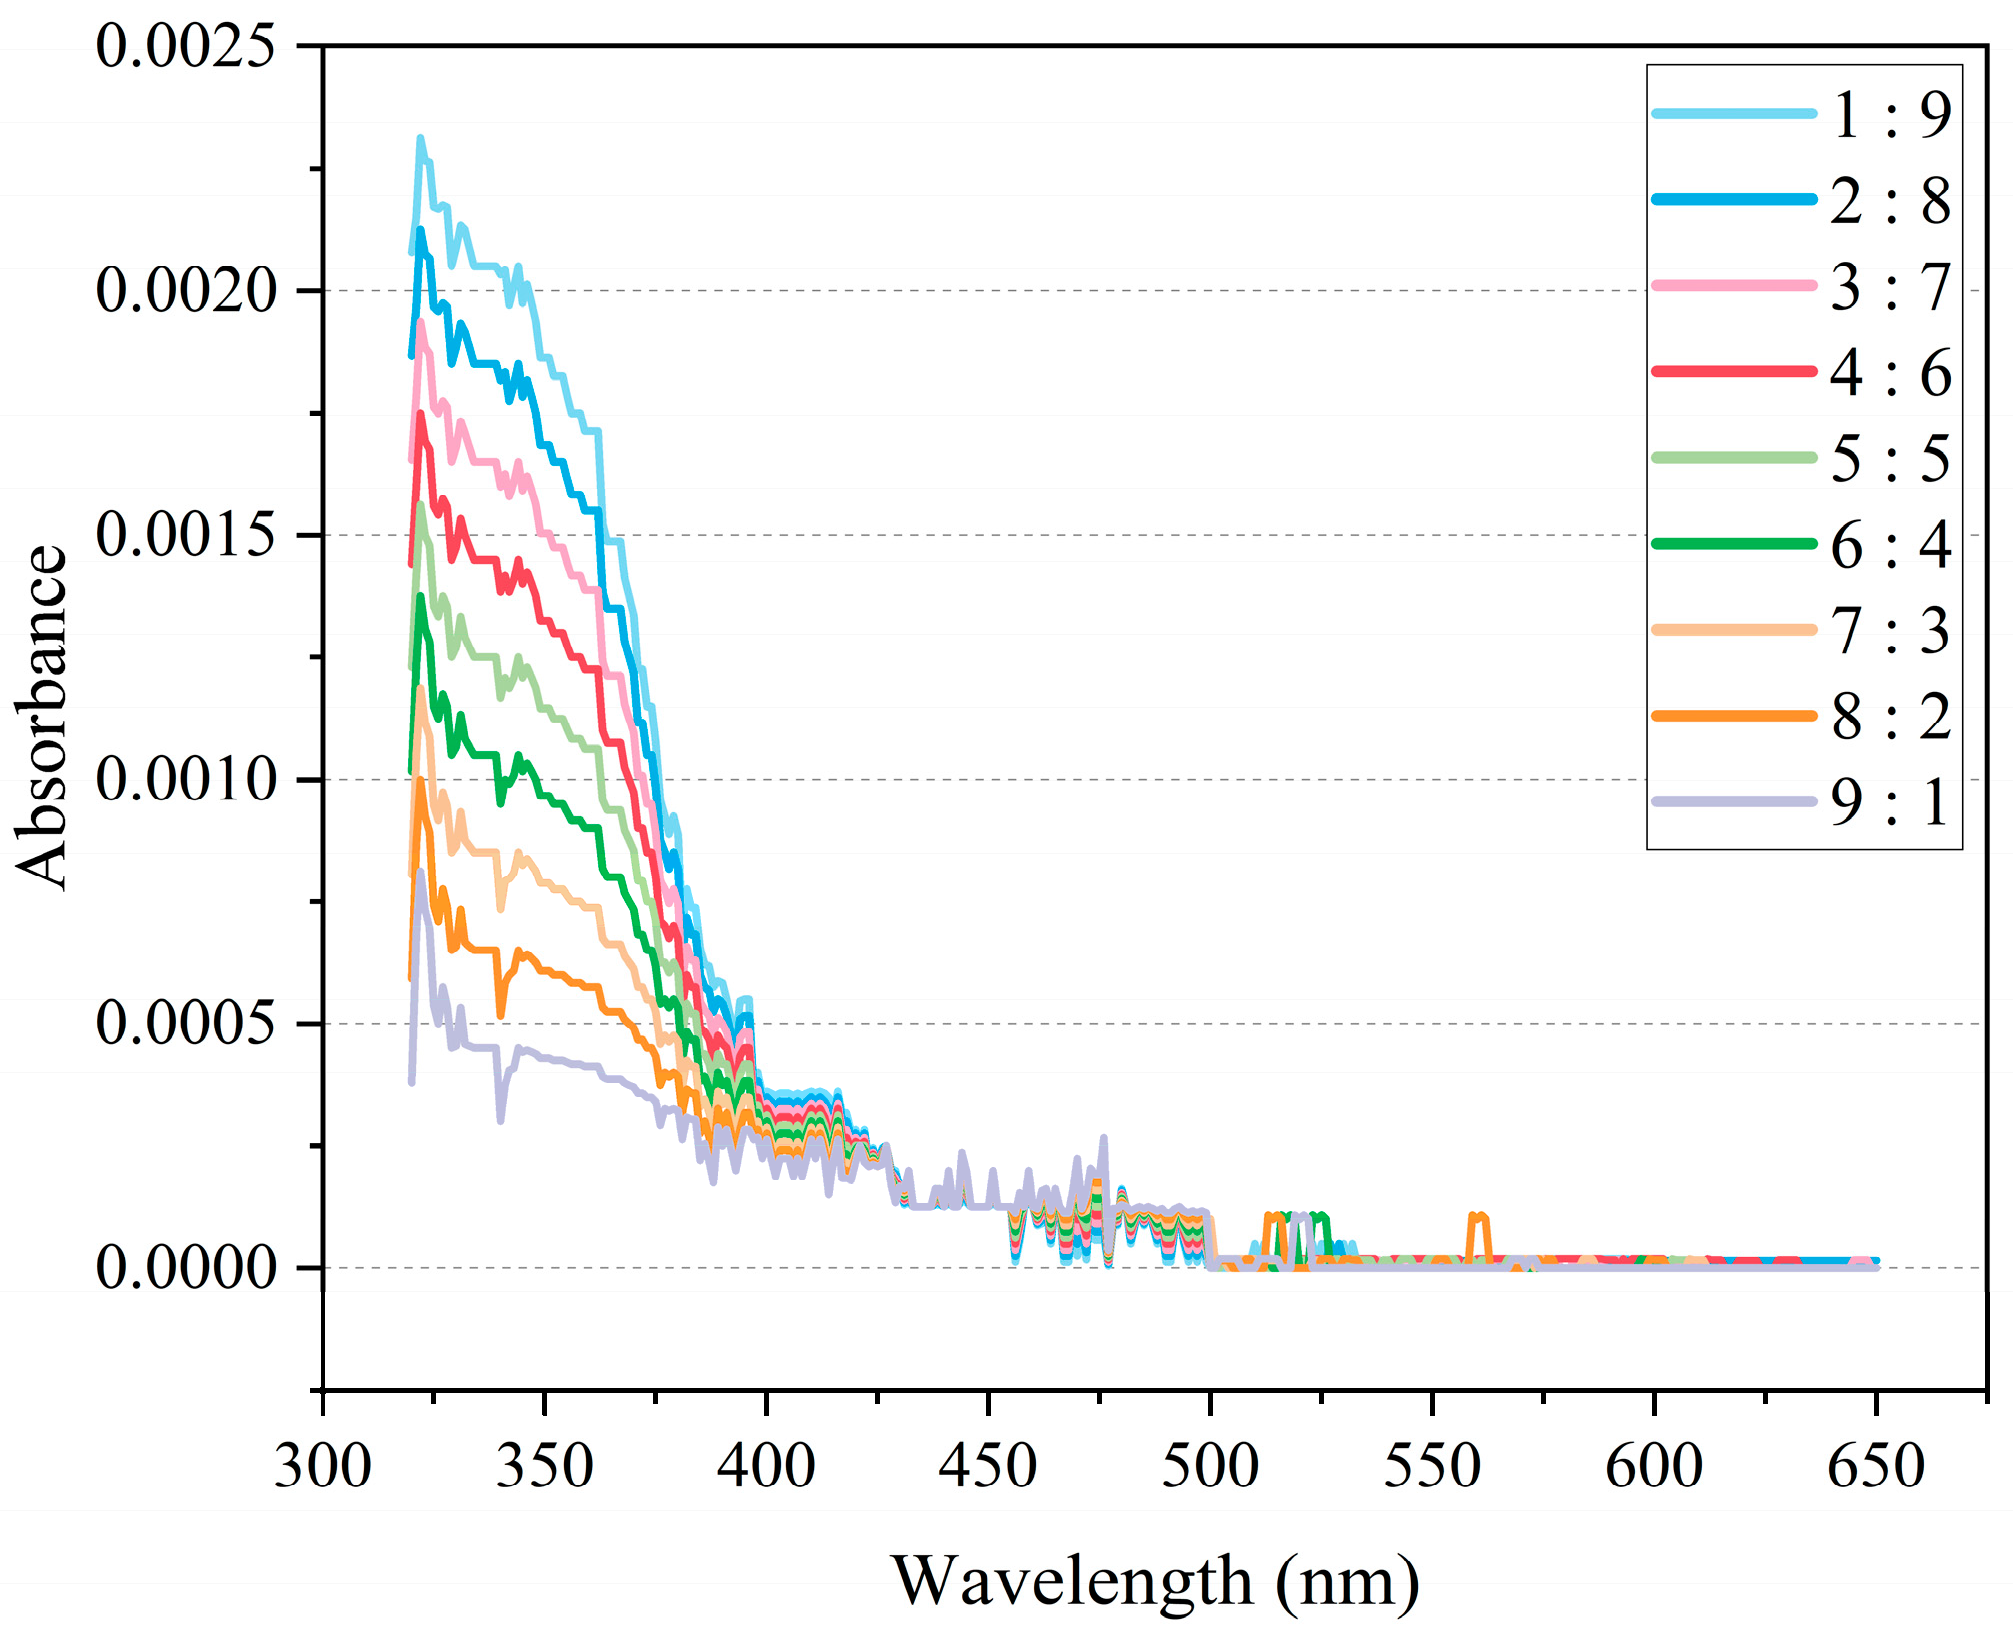
Based on the hydrogeological conditions, hydraulic connections, and actual geological situations of the four main aquifers sampled from the Donghuantuo mine, the study investigated the mixing of the Quaternary water sample W-3 and the 12-2~14-1 aquifer water sample W-1. The preparation method for these mixed samples was consistent with that of the single-source samples. W-1 and W-3 samples were mixed in ratios of 1:9, 2:8, …, 8:2, and 9:1. To ensure sufficient training samples for the subsequent tracing model, 10 samples were prepared for each mixing ratio, resulting in a total of 90 mixed spectral data entries, as shown in
Figure 9.
Figure 9 illustrates that as the concentration ratio of the two mixed water samples varies, the absorbance curve of the mixture increasingly resembles that of the sample with the higher concentration. The differences between the W-1 and W-3 mixtures become significant only in the wavelength range near the maximum absorbance (320–400 nm), while in the 500–650 nm range, the absorbance approaches zero. Similar to the spectral measurement results of the single-source samples, the measurements of the mixed samples exhibit considerable experimental error. Therefore, further data processing is necessary to eliminate noise interference generated during the experiments.
3.3. Construction and Evaluation of the Tracing Identification Model
Using the preprocessed sample data, we constructed the CSSOA-RF spectral tracing identification model based on the Python language. The CSSOA algorithm was employed to optimize the key parameters of the RF model, achieving adaptive parameter optimization for the tracing identification model. This phase involved steps such as dataset partitioning, CSSOA algorithm optimization, and the construction of the CSSOA-RF tracing identification model.
The parameters of the RF model, including ‘n_estimators’, ‘max_depth’, ‘min_samples_leaf’, and ‘min_samples_split’, were optimized based on the training set. The CSSOA algorithm’s objective function was set to the average error obtained from five-fold cross-validation on the training set. The population size was set to 60, with a discoverer ratio of 0.7 and a warning reconnaissance ratio of 0.2. The optimization process is illustrated in
Figure 10. After 67 iterations, the model achieved the minimum average error value of 0.1596, which remained stable. Therefore, the parameter combination at this point was chosen as the optimal parameter values for the RF model. The parameter search ranges and their optimal values are listed in
Table 2, with other parameters retaining their default values.
4. Discussion
4.1. Determination and Evaluation of Water-Richness of Inrush Water Sources
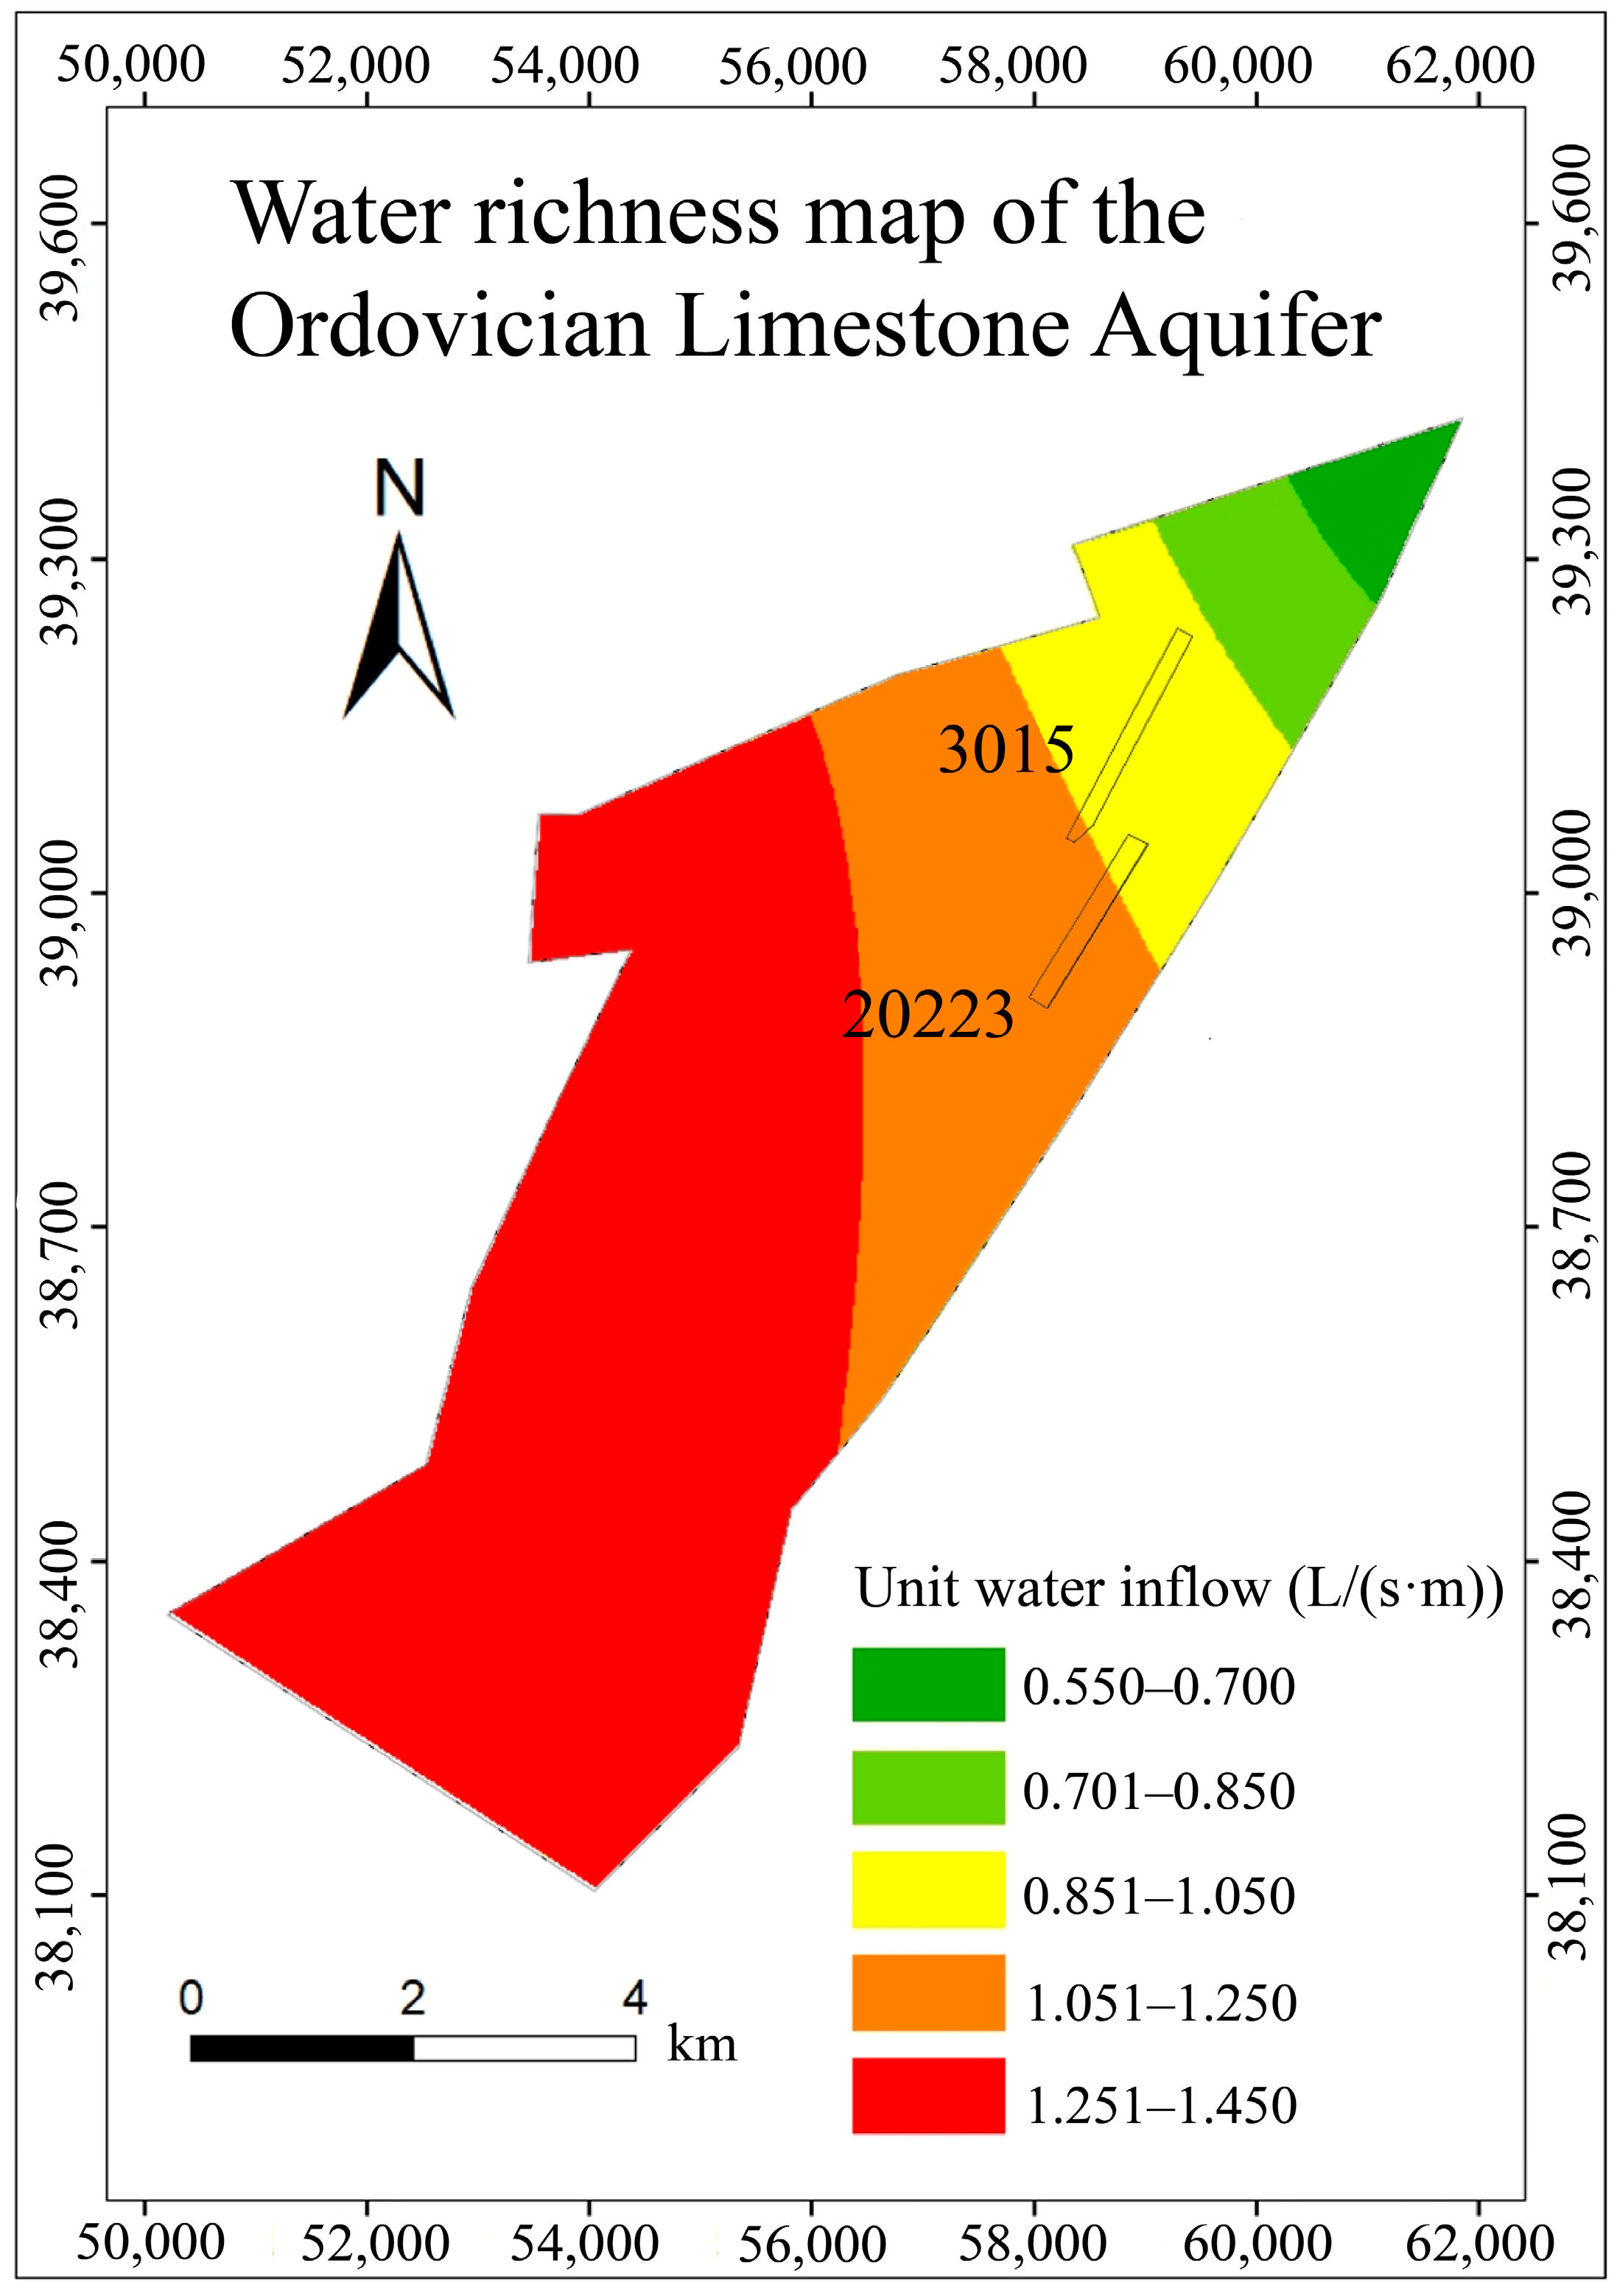
Based on actual observation data from the Donghuantuo mine and the revealed tunnel water sample detection data, the Ordovician limestone water has been identified as the most influential water source. Consequently, this study compared the water richness, characterized by the unit water inflow of the Ordovician limestone water, with the results obtained from the transient electromagnetic method and the direct current electrical method.
The verified water richness determined by electrical methods shows a generally similar trend, but the electrically determined water-rich areas are somewhat larger. For instance, at the current mining faces 20223 and 3015, the southern water-rich areas significantly exceed those to the north (
Figure 11). Research indicates that this position coincides with the development of fault DF-1, and the water-conducting fissure zone induced by mining activity also contributes to this. During the excavation of the 20223 and 3015 working faces, it was found that the floor in this location was relatively fragmented, with well-developed fissures, thus significantly enlarging the range of geophysical water richness in this area.
4.2. Traceability Accuracy Analysis after Deep Learning
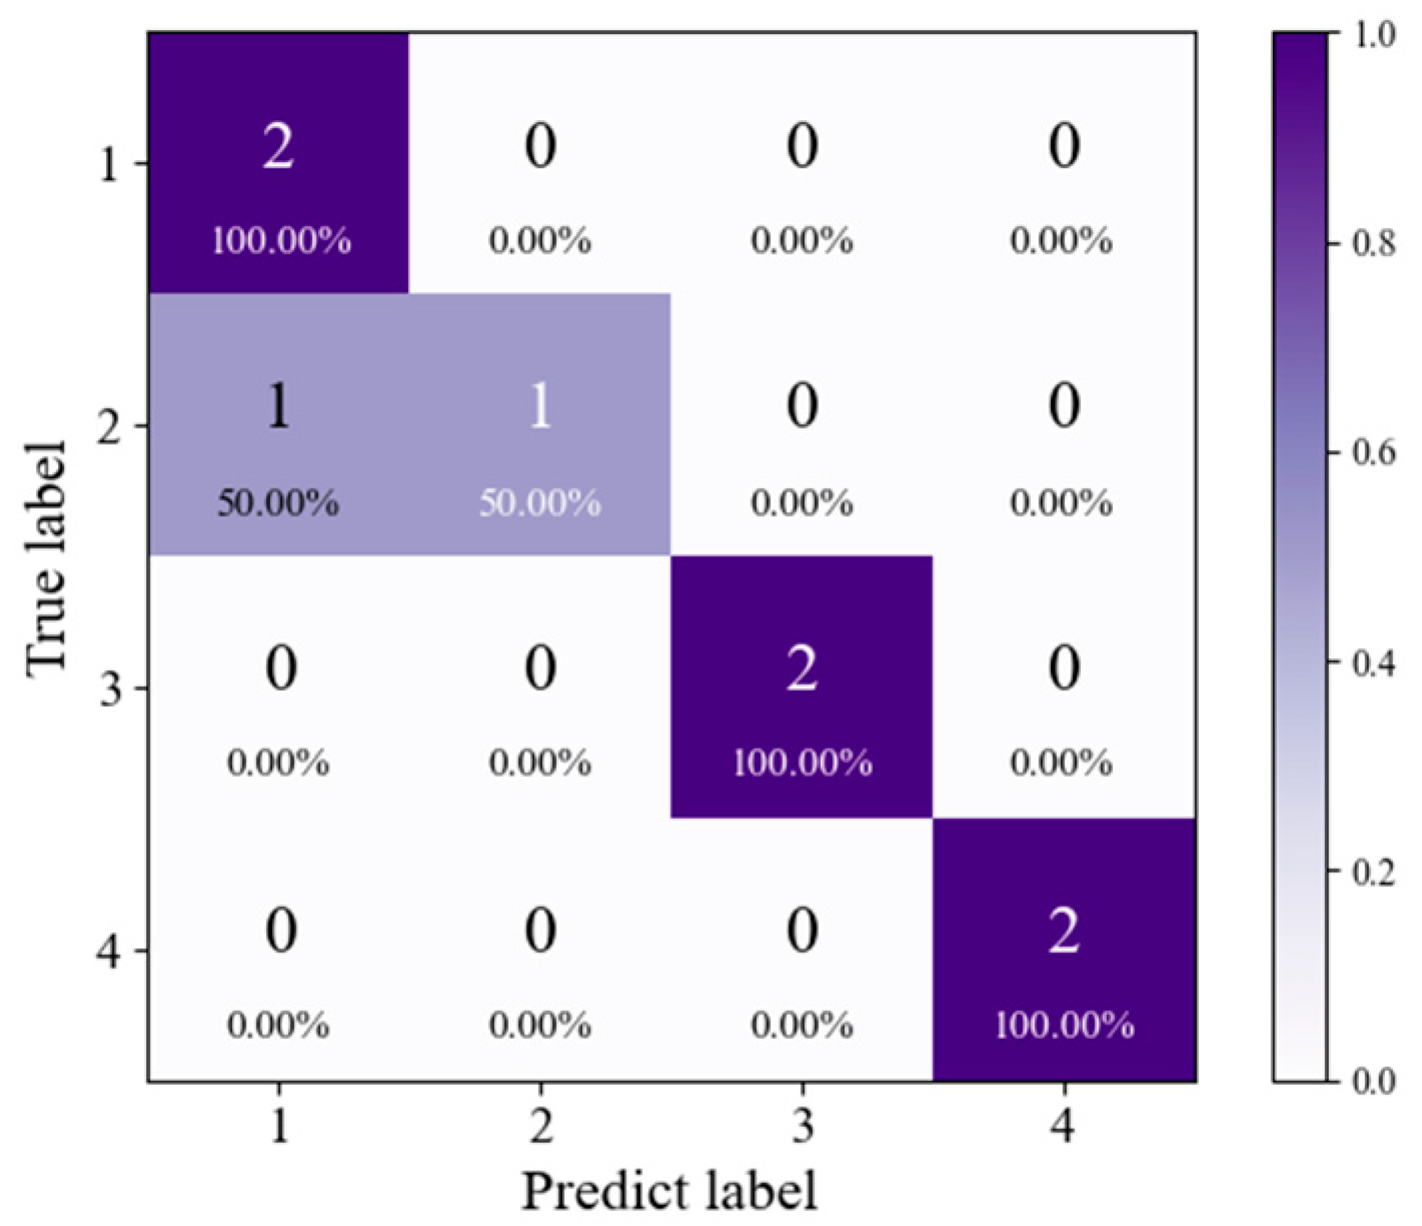
To further evaluate the constructed tracing identification model, we applied it to the designated test set for tracing identification. The results were visualized using a confusion matrix, as shown in
Figure 12. The confusion matrix clearly illustrates the relationship between the model’s predicted categories and the actual true categories within the test set. The CSSOA-RF spectral tracing identification model misclassified only one sample from category 2 as W-1, while accurately identifying the categories of the remaining seven samples, demonstrating the model’s excellent classification performance.
Additionally, the model’s generalization performance needs further evaluation. Using the constructed database, a five-fold cross-validation method with 20 repetitions was employed to assess the generalization ability of the tracing identification model. The results showed that the accuracy of all repeated cross-validations reached 100%, further proving the excellent generalization performance of the CSSOA-RF tracing prediction model. This validation confirms the model’s applicability to spectral tracing technology and indicates its superior identification performance when applied to the spectral water source database of the Donghuantuo mine.
In this study, spectral tracing technology was employed to measure the spectra of collected samples, leading to the construction of a spectral database for inrush water sources in the Donghuantuo mine. A machine learning adaptive parameter optimization tracing identification model was built using Python to complement this database. The performance of the constructed tracing identification model was evaluated based on existing data. The entire process, from data acquisition to result identification, took 34 min, significantly less than the time required by current traditional methods. The results indicate that this model could accurately identify the inrush water sources of the main aquifers in the Donghuantuo mine, demonstrating reliable performance.
The spectral tracing identification method was very successful in Donghuantuo Mine. In order to verify the application of this method in other mining areas, the method was applied to Huangyuchuan Mine, Daliuta Mine in Shaanxi Province, and Fengfeng Mining Area in Hebei Province. The accuracy rate of verification was always above 90%.
5. Conclusions
This study addressed the complex hydrogeological conditions and frequent inrush water incidents in the Donghuantuo coal mine by systematically collecting water samples from the primary aquifers in the mining area. A total of 40 samples from four main aquifers were collected and subjected to detailed spectral measurements. Based on these data, a spectral database for inrush water sources in the Donghuantuo mine was established. A novel spectral tracing technology was adopted, aiming to rapidly and accurately identify inrush water sources. Traditional methods often fail when dealing with complex water quality types and similar physical parameters, prompting the need for a new, more accurate, and reliable method. The key research findings are as follows:
CSSOA-RF Spectral Tracing Identification Model: By using the chaos sparrow search optimization algorithm (CSSOA) to optimize the key parameters of the random forest (RF) model, the CSSOA-RF spectral tracing identification model was constructed. The CSSOA algorithm, through the introduction of chaotic perturbations and Gaussian mutations, overcame the limitations of traditional sparrow search algorithms that tend to get trapped in local optima. This improved optimization efficiency and the model’s global search capability. The optimized RF model achieved optimal parameter selection, providing reliable technical support for tracing identification. In the test set, the CSSOA-RF model demonstrated excellent classification performance, achieving 100% accuracy, with only one sample misclassified, indicating the model’s outstanding classification ability and generalization performance. The confusion matrix visualization further confirmed the model’s accuracy and stability in practical applications. This result validates the effectiveness and practicality of spectral tracing technology in identifying mine inrush water sources.
Innovative and Reliable Method for Inrush Water Source Identification: This research provides a new, more accurate, and reliable method for identifying inrush water sources, addressing the shortcomings of traditional methods in handling complex water quality conditions. The model helps in quickly identifying inrush water sources in coal-bearing regions of North China, reducing disaster losses and enhancing mine safety. Additionally, the spectral database and CSSOA-RF model developed in this study offer valuable references for future related research.
Given the relatively simple geological structure of the study area, this research achieved high accuracy in identifying single-source water samples. For mixed water samples measured in the laboratory, accurate identification results were obtained for different mixing ratios, demonstrating the potential and reliability of this method in practical applications. However, the applicability and accuracy of this method need further validation and optimization under more complex geological conditions and real-world scenarios with multiple water sources. Future research should target more complex hydrogeological conditions, explore broader application scenarios, and further enhance the model’s robustness and practicality.
