Article

A Novel Integrated Approach to Assess Groundwater Appropriateness for Agricultural Uses in the Eastern Coastal Region of India

by
Shunmuga Priya Kaliyappan
1,
Fahdah Falah ben Hasher
2,
Hazem Ghassan Abdo
3,
Pazhuparambil Jayarajan Sajil Kumar
4 and
Balamurugan Paneerselvam
5,6,*
1
Department of Civil Engineering, Nehru Institute of Technology, Coimbatore 641105, India
2
Department of Geography and Environmental Sustainability, College of Humanities and Social Sciences, Princess Nourah bint Abdulrahman University, P.O. Box 84428, Riyadh 11671, Saudi Arabia
3
Geography Department, Faculty of Arts and Humanities, Tartous University, Tartous P.O. Box 2147, Syria
4
Hydrogeology Group, Institute of Geological Sciences, Freie Universität Berlin, 12249 Berlin, Germany
5
Center of Excellence in Interdisciplinary Research for Sustainable Development, Chulalongkorn University, Bangkok 10330, Thailand
6
Department of Community Medicine, Saveetha Medical College, SIMATS, Chennai 602105, India
*
Author to whom correspondence should be addressed.
Water 2024, 16(18), 2566; https://doi.org/10.3390/w16182566
Submission received: 28 July 2024 / Revised: 2 September 2024 / Accepted: 4 September 2024 / Published: 10 September 2024
(This article belongs to the Section Oceans and Coastal Zones)

Abstract

:
Due to the increase in demand for water, the rapid growth of urbanization and industrialization is the main threat to the source and quality of groundwater. The present study aimed to assess the suitability of groundwater for agricultural purposes in coastal regions using integrated approaches such as the saltwater mixing index (SWMI), the mineral saturation index (MSI), the agriculture suitability index (ASI), and unsupervised machine learning (USML) techniques. The result of the SWMI revealed that 20 and 17 sample locations were highly affected by saltwater intrusion in the study region’s northern and southeastern parts during the pre- and post-monsoon seasons. The detailed analysis of electrical conductivity in groundwater revealed that 19.64% and 14.29% of the samples were unfit for irrigation purposes, especially five sample locations, during both seasons. Regarding the overall suitability of groundwater for irrigation uses, the ASI values divulged that 8.9% of the samples were unsuitable for irrigation purposes. The spatial analysis of the ASI value indicated that 43.19 and 85.33 sq. km of area were unsuitable for irrigation practices. Additionally, the USML techniques identified the most influenced parameters such as Ca2+, Mg2+, Cl, and SO42− during both seasons. The present study results help maintain proper, sustainable water management in the study region.

1. Introduction

The rapid increase in urbanization, industrialization, and population density is the primary factor for the current variation in climatic conditions [1,2]. The change in climatic conditions and the increasing earth temperature are gradually increasing the seawater levels. Approximately half of the world’s population (3 billion people) live within 200 km of a coastline, a number which is predicted to double by 2025 [3]. The coastal region and its surroundings are the habitats of a more significant proportion of people in developing countries like India, China, Bangladesh, Iran, and Tunisia. In the main developed countries, economic sources comprising transportation, industrial activities, urban planning and development, food production, and tourism are based in coastal regions [4,5,6]. An increase in population growth and the improper disposal of waste into seawater bodies are threatening the seawater ecosystem. This results in changes in climatic conditions, inadequate rainfall, ice melting, and rising seawater levels. The increase in sea levels leads to seawater intrusion (SWI) and freshwater contamination on land surfaces. Recently, the source of surface water bodies and their use for daily purposes have been reduced due to anthropogenic activities. In general, arid and semi-arid regions like India, China, Bangladesh, and Pakistan majorly depend on groundwater for domestic, agricultural, and industrial purposes [7,8,9].
Within the concept of SWI, naturally, the elevation in seawater levels is lower than groundwater elevation, allowing groundwater to flow toward the seawater interface [10,11,12]. The overexploitation of groundwater causes empty spaces and depression zones, which allows seawater to be drawn toward the freshwater supply in coastal aquifers [13]. The impact of the overexploitation of groundwater in and around coastal regions and rising seawater levels are significant factors that cause SWI, reverse groundwater flows’ direction, and impact coastal aquifer vulnerability. SWI, by altering the presence of minerals and causing reactions between existing minerals and seawater, causes drastic changes in the natural characteristics of coastal aquifers. An increase in SWI, remodifying coastal aquifers’ characteristics, has a negative impact on groundwater quality, and ecosystem degradation affects coastal infrastructure activities and tourism [14,15,16]. The quality of groundwater is seriously affected by SWI; for example, mixing 1% of seawater increases the chloride content in fresh groundwater by ≈250 mg/L, making it unsuitable for drinking purposes [17]. Restoring aquifers affected by SWI takes more than decades and up to centuries for the seawater to be fully flushed out by fresh groundwater [18,19,20,21,22]. SWI affects soil structures’ physical and chemical properties, resulting in reduced crop yields, vegetation and crop patterns, and natural soil fertilizers. Thus, combining research on coastal aquifers’ vulnerability with groundwater quality assessments can be beneficial toward sustainable groundwater resource protection [23,24,25].
In general, the Indian economy is mainly based on agriculture and its related businesses. The present research focused on SWI and its impact on the use of groundwater resources for agricultural purposes in the semi-arid regions of Southern India [26,27]. Gopinath et al., in 2019 [28], investigated groundwater quality characterization, aided by seawater intrusion, in a coastal aquifer in Southern India. They stated that saltwater intrusion was confirmed by the excess concentration of Na and Cl ions in the groundwater. Also, 35 and 30% of the samples in the eastern part of the study area were contaminated due to seawater intrusion during the dry and wet seasons. Slama et al., in 2022 [29], conducted detailed research on delineating the source of groundwater salinity and its impact on the irrigation plains in the northeastern part of Tunisia. They revealed that the inverse flow of groundwater in the coastal plain, the ion exchange process, and the dissolution of minerals were the primary processes determining groundwater quality in that coastal region. Hassan et al., in 2022 [30], assessed groundwater quality seasonal variations using statistical techniques in the coastal area of Turkey and described that Wilcox’s test [31] and the United States Salinity Laboratory (USSL) diagram are effective methods of estimating the quality of groundwater for irrigation purposes. Several research efforts [32,33,34,35] have been carried out to assess the quality of groundwater and its suitability for drinking and irrigation purposes using the water quality index (WQI), the seawater mixing index (SMI), hydrofacial diagrams, and other statistical methods under various climatic condition in coastal zones worldwide.
Many coastal region studies around the world have reported that excess concentrations of electrical conductivity (EC), total dissolved solids (TDSs), and chloride (Cl) are significant parameters that highly influence the chemical equilibrium of groundwater [36]. The most essential methods for the identification of SWI in a coastal aquifer are the chlorinity index (CI) and the seawater mixing index (SMI) [37]. The concentration of TDS in groundwater increases with an increase in saltwater flow toward the inland surface. Deposits of salt from SWI, soil structures, and the disposal of municipal waste in and around coastal regions are significant reasons for excess TDS in groundwater [38]. The increase in the concentration of TDS leads to an increase in the salinity of water and soil, which affects the entire agricultural industry. Irrigation indices, namely the sodium absorption ratio, percentage sodium, the magnesium absorption ratio, the permeability index, potential salinity, residual sodium carbonate, and Kelly’s ratio, are the standard methods to evaluate the suitability of groundwater for irrigation purposes [39,40,41,42].
The agricultural industry is the primary source of income for the people living in the area currently under study. Seawater intrusion causes severe damage to crop growth and yield. Based on studies in the literature, in recent years, there has been no evidence to assess seawater intrusion and groundwater quality suitability appraisals for agricultural purposes in the Pudukkottai District, in Southern India. The specific research objectives of the present study include (i) assessing the physio-chemical composition of groundwater in and around the coastal region, (ii) evaluating the impact of SWI in the coastal region, (iii) developing an agriculture suitability index model for irrigation purposes, and (iv) identifying the source of contamination using a multivariate statistical approach. The present study’s uniqueness is that it employs an integrated approach to assess the impact of SWI in the coastal region studied. The present study results support remedial measures to improve water supply management and sustainable practices in the study region.

2. Materials and Methods

2.1. Study Area

The Pudukkottai District is one of the rapidly developing regions in the Tamilnadu province, in Southern India. It borders the Thanjavur District to the northeast and east, the Ramanathapuram District to the southwest, the Sivagangai District to the west, and the Palk Strait (coastal region) to the southeast. The total length of the coastline is 42 km, and the total area occupied by the district is 4649.97 km2. The study area lies between 78°25′ and 79°15′ E longitude and 9°50′ and 10°40′ N latitude. Based on Copernicus Climate Change Service (CCCS) data between 1991 and 2021 [43], the study region has tropical climatic conditions, with an average maximum and minimum temperature of 37.1 °C and 20 °C, respectively (Figure 1). The study region is hot and dry from April to June. The average maximum amounts of precipitation received during the northeastern monsoon are 102 mm in September, 195 mm in October, 203 mm in November, and 86 mm in December. The average annual rainfall recorded throughout the district is 925 mm. The rainfall pattern gradually increases from east to southwest in the study region.

2.2. Geological Composition

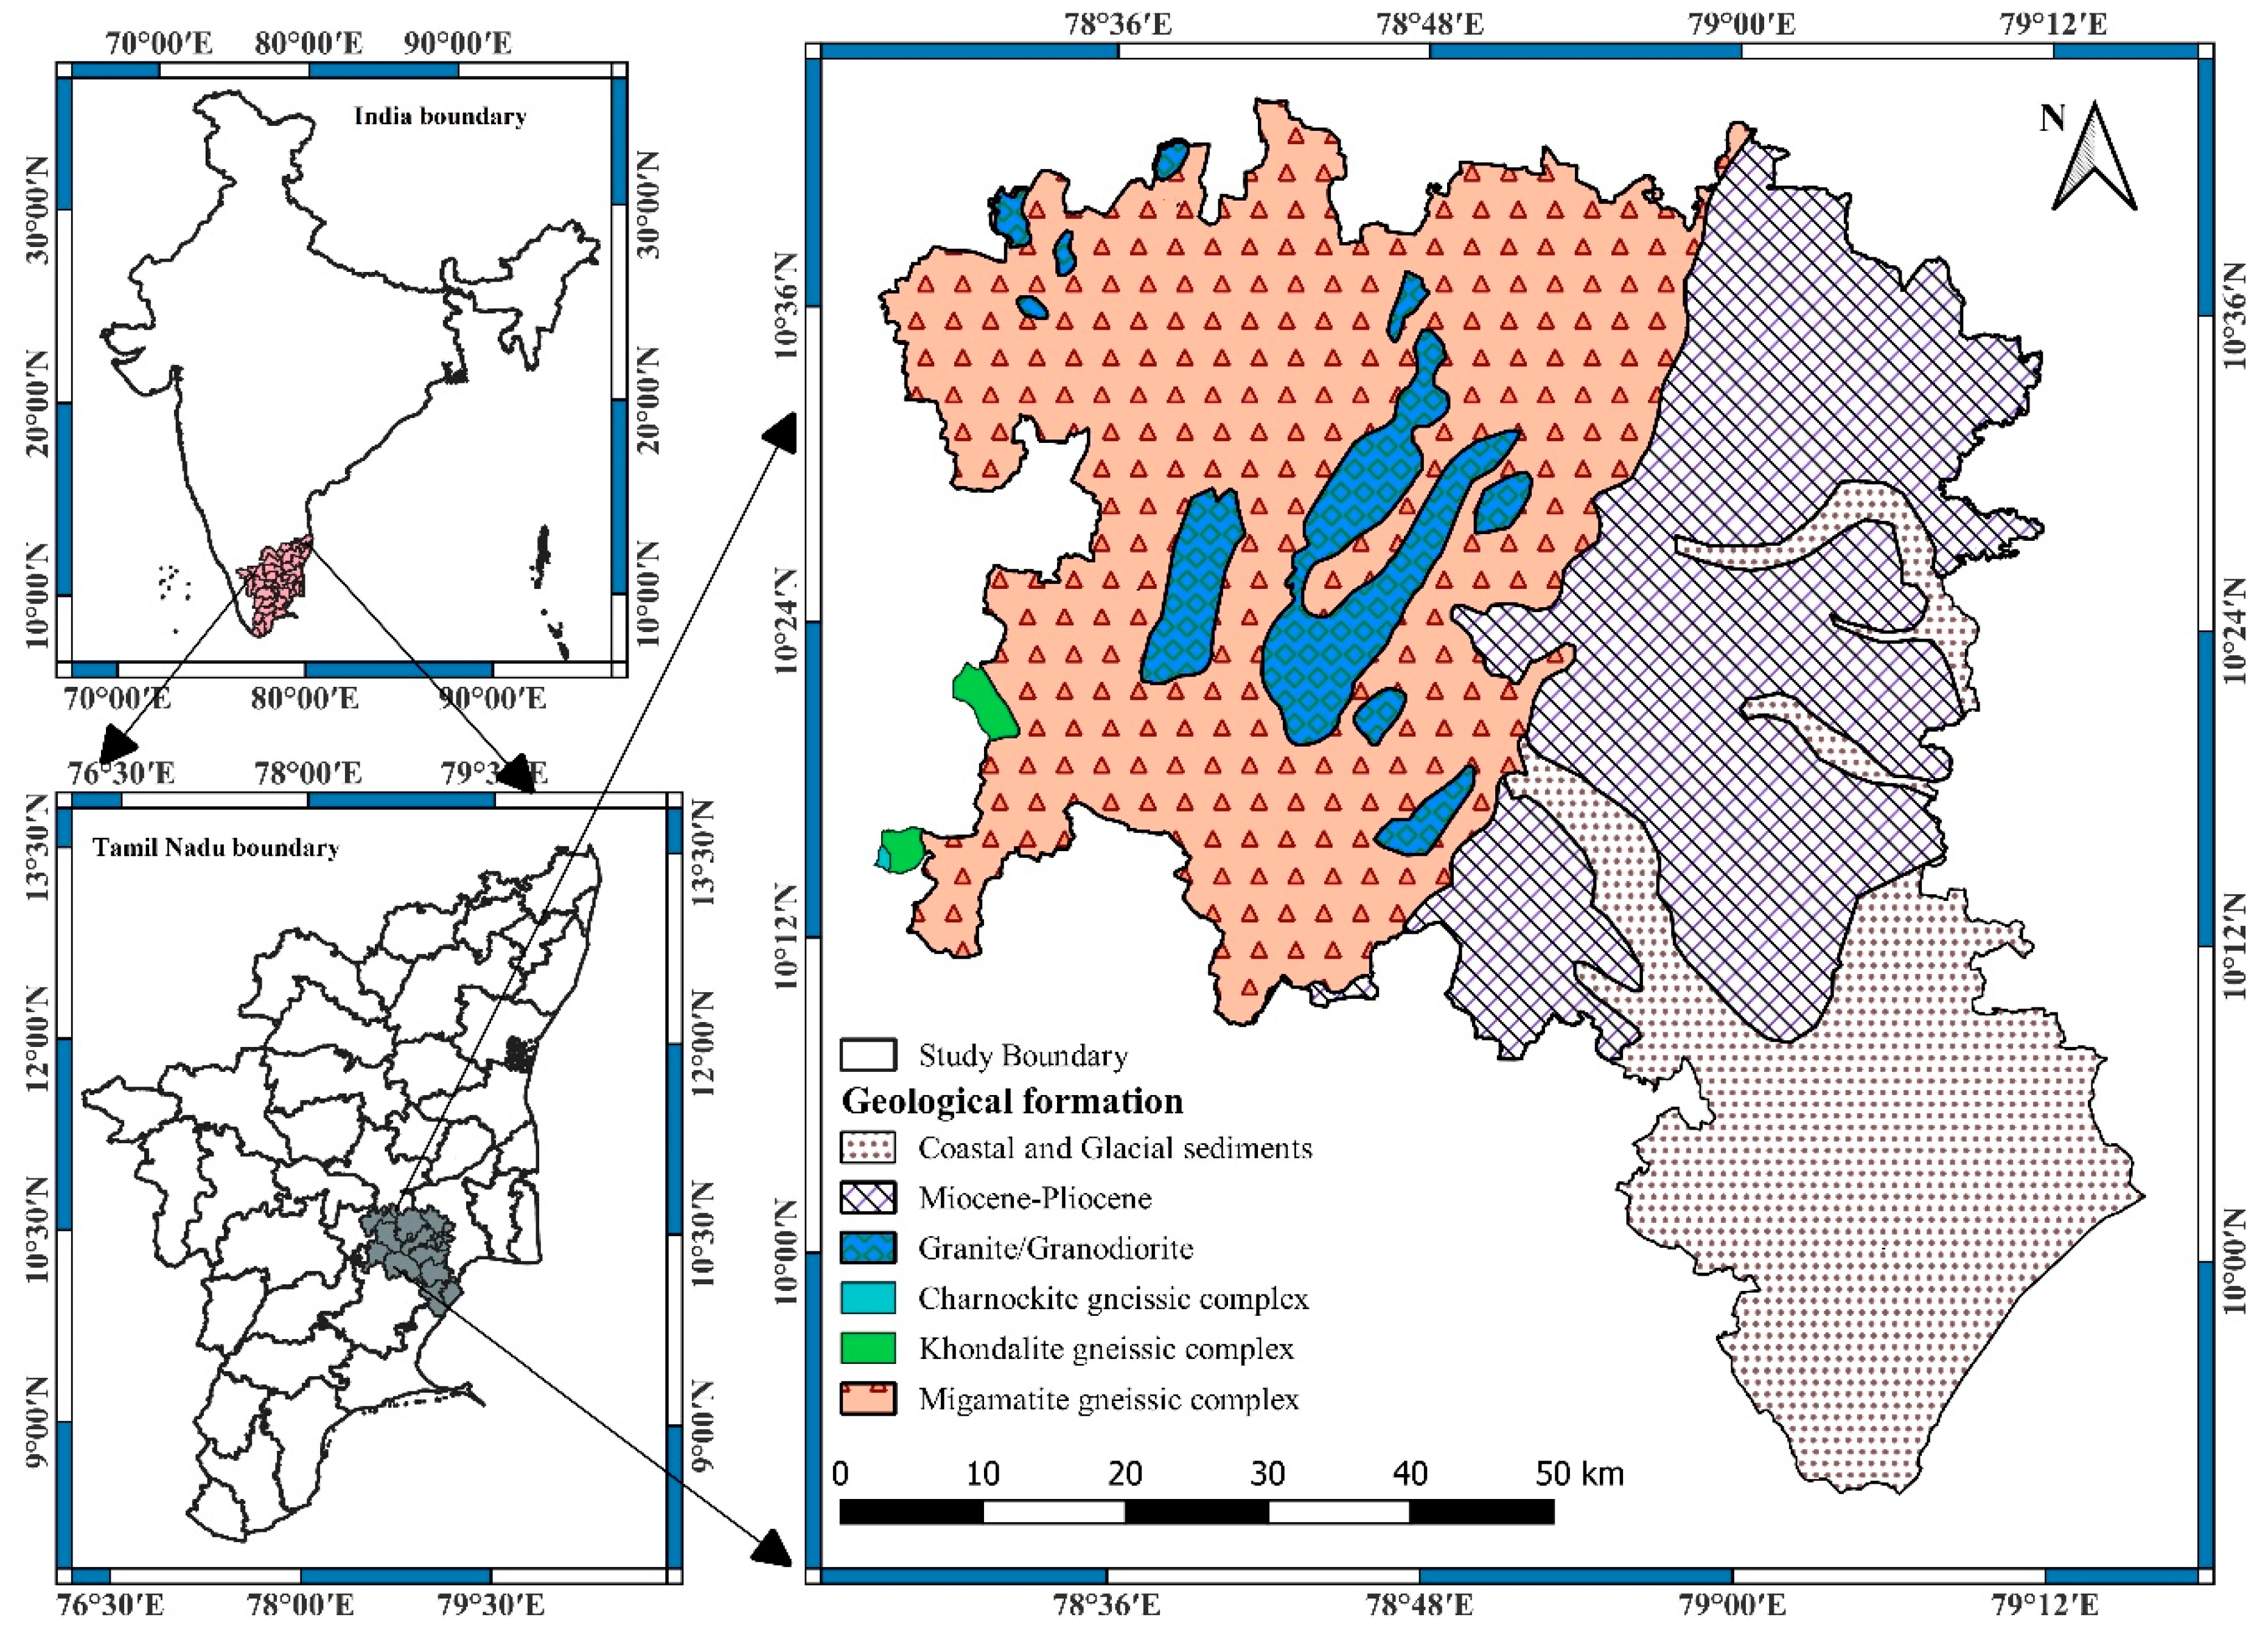
The geological makeup of the study region is 60% Archean hard rocks and 40% quaternary sedimentary rocks, covering the region in its entirety [44]. The spatial analysis of the region’s geological composition reveals that hard rocks can be identified in the western part and that sedimentary rocks can be identified on the eastern side. In the study area, charnockite, gneisses, khondalite, migmatite, biotite, granite, and quartz are identified in the eastern and northeastern parts. The western and central parts of the study region are covered by gneiss rocks, charnockite, and granites, respectively. The remaining 40% of the study region is covered by clay, gravel, sandstone, and salty mud, found near coastal areas (Figure 2).

2.3. Hydrogeology

In the study region, groundwater can be found under phreatic conditions at shallow depths, semi-confined conditions in fractured aquifers, and, in some case, both phreatic and confined condition in aquifers. The groundwater in this area has been identified within different ranges such as in two fracture zones less than 50 m bgl, two fracture zones between 50 and 100 m bgl, and one fracture zone from 100 to 150 m and 150 to 200 m bgl. In some parts of the study area, porous formations have been identified, and the depth of the aquifers is less than 100 m bgl (shallow aquifers), with deeper aquifers ranged from 100 to 450 m bgl. Shallow aquifers are generally found in the northwestern part, and deeper aquifers are found in the southeastern part of the study region [45].

2.4. Agricultural Pattern

Agriculture is the predominant source of income for people living in the study area. In recent years, the lack of frequent monsoons has resulted in dry-land farming being the main type of agricultural practice in the entire region. The production of rice, wheat, maize, and millets is high during the wet season. On other hand, orchards are another important dry-farming strategy, requiring a minimal amount of water for irrigation. The main fruit crops are mangoes, jackfruits, guavas, and bananas, frequently cultivated in various parts of this district. Except for bananas, all other fruit types are cultivated on lateritic soil belts. The types of crops cultivated in the study area indicate that groundwater is the only source of water for the irrigation of major crops. In the study area, 57.62% of the area is occupied by red sterile soil, 32.94% by fluvial alluvial soil, and 9.44% by saline coastal alluvial soil.

2.5. Methodology

2.5.1. Sample Collection and Analysis

The study region experiences a tropical climate and is an agriculture-based area. The samples were collected pre and post monsoon season in certain locations. The sample locations were identified based on zones highly related to coastal activities and areas with a very high density of population, agricultural fields, and close to municipal dumping yards, as well as based on the availability of groundwater sources and human use. Non-random sampling techniques were followed to collect samples in the study area. The water samples were collected and stored in pre-washed one-liter polyethene water bottles and kept at 4 °C in the laboratory. The physical and chemical properties of the water were estimated following the standard methods recommended by the American Public Health Association [46]. The chemical analysis procedure, including the equipment used in the experiments, referred to [47]. Particularly, a flame photometer (S-931) was used for sodium and potassium estimation, UV–visible spectroscopy (LMSP UV1000B) was used for sulfate and nitrate estimation, and an ion-selective electrode (at 25 °C) was used for the estimation of fluoride ions. After the analysis of the water quality parameters, the ionic balance error (IBE) was calculated to confirm the accuracy of the analysis using the following formula:
I B E = c a t i o n s a n i o n s c a t i o n s + a n i o n s × 100

2.5.2. Agriculture Suitability Index (ASI)

The novelty of the present study is that it develops a single index value to represent the overall suitability of groundwater quality for agricultural uses based on various irrigation indices (sodium absorption ratio, magnesium absorption ratio, potential salinity, permeability index, percentage sodium, Kelly’s ratio, and residual sodium carbonate). The ASI is an effective method for estimating the effect of anthropogenic and geogenic sources of contamination in groundwater chemistry for irrigation uses. Weightage is assigned to each irrigation index in the first step, and the relative weight is calculated in the second step. The weightage (wi) for each irrigation index was assigned based on its importance for the overall quality of groundwater (Equation (2)). The quality rating (Qi) for each index was calculated during the third step using the standard value (Si), ideal value (Cip), and observed value (Ci) of each parameter, and the sub-index (SIi) for the overall water quality was calculated during the fourth step (Equations (3) and (4)). In step five, the ASI value was calculated by summation of all the sub-index values of each irrigation index (Equation (5) and Figure 3). The detail of the weightage and the ideal value for each irrigation index are tabulated in Table 1. The calculated value of the ASI is classified into six classes, such that the value range from 0 to 50 is excellent, 50 to 100 is good, 100–150 is moderate, 150–200 is poor, and a value greater than 200 is unsuitable for irrigation purposes.
W i = w i i n w i
Q i = C i C i p S i C i p × 100
S I i = W i × Q i
A S I = i = 0 n S I i

2.5.3. Chlorinity Index (CI)

Chloride is a significant parameter of groundwater chemistry in coastal aquifers. The effect of excess chloride in groundwater was computed using the chlorinity index (CI), defining the amount of chloride (g) per kilogram of seawater [48]. The chlorinity index values classify groundwater into five different classes, which are given in Table 2. The present study focused on assessing the groundwater’s quality for irrigation purposes; consequently, evaluating the chloride content in said groundwater was mandatory.

2.5.4. Mineral Saturation Index (MSI)

The presence of minerals in aquifers and soil plays a significant role in groundwater’s chemical equilibrium. Changes in phase and mineral dissolution can be computed by estimating the value of the MSI using the physio-chemical properties of groundwater. The MSI is calculated (Equation (6)) by comparing the mineral dissolution ions’ activity (ionic activity product, IAP) with their solubility product (Ksp). If the value of the MSI is negative, it indicates mineral dissolution, while a positive value indicates precipitation (water–rock interface), and zero indicates that the water and minerals are at a stable equilibrium. In the present study, the MSI value for each sample location was computed using the hydrogeochemical program PHREEQC (PH-Redox-Equilibrium in C language), recommended [49] by the United States Geological Survey (USGS).
M S I = L o g ( I A P K S P )

2.5.5. Seawater Mixing Index (SMI)

Major chemical parameter such as sodium, magnesium, chloride, and sulfate primarily influence groundwater quality during SWI processes [49]. In order to assess the effect of the mixing rate, Park et al., in 2005 [50], developed a model to evaluate the seawater mixing rate in groundwater based on the concentration of sodium, magnesium, chloride, and sulfate (Equation (7)). The percentage relative concentration of sodium, magnesium, chloride, and sulfate are represented as a = 0.31, b = 0.04, c = 0.57, and d = 0.08, respectively [49].
S M I = a × C N a + T N a + + b × C M g 2 + T M g 2 + + c × C C l T C l + d × C S O 4 2 T S O 4 2
where C represents the recorded concentration of ith ions, and T represents the threshold value of the ith parameter calculated from the ith ion’s cumulative probability percentage value. A computed value of the SMI of less than 1 indicates a freshwater zone, while a value greater than 1 suggests saltwater mixing in the freshwater zone [51].

2.5.6. Unsupervised Machine Learning (USML) Techniques

Machine learning techniques are more accurate and effective in analyzing environmental issues. Unsupervised machine learning techniques are beneficial for ordering and grouping data collected from real-life environments [52]. Principal component analysis (PCA) was adopted in the present study to analyze the inter-relations between the parameters and their importance in determining the overall groundwater quality in the study area [53,54].

3. Results

3.1. Suitability of Groundwater Using Various Irrigation Indices

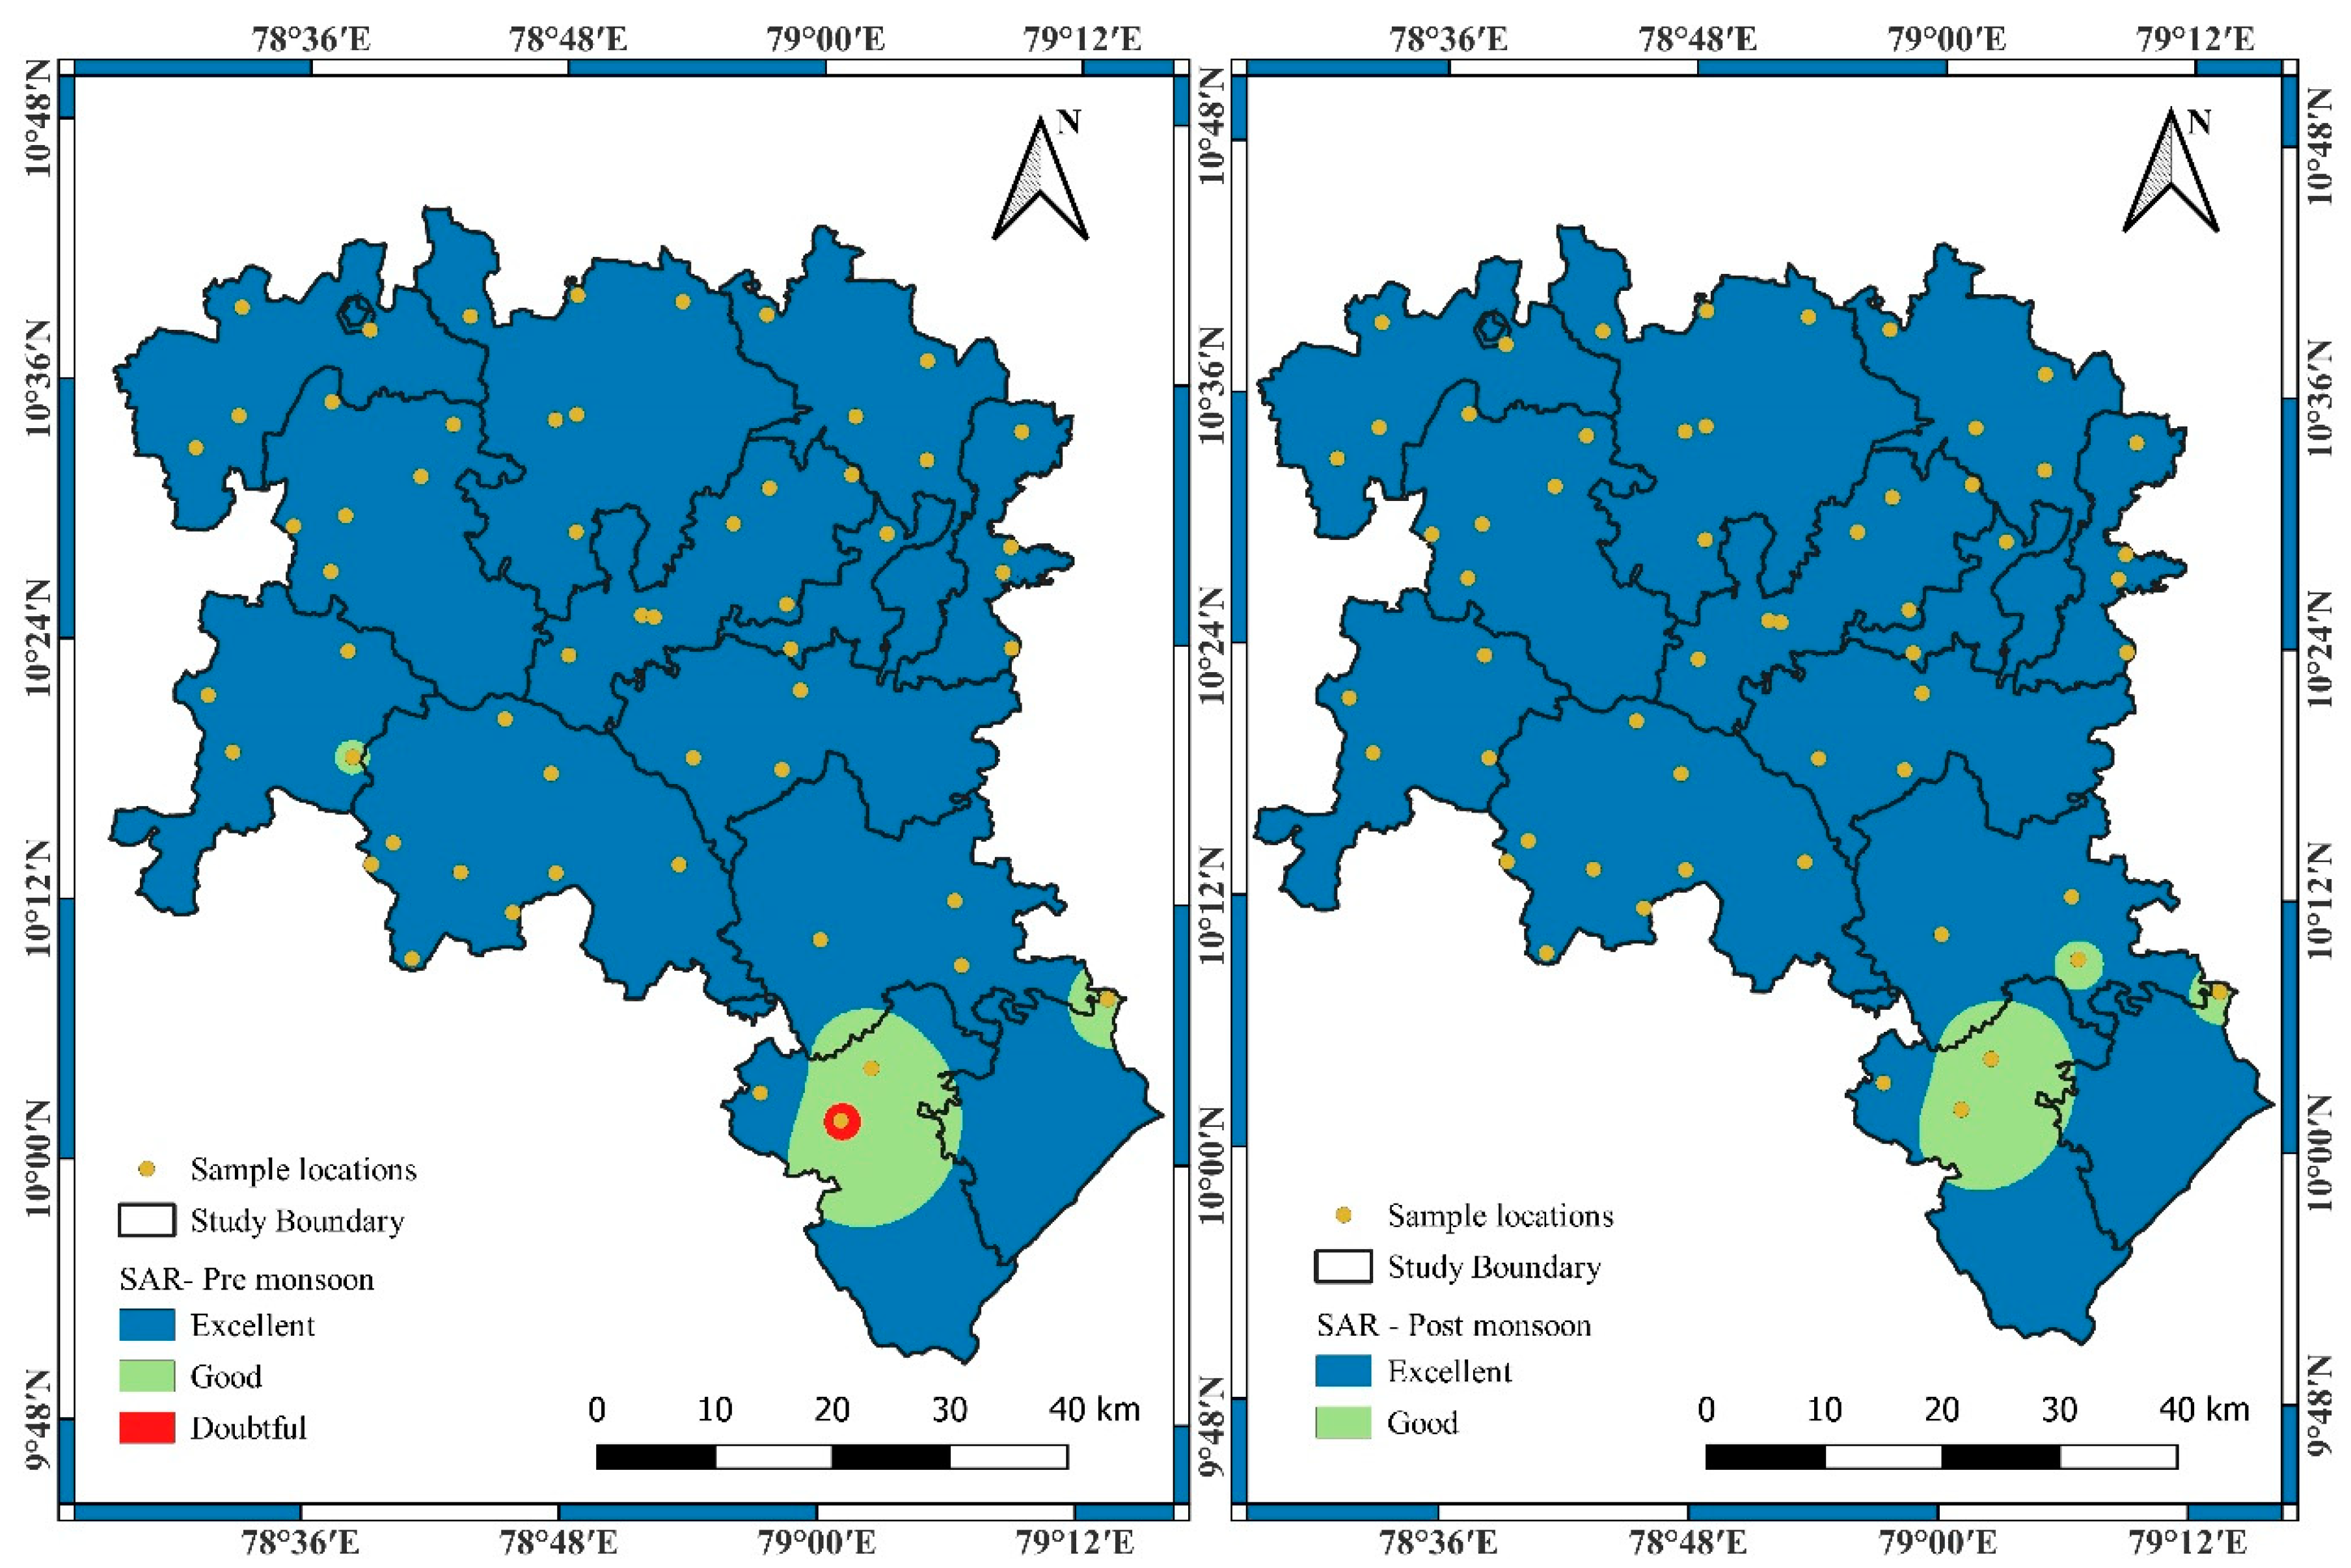
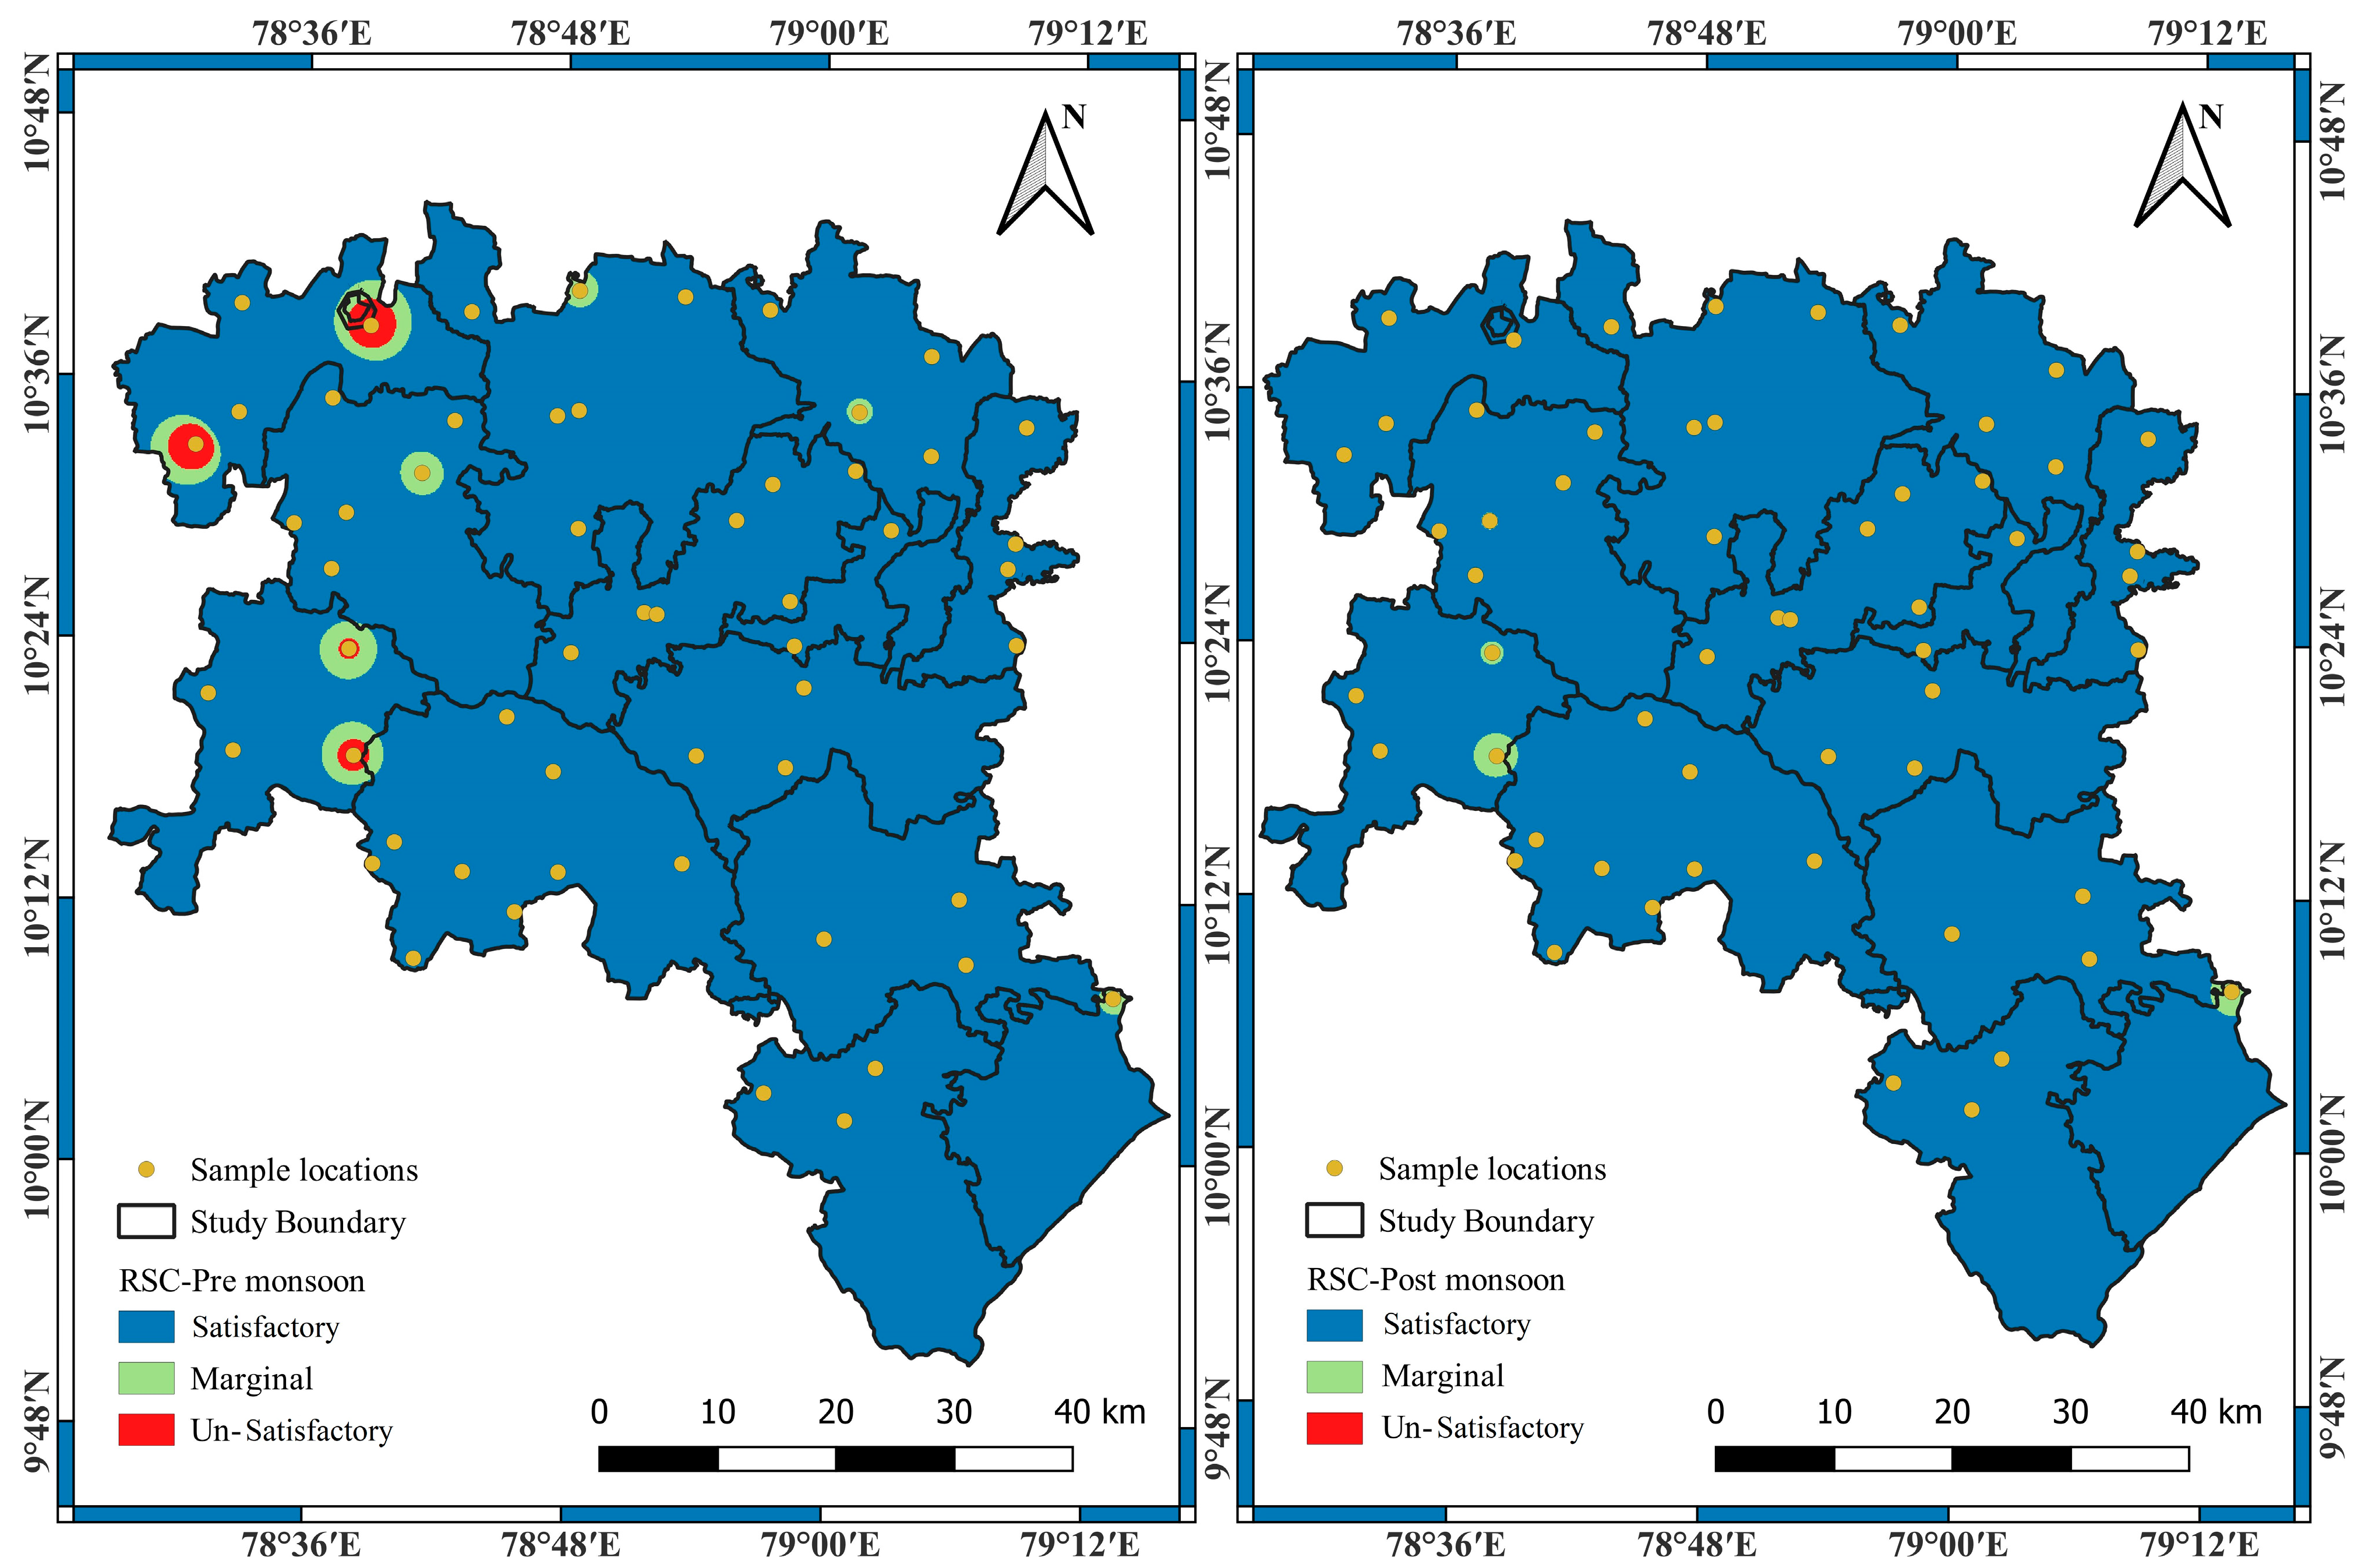
In the present study, the SAR value of each sample was computed and is presented in Table 3 for both seasons. The results show that 92.86 and 89.29% of the sample locations were excellent and that 7.14 and 8.93% of the samples were good pre and post monsoons, respectively. Only 1.79% of the sample (one location) was positioned in a doubtful category with respect to irrigation uses. The results revealed that the concentration of major ions such as calcium, magnesium, and sodium was elevated in the post-monsoon season compared to the pre-monsoon season. The spatial analysis of SAR showed that 4447 sq. km and 4417.4 sq. km of the area were excellent, 202.94 sq. km and 224.91 sq. km of the area were good during both the pre- and post-monsoon season, respectively, and 7.66 sq. km of the area was of a doubtful quality in the post-monsoon season (Figure 4). This study calculated the change in the quality of water and revealed that 3.57% of locations moved from the excellent to the good category and 1.79% shifted from the good to the doubtful category post monsoon. The residual sodium carbonate (RSC) values of the groundwater samples in the study region were satisfactory in 91.07 and 81.14% of cases, marginally polluted in 5.36 and 7.14% of cases, and unsatisfactory for irrigation use in 3.57 and 10.71% of the samples pre and post monsoons, respectively (Table 3). The spatial analysis of the RSC values showed that 4626.1 sq. km and 4524.9 sq. km of the area were satisfactory, 21.63 sq. km and 91.35 sq. km of the area were marginally polluted, and 2.18 and 33.72 sq. km of the area were unsatisfactory during the two seasons (Figure 5). About 8.93% of the samples moved from being excellent to being marginally polluted, 1.78% of the samples moved from being marginally polluted to belonging to the unsatisfactory category, and 7.14% of the samples were extremely contaminated post monsoons. Sodium is a significant water quality parameter for groundwater irrigation suitability [51]. In the present study, the calculated percentage of sodium revealed that 17.86 and 3.57% of the samples were excellent, 32.14 and 23.21% of the samples were good, 26.79 and 39.29% of the samples were permissible, 23.21 and 28.57% of the samples were doubtful, and 0 and 5.36% of the samples were unsuitable (Table 3). The results showed that the concentration of sodium increased post monsoons compared to the pre-monsoon season.
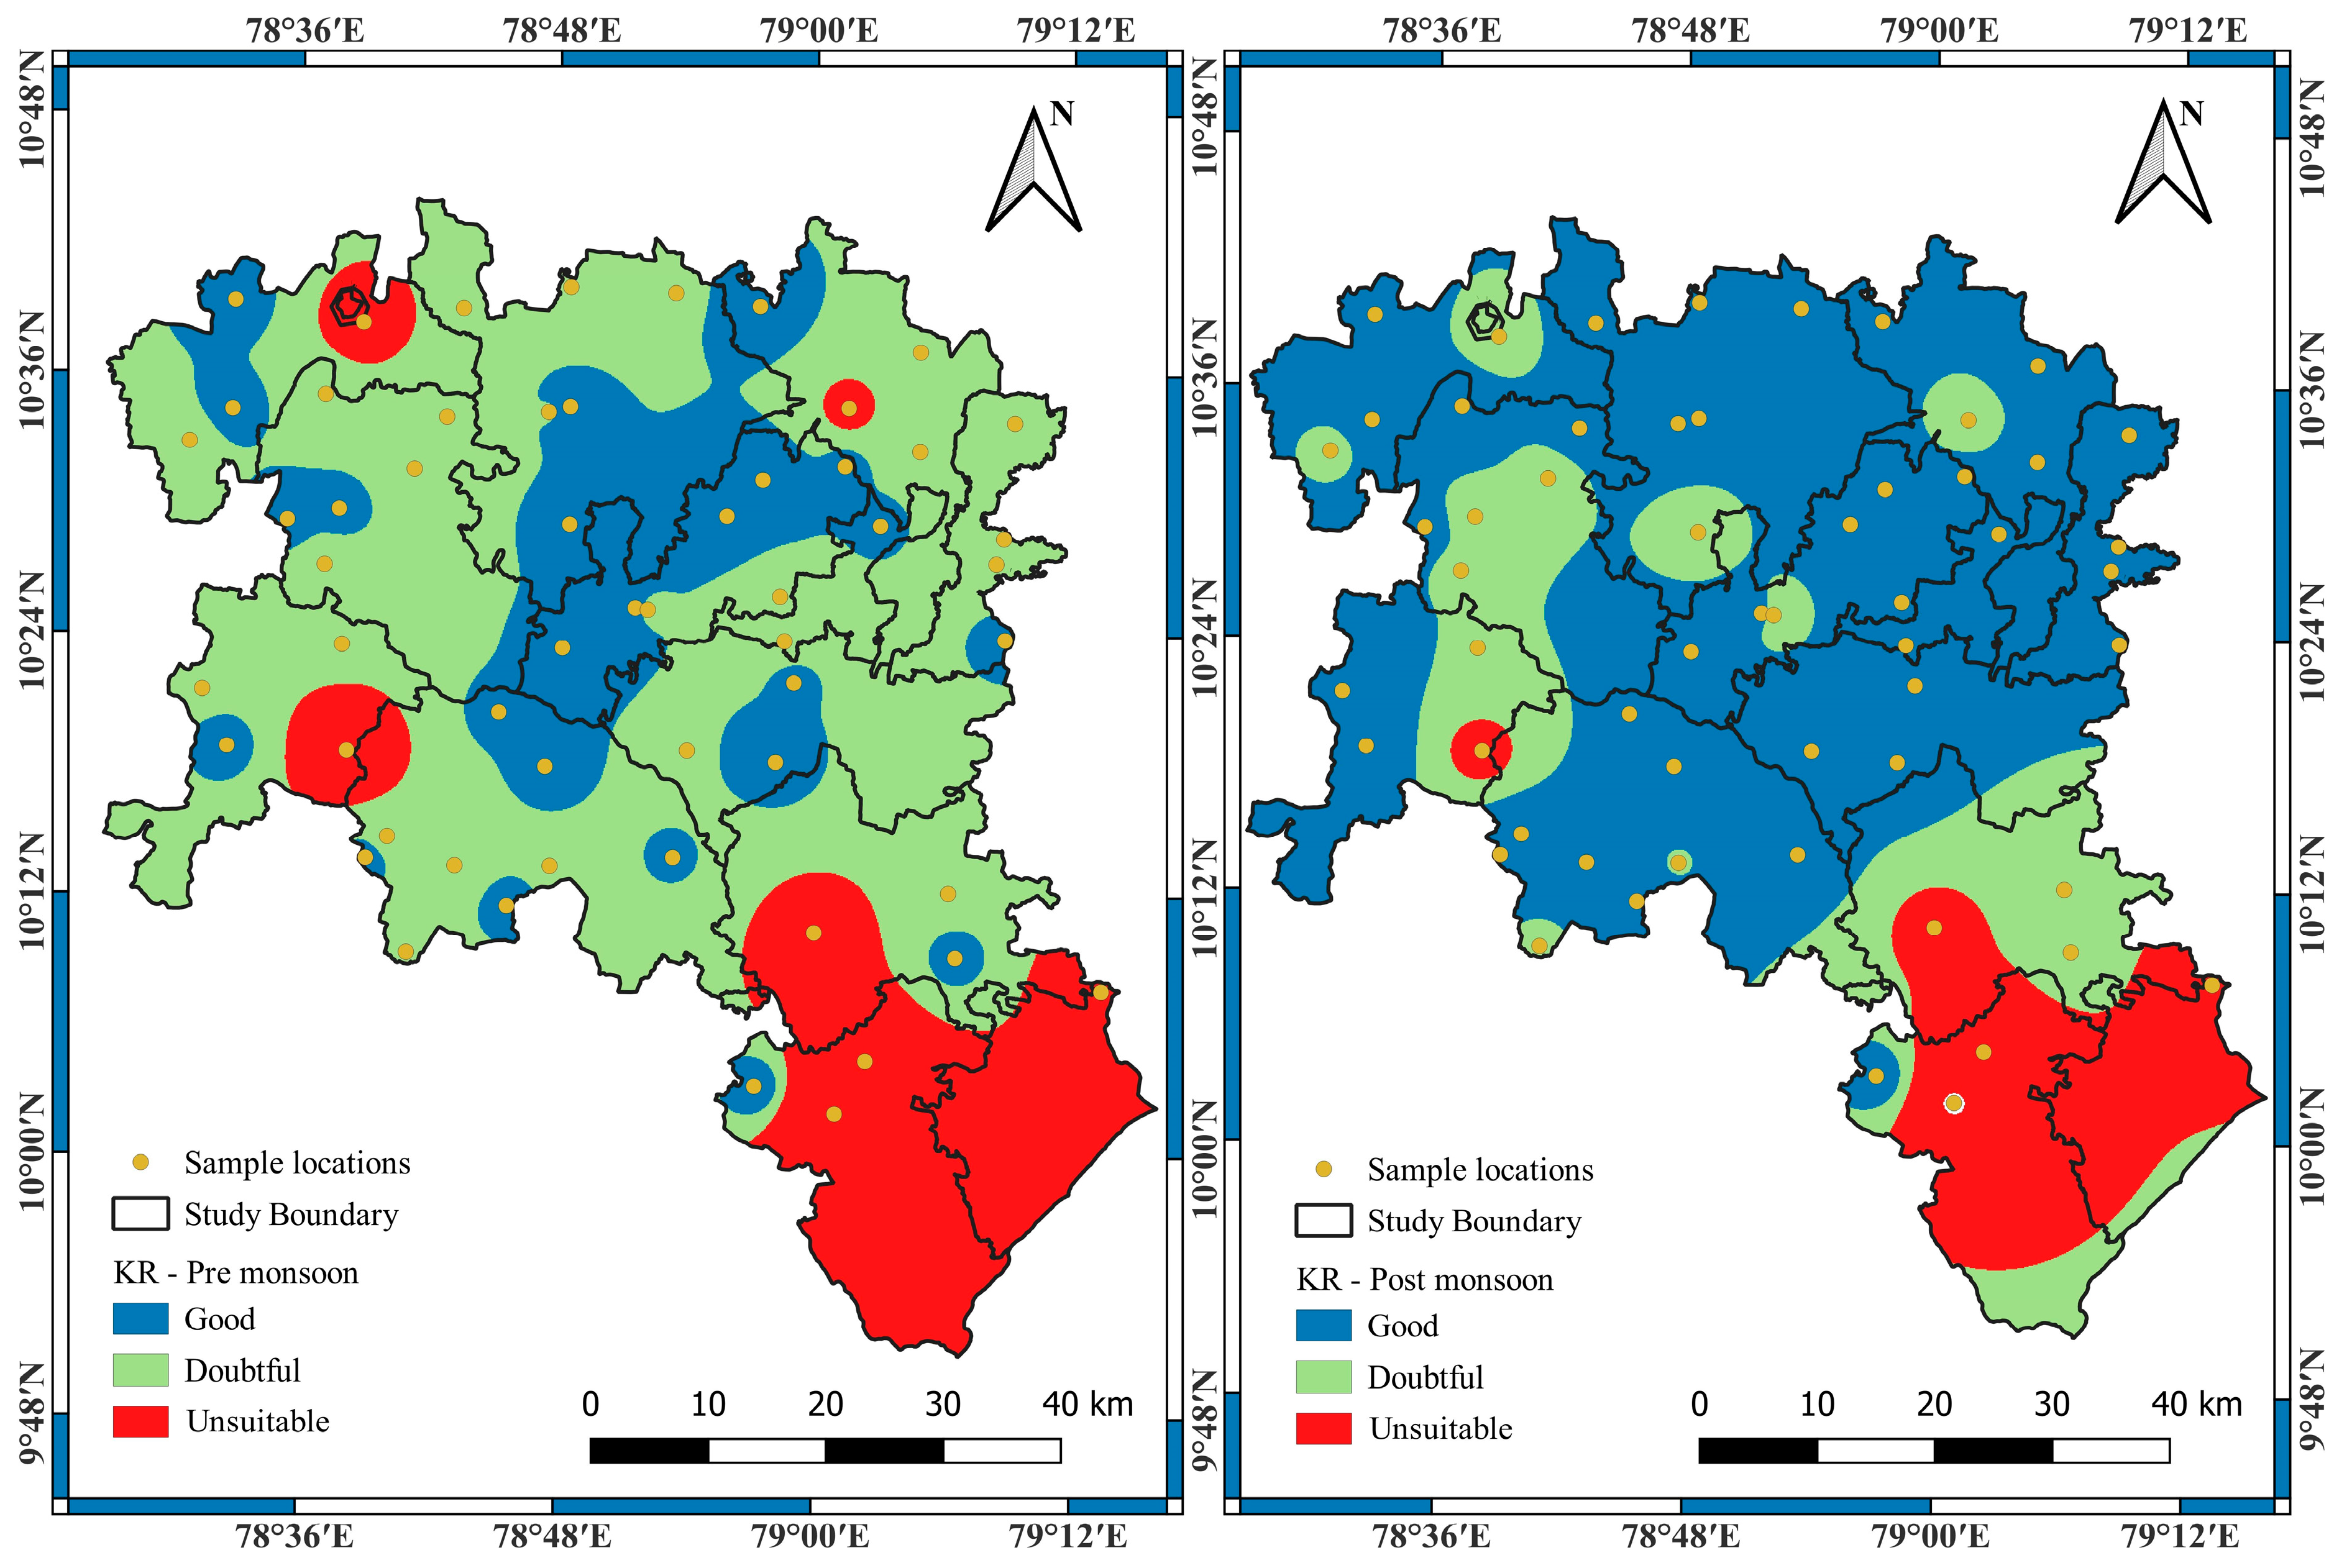
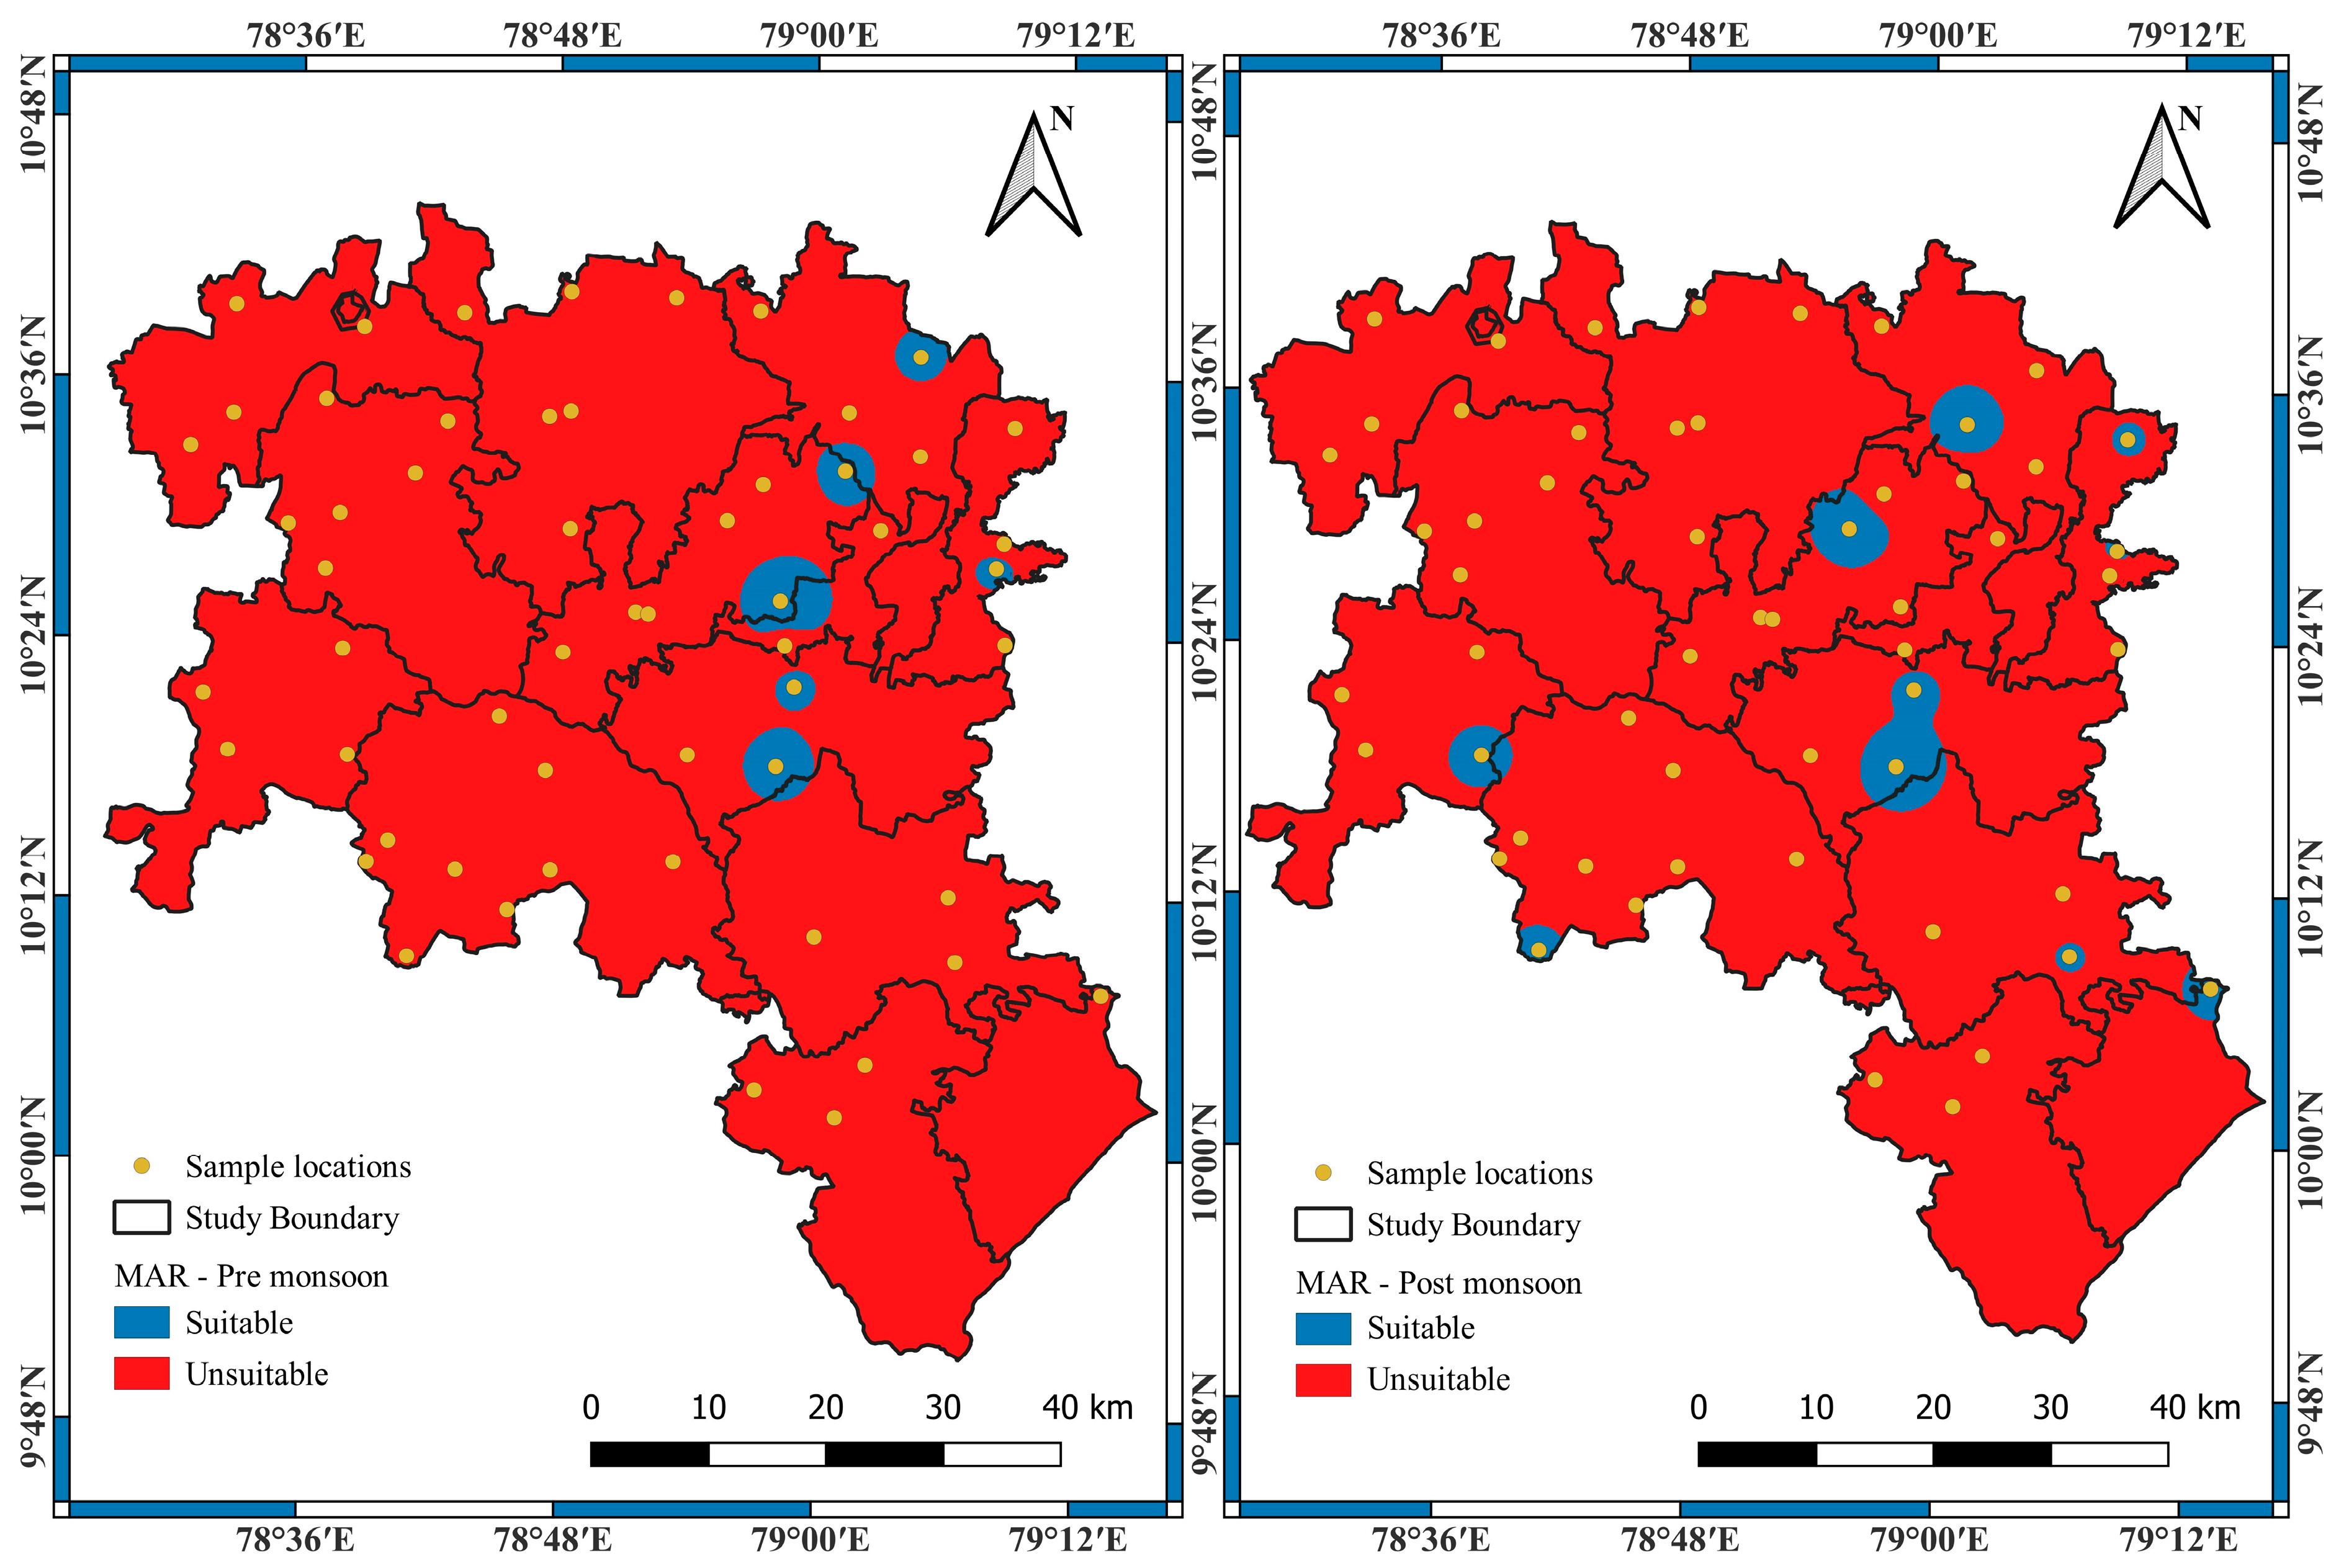
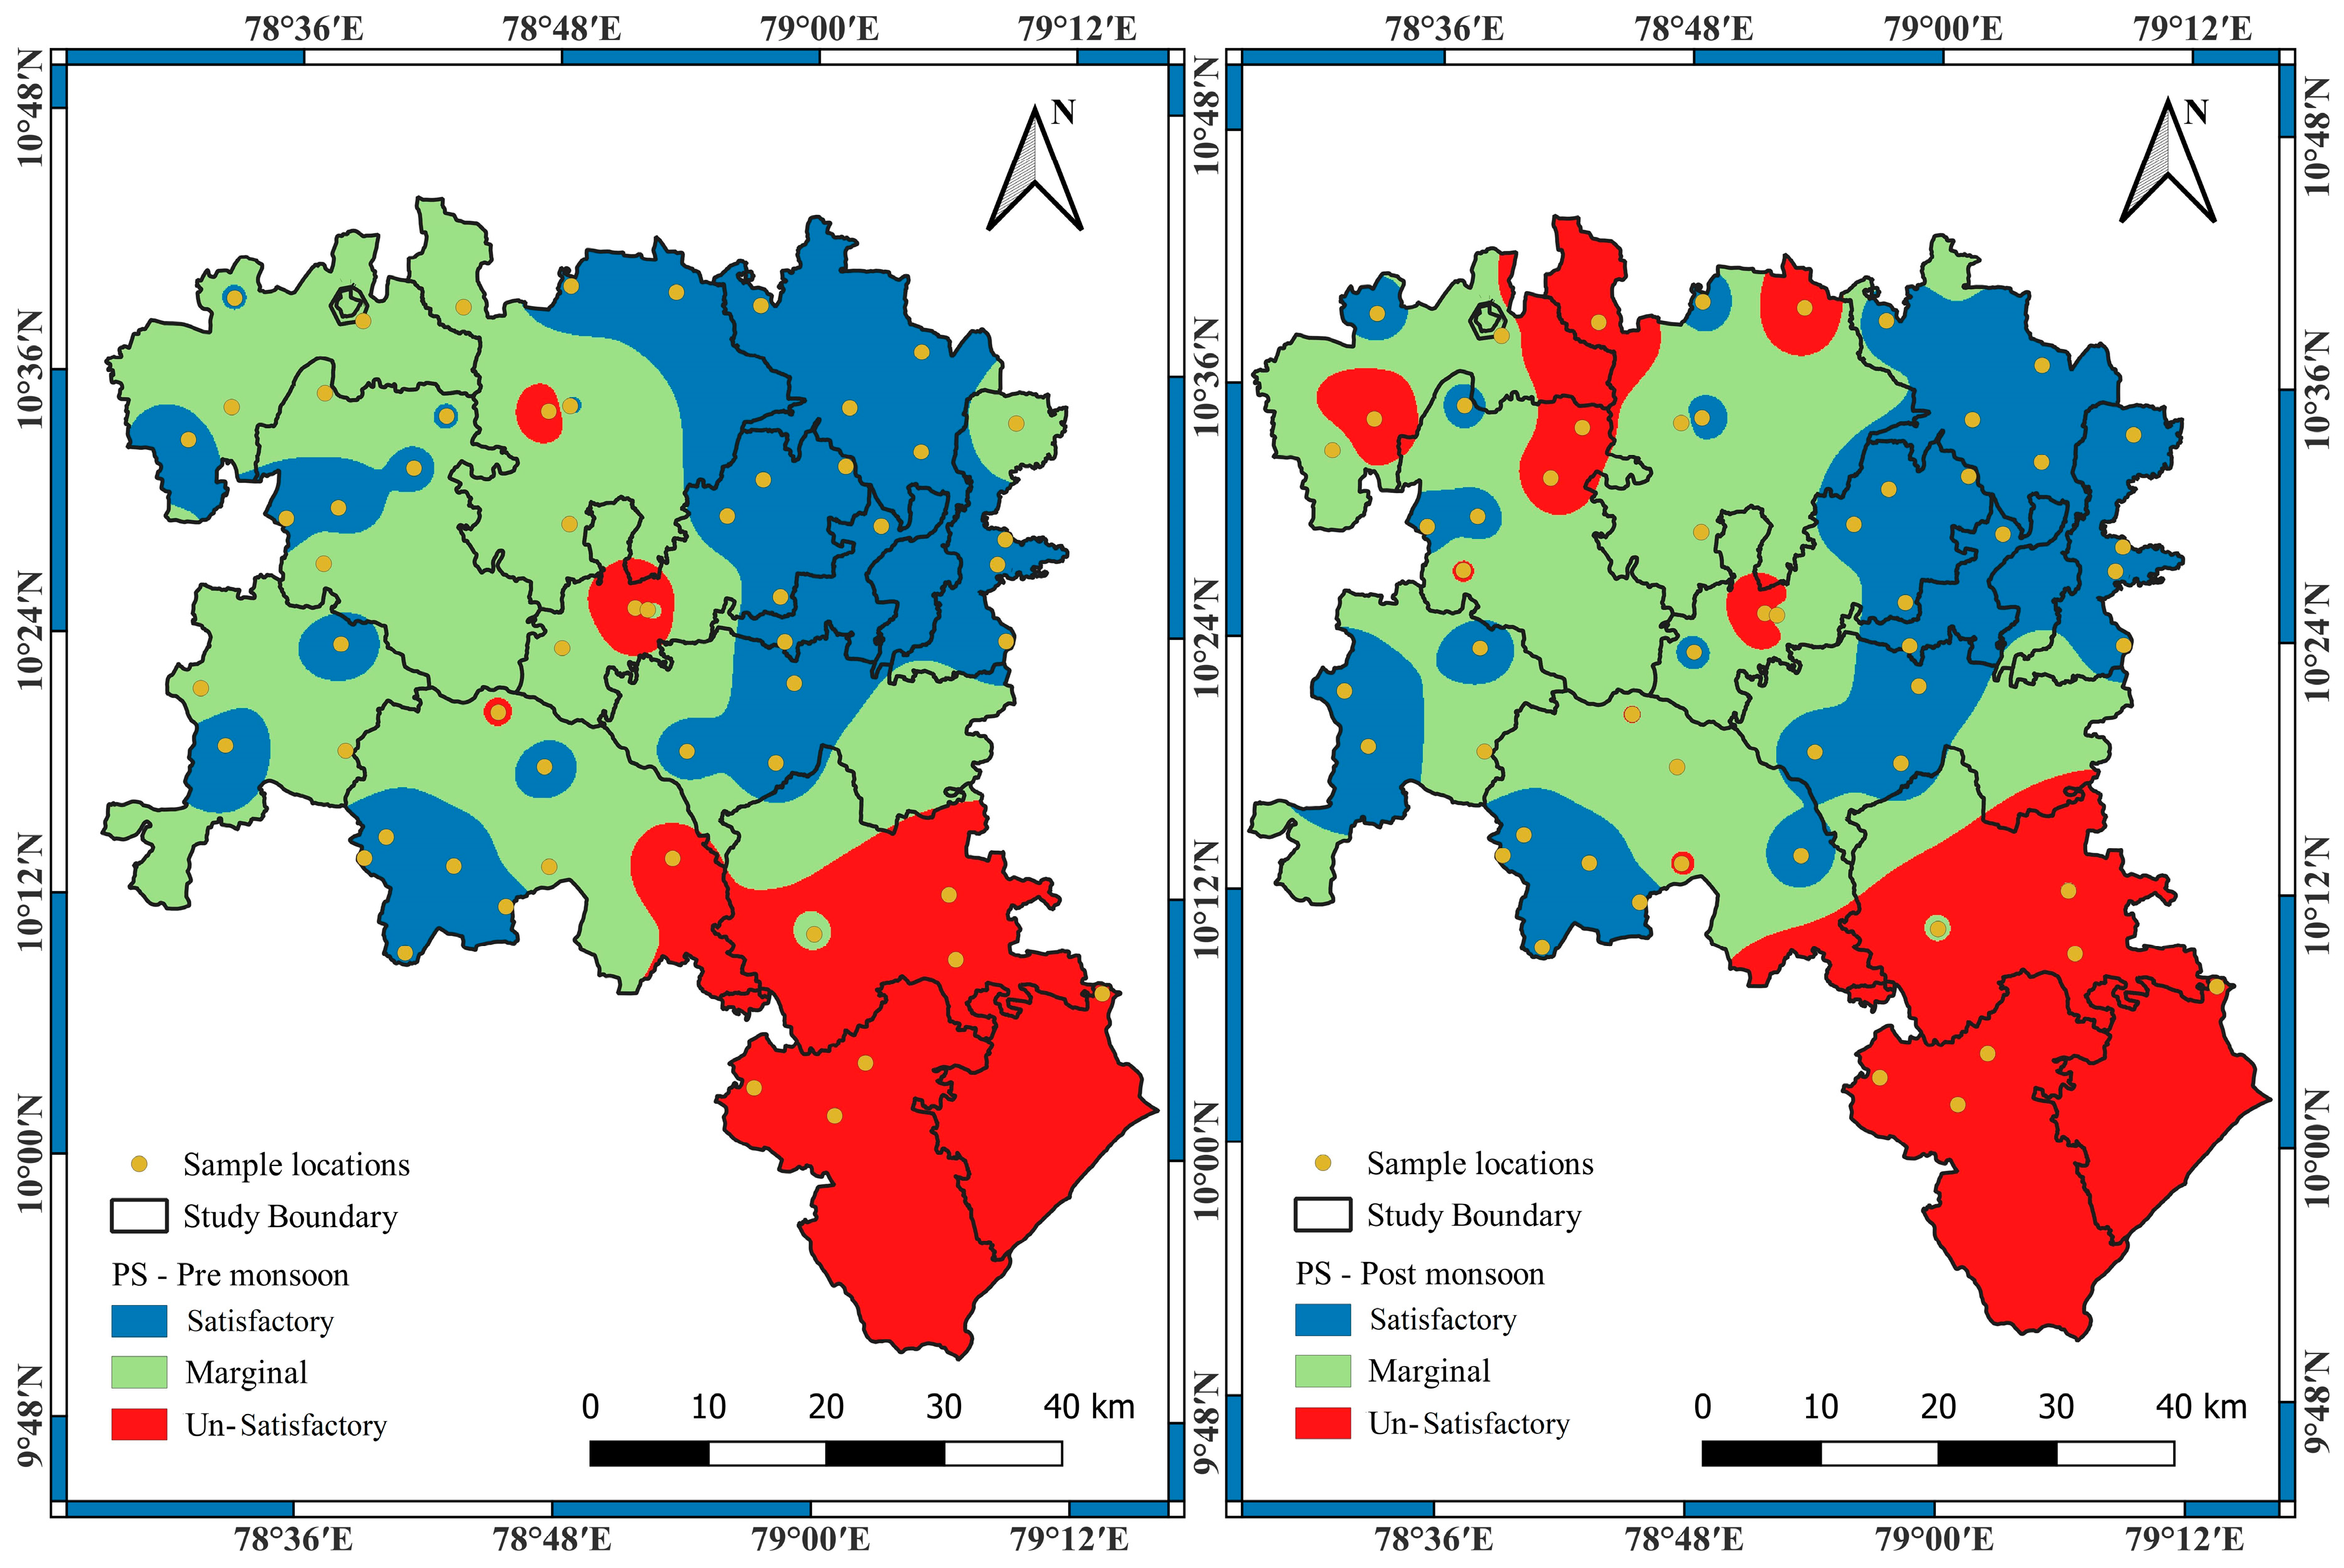
The spatial analysis of percentage sodium (PS) showed that 51.12 and 13.34 sq. km of the area were excellent, 1883.6 and 233.89 sq. km of the area were good, 2226.20 and 3692.30 sq. km of the area were permissible, 483.78 and 693.45 sq. km of the area were doubtful, and 5.35 and 16.98 sq. km of the area were unsuitable (Figure 6). The result of the changes in the water quality showed that over 23.22% of the sample locations was contaminated post monsoon. Kelly’s ratio is another vital index value that proves the negative impact of excess sodium concentrations in water for irrigation purposes [54,55,56,57]. In the study region, the Kelly ratio results revealed that 66.07 and 41.07% of the sample locations were good, 23.21 and 46.43% of the sample locations were doubtful, and 10.71 and 12.5% of the sample locations were unsuitable for agriculture use due to excess sodium (Table 3). The spatial analysis of Kelly’s ratio revealed that 2964.63 and 1034.2 sq. km of the area were good, 1014.26 and 2688.19 sq. km of the area were doubtful, and 671.07 and 927.57 sq. km of the area belonged to the unsuitable category both pre and post monsoon season. About 25% of the locations was more contaminated in the post-monsoon season (Figure 7). The properties of soil, such as pore size, presence of minerals, and infiltration, are majorly correlated with groundwater contamination [58,59,60]. In the present study, the permeability index was estimated to analyze the source of contamination in the study area. The permeability index results show that, during the two seasons, 73.21 and 44.64% of the sample locations belonged to Class I, 25 and 55.36% to Class II, and 1.79% to Class III. The change in quality during the post-monsoon season affected about 28.57% of the locations, which were excessively contaminated compared to their pre-monsoon conditions (Table 3). The spatial analysis of the permeability index revealed that 7.35 and 8.30 sq. km of the area belonged to Class I, 4297.30 and 3147.65 sq. km to Class II, and 345.31 and 1494.01 sq. km to Class III (Figure 8). The magnesium concentration in groundwater is vital in crop production and other agricultural activities [61,62]. In the study region, 17.86 and 10.71% of the samples were suitable, while 82.14 and 89.29% of the samples were unsuitable for irrigation purposes. Only 7.15% of the samples was excessively contaminated in the post-monsoon season (Table 3). The spatial analysis of the magnesium absorption ratio (MAR) revealed that 189.16 and 122.36 sq. km were suitable and 4460.81 and 4527.60 sq. km of the area were unsuitable during the pre- and post-monsoon seasons (Figure 9). Salinity is another important issue for coastal regions’ groundwater quality and suitability for irrigation purposes. In the present study, the potential salinity results showed that 58.93 and 62.5% of the samples were good, 16.07 and 21.43% of the samples were doubtful, and 25 and 16.07% of the samples were unsuitable for irrigation purposes (Table 3). The spatial analysis of potential salinity revealed that 131.5 and 1414.37 sq. km of the area were good, 1900.55 and 2062.96 sq. km of the area were doubtful, and 1435.92 and 1172.64 sq. km of the area were highly contaminated during the pre- and post-monsoon seasons (Figure 10).

3.2. Effect of Chloride on Groundwater Based on the CI

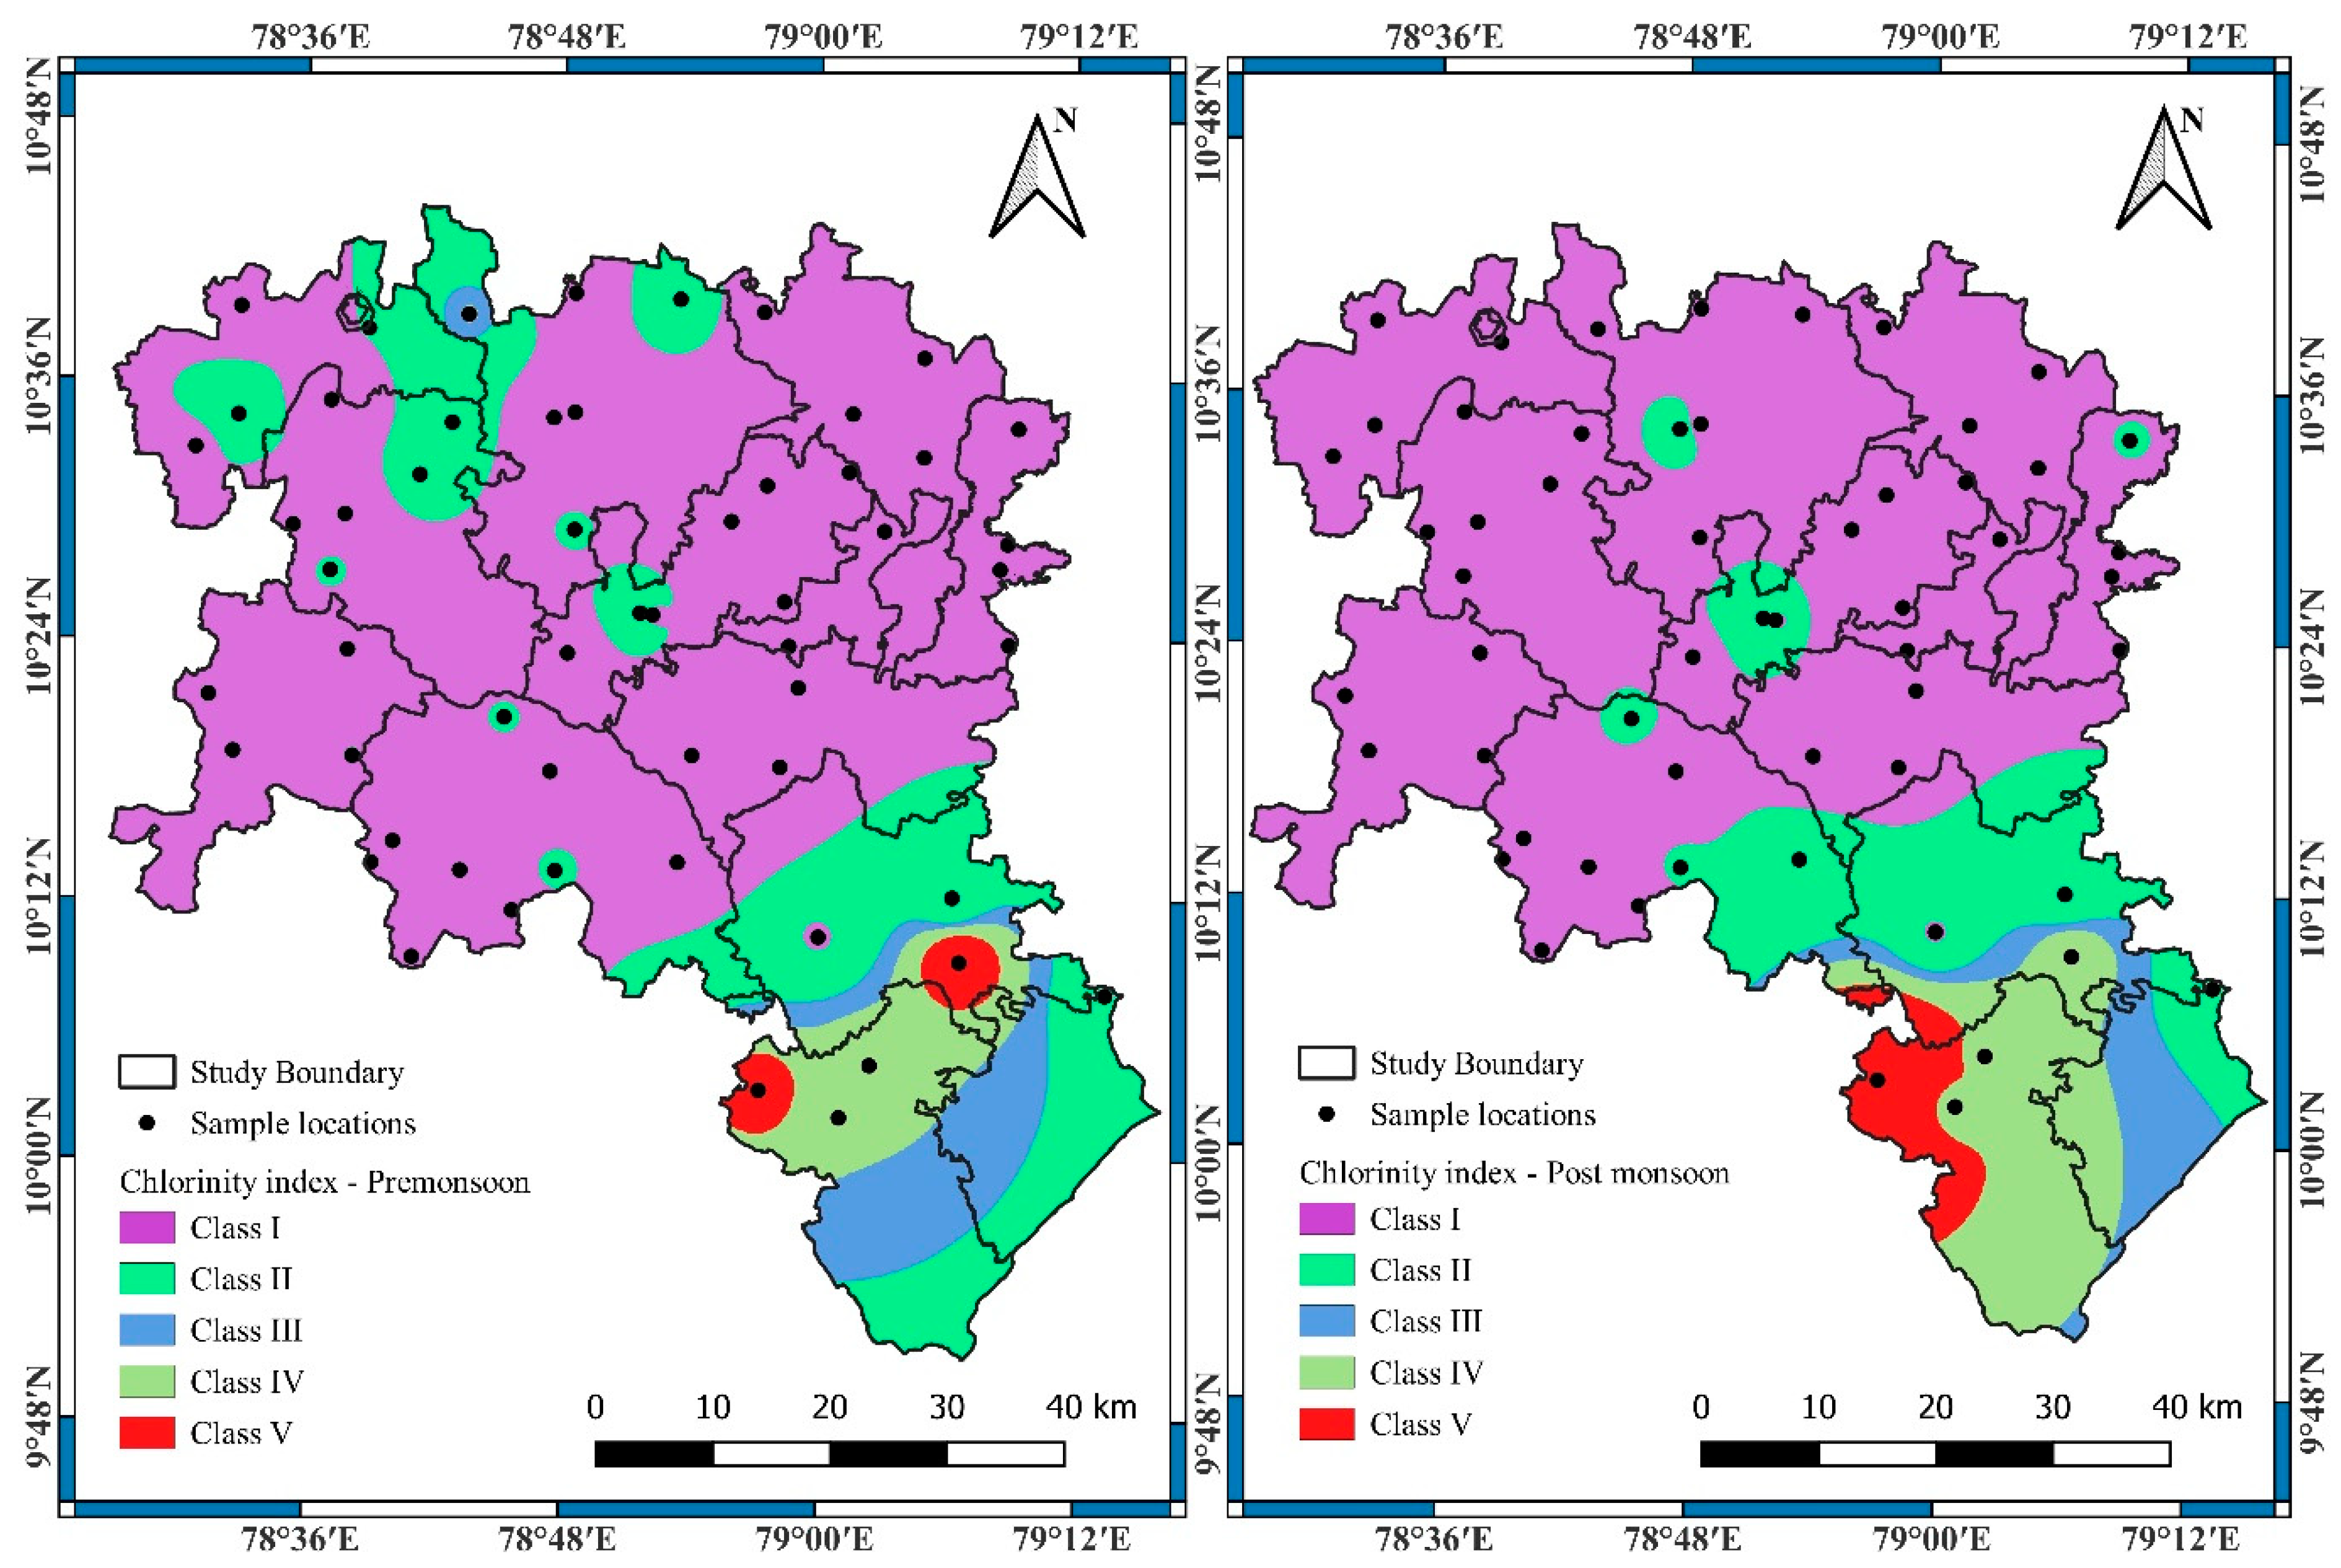
Excess chloride in groundwater is a result of saltwater intrusion in coastal regions [63,64]. In the study area, 38 and 41 of the sample locations were categorized in Class I, 13 and 10 of the sample locations in Class II, 0 and 1 of the samples in Class III, 2 and 3 of the samples in Class IV, and 3 and 1 of the sample locations in Class V. The results clearly demonstrate that four sample locations were extremely contaminated due to saltwater intrusion (Table 4). The spatial analysis of CI demonstrated that 3109.78 and 3200.37 sq. km of the area could be categorized in Class I, 951.96 and 675.02 sq. km in Class II, 277.38 and 195.64 sq. km in Class III, 246.08 and 449.71 sq. km in Class IV, and 64.74 and 129.21 sq. km in Class V during the pre- and post-monsoon seasons, respectively (Figure 11).

3.3. Chemical Equilibrium Based on the MSI

The chemical equilibrium of groundwater under various climatic condition was analyzed by calculating the saturation index. In the present study, the following dissolution values of major minerals were found: anhydrite ranged from −1.12 to 2.23, with a mean value of −0.36, and from 2.22 to 3.66, with a mean value of 2.93; aragonite ranged from 2.28 to 3.59, with a mean value of 2.91, and from −1.58 to 1.09, with a mean value of −0.58; calcite ranged from 2.43 to 3.74, with an average of 3.06, and from 2.36 to 3.81, with an average of 3.07; dolomite ranged from 4.84 to 7.56, with 6.29 as the mean value, and from 4.58 to 8.09, with 6.41 as the mean; fluorite ranged from −0.27 to 2.16, with an average of 0.78, and from −0.64 to 2.10, with an average of 0.64; gypsum ranged from −0.82 to 2.44, with a mean of −0.07, and from −1.29 to 1.23, with −0.28 as the mean; and, finally, halite ranged from −5.49 to −1.63, with −3.85 as the mean value, and from −5.81 to −0.43, with −3.70 as the mean (Supplementary Materials Figure S1). These results indicate that aragonite, calcite, and dolomite were oversaturated, while, in few locations, fluorite was undersaturated, and, in most of the study region, anhydrite and gypsum were undersaturated. Meanwhile, halite mineral dissolution was found at all the sampling locations.

3.4. SMI for the Study Region

The results for the SMI value in the study region ranged from 0.09 to 6.78, with a mean of 1.07, and from 0.06 to 19.64, with a mean of 1.24, pre and post monsoons, respectively. The cumulative probability percentage and inflection point for sodium, magnesium chloride, and sulfate were calculated in the present study. The inflection points were 133 mg/L and 138 mg/L for sodium, 55 mg/L and 50 mg/L for magnesium, 269 mg/L and 266 mg/L for chloride, and 115 mg/L and 62 mg/L for sulfate pre and post monsoons, respectively. The possible SMI region was identified using spatial analysis, and the results indicated that 2733.78 and 2978.71 sq. km of the area corresponded to the freshwater zone and 1916.18 and 1671.26 sq. km to the zone mixed with seawater (Figure 12). The southern and southeastern part of the region were extremely contaminated due to saltwater intrusion, and the upper part of the study region was also contaminated, with a high salt content in the groundwater.

3.5. Overall Suitability of Groundwater Based on the ASI

The main focus of the present study was to assess the groundwater quality for irrigation and other agricultural practices. In the present study region, 26 and 17 of the samples were excellent, 20 and 31 of the samples were good, 6 and 2 of the samples were permissible, 2 and 3 of the samples were doubtful, and 2 and 3 of the sample locations were unsuitable for agricultural activities based on their ASI value during the pre- and post-monsoon seasons (Table 5). The spatial analysis of the ASI value indicated that 1114.28 and 166.59 sq. km of the area belonged to the excellent category, 2552.88 and 3447.3 sq. km to the good category, 754.79 and 735.21 sq. km to the permissible category, 184.81 and 215.51 sq. km to the doubtful category, and 43.19 and 85.33 sq. km to the unsuitable category for irrigation practices (Figure 13). The results revealed that sample locations near the coastal region were extremely contaminated, with a high salt content, and few sample locations in the northeastern part of the study region were contaminated during the post-monsoon season.

3.6. Ionic Strength Identification Using USML Techniques

The results obtained using USML techniques helped us identify the strength of each ion in terms of its impact on the overall quality of the groundwater [65,66,67]. In the present study, both pre- and post-monsoon season groundwater characteristic were analyzed, and the results are presented in Figure 14 and Table 6. The results of the PCA indicate that the pre-monsoon season has four components and the post-monsoon season has three components in the rotation matrix (Table 7). Component 1 shows that TDS, EC, TH, Ca2+, Mg2+, K+ Na+, Cl, and SO42− highly influenced the quality of groundwater in both seasons. It indicates that seawater intrusion (in the southeastern zone) and other anthropogenic activities (in the northern part) are the main sources of contamination in the entire study region. Component 2 shows that pH, TDS, CO32−, HCO3, and F are the main influencing parameters, and it denotes that the ion exchange process and rock–water interactions are strong in the northern and northwestern parts of the study region during both seasons. Na+ and NO3 slightly influence Component 2’s concentration and impact on the overall quality of the groundwater, and this is confirmed by Components 3 and 4 pre and post monsoons, respectively. Figure S6 shows the inter-relationships between the water quality parameters and reveals that Na+ and NO3 are highly influenced parameter in the study area.

3.7. Discussion

The results of various irrigation indices showed that the degradation in the groundwater’s quality was higher post monsoon than during the pre-monsoon season. The action of saltwater intrusion, the infiltration of leachates from municipal waste dumping yards (in the northern part of the study region), and changes in the properties of aquifers in the post-monsoon season are significant factors deteriorating the stable chemical equilibrium of groundwater. Based on the chlorinity index results, Classes III, IV, and V were found in the southeastern zone in the study region, and a high chloride concentration in the groundwater was confirmed by the SWI results. It revealed that the area of the study region closer to the coastal zone was more affected by saltwater intrusion. The few sample locations in the northern part of the study region were highly contaminated due to excess salt in the groundwater by the action of mineral dissolution. The result of the MSI revealed that anhydrite, gypsum, and halite dissolution was a significant issue, deteriorating the quality of groundwater in the northern zone. The hydrogeochemical properties of each sample location confirmed that saltwater intrusion combined with an excess concentration of chloride, the electrical conductivity of the groundwater, and mineral dissolution were the primary factors that controlled and degraded the chemical equilibrium of the groundwater in the study region. This was further proven by a detailed analysis of electrical conductivity in groundwater, which revealed that 11 sample locations (19.64%) and 8 sample locations (14.29%) were unfit for irrigation purposes and that 5 sample locations (Table S1) were especially highly contaminated during both seasons, with an excess concentration of EC (greater than 3000 µS/cm). The spatial distribution of the EC concentration showed that 0 and 1.69 sq. km of the area were excellent, 665.49 and 592.32 sq. km of the area were good, 2918.72 and 3064.99 sq. km of the area were permissible, 336.43 and 340.72 sq. km of the area were doubtful, and 729.29 and 650.22 sq. km of the area were unsuitable (Figure S2). Further, the TDS concentration analysis carried out revealed that three sample locations that were very close to the coastal region were affected by brackish water movements. The infiltration of brackish water, mineral dissolution, and other anthropogenic activities were major concerns for the overall quality of the water in the study region (Table S2). The spatial analysis found that 174.30 and 159.27 sq. km of the area in the southeastern part of the study region were contaminated, with an excess concentration of TDS in the groundwater due to brackish water (Figure S3). The suitability of groundwater for irrigation purposes was assessed using the USSL and Wilcox diagrams (Figures S4 and S5). The USSL diagram indicated that 0 and 1 samples presented low salinity and low sodium hazards (C1S1), 26 and 21 samples fell in the medium salinity and low sodium hazard categories (C2S1), and 13 and 22 samples presented high salinity and low sodium hazards (C3S1). Two and zero samples fell in the hazard categories of very high salinity and low sodium (C4S1), seven and five samples fell in the high salinity and medium sodium hazard categories (C3S2), and three and two samples presented very high salinity and medium sodium hazards (C4S2). Three and one samples presented very high salinity and high sodium hazards (C4S3), and three samples in each season fell in the very high salinity and sodium hazard categories (C4S4) pre and post monsoons, respectively [68,69,70]. Wilcox’s diagram showed that six and four samples were poor, and five samples were very poor during both seasons. The study results indicate that the samples collected in the upper and lower parts (coastal regions) of the study area were highly contaminated due to rock–water interactions and saltwater intrusion, respectively.

4. Conclusions

An integrated approach for the detailed investigation of groundwater quality’s suitability for agriculture in and around a coastal region in Southern India was applied, and key findings were discussed. This study concluded that the concentration of sodium and magnesium and the porous properties of the soil were highly affected due to saltwater intrusion and other anthropogenic activities based on various irrigation indices. This was confirmed by conducting a detailed SWI analysis of the study area. The results revealed that 20 and 17 sample locations during the pre- and post-monsoon seasons were highly contaminated due to saltwater intrusion, with excess concentrations of salinity and chloride. Based on the result of the chlorinity index, five sample locations in the southeastern part of the study region (coastal region) had elevated chloride concentrations during both monsoon seasons. Moreover, excessive ionic concentrations were induced by the action of mineral saturation in a significant part of the study area. Halite mineral dissolution was the chief source of contamination during the post-monsoon season, especially via anhydrite and gypsum. This study identified the overall suitability of groundwater for agricultural purposes by calculating the ASI value, and the results revealed that the samples closer to the southeastern area (coastal region) were not fit for irrigation purposes. The present study results comprised groundwater contamination status and a comprehensive analysis of groundwater quality for irrigation purposes. It is more helpful for policymakers to take remedial actions in the contaminated zones and maintain sustainable water management practices in the study region.

Supplementary Materials

The following supporting information can be downloaded at https://www.mdpi.com/article/10.3390/w16182566/s1: Figure S1: Saturation of various mineral dissolution in study area (a) pre-monsoon and (b) post monsoon; Figure S2: Spatial analysis of EC of groundwater during pre and post monsoon; Figure S3: Spatial analysis of TDS of groundwater during pre and post monsoon; Figure S4: USSL classification of groundwater during (a) pre-monsoon and (b) post monsoon; Figure S5: WILCOX classification of groundwater during (a) pre-monsoon and (b) post monsoon; Figure S6: Biplot of PCA for (a) pre-monsoon and (b) post monsoon; Table S1: Groundwater classification based on electrical conductivity; Table S2: Groundwater classification based on TDS concentration.

Author Contributions

S.P.K. and B.P.: methodology; S.P.K., P.J.S.K., B.P. and F.F.b.H.: software; S.P.K., P.J.S.K., B.P., F.F.b.H. and H.G.A.: formal analysis and investigation; S.P.K., B.P. and F.F.b.H.: visualization; S.P.K., P.J.S.K. and B.P.: writing—original draft preparation; S.P.K., B.P., H.G.A. and F.F.b.H.: writing—review and editing; and S.P.K., P.J.S.K., H.G.A. and B.P.: supervision. All authors have read and agreed to the published version of the manuscript.

Funding

This project was funded by Princess Nourah bint Abdulrahman University Researchers Supporting Project Number (PNURSP2024R675), Princess Nourah bint Abdulrahman University, Riyadh, Saudi Arabia.

Data Availability Statement

The data that support the findings of this study are available upon request from the corresponding author.

Conflicts of Interest

The authors have no conflicts of interest to declare.

References

  1. Panneerselvam, B.; Muniraj, K.; Pande, C.; Ravichandran, N.; Thomas, M.; Karuppannan, S. Geochemical evaluation and human health risk assessment of nitrate-contaminated groundwater in an industrial area of South India. Environ. Sci. Pollut. Res. 2022, 29, 86202–86219. [Google Scholar] [CrossRef] [PubMed]
  2. Sankar, K.; Karunanidhi, D.; Kalaivanan, K.; Subramani, T.; Shanthi, D.; Balamurugan, P. Integrated hydrogeophysical and GIS based demarcation of groundwater potential and vulnerability zones in a hard rock and sedimentary terrain of Southern India. Chemosphere 2023, 316, 137305. [Google Scholar] [CrossRef]
  3. Creel, L. Ripple Effects: Population and Coastal Regions; Population Reference Bureau: Washington, DC, USA, 2003; pp. 1–7. [Google Scholar]
  4. Kouadri, S.; Pande, C.B.; Panneerselvam, B.; Moharir, K.N.; Elbeltagi, A. Prediction of irrigation groundwater quality parameters using ANN, LSTM, and MLR models. Environ. Sci. Pollut. Res. 2021, 29, 21067–21091. [Google Scholar] [CrossRef] [PubMed]
  5. Pande, C.B.; Moharir, K.N.; Panneerselvam, B.; Singh, S.K.; Elbeltagi, A.; Pham, Q.B.; Varade, A.M.; Rajesh, J. Delineation of groundwater potential zones for sustainable development and planning using analytical hierarchy process (AHP), and MIF techniques. Appl. Water Sci. 2021, 11, 186. [Google Scholar] [CrossRef]
  6. Shunmugapriya, K.; Panneerselvam, B.; Muniraj, K.; Ravichandran, N.; Prasath, P.; Thomas, M.; Duraisamy, K. Integration of multi criteria decision analysis and GIS for evaluating the site suitability for aquaculture in southern coastal region, India. Mar. Pollut. Bull. 2021, 172, 112907. [Google Scholar] [CrossRef]
  7. Charoenlerkthawin, W.; Bidorn, K.; Burnett, W.C.; Sasaki, J.; Panneerselvam, B.; Bidorn, B. Effectiveness of grey and green engineered solutions for protecting the low-lying muddy coast of the Chao Phraya Delta, Thailand. Sci. Rep. 2022, 12, 20448. [Google Scholar] [CrossRef]
  8. Kaliyappan, S.P.; Muniraj, K.; Rajendran, G.; Bidorn, B.; Thomas, M.; Panneerselvam, B. Seasonal Variation of Groundwater Quality for Irrigation Purposes in a Semi-Arid Region in Tamil Nadu, India. In Climate Change Impact on Groundwater Resources: Human Health Risk Assessment in Arid and Semi-Arid Regions; Springer International Publishing: Cham, Switzerland, 2022; pp. 163–180. [Google Scholar]
  9. Panneerselvam, B.; Ravichandran, N.; Kaliyappan, S.P.; Karuppannan, S.; Bidorn, B. Quality and Health Risk Assessment of Groundwater for Drinking and Irrigation Purpose in Semi-Arid Region of India Using Entropy Water Quality and Statistical Techniques. Water 2023, 15, 601. [Google Scholar] [CrossRef]
  10. Basack, S.; Loganathan, M.; Goswami, G.; Khabbaz, H.; Basack, S.; Loganathan, M.; Goswami, G.; Khabbaz, H. Saltwater Intrusion into Coastal Aquifers and Associated Risk Management: Critical Review and Research Directives. J. Coast. Res. 2022, 38, 654–672. [Google Scholar] [CrossRef]
  11. Cantelon, J.A.; Guimond, J.A.; Robinson, C.E.; Michael, H.A.; Kurylyk, B.L. Vertical Saltwater Intrusion in Coastal Aquifers Driven by Episodic Flooding: A Review. Water Resour. Res. 2022, 58, e2022WR032614. [Google Scholar] [CrossRef]
  12. Panneerselvam, B.; Muniraj, K.; Pande, C.; Ravichandran, N. Prediction and evaluation of groundwater characteristics using the radial basic model in Semi-arid region, India. Int. J. Environ. Anal. Chem. 2021, 103, 1377–1393. [Google Scholar] [CrossRef]
  13. Alfarrah, N.; Walraevens, K. Groundwater Overexploitation and Seawater Intrusion in Coastal Areas of Arid and Semi-Arid Regions. Water 2018, 10, 143. [Google Scholar] [CrossRef]
  14. Abu Salem, H.S.; Gemail, K.S.; Junakova, N.; Ibrahim, A.; Nosair, A.M. An Integrated Approach for Deciphering Hydrogeochemical Processes during Seawater Intrusion in Coastal Aquifers. Water 2022, 14, 1165. [Google Scholar] [CrossRef]
  15. Hajji, S.; Allouche, N.; Bouri, S.; Aljuaid, A.M.; Hachicha, W. Assessment of Seawater Intrusion in Coastal Aquifers Using Multivariate Statistical Analyses and Hydrochemical Facies Evolution-Based Model. Int. J. Environ. Res. Public Health 2022, 19, 155. [Google Scholar] [CrossRef] [PubMed]
  16. Panthi, J.; Pradhanang, S.M.; Nolte, A.; Boving, T.B. Saltwater intrusion into coastal aquifers in the contiguous United States—A systematic review of investigation approaches and monitoring networks. Sci. Total Environ. 2022, 836, 155641. [Google Scholar] [CrossRef]
  17. WHO World Health Organization. Guidelines for Drinking-Water Quality, 4th ed.; Incorporating the 1st Addendum; WHO World Health Organization: Geneva, Switzerland, 2017.
  18. Abd-Elaty, I.; Kuriqi, A.; Bhat, S.A.; Zelenakova, M. Sustainable management of two-directional lateral and upconing saltwater intrusion in coastline aquifers to alleviate water scarcity. Hydrol. Process. 2022, 36, e14646. [Google Scholar] [CrossRef]
  19. Alshehri, F.; Almadani, S.; El-Sorogy, A.S.; Alwaqdani, E.; Alfaifi, H.J.; Alharbi, T. Influence of seawater intrusion and heavy metals contamination on groundwater quality, Red Sea coast, Saudi Arabia. Mar. Pollut. Bull. 2021, 165, 112094. [Google Scholar] [CrossRef]
  20. Asare, A.; Appiah-Adjei, E.K.; Ali, B.; Owusu-Nimo, F. Assessment of seawater intrusion using ionic ratios: The case of coastal communities along the Central Region of Ghana. Environ. Earth Sci. 2021, 80, 307. [Google Scholar] [CrossRef]
  21. Bhagat, C.; Puri, M.; Mohapatra, P.K.; Kumar, M. Imprints of seawater intrusion on groundwater quality and evolution in the coastal districts of south Gujarat, India. Case Stud. Chem. Environ. Eng. 2021, 3, 100101. [Google Scholar] [CrossRef]
  22. Dhakate, R.; Ratnalu, G.V.; Sankaran, S. Hydrogeochemical and isotopic study for evaluation of seawater intrusion into shallow coastal aquifers of Udupi District, Karnataka, India. Geochemistry 2020, 80, 125647. [Google Scholar] [CrossRef]
  23. Abdalla, F. Ionic ratios as tracers to assess seawater intrusion and to identify salinity sources in Jazan coastal aquifer, Saudi Arabia. Arab. J. Geosci. 2016, 9, 40. [Google Scholar] [CrossRef]
  24. Akshitha, V.; Balakrishna, K.; Udayashankar, H.N. Assessment of hydrogeochemical characteristics and saltwater intrusion in selected coastal aquifers of southwestern India. Mar. Pollut. Bull. 2021, 173, 112989. [Google Scholar] [CrossRef] [PubMed]
  25. Lee, J.-Y.; Song, S.-H. Groundwater chemistry and ionic ratios in a western coastal aquifer of Buan, Korea: Implication for seawater intrusion. Geosci. J. 2007, 11, 259–270. [Google Scholar] [CrossRef]
  26. Prusty, P.; Farooq, S. Seawater intrusion in the coastal aquifers of India—A review. HydroResearch 2020, 3, 61–74. [Google Scholar] [CrossRef]
  27. Maurya, P.; Kumari, R.; Mukherjee, S. Hydrochemistry in integration with stable isotopes (δ18O and δD) to assess seawater intrusion in coastal aquifers of Kachchh district, Gujarat, India. J. Geochem. Explor. 2019, 196, 42–56. [Google Scholar] [CrossRef]
  28. Gopinath, S.; Srinivasamoorthy, K.; Saravanan, K.; Prakash, R.; Karunanidhi, D. Characterizing groundwater quality and seawater intrusion in coastal aquifers of Nagapattinam and Karaikal, South India using hydrogeochemistry and modeling techniques. Hum. Ecol. Risk Assess. Int. J. 2019, 25, 314–334. [Google Scholar] [CrossRef]
  29. Slama, F.; Slama, F.; Nasri, N.; Nasri, N.; Bouhlila, R.; Bouhlila, R. Delineating the origins and processes of groundwater salinization and quality degradation in a coastal irrigated plain, Korba (Northeastern Tunisia). Mar. Pollut. Bull. 2022, 181, 113914. [Google Scholar] [CrossRef]
  30. Hassan, A.M.; Ersoy, A.F. Statistical assessment of seasonal variation of groundwater quality in Çarşamba coastal plain, Samsun (Turkey). Environ. Monit. Assess. 2022, 194, 135. [Google Scholar] [CrossRef]
  31. Wilcox, L.V. Classification and Use of Irrigation Waters; Circular No. 969; U.S. Geological Survey, Department of Agriculture: Washington, DC, USA, 1955; p. 19. [Google Scholar]
  32. Abu Al Naeem, M.F.; Yusoff, I.; Ng, T.F.; Maity, J.P.; Alias, Y.; May, R.; Alborsh, H. A study on the impact of anthropogenic and geogenic factors on groundwater salinization and seawater intrusion in Gaza coastal aquifer, Palestine: An integrated multi-techniques approach. J. Afr. Earth Sci. 2019, 156, 75–93. [Google Scholar] [CrossRef]
  33. Ayari, J.; Ouelhazi, H.; Charef, A.; Barhoumi, A. Delineation of seawater intrusion and groundwater quality assessment in coastal aquifers: The Korba coastal aquifer (Northeastern Tunisia). Mar. Pollut. Bull. 2023, 188, 114643. [Google Scholar] [CrossRef]
  34. Kim, R.-H.; Kim, J.-H.; Ryu, J.-S.; Koh, D.-C. Hydrogeochemical characteristics of groundwater influenced by reclamation, seawater intrusion, and land use in the coastal area of Yeonggwang, Korea. Geosci. J. 2019, 23, 603–619. [Google Scholar] [CrossRef]
  35. Shin, K.; Koh, D.-C.; Jung, H.; Lee, J. The Hydrogeochemical Characteristics of Groundwater Subjected to Seawater Intrusion in the Archipelago, Korea. Water 2020, 12, 1542. [Google Scholar] [CrossRef]
  36. Mohanty, A.K.; Rao, V.G. Hydrogeochemical, seawater intrusion and oxygen isotope studies on a coastal region in the Puri District of Odisha, India. Catena 2019, 172, 558–571. [Google Scholar] [CrossRef]
  37. Satheeskumar, V.; Subramani, T.; Lakshumanan, C.; Roy, P.D.; Karunanidhi, D. Groundwater chemistry and demarcation of seawater intrusion zones in the Thamirabarani delta of south India based on geochemical signatures. Environ. Geochem. Health 2021, 43, 757–770. [Google Scholar] [CrossRef] [PubMed]
  38. Taşan, M.; Taşan, S.; Demir, Y. Estimation and uncertainty analysis of groundwater quality parameters in a coastal aquifer under seawater intrusion: A comparative study of deep learning and classic machine learning methods. Environ. Sci. Pollut. Res. 2022, 30, 2866–2890. [Google Scholar] [CrossRef] [PubMed]
  39. Balamurugan, P.; Kumar, P.; Shankar, K. Dataset on the suitability of groundwater for drinking and irrigation purposes in the Sarabanga River region, Tamil Nadu, India. Data Brief 2020, 29, 105255. [Google Scholar] [CrossRef] [PubMed]
  40. Balamurugan, P.; Kumar, P.; Shankar, K.; Nagavinothini, R.; Vijayasurya, K. Non-carcinogenic risk assessment of groundwater in southern part of Salem District in Tamilnadu, India. J. Chil. Chem. Soc. 2020, 65, 4697–4707. [Google Scholar] [CrossRef]
  41. Panneerselvam, B.; Karuppannan, S.; Muniraj, K. Evaluation of drinking and irrigation suitability of groundwater with special emphasizing the health risk posed by nitrate contamination using nitrate pollution index (NPI) and human health risk assessment (HHRA). Hum. Ecol. Risk Assess. Int. J. 2020, 27, 1324–1348. [Google Scholar] [CrossRef]
  42. Panneerselvam, B.; Muniraj, K.; Thomas, M.; Ravichandran, N. GIS-Based Legitimatic Evaluation of Groundwater’s Health Risk and Irrigation Susceptibility Using Water Quality Index, Pollution Index, and Irrigation Indexes in Semiarid Region. In Groundwater Resources Development and Planning in the Semi-Arid Region; Springer International Publishing: Cham, Switzerland, 2021; pp. 239–268. [Google Scholar]
  43. Climate Data for Cities Worldwide. Available online: https://en.climate-data.org/asia/india/tamil-nadu/pudukkottai-24013/ (accessed on 15 April 2024).
  44. Pudukkotai District Profile. Tamilnadu Water Supply and Drainage Board. Available online: http://www.twadboard.tn.gov.in/content/pudukottai (accessed on 15 March 2023).
  45. Suresh, S. District Groundwater Brochure, Pudukkottai District, Tamil Nadu; Central Groundwater Board, South Eastern Coastal Region: Chennai, India, 2008; pp. 1–21. [Google Scholar]
  46. APHA. Standard Methods for the Examination of Water and Wastewater, 23rd ed.; American Public Health Association: Washington, DC, USA, 2017. [Google Scholar]
  47. Ramalingam, S.; Panneerselvam, B.; Kaliappan, S.P. Effect of high nitrate contamination of groundwater on human health and water quality index in semi-arid region, South India. Arab. J. Geosci. 2022, 15, 242. [Google Scholar] [CrossRef]
  48. Sridharan, M.; Nathan, D.S. Groundwater quality assessment for domestic and agriculture purposes in Puducherry region. Appl. Water Sci. 2017, 7, 4037–4053. [Google Scholar] [CrossRef]
  49. Parkhurst, D.L.; Appelo, C.A.J. User’s guide to PHREEQC Version 2: A Computer Program for Speciation, Batch-Reaction, One-Dimensional Transport, and Inverse Geochemical Calculations; No. 99-4259; USGS Water-Resources Investigations Report; USGS: Reston, VA, USA, 1999; pp. 99–4259. [Google Scholar]
  50. Park, S.-C.; Yun, S.-T.; Chae, G.-T.; Yoo, I.-S.; Shin, K.-S.; Heo, C.-H.; Lee, S.-K. Regional hydrochemical study on salinization of coastal aquifers, western coastal area of South Korea. J. Hydrol. 2005, 313, 182–194. [Google Scholar] [CrossRef]
  51. Sivaranjani, S.; Ellappan, V.; Karthick, L.A. Appraisal of Seawater Mixing Index in Coastal Aquifer of Karaikal, Southern India Using Geospatial Technology. J. Geol. Soc. India 2019, 94, 641–644. [Google Scholar] [CrossRef]
  52. Panneerselvam, B.; Muniraj, K.; Duraisamy, K.; Pande, C.; Karuppannan, S.; Thomas, M. An integrated approach to explore the suitability of nitrate-contaminated groundwater for drinking purposes in a semiarid region of India. Environ. Geochem. Health 2022, 45, 647–663. [Google Scholar] [CrossRef] [PubMed]
  53. Panneerselvam, B.; Muniraj, K.; Thomas, M.; Ravichandran, N.; Bidorn, B. Identifying influencing groundwater parameter on human health associate with irrigation indices using the Automatic Linear Model (ALM) in a semi-arid region in India. Environ. Res. 2021, 202, 111778. [Google Scholar] [CrossRef] [PubMed]
  54. Samtio, M.S.; Hakro, A.A.A.D.; Jahangir, T.M.; Mastoi, A.S.; Lanjwani, M.F.; Rajper, R.H.; Lashari, R.A.; Agheem, M.H.; Noonari, M.W. Impact of rock-water interaction on hydrogeochemical characteristics of groundwater: Using multivariate statistical, water quality index and irrigation indices of chachro sub-district, thar desert, sindh, Pakistan. Groundw. Sustain. Dev. 2023, 20, 100878. [Google Scholar] [CrossRef]
  55. Aravinthasamy, P.; Karunanidhi, D.; Rao, N.S.; Subramani, T.; Srinivasamoorthy, K. Irrigation risk assessment of groundwater in a non-perennial river basin of South India: Implication from irrigation water quality index (IWQI) and geographical information system (GIS) approaches. Arab. J. Geosci. 2020, 13, 1125. [Google Scholar] [CrossRef]
  56. Awad, E.S.; Imran, N.S.; Albayati, M.M.; Snegirev, V.; Sabirova, T.M.; Tretyakova, N.A.; Alsalhy, Q.F.; Al-Furaiji, M.H.; Salih, I.K.; Majdi, H.S. Groundwater Hydrogeochemical and Quality Appraisal for Agriculture Irrigation in Greenbelt Area, Iraq. Environments 2022, 9, 43. [Google Scholar] [CrossRef]
  57. Batarseh, M.; Imreizeeq, E.; Tilev, S.; Al Alaween, M.; Suleiman, W.; Al Remeithi, A.M.; Al Tamimi, M.K.; Al Alawneh, M. Assessment of groundwater quality for irrigation in the arid regions using irrigation water quality index (IWQI) and GIS-Zoning maps: Case study from Abu Dhabi Emirate, UAE. Groundw. Sustain. Dev. 2021, 14, 100611. [Google Scholar] [CrossRef]
  58. Mondal, N.C.; Singh, S.; Singh, V.S. Hydrochemical characteristic of coastal aquifer from Tuticorin, Tamil Nadu, India. Environ. Monit. Assess. 2011, 175, 531–550. [Google Scholar] [CrossRef]
  59. Chakraborty, T.K.; Islam, S.; Ghosh, G.C.; Ghosh, P.; Zaman, S.; Habib, A.; Hossain, R.; Bosu, H.; Islam, R.; Al Imran, M.; et al. Human health risk and hydro-geochemical appraisal of groundwater in the southwest part of Bangladesh using GIS, water quality indices, and multivariate statistical approaches. Toxin Rev. 2023, 42, 285–299. [Google Scholar] [CrossRef]
  60. El Osta, M.; Masoud, M.; Alqarawy, A.; Elsayed, S.; Gad, M. Groundwater Suitability for Drinking and Irrigation Using Water Quality Indices and Multivariate Modeling in Makkah Al-Mukarramah Province, Saudi Arabia. Water 2022, 14, 483. [Google Scholar] [CrossRef]
  61. Mahammad, S.; Islam, A.; Shit, P.K. Geospatial assessment of groundwater quality using entropy-based irrigation water quality index and heavy metal pollution indices. Environ. Sci. Pollut. Res. 2022, 30, 116498–116521. [Google Scholar] [CrossRef] [PubMed]
  62. Masoud, M.; El Osta, M.; Alqarawy, A.; Elsayed, S.; Gad, M. Evaluation of groundwater quality for agricultural under different conditions using water quality indices, partial least squares regression models, and GIS approaches. Appl. Water Sci. 2022, 12, 244. [Google Scholar] [CrossRef]
  63. Zafar, M.M.; Sulaiman, M.A.; Prabhakar, R.; Kumari, A. Evaluation of the suitability of groundwater for irrigational purposes using irrigation water quality indices and geographical information systems (GIS) at Patna (Bihar), India. Int. J. Energy Water Resour. 2022, 8, 241–254. [Google Scholar] [CrossRef]
  64. Zakir, H.; Sharmin, S.; Akter, A.; Rahman, S. Assessment of health risk of heavy metals and water quality indices for irrigation and drinking suitability of waters: A case study of Jamalpur Sadar area, Bangladesh. Environ. Adv. 2020, 2, 100005. [Google Scholar] [CrossRef]
  65. Khanoranga; Khalid, S. An assessment of groundwater quality for irrigation and drinking purposes around brick kilns in three districts of Balochistan province, Pakistan, through water quality index and multivariate statistical approaches. J. Geochem. Explor. 2019, 197, 14–26. [Google Scholar] [CrossRef]
  66. Kumari, M.; Rai, S.C. Hydrogeochemical Evaluation of Groundwater Quality for Drinking and Irrigation Purposes Using Water Quality Index in Semi Arid Region of India. J. Geol. Soc. India 2020, 95, 159–168. [Google Scholar] [CrossRef]
  67. Nguyen, T.T.; Kawamura, A.; Tong, T.N.; Amaguchi, H.; Nakagawa, N.; Gilbuena, R.; Du Bui, D. Identification of spatio-seasonal hydrogeochemical characteristics of the unconfined groundwater in the Red River Delta, Vietnam. Appl. Geochem. 2015, 63, 10–21. [Google Scholar] [CrossRef]
  68. Richards, L. Diagnosis and Improvement of Saline And Alkali Soils. In Agricultural Handbook; US Department of Agriculture: Washington, DC, USA, 1954; p. 60. [Google Scholar]
  69. Alhamd, A.D.; Ibrahim, M.A. Unveiling soil and groundwater salinity dynamics and its impact on date palm yield in Southern Basrah, Iraq. DYSONA-Appl. Sci. 2024, 5, 25–32. [Google Scholar]
  70. Khouri, L.; Sallom, A. The impact of spatial and temporal shifts on Orontes River water quality parameters. DYSONA-Appl. Sci. 2023, 4, 35–41. [Google Scholar]
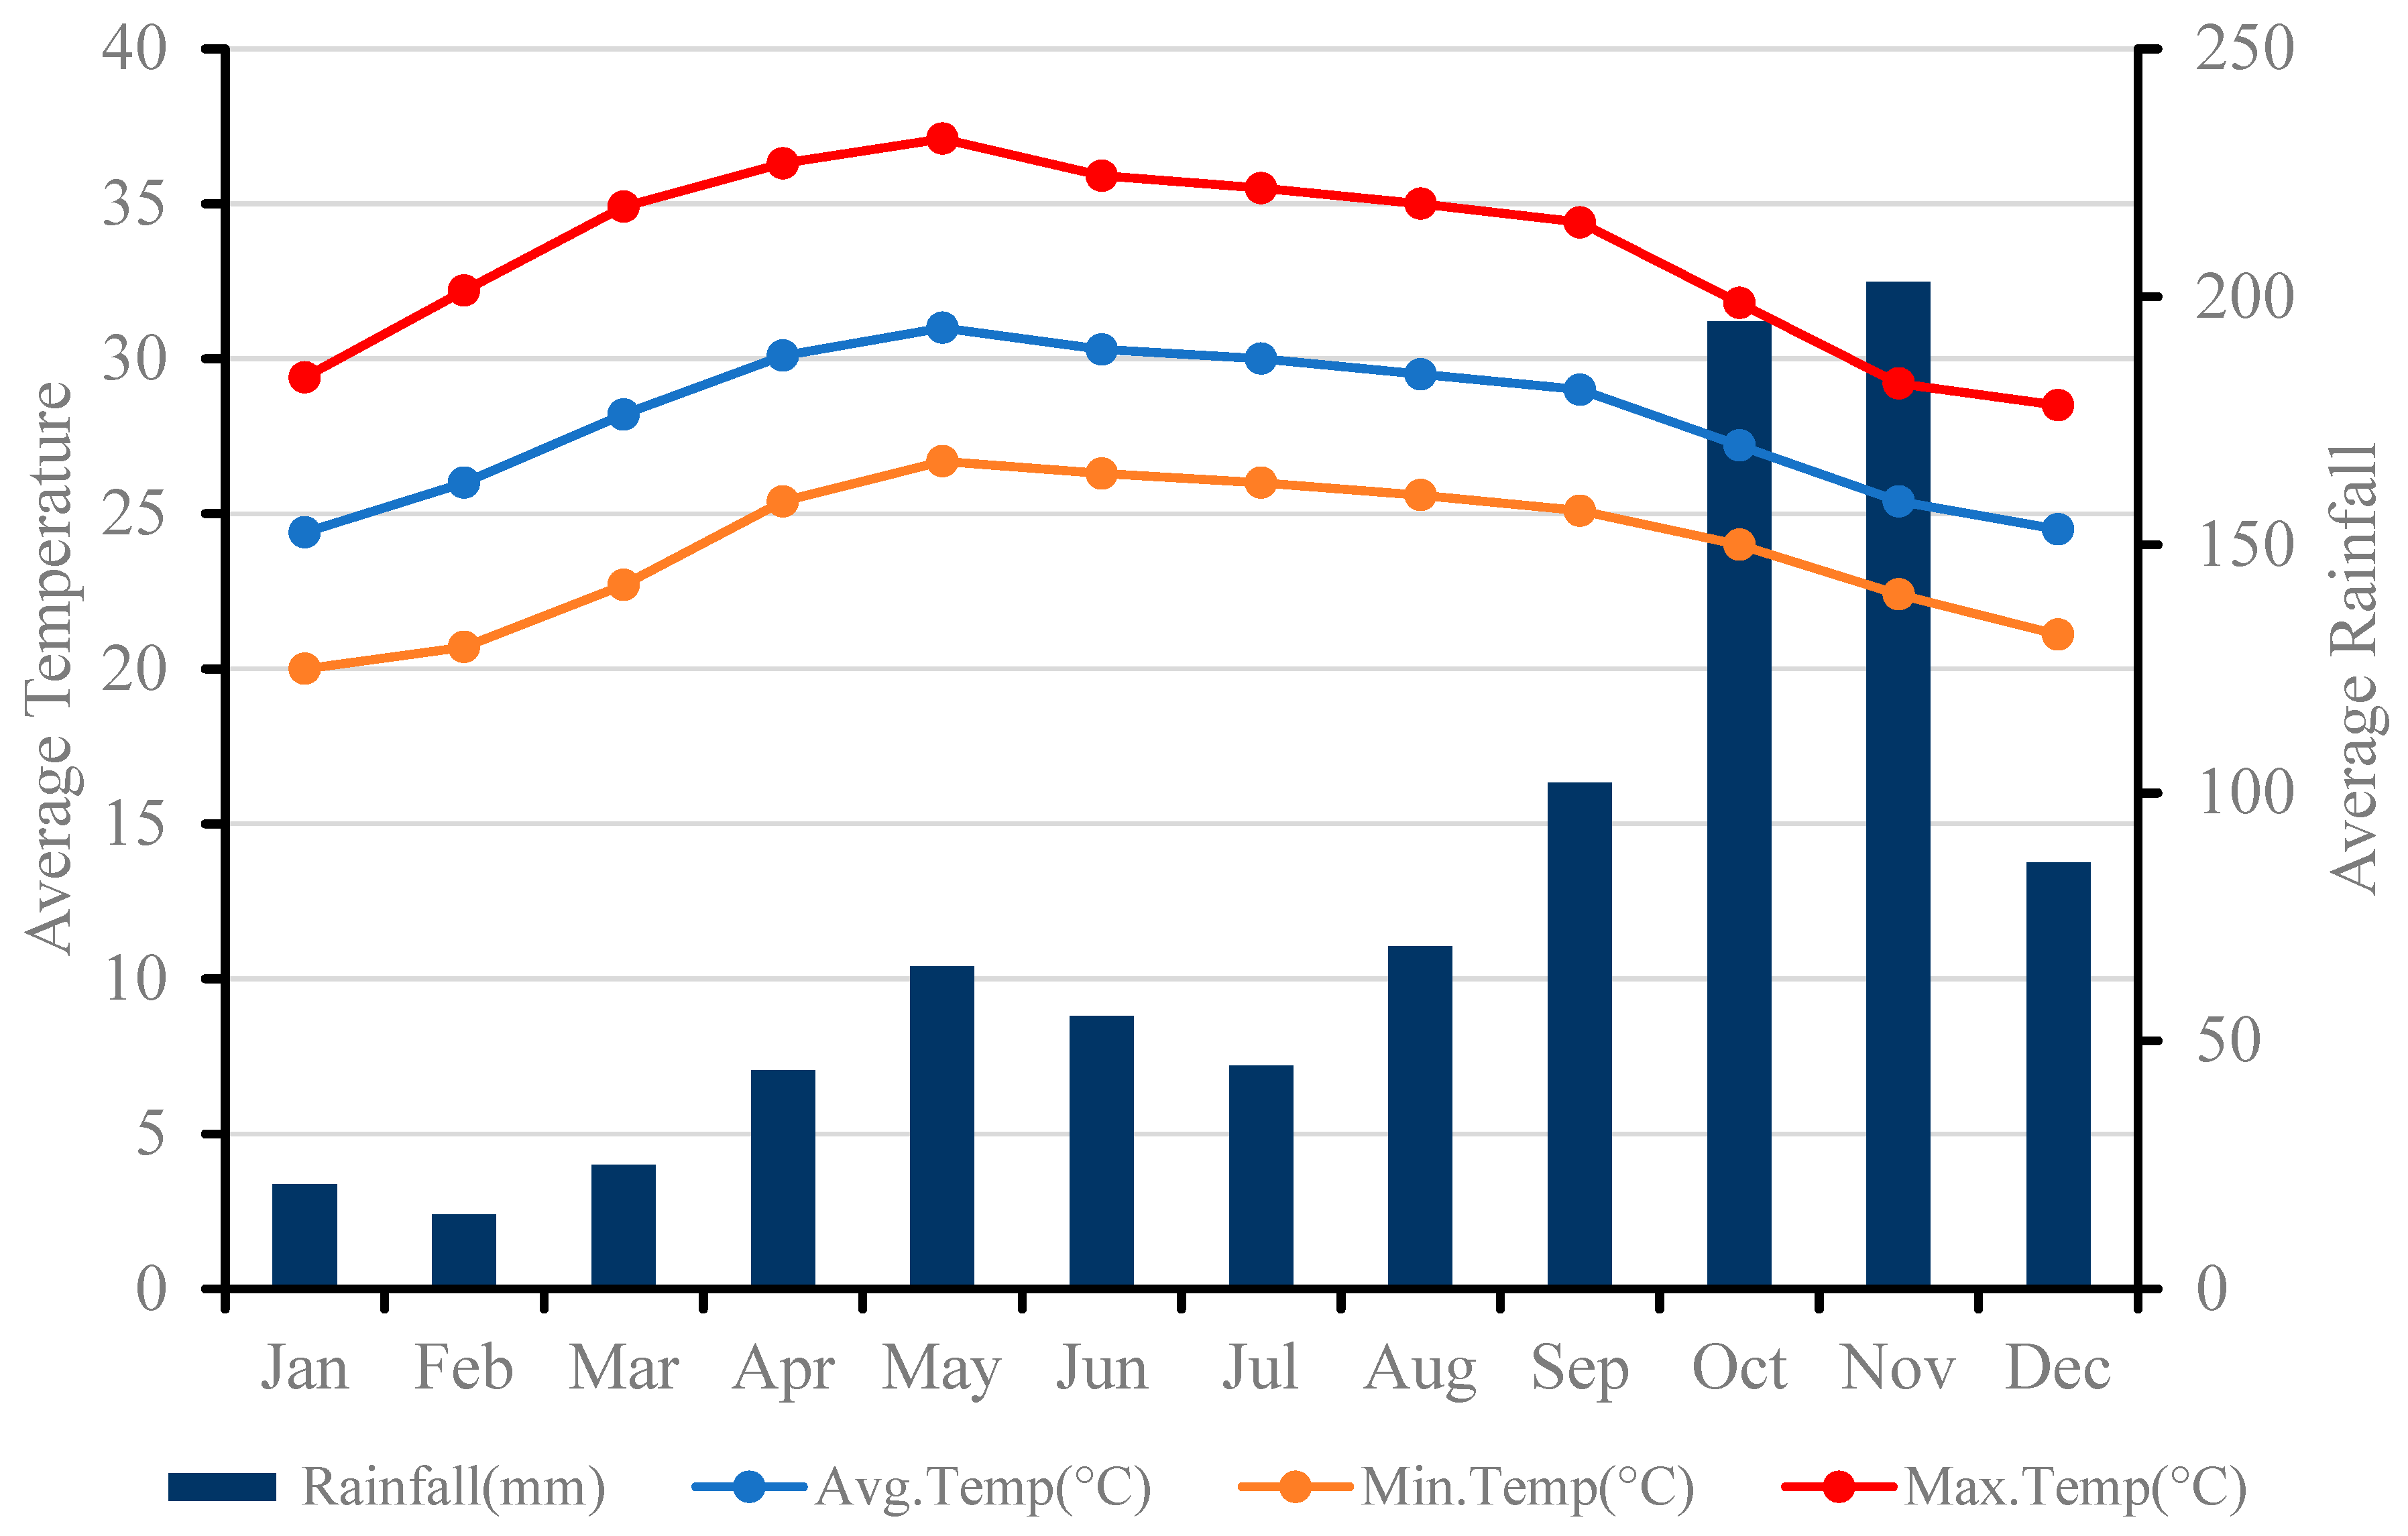
Figure 1. Climatic variation in the study region for last 30 years [43].
Water 16 02566 g001
Figure 2. Geological composition of the study region [44].
Water 16 02566 g002
Figure 3. Methodology for calculating the ASI value for irrigation suitability.
Water 16 02566 g003
Figure 4. Spatial classification of the SAR of groundwater pre and post monsoons.
Water 16 02566 g004
Figure 5. RSC classification of groundwater pre and post monsoons.
Water 16 02566 g005
Figure 6. Percentage sodium classification of groundwater during both seasons.
Water 16 02566 g006
Figure 7. Spatial analysis of KR pre and post monsoons.
Water 16 02566 g007
Figure 8. PI classification of groundwater pre and post monsoons.
Water 16 02566 g008
Figure 9. MAR spatial distribution in the study region pre and post monsoons.
Water 16 02566 g009
Figure 10. PS spatial distribution pre and post monsoons.
Water 16 02566 g010
Figure 11. Spatial analysis of chloride contamination in the study region.
Water 16 02566 g011
Figure 12. Spatial analysis of groundwater classification based on the SMI.
Water 16 02566 g012
Figure 13. Spatial analysis of the ASI classification in the study region.
Water 16 02566 g013
Figure 14. Scree plot of the rotation matrix (a) pre monsoon and (b) post monsoon (the red dots represent the number components).
Water 16 02566 g014
Table 1. Relative weight of each irrigation index.
S. No.ParameterRelative Weight (Wi)WiSi
1Sodium absorption ratio (SAR)50.227318
2Percentage sodium (PS)40.181860%
3Permeability index (PI)40.181825
4Magnesium absorption ratio (MAR) 30.136450
5Potential salinity (PS)20.090910
6Kelly’s ratio (KR)10.04552
Table 2. Classification of groundwater suitability based on the chlorinity index.
Chloride Concentration (g/L)Water ClassPurpose of Use
0 to 0.3Class ISuitable for all types of crops
0.3 to 0.7Class IISuitable for crops with high, medium, and low salt tolerance
0.7 to 0.9Class IIISuitable for crops with high and medium salt tolerance
0.9 to 1.3Class IVSuitable for crops with high salt tolerance
Above 1.3Class VNot suitable for any crops
Table 3. Seasonal variation in irrigation quality indices in the study area.
CategoryPre MonsoonPost MonsoonWater TypeChange in Quality
Sample CountSample %Sample CountSample %
Sodium absorption ratio (SAR)
Less than 105292.865089.29Excellent−3.57
10 to 1847.1458.93Good1.79
18 to 260011.79Doubtful1.79
Greater than 260000.00Unsuitable0.00
Percent sodium (%Na)
0 to 201017.8623.57Excellent−14.29
20 to 401832.141323.21Good−8.93
40 to 601526.792239.29Permissible12.50
60 to 801323.211628.57Doubtful5.36
Greater than 800035.36Unsuitable5.36
Residual sodium carbonate (RSC)
Less than 1.255191.074682.14Satisfactory−8.93
1.25 to 2.535.3647.14Marginal1.78
Greater than 2.523.57610.71Un-Satisfactory7.14
Magnesium absorption ratio (MAR)
Less than 501017.86610.71Suitable−7.15
Greater than 504682.145089.29Unsuitable7.15
Permeability index (PI)
Greater than 754173.212544.64Class I−28.57
75 to 2514253155.36Class II30.36
Less than 2511.7900Class III−1.79
Kelly’s ratio (KR)
Less than 13766.072341.07Good−25.00
1 to 21323.212646.43Doubtful23.22
Greater than 2610.71712.5Unsuitable1.79
Potential salinity (PS)
Less than 53358.933562.5Good3.57
5 to 10916.071221.43Doubtful5.36
Greater than 101425916.07Unsuitable−8.93
Note: Bold values indicate a negative variation in the water type during the post-monsoon season.
Table 4. CI-based classification of groundwater.
Chloride Concentration (mg/L)Pre MonsoonPost MonsoonWater Class
Sample CountSample %Sample CountSample %
0 to 3003867.864173.21Class I
300 to 7001323.211017.86Class II
700 to 90000.0011.79Class III
900 to 130023.5735.36Class IV
Above 130035.3611.79Class V
Table 5. Groundwater type based on the ASI value.
Range of ASIPre MonsoonPost MonsoonWater Uses
Sample Count% SampleSample Count% Sample
0 to 502646.431730.36For all types of crops
50 to 1002035.713155.36For all types of crops
100 to 150610.7123.57Crops with low and medium salt tolerance
150 to 20023.5735.36Crops with medium and high salt tolerance
GT 20023.5735.36Unsuitable for all crops
Table 6. Rotation matrix value for each parameter during both seasons.
Rotated Component Matrix
Parameter/ComponentPre MonsoonPost Monsoon
1234123
pH−0.3530.771−0.190−0.387−0.0690.689−0.539
Total dissolved solids0.9080.0280.4040.0720.9810.0550.168
EC0.9080.0330.4050.0730.9820.0600.119
Total hardness0.978−0.0640.1200.1060.950−0.0780.218
Ca2+0.971−0.0650.1470.0060.871−0.1310.363
Mg2+0.951−0.0610.0990.1660.955−0.0630.177
Na+0.1970.1920.9560.0430.9510.1450.119
K+0.7120.0430.2040.1130.3990.104−0.137
Cl0.622−0.0640.7560.0490.989−0.0410.089
SO42−0.987−0.0230.0150.0260.6860.1480.530
CO32−−0.0700.8960.234−0.209−0.0040.896−0.074
HCO30.5110.5960.2880.3650.1420.7710.436
NO30.084−0.0700.0390.9380.183−0.0280.775
F0.0810.692−0.0020.4220.0240.731−0.031
Note: Rotation method: Varimax with Kaiser Normalization.
Table 7. Eigen values, % of variance, and cumulative % for each season.
ComponentPre MonsoonPost Monsoon
Total% of VarianceCumulative %Total% of VarianceCumulative %
17.74955.34855.3487.58054.14454.144
22.42517.32472.6722.51517.96572.109
31.2729.08681.7581.1398.13380.242
41.1378.12189.8790.9967.11287.354
50.6584.69894.5770.7505.35492.708
60.3442.45797.0340.4893.48996.198
70.2091.49498.5290.2261.61597.813
80.1050.75399.2810.1491.06598.878
90.0780.55699.8370.1100.78399.661
100.0220.15799.9940.0450.32399.984
110.0010.00499.9980.0020.01399.998
120.0000.002100.0000.0000.00299.999
134.55 × 10−50.000100.0000.0000.001100.000
14−1.01 × 10⁻¹⁷−7.26 × 10−17100.0002.74 × 10−161.95 × 10−15100.000
Disclaimer/Publisher’s Note: The statements, opinions and data contained in all publications are solely those of the individual author(s) and contributor(s) and not of MDPI and/or the editor(s). MDPI and/or the editor(s) disclaim responsibility for any injury to people or property resulting from any ideas, methods, instructions or products referred to in the content.