Abstract
Reference evapotranspiration (ET) is crucial for effective agricultural and water resource management, with the FAO-56 Penman-Monteith (FAO PM) method being the standard for its estimation. However, in regions with incomplete or poor-quality meteorological data, alternative ET estimation methods may be necessary. This study evaluates the calibration and performance of seven alternative ET methods (Hamon, Hansen, Hargreaves–Samani, Jensen–Haise, Makkink, Priestley–Taylor, and Thornthwaite) across 117 sub-basins in South Korea. Monthly calibration coefficients were derived from FAO PM estimates to adjust these methods and enhance their accuracy. Results showed that, prior to calibration, deviations between alternative methods and FAO PM could exceed 70 mm per month. Post-calibration, these deviations were reduced to within 5 mm, indicating substantial improvements. Methods incorporating multiple climatic variables, particularly Priestley–Taylor, demonstrated higher accuracy compared to temperature-only methods. Although temperature-based methods like Hamon and Thornthwaite were effective in data-sparse regions, they required precise calibration. Applying sub-basin calibration coefficients to individual sites was a viable alternative to site-specific calibration, though it did not always match the precision of the latter. This study highlights the effectiveness of calibration in refining ET estimates and suggests combining site-specific and area-based approaches for robust ET estimation. Future research should continue to refine calibration techniques and explore advanced methods to improve ET estimation across diverse climatic conditions.
1. Introduction
Evapotranspiration (ET) plays a crucial role in the water cycle and is a key factor in various fields such as water resource management, agricultural planning, climate research, hydrological modeling, and ecosystem management. Reference ET is the rate of evapotranspiration from a hypothetical reference crop under optimal water conditions. The most accurate determination of reference ET involves experiments on the reference crop itself. However, due to the complexities of capturing regional climate characteristics, empirical and physical methods using climate variables are commonly employed.
In 1948, Penman developed a formula to estimate ET from an open water surface, known as natural evaporation, by combining energy balance and mass transfer methods with meteorological data such as solar radiation, temperature, humidity, and wind speed [1]. This method was later refined by incorporating resistance coefficients for application to crop surfaces. In 1965, Monteith further enhanced the formula by including aerodynamic and surface resistance factors affecting plant transpiration [2]. Over 50 theoretical and empirical equations have been proposed to estimate reference ET [3,4]. Among these, the FAO-56 Penman-Monteith (FAO PM) equation was established as the standard method for estimating reference ET by the United Nations Food and Agriculture Organization (FAO) in May 1990 [5].
The FAO PM method assumes the reference crop is grass with a height of 0.12 m, a fixed canopy resistance of 70 s/m, and an albedo of 0.23 [5]. It is recommended for broad use across various climatic conditions without additional calibration, as it integrates various climatic factors (e.g., temperature, wind speed, humidity, and solar radiation) that influence ET [6]. However, in regions where some of these climatic factors are unmeasured or of poor quality, alternative methods that use fewer climatic variables may be necessary [7].
Alternative methods for estimating reference ET can be categorized based on the climatic factors they utilize, such as temperature, solar radiation, and mass transfer. Additionally, modified versions of the FAO PM equation are used to estimate ET when some meteorological factors are missing. As highlighted by Kim et al. [6], despite the development of numerous alternative equations, ongoing research is needed to refine and review these methods across different regions. This is because many alternative equations, unlike the FAO PM, were developed using limited meteorological factors under specific climatic conditions. As a result, their reliability can be challenging to ensure when applied to different climatic regions. Even under similar conditions, performance can vary significantly depending on the region.
To improve the performance of these alternative equations, the most accurate approach is to derive region-specific coefficients through direct measurements, such as lysimeter observations [8,9,10]. However, acquiring such data across various regions is often impractical. Consequently, many studies have adjusted alternative equations based on pan evaporation [11,12,13,14,15] or FAO PM values. Researchers have compared over ten alternative equations with FAO PM results and proposed methods tailored to the climatic characteristics of their respective regions [7,15,16,17,18,19,20,21,22,23,24,25,26,27,28,29,30,31,32,33,34,35,36].
A common approach to adjusting alternative equations for estimating reference ET involves comparing them with standard values and modifying their coefficients accordingly [7,20,33,35,37,38,39,40,41,42,43,44,45,46,47,48,49,50,51,52,53,54,55,56,57,58,59,60,61]. Many researchers use a first-order regression model to calibrate the ET calculated by alternative methods against these standard values [13,14,16,32,34,62,63,64,65,66,67,68,69,70,71]. Typically, a constant correction coefficient is applied throughout the entire period. However, some has research indicated that using optimized monthly correction factors generally leads to better performance [9,16,39,40,41,45,47,53,59,64,68,71].
For broader applicability, many studies have utilized localized calibration coefficients derived from the climatic data of the target area [10,24,25,38,43,45,46,48,50,52,57,63,71,72,73]. These studies often perform site-specific calibrations using observational data that encompass all the meteorological factors required for applying the FAO PM method. The adjusted coefficients may be presented as either monthly variations or constant values for the entire period. Some studies have also provided localized values for larger areas by considering regional climate characteristics or area averages [10,38,39,40,42,45,46,52,57,59,63,71].
Results from applying alternative equations vary depending on the region and the time period, even under similar climatic conditions. Thus, there is no universally optimal alternative equation or definitive spatiotemporal scope for its adjustment. However, a consistent finding is that the performance of most alternative equations improves significantly with proper calibration. Therefore, to ensure reliable reference ET estimates using alternative methods, appropriate calibration processes based on FAO PM results or measured values are crucial [18]. Applying monthly localized correction coefficients, as indicated by previous studies, can further enhance the effectiveness of these alternative equations.
As mentioned above, the evaluation and application of various alternative equations for estimating reference ET have been ongoing worldwide. In South Korea, similar efforts have been made to compare and assess alternative equations using reference values such as pan evaporation [17,74,75,76,77] and FAO PM results [78,79]. Notably, many studies have focused on calibrating the Hargreaves equation, among others [3,54,80,81,82]. For instance, Kim et al. [6] utilized data from 73 locations across South Korea to develop monthly correction coefficients for seven alternative equations, significantly enhancing simulation performance compared to pre-calibration results.
The limited research on calibrating alternative equations in South Korea is likely due to the relatively easy access to high-quality meteorological data, which facilitates the use of the FAO PM method [6]. However, when observational data are incomplete or of low quality, the FAO PM method may be impractical, making the use of alternative equations necessary. Additionally, regions not covered by existing studies [3,54,80,81], such as those not analyzed by Kim et al. [6], may also benefit from alternative methods.
This study aims to provide reliable reference ET estimates for South Korea at a watershed scale by calibrating seven alternative equations on a monthly basis. By examining regional monthly deviations relative to FAO PM values, the study will derive optimal calibration coefficients and assess the spatiotemporal performance of these corrected estimates.
2. Materials and Methods
2.1. Study Area and Data
To evaluate area-based reference ET, 117 sub-basins from the hydrological unit map of South Korea were selected, as shown in Figure 1. Meteorological data needed for calculating reference ET were obtained from daily observations spanning the past 50 years (1972–2021) at 99 automated synoptic observation system (ASOS) sites managed by the Korea Meteorological Administration (KMA). For locations lacking solar radiation measurements or during periods with missing data, solar radiation was estimated using the Angstrom formula [5] based on sunshine duration.
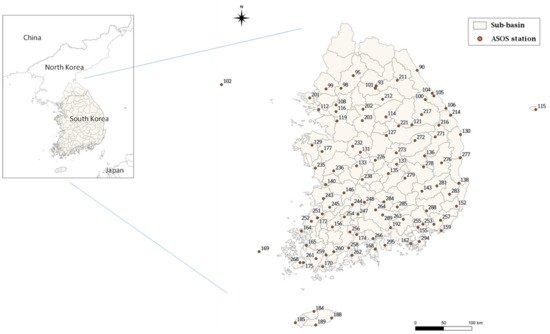
Figure 1.
Sub-basins and KMA ASOS sites on the hydrological unit map of South Korea.
In South Korea, the extensive network of ASOS observation stations provides long-term meteorological data essential for the FAO PM method, including maximum and minimum temperatures, relative humidity, wind speed, and sunshine duration. Consequently, it is more practical to estimate reference ET for each station using the FAO PM method rather than relying on alternative methods. When certain meteorological parameters are missing for specific periods at some stations, reliable reference ET can still be estimated using the corrected alternative methods from Kim et al. [6].
However, calculating reference ET on a watershed scale poses challenges when relying solely on site-specific values. While averaging site-specific reference ET across a watershed is one approach, this study adopts a more refined method. To address potential data gaps or unmeasured parameters at individual sites, a time-varying Thiessen polygon network was utilized. Specifically, a Thiessen network was constructed for the entire country based on the available data from the 99 sites shown in Figure 1 for each date. This network was then overlaid onto the 117 sub-basins, and the area-averaged meteorological data for each sub-basin were calculated by reflecting the area proportions of each Thiessen polygon. Subsequently, the daily meteorological data derived for each sub-basin were used to estimate the reference ET for each basin throughout the analysis period (1972–2021).
2.2. Method for Estimating Reference ET and Deriving Calibration Coefficients
As outlined by Kim et al. [6], the methods for estimating reference ET include FAO PM and seven alternative methods: Hamon, Hansen, Hargreaves–Samani, Jensen-Heise, Makkink, Priestley–Taylor, and Thornthwaite. Among these methods, Hamon, Hargreaves–Samani, and Thornthwaite use only temperature data (maximum and minimum temperatures) to estimate reference ET. The Hansen, Jensen-Heise, and Makkink methods incorporate both temperature and sunshine duration, while the Priestley–Taylor method utilizes temperature, sunshine duration, and relative humidity. FAO PM employs temperature, sunshine duration, relative humidity, and wind speed.
The equations for each method are detailed below.
(1) FAO PM [5]
(2) Hamon [83,84]
(3) Hansen [85]
(4) Hargreaves–Samani [8,86]
(5) Jensen–Haise [87]
(6) Makkink [88]
(7) Priestley–Taylor [89]
(8) Thornthwaite [90,91]
where is the reference evapotranspiration (mm/day), is the slope of vapor pressure curve (kPa/°C), is the net radiation at the crop surface (MJ/m2/day), is the soil heat flux density (≒0 for day to ten days period) (MJ/m2/day), is the psychrometric constant (kPa/°C), is the mean temperature (°C), is the wind speed at 2 m height (m/s), is the saturation vapor pressure (kPa), is the actual vapor pressure (kPa), is the calibration coefficient of Hamon method, is the maximum possible daylight hours (h), is the total solar radiation (MJ/m2/day), is the latent heat of vaporization (2.45 MJ/kg), is the extraterrestrial solar radiation (MJ/m2/day), is the maximum temperature (°C), is the minimum temperature (°C), is the calibration constant of Priestley–Taylor method, is the correction factor of the Thornthwaite method (N/360), is the effective daily temperature (°C), is the thermal (or heat) index of the Thornthwaite method, is the exponent of the Thornthwaite method.
The variables and coefficient values used in the calculations for each method are based on standard values provided by Allen et al. [5], Kim et al. [6], and other relevant literature. For example, the correction coefficient for the Hamon method, , is set at 1.2, as suggested by previous studies [92,93], and the correction coefficient for the Priestley–Taylor method, , is set at 1.26, the average value reported by Priestley and Taylor [89].
Based on area-averaged meteorological data for each sub-basin, the reference ET was calculated using both the FAO PM method and seven alternative methods. Calibration was performed using a linear regression model without an intercept, as employed by Farzanpour et al. [32], Kim et al. [6], and Gharehbaghi and Kaya [71]. Monthly calibration coefficients were derived by comparing the ET values from the alternative methods with those from the FAO PM method. Corrections were applied to each sub-basin, taking into account local meteorological characteristics. These calibration coefficients, which adjust deviations from the FAO PM monthly ET, are expressed by the following equation:
where is the calibration coefficient for method in month , is the reference ET for method in month (mm/month), and is the reference ET by FAO PM in month (mm/month).
If the calibration coefficient is greater than 1, it indicates that the method underestimates the reference ET compared to the FAO PM method before calibration. Conversely, a coefficient less than 1 suggests that the method overestimates the reference ET.
To determine the calibration coefficients, daily reference ET values were calculated for 117 sub-basins and then aggregated monthly. The monthly reference ET data were randomly divided into calibration and validation datasets. Calibration coefficients were derived from the calibration dataset, while the validation dataset was used to assess the performance. The fit criteria were assessed using the Nash–Sutcliffe Efficiency (NSE) [94] and the coefficient of determination (R2) indices. The initial condition was set to 0.7 or higher, and during the process of 10,000 calibration/validation iterations, this threshold was progressively lowered to ultimately select the 100 calibration coefficients with the highest final fit. The average of these 100 coefficients was computed to obtain the optimized monthly calibration coefficients for each sub-basin.
Additionally, to evaluate the fit between the reference ET calculated by each alternative method (before and after calibration) and the FAO PM results, four evaluation indices were employed: NSE, R2, Percent Bias (PBIAS), and Root Mean Square Error (RMSE). The index is calculated as follows:
where represents the observed values (i.e., values calculated using FAO PM), represents the model values (i.e., values calculated using the alternative method), and and are the means of the observed and model values, respectively.
3. Results
3.1. Derivation of Calibration Coefficients by Sub-Basin
As described in the methodology, monthly (from January to December) calibration coefficients were derived by examining the linear regression relationship between the reference ET values calculated using each alternative method and those from the FAO PM method.
Figure 2 and Figure 3 present examples of the derived calibration coefficients for the Chungju Dam sub-basin (1003) in the Han River Basin and the Andong Dam sub-basin (2001) in the Nakdong River Basin, respectively. These figures illustrate the variation in calibration coefficients obtained from 100 random validation processes, with the final calibration coefficients calculated as the average values for each month.
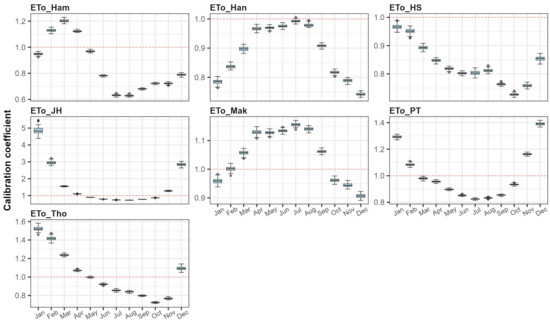
Figure 2.
Monthly calibration coefficient for the Chungju Dam sub-basin (1003).
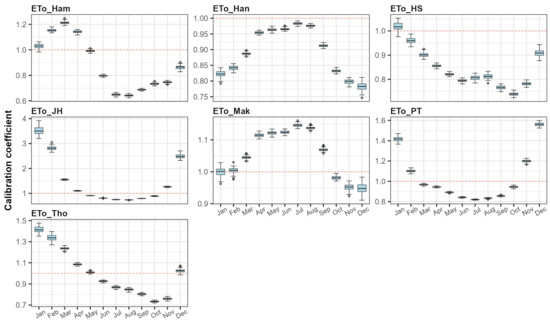
Figure 3.
Monthly calibration coefficient for the Andong Dam sub-basin (2001).
In Figure 2, the calibration coefficients for the Hamon method exceed 1 from February to April, indicating that, prior to calibration, the Hamon method produces lower reference ET values compared to the FAO PM method. Conversely, from January, and from May to December, the coefficients are less than 1, suggesting that the Hamon method tends to overestimate reference ET compared to the FAO PM method. Thus, the monthly calibration coefficients derived can adjust the Hamon method’s estimates to align more closely with those of the FAO PM method. Similar calibration coefficients were derived for each alternative method on a monthly basis for all 117 sub-basins.
Figure 4, Figure 5 and Figure 6 display the monthly calibration coefficients for various sub-basins, using the Hamon method with temperature data only, the Makkink method with temperature and sunshine duration data, and the Priestley–Taylor method with temperature, sunshine duration, and relative humidity data. In these figures, red areas indicate calibration coefficients greater than 1.0, showing that, without calibration, the method tends to produce lower ET estimates compared to the FAO PM method. Blue areas, where the coefficients are less than 1.0, reflect methods that generally provide higher ET estimates. Specifically, for the Hamon method, calibration coefficients are generally above 1.0 from June to October, suggesting it tends to overestimate ET relative to the FAO PM during these months. Conversely, the Makkink method typically underestimates ET compared to the FAO PM from March to September.
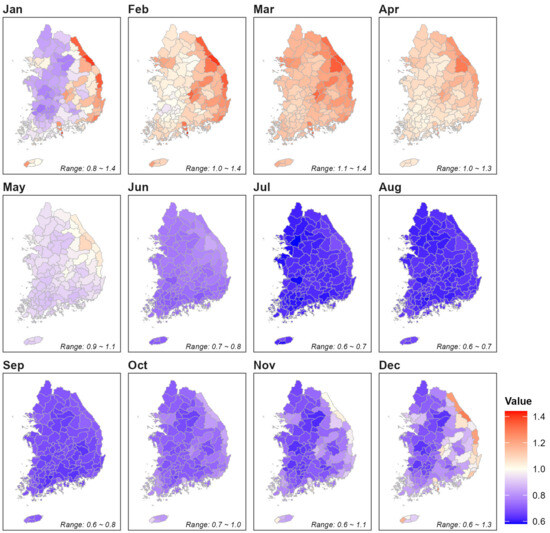
Figure 4.
Monthly calibration coefficient by sub-basin for the Hamon method.
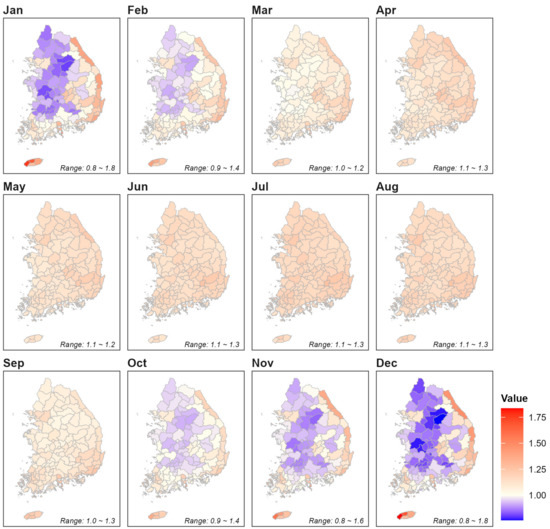
Figure 5.
Monthly calibration coefficient by sub-basin for the Makkink method.
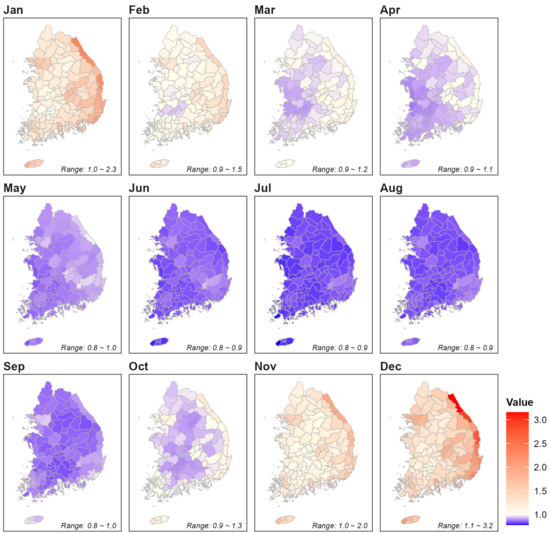
Figure 6.
Monthly calibration coefficient by sub-basin for the Priestley–Taylor method.
3.2. Comparison of Reference ET before and after Calibration
Figure 7 displays the monthly average reference ET before and after calibration, averaged across all 117 sub-basins. Before calibration, deviations from the FAO PM method varied by up to more than 70 mm per month. After calibration, these deviations were reduced to within a maximum of 5 mm. Among the methods, Hansen’s method initially showed the smallest deviation range of −0.7 to +9.7 mm, while the Hamon method exhibited the largest range of −9.3 to +71.9 mm. Specifically, in July, when reference ET values were highest, deviations were the largest, ranging from −17.3 to +71.9 mm. After calibration, deviations improved to within an average of 1 mm for most methods, except for the Jensen–Haise and Thornthwaite methods. The significant deviation in July before calibration decreased to a range of −0.6 to +0.2 mm after calibration.
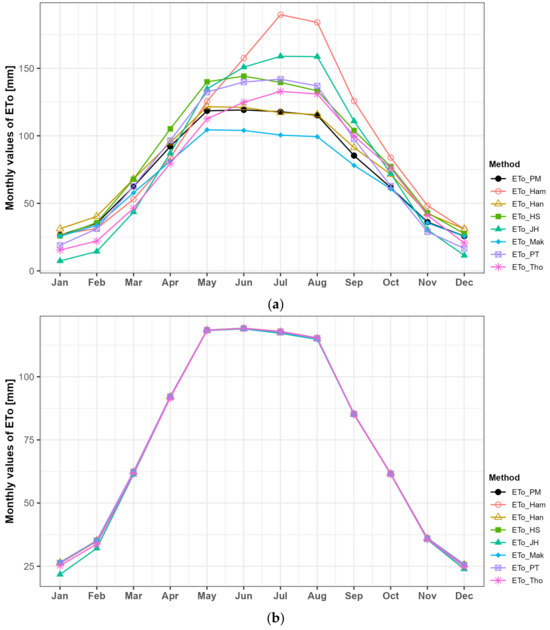
Figure 7.
Monthly average reference ET (a) before and (b) after calibration.
Figure 8 illustrates the goodness-of-fit (GOF) results of alternative methods compared to the reference ET values from FAO PM, using the FAO PM values as the standard. The analysis covers the monthly reference ET of each sub-basin from 1972 to 2021. The blue areas indicate GOF values before calibration, while the red areas show the results after calibration. Before calibration, PBIAS ranged from −10.0% to +27.3%, RMSE from 5.7 to 34.6 mm, NSE from 0.13 to 0.98, and R2 from 0.85 to 0.99. After calibration, PBIAS improved to −1.5% to −0.1%, RMSE decreased to 2.5 to 5.6 mm, NSE increased to 0.98 to 1.00, and R2 rose to 0.98 to 1.00, demonstrating improvements in all four GOF indices. Notably, the calibration effect was relatively significant for the Hamon and Jensen–Haise methods. After calibration, there was no substantial difference in the GOF results among the alternative methods.
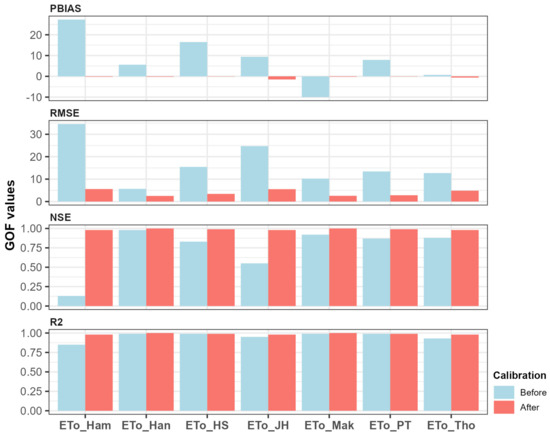
Figure 8.
Goodness-of-fit test results of monthly reference ET before and after calibration.
Figure 9 compares the annual deviations of reference ET for each method against FAO PM, examining the time series of annual reference ET for South Korea from 1972 to 2021, averaged across all 117 sub-basins. Before calibration, deviations ranged from −128 to +307 mm, with relatively larger deviations observed for the Hamon, Hargreaves–Samani, and Thornthwaite methods. Generally, the reference ET values calculated by the Hamon, Hansen, Hargreaves–Samani, Jensen–Haise, and Priestley–Taylor methods were higher than those of FAO PM, while Makkink showed lower values. After calibration, deviations were significantly reduced to a range of −76 to +62 mm. Deviations for the Hansen, Makkink, and Priestley–Taylor methods were relatively smaller, but the differences between methods were not substantial.
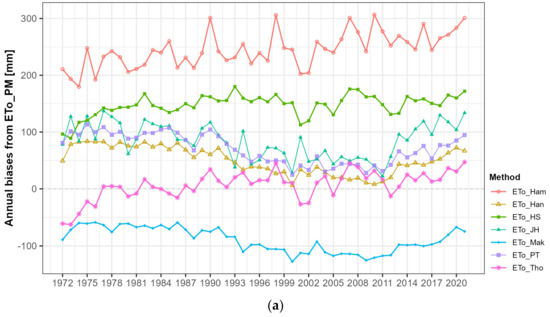
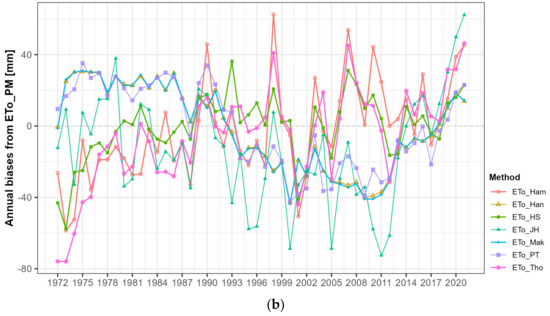
Figure 9.
Annual deviations of reference ET by method compared to FAO PM (a) before and (b) after calibration.
Figure 10 compares the annual average deviations of reference ET calculated for each sub-basin against FAO PM, both before (blue) and after (red) calibration. Each point represents the average deviation value for an individual sub-basin. After calibration, deviations are close to zero, indicating that the reference ET values from each alternative method are now very similar to those from FAO PM.
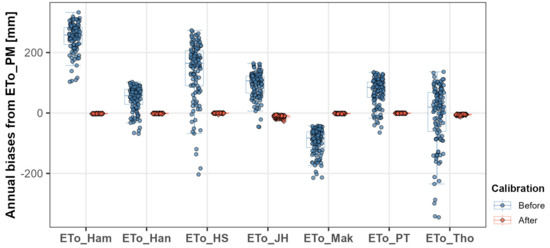
Figure 10.
Annual average deviations of reference ET compared to FAO PM for 117 sub-basins.
3.3. Evaluation of Reference ET at Sites Using Sub-Basin Calibration Coefficients
In the previous study by Kim et al. [6], calibration coefficients for 73 ASOS sites were determined, demonstrating excellent calibration effects at these sites. However, for locations where the FAO PM method could not be applied due to unavailable data or constraints, calculating reliable reference ET becomes challenging. Therefore, this study evaluated the calibration effects of applying the derived calibration coefficients for each sub-basin to sites within those sub-basins, extending the approach to unmeasured sites.
Figure 11 and Figure 12 compare the monthly average reference ET before and after applying the sub-basin calibration coefficients to four specific sites: Daegwallyeong (100), Seoul (108), Gwangju (156), and Busan (159), as shown in Figure 1. Table 1 displays the range of monthly deviations between the reference ET values from the seven alternative methods and the FAO PM results at these four sites. After applying the calibration coefficients, deviations were notably larger at Daegwallyeong (100) and Busan (159). Specifically, the Jensen–Haise method exhibited the largest deviation at Daegwallyeong (100), while the Hargreaves–Samani method showed relatively larger deviations at Busan (159). Although there may be some influence due to differences in the analysis periods compared to Kim et al.’s study [6], the deviations after applying the calibration coefficients are somewhat larger than the previously calculated values using site-specific calibration. Nevertheless, applying the sub-basin calibration coefficients still significantly improved the deviations.
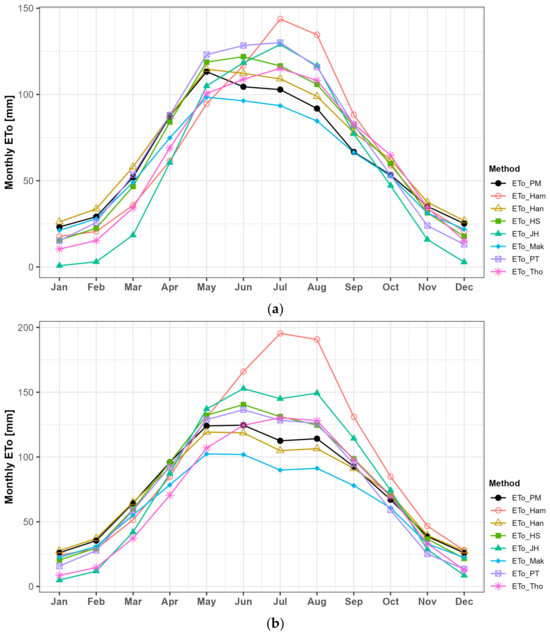
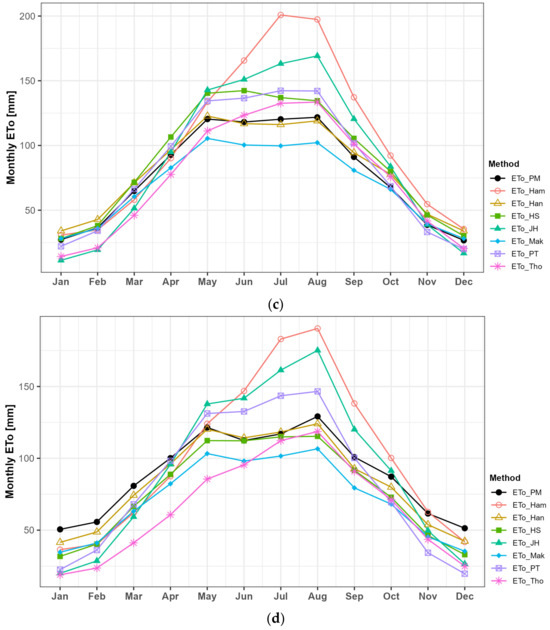
Figure 11.
Monthly average reference ET at (a) Daegwallyeong, (b) Seoul, (c) Gwangju, and (d) Busan before calibration.
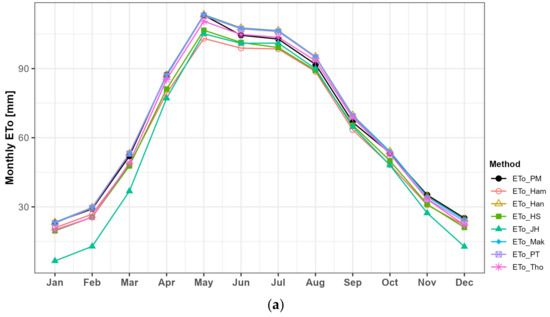
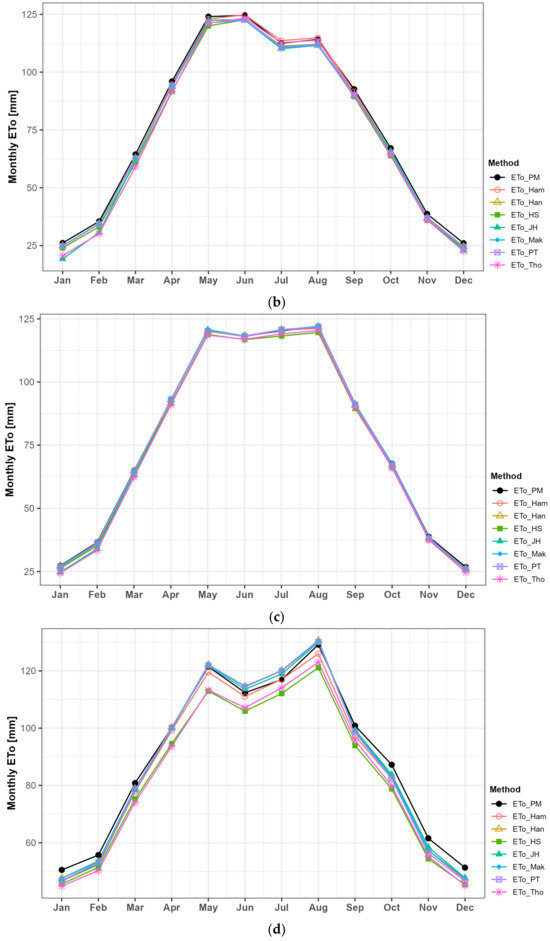
Figure 12.
Monthly average reference ET at (a) Daegwallyeong, (b) Seoul, (c) Gwangju, and (d) Busan after calibration.

Table 1.
Comparison of monthly average reference ET deviations before and after calibration at four sites.
Figure 13 compares the GOF results before and after applying the sub-basin calibration coefficients for 71 ASOS sites analyzed in Kim et al. [6]. Using FAO PM results as the standard, the GOF for the reference ET values obtained from each alternative method was assessed. Each point represents an individual site, with blue indicating results before calibration and red indicating results after calibration. Deviations before calibration ranged from PBIAS −35.6% to +41.5%, RMSE 4.8 to 42.5 mm, NSE −1.14 to 0.98, and R2 0.71 to 0.99. After calibration, PBIAS improved to −14.7% to +15.2%, RMSE decreased to 2.7 to 15.8 mm, NSE increased to 0.68 to 1.00, and R2 rose to 0.79 to 1.00, indicating significant improvements.
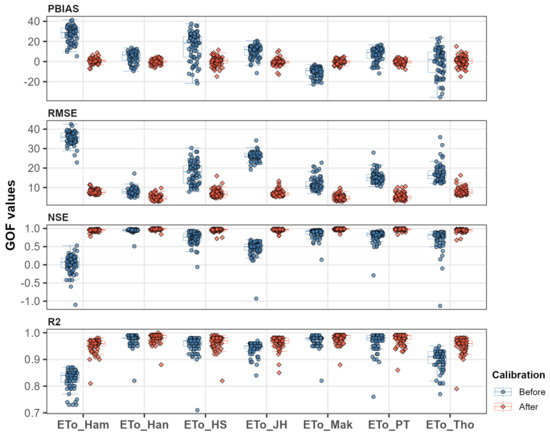
Figure 13.
Goodness-of-fit test results of monthly reference ET before and after calibration for 71 ASOS sites.
Figure 14 and Figure 15 present maps comparing PBIAS and RMSE results before and after calibration for the 71 sites. Blue circles represent the results before calibration, while red circles indicate results after calibration. The size of the circles reflects the magnitude of PBIAS and RMSE values. As shown in Figure 13, most sites experienced improvements in PBIAS and RMSE values after calibration, with the Hamon method showing relatively significant calibration effects. This suggests that using the Hamon method without calibration could lead to substantial deviations from the FAO PM reference ET values.
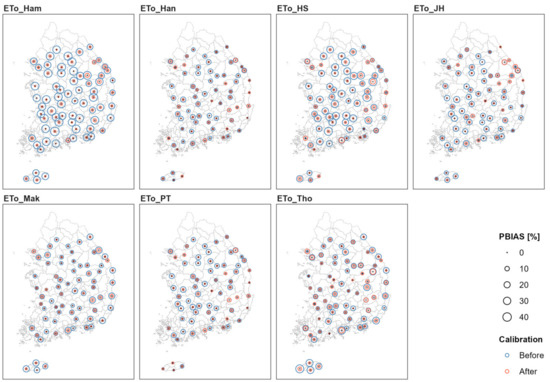
Figure 14.
Comparison of PBIAS before and after calibration for 71 ASOS sites.
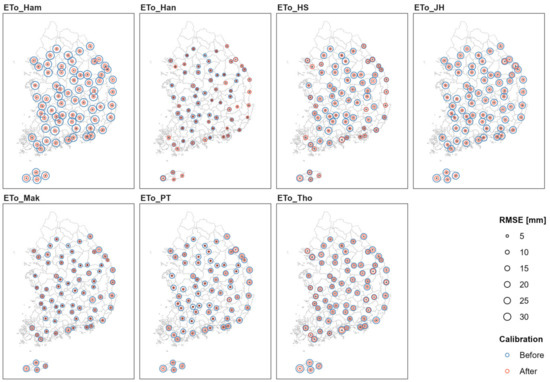
Figure 15.
Comparison of RMSE before and after calibration for 71 ASOS sites.
Based on these results, when applying the FAO PM method is challenging due to unmeasured sites or issues with the availability and quality of meteorological data, using calibration coefficients derived for the corresponding sub-basins can yield reference ET values close to those from FAO PM. Among the seven alternative methods evaluated in this study, the Hamon, Hargreaves–Samani, and Thornthwaite methods, which rely solely on temperature data, are particularly useful in situations with limited observations.
The results from the sub-basin analysis in Figure 8, and the site-specific GOF analysis in Figure 13, Figure 14 and Figure 15, indicate that calibration effects are most significant for the Hamon and Jensen–Haise methods. After calibration, the Hansen, Makkink, and Priestley–Taylor methods demonstrated relatively higher levels of GOF.
4. Discussion
This study aimed to calibrate seven alternative ET estimation methods across 117 sub-basins in South Korea and assess their performance relative to the FAO PM method. By deriving monthly calibration coefficients for each sub-basin, and applying these coefficients to estimate reference ET, we sought to enhance the accuracy of alternative ET methods, particularly in scenarios where key meteorological data for the FAO PM method are unavailable or of low quality. The discussion below focuses on the key findings, implications, and limitations of the study.
4.1. Performance of Calibration
The calibration of alternative ET estimation methods, particularly those with limited input data, such as the Hamon, Hargreaves–Samani, and Thornthwaite methods, significantly improved the accuracy of ET estimates across the 117 sub-basins. Prior to calibration, these methods exhibited considerable deviations from the FAO PM standard, with differences of up to more than 70 mm per month. Post-calibration, deviations were reduced to within 5 mm for most methods, underscoring the effectiveness of the calibration process. This result highlights the critical importance of region-specific calibration, especially for temperature-based methods that often over- or underestimate ET due to their limited consideration of other climatic factors like wind speed and humidity.
The study’s findings align with previous research, such as the work by Kim et al. [6], which emphasized the necessity of localized calibration coefficients for improving ET estimates in diverse climatic regions. The calibration approach used in this study, involving a linear regression model with monthly coefficients, proved effective at reducing biases and errors, as indicated by improvements in the GOF indices (NSE, R2, PBIAS, and RMSE). This result confirms that even simple temperature-based methods, when properly calibrated, can produce reliable ET estimates that are comparable to those from the more complex FAO PM method.
4.2. Implications for Water Resource Management and Agricultural Planning
The significant reduction in ET estimation errors post-calibration has important implications for water resource management, agricultural planning, and climate research in South Korea. Accurate ET estimates are essential for efficient irrigation scheduling, water allocation, and drought management, particularly in a country like South Korea, where regional climatic variability can be substantial. By providing more reliable ET estimates at a watershed scale, this study supports better decision-making in these areas.
The monthly calibration coefficients derived in this study also offer practical utility for operational applications, allowing practitioners to adjust ET estimates dynamically based on seasonal variations. This is particularly valuable in agricultural regions where crop water requirements fluctuate throughout the growing season. The improved accuracy of ET estimates post-calibration could help optimize water use, reduce wastage, and enhance crop yield, thereby contributing to sustainable agricultural practices.
4.3. Limitations and Considerations
While the study demonstrates the effectiveness of monthly calibration coefficients in improving ET estimates, several limitations must be considered. First, the calibration was based on historical data from 1972 to 2021, which may not fully capture future climate variability or extreme weather events. As climate change continues to alter temperature, precipitation patterns, and other climatic factors, the validity of the derived calibration coefficients may diminish over time. Future studies should explore the potential impacts of climate change on ET estimation and consider developing dynamic calibration models that can adapt to changing climatic conditions.
Second, although the study achieved significant improvements in ET estimation, the calibration process itself relies on the availability of high-quality reference data from the FAO PM method. In regions where such data are scarce or incomplete, the calibration process may be less effective, potentially limiting the applicability of the derived coefficients. Future research could explore alternative calibration approaches that do not require FAO PM data, such as those based on machine learning or data assimilation techniques.
Third, the study focused on a specific set of alternative ET methods and did not evaluate other potentially useful methods, such as those incorporating remote sensing data or more sophisticated physical models. Expanding the range of methods considered in future research could provide additional insights into the best approaches for different regions and data availability scenarios.
5. Conclusions
This study successfully derived and applied monthly calibration coefficients for seven alternative reference ET estimation methods across 117 sub-basins in South Korea. The calibration process, which involved comparing these alternative methods with the FAO PM method, significantly improved the accuracy of the reference ET estimates. This improvement was evident in the reduced deviations and enhanced goodness-of-fit indices observed after calibration, both at the sub-basin level and in site-specific evaluations.
The findings underscore the necessity of calibration when using alternative ET estimation methods, particularly in regions with limited or poor-quality meteorological data. While no single alternative method universally outperformed the others, the Hamon, Hargreaves–Samani, and Thornthwaite methods were particularly effective when temperature data were the only available input.
Future research should focus on refining these calibration techniques and assessing their applicability in regions with diverse climatic conditions. By improving the accuracy of reference ET estimates through calibration, uncertainties between different methods can be minimized, leading to more reliable ET estimates. This enhanced accuracy is crucial for applications to water resource management, agricultural planning, hydrological modeling, and ecosystem management, particularly in regions with limited or poor-quality meteorological data. Expanding the use of calibrated alternative methods can therefore provide a robust foundation for more effective decision-making in these critical areas.
Author Contributions
All authors substantially contributed to conceiving and designing the research, and realizing this manuscript. Conceptualization and research design, data analysis, C.-G.K.; methodology and validation of results, J.L.; formal analysis and data curation, J.-E.L.; funding acquisition and supervision, I.-M.C. All authors have read and agreed to the published version of the manuscript.
Funding
This work was carried out under the KICT Research Program (Development of IWRM-Korea Technical Convergence Platform Based on Digital New Deal) funded by the Ministry of Science and ICT.
Data Availability Statement
Data are contained within the article.
Conflicts of Interest
The authors declare no conflicts of interest.
References
- Penman, H.L. Natural evaporation from open water, bare soil and grass. Proc. R. Soc. Lond. Ser. A Math. Phys. Sci. 1948, 193, 120–145. [Google Scholar]
- Monteith, J.L. Evaporation and environment. Symp. Soc. Exp. Biol. 1965, 19, 205–234. [Google Scholar]
- Moon, J.W.; Jung, C.G.; Lee, D.R. Parameter regionalization of Hargreaves equation based on climatological characteristics in Korea. J. Korea Water Resour. Assoc. 2013, 46, 933–946. [Google Scholar] [CrossRef][Green Version]
- Grismer, M.E.; Orang, M.; Snyder, R.; Matyac, R. Pan evaporation to reference evapotranspiration conversion methods. J. Irrig. Drain. Eng. 2002, 128, 180–184. [Google Scholar] [CrossRef]
- Allen, R.G.; Pereira, L.S.; Raes, D.; Smith, M. Crop Evapotranspiration–Guidelines for Computing Crop Water Requirements–FAO Irrigation and Drainage Paper 56; FAO: Rome, Italy, 1998; Volume 300, p. D5109. [Google Scholar]
- Kim, C.-G.; Lee, J.; Lee, J.E.; Kim, H. Evaluation of improvement effect on the spatial-temporal correction of several reference evapotranspiration methods. J. Korea Water Resour. Assoc. 2020, 53, 701–715. [Google Scholar]
- Bodian, A.; Ndiaye, P.M.; Diop, S.B.; Diop, L.; Dezetter, A.; Ogilvie, A.; Djaman, K. Evaluation and calibration of alternative methods for estimating reference evapotranspiration in the main hydrosystems of Senegal: Senegal, Gambia and Gasamance River Basins. Proc. IAHS 2024, 385, 415–421. [Google Scholar] [CrossRef]
- Hargreaves, G.H.; Samani, Z.A. Reference crop evapotranspiration from temperature. Am. Soc. Agric. Eng. 1985, 1, 96–99. [Google Scholar] [CrossRef]
- Saeed, M. The estimation of evapotranspiration by some equations under hot and arid conditions. Trans. ASABE 1986, 29, 434–438. [Google Scholar] [CrossRef]
- Xu, J.; Peng, S.; Ding, J.; Wei, Q.; Yu, Y. Evaluation and calibration of simple methods for daily reference evapotranspiration estimation in humid East China. Arch. Agron. Soil Sci. 2013, 59, 845–858. [Google Scholar] [CrossRef]
- Cruff, R.W.; Thompson, T.H. A comparison of methods of estimating potential evapotranspiration from climatological data in arid and subhumid environments. In U.S. Geological Survey Water-Supply Paper, 1839-M; USGS Publications Warehouse: Reston, VA, USA, 1967. [Google Scholar]
- Grace, B.; Quick, B. A comparison of methods for the calculation of potential evapotranspiration under the windy semi-arid conditions of southern Alberta. Can. Water Resour. J. 1988, 13, 9–19. [Google Scholar] [CrossRef]
- Xu, C.-Y.; Singh, V.P. Evaluation and generalization of radiation-based methods for calculating evaporation. Hydrol. Process. 2000, 14, 339–349. [Google Scholar] [CrossRef]
- Xu, C.-Y.; Singh, V.P. Evaluation and generalization of temperature-based methods for calculating evaporation. Hydrol. Process. 2001, 15, 305–319. [Google Scholar] [CrossRef]
- Rácz, C.; Nagy, J.; Dobos, A. Comparison of several methods for calculation of reference evapotranspiration. Acta Silv. Lignaria Hung. 2013, 9, 9–24. [Google Scholar] [CrossRef]
- Irmak, S.; Allen, R.G.; Whitty, E.B. Daily grass and alfalfa-reference evapotranspiration estimates and alfalfa-to-grass evapotranspiration ratios in Florida. J. Irrig. Drain. Eng. 2003, 129, 360–370. [Google Scholar] [CrossRef]
- Choi, W.; Choi, M.; Oh, H.; Park, J. Estimation on trends of reference evapotranspiration of weather station using reference evapotranspiration calculator software. KSCE J. Civ. Environ. Eng. Res. 2010, 30, 219–231. [Google Scholar]
- Xystrakis, F.; Matzarakis, A. Evaluation of 13 empirical reference potential evapotranspiration equations on the island of Crete in southern Greece. J. Irrig. Drain. Eng. 2011, 137, 211–222. [Google Scholar] [CrossRef]
- Heydari, M.M.; Aghamajidi, R.; Beygipoor, G.; Heydari, M. Comparison and evaluation of 38 equations for estimating reference evapotranspiration in an arid region. Fresenius Environ. Bull. 2014, 23, 1985–1996. [Google Scholar]
- Samaras, D.A.; Rief, A.; Theodoropoulos, K. Evaluation of radiation-based reference evapotranspiration models under different mediterranean climates in central Greece. Water Resour. Mang. 2014, 28, 207–225. [Google Scholar] [CrossRef]
- Djaman, K.; Balde, A.B.; Sow, A.; Muller, B.; Irmak, S.; N’Diaye, M.K.; Manneh, B.; Moukoumbi, Y.D.; Futakuchi, K.; Saito, K. Evaluation of sixteen reference evapotranspiration methods under sahelian conditions in the Senegal River Valley. J. Hydrol. Reg. Stud. 2015, 3, 139–159. [Google Scholar] [CrossRef]
- Neto, A.J.S.; Borges Júnior, J.C.F.; Andrade, C.L.T.; Lopes, D.C.; Nascimento, P.T. Reference evapotranspiration estimates based on minimum meteorological variable requirements of historical weather data. Chil. J. Agric. Res. 2015, 75, 366–374. [Google Scholar] [CrossRef]
- Tomar, A.S. Comparative performance of reference evapotranspiration equations at sub-humid Tarai region of Uttarakhand, India. Int. J. Agric. Res. 2015, 10, 65–73. [Google Scholar] [CrossRef][Green Version]
- Valipour, M. Evaluation of radiation methods to study potential evapotranspiration of 31 provinces. Meteorol. Atmos. Phys. 2015, 127, 289–303. [Google Scholar] [CrossRef]
- Valipour, M. Temperature analysis of reference evapotranspiration models. Meteorol. Appl. 2015, 22, 385–394. [Google Scholar] [CrossRef]
- Poyen, F.B.; Ghosh, A.K.; Kundu, P. Review on different evapotranspiration empirical equations. Int. J. Adv. Eng. Manag. Sci. 2016, 2, 17–24. [Google Scholar]
- Čadro, S.; Uzunović, M.; Žurovec, J.; Žurovec, O. Validation and calibration of various reference evapotranspiration alternative methods under the climate conditions of Bosnia and Herzegovina. Int. Soil Water Conserv. Res. 2017, 5, 309–324. [Google Scholar] [CrossRef]
- Djaman, K.; Irmak, S.; Futakuchi, K. Daily reference evapotranspiration estimation under limited data in Eastern Africa. J. Irrig. Drain. Eng. 2017, 143, 6016015. [Google Scholar] [CrossRef]
- Djaman, K.; Koudahe, K.; Akinbile, C.O.; Irmak, S. Evaluation of eleven reference evapotranspiration models in semiarid conditions. J. Water Resour. Prot. 2017, 9, 1469–1490. [Google Scholar] [CrossRef]
- Peng, L.; Li, Y.; Feng, H. The best alternative for estimating reference crop evapotranspiration in different sub-regions of mainland China. Sci. Rep. 2017, 7, 5458. [Google Scholar] [CrossRef] [PubMed]
- Antonopoulos, V.Z.; Antonopoulos, A.V. Evaluation of different methods to estimate monthly reference evapotranspiration in a Mediterranean area. Water Util. J. 2018, 18, 61–77. [Google Scholar]
- Farzanpour, H.; Shiri, J.; Sadraddini, A.A.; Trajkovic, S. Global comparison of 20 reference evapotranspiration equations in a semi-arid region of Iran. Hydrol. Res. 2019, 50, 282–300. [Google Scholar] [CrossRef]
- Azua-Barron, M.; Arteaga-Ramirez, R.; Vázquez-Peña, M.A.; Quevedo-Nolasco, A. Calibration and evaluation of mathematical models to calculate reference evapotranspiration in greenhouses. Rev. Mex. Cienc. Agríc. 2020, 11, 125–137. [Google Scholar]
- Karimi, S.; Shiri, J.; Marti, P. Supplanting missing climatic inputs in classical and random forest models for estimating reference evapotranspiration in humid coastal areas of Iran. Comput. Electron. Agric. 2020, 176, 105633. [Google Scholar] [CrossRef]
- Ndiaye, P.M.; Bodian, A.; Diop, L.; Deme, A.; Dezetter, A.; Djaman, K. Evaluation and calibration of alternative methods for estimating reference evapotranspiration in the Senegal River Basin. Hydrology 2020, 7, 24. [Google Scholar] [CrossRef]
- Sharafi, S.; Ghaleni, M.M. Calibration of empirical equations for estimating reference evapotranspiration in different climates of Iran. Theor. Appl. Climatol. 2021, 145, 925–939. [Google Scholar] [CrossRef]
- Droogers, P.; Allen, R.G. Estimating reference evapotranspiration under inaccurate data conditions. Irrig. Drain. Syst. 2002, 16, 33–45. [Google Scholar] [CrossRef]
- Gavilán, P.; Lorite, I.J.; Tornero, S.; Berengena, J. Regional calibration of Hargreaves equation for estimating reference ET in a semiarid environment. Agric. Water Manag. 2006, 81, 257–281. [Google Scholar] [CrossRef]
- Fooladmand, H.R.; Haghighat, M. Spatial and temporal calibration of Hargreaves equation for calculating monthly ETo based on Penman-Monteith method. Irrig. Drain. 2007, 56, 439–449. [Google Scholar] [CrossRef]
- Ahmadi, S.H.; Fooladmand, H.R. Spatially distributed monthly reference evapotranspiration derived from the calibration of Thornthwaite equation: A case study, South of Iran. Irrig. Sci. 2008, 26, 303–312. [Google Scholar] [CrossRef]
- Fooladmand, H.R. Evaluation of Blaney-Criddle equation for estimating evapotranspiration in south of Iran. Afr. J. Agric. Res. 2011, 6, 3103–3109. [Google Scholar]
- Thepadia, M.; Martinez, C.J. Regional calibration of solar radiation and reference evapotranspiration estimates with minimal data in Florida. J. Irrig. Drain. Eng. 2012, 138, 111–119. [Google Scholar] [CrossRef]
- Cristea, N.C.; Kampf, S.K.; Burges, S.J. Revised coefficients for Priestley-Taylor and Makkink-Hansen equations for estimating daily reference evapotranspiration. J. Hydrol. Eng. 2013, 18, 1289–1300. [Google Scholar] [CrossRef]
- Lima, J.R.S.; Antonino, A.C.D.; de Souza, E.S.; Hammecker, C.; Montenegro, S.M.G.L.; Lira, C.A.B.O. Calibration of Hargreaves-Samani equation for estimating reference evapotranspiration in sub-humid region of Brazil. J. Water Resour. Prot. 2013, 5, 41599. [Google Scholar] [CrossRef]
- Maestre-Valero, J.F.; Martízez-Álvarez, V.; González-Real, M.M. Regionalization of the Hargreaves coefficient to estimate long-term reference evapotranspiration series in SE Spain. Span. J. Agric. Res. 2013, 11, 1137–1152. [Google Scholar] [CrossRef]
- Mendicino, G.; Senatore, A. Regionalization of the Hargreaves coefficient for the assessment of distributed reference evapotranspiration in southern Italy. J. Irrig. Drain. Eng. 2013, 139, 349–362. [Google Scholar] [CrossRef]
- Abd El-Wahed, M.H.; Abd El-Mageed, T.A. Estimating reference evapotranspiration using modified Blaney-Criddle equation in arid region. Bothalia J. 2014, 44, 183–195. [Google Scholar]
- Heydari, M.M.; Heydari, M. Calibration of Hargreaves-Samani equation for estimating reference evapotranspiration in semiarid and arid regions. Arch. Agron. Soil Sci. 2014, 60, 695–713. [Google Scholar] [CrossRef]
- Patel, J.; Patel, H.; Bhatt, C. Generalized calibration of the Hargreaves equation for evapotranspiration under different climate conditions. Soil Water Res. 2014, 9, 83–89. [Google Scholar] [CrossRef]
- Almorox, J.; Grieser, J. Calibration of the Hargreaves-Samani method for the calculation of reference evapotranspiration in different Köppen climate classes. Hydrol. Res. 2016, 47, 521–531. [Google Scholar] [CrossRef]
- Feng, Y.; Jia, Y.; Cui, N.; Zhao, L.; Li, C.; Gong, D. Calibration of Hargreaves model for reference evapotranspiration estimation in Sichuan basin of southwest China. Agric. Water Manag. 2017, 18, 1–9. [Google Scholar] [CrossRef]
- Althoff, D.; Santos, R.A.; Bazame, H.C.; Cunha, F.F.; Filgueiras, R. Improvement of Hargreaves-Samani reference evapotranspiration estimates with local calibration. Water 2019, 11, 2272. [Google Scholar] [CrossRef]
- Matcalfe, R.A.; Petzold, H.; Luce, J.J.; Buttle, J.M. Evaluating seasonal and regional calibration of temperature-based methods for estimating potential evaporation in Ontario. Can. Water Resour. J. 2019, 44, 2–21. [Google Scholar]
- Seo, Y.; Lim, S.; Heo, S.; Yoon, B.; Hong, S.; Park, Y.; Hong, D. Modification of Hargreaves equation coefficient to estimate reference evapotranspiration in Gangwondo. Korean J. Soil Sci. Fert. 2019, 52, 1–10. [Google Scholar] [CrossRef]
- Farias, V.D.S.; Costa, D.L.P.; Pinto, J.V.N.; Souza, P.J.O.P.; Souza, E.B.; Ortega-Farias, S. Calibration of reference evapotranspiration models in Pará. Acta Sci. Agron. 2020, 42, e42475. [Google Scholar] [CrossRef]
- Ghumman, A.R.; Ghazaw, Y.M.; Alodah, A.; Rauf, A.; Shafiquzzaman, M.; Haider, H. Identification of parameters of evaporation equations using an optimization technique based on pan evaporation. Water 2020, 12, 228. [Google Scholar] [CrossRef]
- Pandey, V.; Pandey, P.K. Calibration and ranking of Valiantzas reference evapotranspiration equations under the humid climate of northeast India. J. Water Clim. Change 2020, 11, 468–478. [Google Scholar] [CrossRef]
- Habeeb, R.; Zhang, X.; Hussain, I.; Hashmi, M.Z.; Elashkar, E.E.; Khader, J.A. Statistical analysis of modified Hargreaves equation for precise estimation of reference evapotranspiration. Tellus A Dyn. Meteorol. Oceanogr. 2021, 73, 1–12. [Google Scholar] [CrossRef]
- Awal, R.; Rahman, A.; Fares, A.; Habibi, H. Calibration and evaluation of empirical methods to estimate reference crop evapotranspiration in West Texas. Water 2022, 14, 3032. [Google Scholar] [CrossRef]
- Al-Asadi, K.; Abbas, A.A.; Dawood, A.S.; Duan, J.G. Calibration and modification of the Hargreaves-Samani equation for estimating daily reference evapotranspiration in Iraq. J. Hydrol. Eng. 2023, 28, 5023005. [Google Scholar] [CrossRef]
- Al-Dughairi, A.B.A.; Bourouba, M.F. Calibration of two models for estimating reference evapotranspiration by using FAO-56 Penman-Monteith model under arid conditions. Eng. Herit. J. 2023, 7, 113–121. [Google Scholar] [CrossRef]
- Xu, C.-Y.; Singh, V.P. Cross comparison of empirical equations for calculating potential evapotranspiration with data from Switzerland. Water Resour. Manag. 2002, 16, 197–219. [Google Scholar] [CrossRef]
- Gao, X.; Peng, S.; Xu, J.; Yang, S.; Wang, W. Proper methods and its calibration for estimating reference evapotranspiration using limited climatic data in Southwestern China. Arch. Agron. Soil Sci. 2015, 61, 415–426. [Google Scholar] [CrossRef]
- McCabe, G.J.; Hay, L.E.; Bock, A.; Markstrom, S.L.; Atkinson, R.D. Inter-annual and spatial variability of Hamon potential evapotranspiration model coefficients. J. Hydrol. 2015, 521, 389–394. [Google Scholar] [CrossRef]
- Djaman, K.; Tabari, H.; Balde, A.B.; Diop, L.; Futakuchi, K.; Irmak, S. Analyses, calibration and validation of evapotranspiration models to predict grass-reference evapotranspiration in the Senegal river delta. J. Hydrol. Reg. Stud. 2016, 8, 82–94. [Google Scholar] [CrossRef]
- Mattar, M.A.; Alazba, A.A.; Alblewi, B.; Gharabaghi, B.; Yassin, M.A. Evaluating and calibrating reference evapotranspiration models using water balance under hyper-arid environment. Water Resour. Manag. 2016, 30, 3745–3767. [Google Scholar] [CrossRef]
- Gurski, B.C.; Jerszurki, D.; Souza, J.L.M. Alternative methods of reference evapotranspiration for Brazilian climate types. Rev. Bras. Meteorol. 2018, 33, 567–578. [Google Scholar] [CrossRef]
- Chang, X.; Wang, S.; Gao, Z.; Luo, Y.; Chen, H. Forecast of daily reference evapotranspiration using a modified daily Thornthwaite equation and temperature forecasts. Irrig. Drain. 2019, 68, 297–317. [Google Scholar] [CrossRef]
- Islam, S.; Abdullah, R.A.B.; Badruddin, I.A.; Algahtani, A.; Shahid, S.; Irshad, K.; Mallick, J.; Hirol, H.; Alsubih, M.; Elouni, M.H.; et al. Calibration and validation of reference evapotranspiration models in semi-arid conditions. Appl. Ecol. Environ. Res. 2020, 18, 1361–1386. [Google Scholar] [CrossRef]
- Hadria, R.; Benabdelouhab, T.; Lionboui, H.; Salhi, A. Comparative assessment of different reference evapotranspiration models towards a fit calibration for arid and semi-arid areas. J. Arid. Environ. 2021, 184, 104318. [Google Scholar] [CrossRef]
- Gharehbaghi, A.; Kaya, B. Calibration and evaluation of six popular evapotranspiration formula based on the Penman-Monteith model for continental climate in Turkey. Phys. Chem. Earth 2022, 127, 103190. [Google Scholar] [CrossRef]
- Souza, A.P.; Tanaka, A.A.; Silva, A.C.; Uliana, E.M.; Almeida, F.T.; Gomes, A.W.A.; Klar, A.E. Reference evapotranspiration by Penman-Monteith FAO 56 with missing data of global radiation. Braz. J. Biosyst. Eng. 2016, 10, 217–233. [Google Scholar] [CrossRef][Green Version]
- Su, Q.; Singh, V.P. Calibration-free Priestley-Taylor method for reference evapotranspiration estimation. Water Resour. Res. 2023, 59, e2022WR033198. [Google Scholar] [CrossRef]
- Rim, C.-S. Comparison of evapotranspiration estimation approaches considering grass reference crop. J. Korea Water Resour. Assoc. 2008, 41, 212–228. [Google Scholar] [CrossRef]
- Rim, C.-S.; Yoon, S.E.; Song, J.I. Evaluation of equations for estimating pan evaporation considering regional characteristics. KSCE J. Civ. Environ. Eng. Res. 2009, 29, 47–62. [Google Scholar]
- Sur, C.; Lee, J.; Park, J.; Choi, M. Spatial estimation of Priestley-Taylor based potential evapotranspiration using MODIS imageries: The Nak-dong river basin. Korean J. Remote Sens. 2012, 28, 521–529. [Google Scholar] [CrossRef]
- Jeon, M.-G.; Nam, W.-H.; Hong, E.-M.; Hwang, S.; Ok, J.; Cho, H.; Han, K.-H.; Jung, K.-H.; Zhang, Y.-S.; Hong, S.-Y. Comparison of reference evapotranspiration estimation methods with limited data in South Korea. Korean J. Agric. Sci. 2019, 46, 137–149. [Google Scholar] [CrossRef]
- Kim, S.J.; Kim, M.-I.; Lim, C.-H.; Lee, W.-K.; Kim, B.-J. Applicability analysis of FAO56 Penman-Monteith methodology for estimating potential evapotranspiration in Adong Dam watershed using limited meteorological data. J. Clim. Change Res. 2017, 8, 125–143. [Google Scholar] [CrossRef]
- Yoon, P.R.; Choi, J.-Y. Assessment of reference evapotranspiration equations for missing and estimated weather data. J. Korean Soc. Agric. Eng. 2018, 60, 15–25. [Google Scholar]
- Lee, K.-H.; Cho, H.-Y.; Oh, N.-S. Calibration and validation of the Hargreaves equation for the reference evapotranspiration estimation in Gyeonggi bay watershed. J. Korea Water Resour. Assoc. 2008, 41, 413–422. [Google Scholar] [CrossRef][Green Version]
- Lee, K.-H.; Park, J.-H. Calibration of the Hargreaves equation for the reference evapotranspiration estimation on a nation-wide scale. KSCE J. Civ. Environ. Eng. Res. 2008, 28, 675–681. [Google Scholar]
- Kim, H.-J.; Kim, K.; Kwon, H.-H. Development of a surrogate model based on temperature for estimation of evapotranspiration and its use for drought index applicability assessment. J. Korea Water Resour. Assoc. 2021, 54, 969–983. [Google Scholar]
- Hamon, W.R. Estimating Potential Evapotranspiration. Master’s Thesis, Massachusetts Institute of Technology, Cambridge, MA, USA, 1960. [Google Scholar]
- Hamon, W.R. Computation of direct runoff amounts from storm rainfall. Int. Assoc. Sci. Hydrol. 1963, 63, 52–62. [Google Scholar]
- Hansen, S. Estimating of potential and actual evapotranspiration. Hydrol. Res. 1984, 15, 205–212. [Google Scholar] [CrossRef]
- Hargreaves, G.H.; Samani, Z.A. Estimating potential evapotranspiration. J. Irrig. Drain. Div. 1982, 108, 223–230. [Google Scholar] [CrossRef]
- Jensen, M.E.; Haise, H.R. Estimating evapotranspiration from solar radiation. J. Irrig. Drain. Div. 1963, 89, 15–41. [Google Scholar] [CrossRef]
- Makkink, G.F. Testing the potential formula by means of lysimeters. J. Inst. Water Eng. 1957, 11, 277–288. [Google Scholar]
- Priestley, C.H.B.; Taylor, R.J. On the assessment of surface heat flux and evaporation using large-scale parameters. Mon. Weather Rev. 1972, 100, 81–92. [Google Scholar] [CrossRef]
- Thornthwaite, C.W. An approach toward a rational classification of climate. Geogr. Rev. 1948, 38, 55–94. [Google Scholar] [CrossRef]
- Pereira, A.R.; Pruitt, W.O. Adaptation of the Thornthwaite scheme for estimating daily reference evapotranspiration. Agric. Water Manag. 2004, 66, 251–257. [Google Scholar] [CrossRef]
- Lu, J.; Sun, G.; McNulty, S.G.; Amatya, D.M. A comparison of six potential evapotranspiration methods for regional use in the southwestern United States. J. Am. Water Resour. Assoc. 2005, 41, 621–633. [Google Scholar] [CrossRef]
- Lang, D.; Zheng, J.; Shi, J.; Liao, F.; Ma, X.; Wang, W.; Chen, X.; Zhang, M. A comparative study of potential evapotranspiration estimation by eight methods with FAO Penman-Monteith method in southwestern China. Water 2017, 9, 734. [Google Scholar] [CrossRef]
- Nash, J.E.; Sutcliffe, J.V. River flow forecasting through conceptual model. Part 1-A discussion of principles. J. Hydrol. 1970, 10, 282–290. [Google Scholar] [CrossRef]
Disclaimer/Publisher’s Note: The statements, opinions and data contained in all publications are solely those of the individual author(s) and contributor(s) and not of MDPI and/or the editor(s). MDPI and/or the editor(s) disclaim responsibility for any injury to people or property resulting from any ideas, methods, instructions or products referred to in the content. |
© 2024 by the authors. Licensee MDPI, Basel, Switzerland. This article is an open access article distributed under the terms and conditions of the Creative Commons Attribution (CC BY) license (https://creativecommons.org/licenses/by/4.0/).