Abstract
Due to the complexity of terrain and climate in the mountain–plain transition zone, it is difficult to simulate and forecast the flow discharge of river basins accurately. The poor regularity of the river thus leads to uncertain flood control scheduling. Meanwhile, reservoirs and flood detention areas are constructed to store and divert water when severe floods threaten the safety of the basin. In order to improve the accuracy of flood forecasts and the effectiveness of flood control, a hydrological and 1D/2D hydrodynamic coupling model was developed to enable the joint computation of multiple objects, including mountainous streams, plains river networks, hydraulic control structures, and flood detention areas. For the hydrological component, the Xin’anjiang model with the Muskingum module is employed to simulate mountainous flow discharge. For the hydrodynamic component, the Saint–Venant equations and shallow water equations are applied to estimate flood processes in rivers and on land surfaces, respectively. The Dongtiaoxi River Basin in Zhejiang Province, China, serves as the case study, where river flow is influenced by both upstream mountainous floods and downstream backwater effects. Using the integrated model, flood routing and scheduling are simulated and visualized. Both the Xin’anjiang model and the 1D hydrodynamic model demonstrate over 80% acceptability in calibration and validation, confirming their robustness and reliability. Meanwhile, inundation in flood detention areas can be effectively estimated by coupling the 1D and 2D hydrodynamic models with a flood diversion scheduling model. The coupled model proves capable of simulating flood routing in complex river basins that include mountains, plains, and hydraulic control structures, accounting for the interactions between hydrological elements. These findings provide a new perspective on flood simulation in other similarly complex river basins.
1. Introduction
Floods are one of the most significant natural disasters which have huge socioeconomic impacts [1]. To mitigate and minimize flood hazards and risks, effective and cost-efficient flood forecasting and control are essential [2,3]. Mountainous rivers usually feature many small subcatchments and steep riverbeds, leading to rapid surface runoff and quick rises in flow discharges during heavy rains, posing difficulties for accurate real-time forecasting [4]. Meanwhile, plain river networks, characterized by low and flat terrain, have rivers that flow back and forth with slow flow rates [5]. Therefore, rivers originating from mountainous areas and flowing through plains are influenced by both the upstream rapids and downstream backwater, resulting in highly complex hydrological conditions in the middle reaches. Flooding in such river basins can subsequently have huge potential influences, especially downstream, where it is usually inhabitable for human settlements. The floods can significantly threaten human lives and hinder socioeconomic development, by way of direct fatalities and injuries, destruction of infrastructures, and social disruptions [6,7]. Due to the increasingly extreme rainfall events under climate change, flood simulation in such complex river basins is even more challenging [8], complicating accurate real-time forecasting within a short time [9]. Additionally, hydraulic structures such as reservoirs, levees, and pumping stations have significantly altered the morphology process of rivers, introducing more uncertainties to flood forecasting [10].
Hydrological and hydrodynamic modeling is a mainstream technique for flood simulations [11,12]. There are already many advanced hydrological and hydrodynamic models widely applied in the field of flood forecasting, such as HEC-RAS, SWAT, MIKE, and the Xin’anjiang model [13,14,15,16]. However, due to the complexity of river basins in mountain-plain transition zones, and thus higher requirements of timely forecasting, the forecast ability and effectiveness are still developing [17]. Moreover, the construction of hydraulic engineering projects within the basin has altered the underlying surface conditions and river flow characteristics, making traditional hydrology-based flood forecasting methods inadequate for flood simulation and prediction. Therefore, it is necessary to combine flood forecasting methods for both mountainous and plain river channels to establish a new forecasting model. A promising approach to achieve more precise simulation results is coupling multiple hydrological and hydrodynamic models [18,19,20]. Several researchers have studied the performance of coupled hydrological–hydrodynamic models. In Jiaxing City of Zhejiang Province, Han et al. [21] applied a coupled SCS hydrological model and MIKE 11 hydrodynamic model to study regional precipitation on the flooding process in the river basins. For more accurate flooding simulations, Zhong et al. [22] coupled the Xin’anjiang hydrological model and the IFMS hydrodynamic model to improve integrated flood and emergency response management in the Puyang River Basin.
Dongtiaoxi River is located in Zhejiang province, China, and originated from a mountain area, which features an upstream steep river channel. The downstream transits to a river network, which consists of many branches spreading over the flat plain. Moreover, the river is highly regulated by structures, including reservoirs, flood detention areas, and sluice gates for comprehensive flood management. Given its significant socio-economic role and the complex topography influenced by tropical cyclones, Mei-Yu fronts, and convective storms [23], improving flood forecasting is essential.
This study focuses on the Dongtiaoxi River Basin, aiming to improve the accuracy of flood forecasting and flood control in complex river basins. A coupled hydrological and hydrodynamic model was developed for the study area, which comprehensively analyzes the impact of hydraulic engineering scheduling, the backwater effect from downstream Lake Tai, and flood diversion in detention areas on flood control and drainage. It provides crucial technical support for the digital transformation of flood forecasting and dispatching in the basin.
2. Methods
Considering physiographic, climatic, and flood control factors, this paper develops a compound model coupling hydrological model, one-dimensional river channel hydrodynamic model (1D hydrodynamic model), two-dimensional surface hydrodynamic model (2D hydrodynamic model), and scheduling model to simulate the flooding process regulated by reservoirs and detention areas. The modeling framework is illustrated in Figure 1.
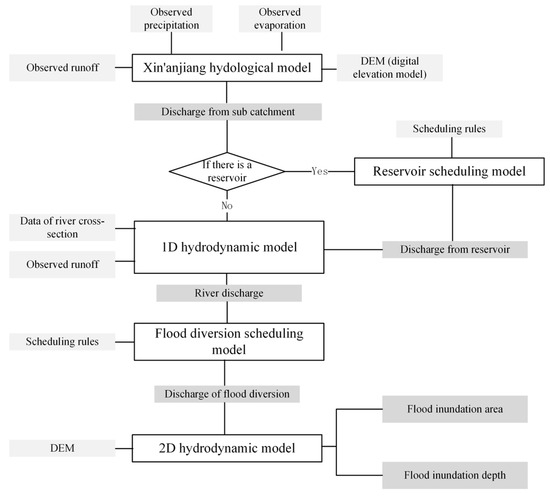
Figure 1.
Modeling framework.
Based on the terrain and geomorphological characteristics of the upstream basin, the Xin’anjiang hydrological model with the Muskingum module is applied to calculate the discharge concentrated from subcatchments. If there is a reservoir built in the river channels, a reservoir scheduling model is applied to regulate the flow, which is used as the input of the 1D hydrodynamical model. Otherwise, flow at the control point of subcatchment would be used. A one-dimensional unsteady flow mathematical model using the finite volume method is applied to the middle and downstream reaches. For the 2D hydrodynamic model, a high-precision digital elevation map is utilized for unstructured grid discretization to accommodate complex terrain boundaries. The flood diversion scheduling model is applied to couple the 1D and 2D hydrodynamic models, establishing a relationship between river cross-sections and surface grid. This is used to simulate the progression of overbank flow and flood diversion in flood detention areas.
2.1. Xin’anjiang Hydrological Model
The Xin’anjiang model was proposed by Zhao et al. (1992) [24] in the 1980s, with a four-layer structure, including evapotranspiration, runoff production, separation of the runoff components, and flow concentration. The Xin’anjiang model is usually applied in conjunction with the Muskingum module, a river routing simulation method [25]. There are 16 parameters adopted in the Xin’anjiang model, which are given in Table 1.

Table 1.
Parameters of the Xin’anjiang model.
2.2. Reservoir Scheduling Model
Reservoir regulation involves calculating the outflow based on hydrological engineering operation rules and inflow data. The outflow from the reservoir changes with the water level, typically being solved by the water balance equation (Formula (1)). Given the average inflow during the period, the initial water level, and the outflow at the beginning of the period, the reservoir’s water level and outflow at the end of the period are determined. The Runge–Kutta numerical method [26] is commonly used for this purpose and is suitable for complex scenarios involving multiple outflow devices, varying outflow methods, and changing calculation periods.
in which: Q(t) is the inflow at time step t, m3 s−1; S(z) is the discharge through drainage structures when the reservoir water level is z, m3 s−1; z is the water level in the reservoir, m; and V(z) is the reservoir volume when the water level is z, m3.
2.3. One-Dimensional Hydrodynamic Model
The one-dimensional hydrodynamic simulation of unsteady flow in river channels is based on the Saint–Venant equations [27], which consist of the continuity equation and the momentum equation:
the friction term is:
In the equation, A is cross-sectional area, m2; t is time, s; Q is flow rate at the section, m3 s−1; x is distance, m; q is lateral inflow per unit length, m3 s−1/m; η is water level in the channel, m; g is gravitational acceleration, m s−2; K is the flow modulus, m3 s−1.
2.4. Two-Dimensional Hydrodynamic Model
The two-dimensional shallow water equations [28], averaged over depth, can be simplified as follows.
In the equation, h is the water depth, m; u is the flow velocity in the x-direction, m/s; v is the flow velocity in the y-direction, m/s; and are the source terms.
2.5. Flood Diversion Scheduling Model
Optimizing flood diversion scheduling and developing rational scheduling plans for flood retention areas can effectively reduce downstream flood risks [29]. The flood diversion discharge is computed by coupling 1D and 2D hydrodynamic models. The 1D hydrodynamic model provides the flow rate Q to the 2D hydrodynamic model as boundary conditions, distributing flood volumes to the units computed in the two-dimensional simulation to obtain inundation area and depth.
3. Case Study
3.1. Study Area
The Dongtiaoxi River, located in the northeastern part of Zhejiang Province, originates from the Tianmu Mountain area and flows north into Lake Tai. It lies in the transitional zone between the southern Hangjiahu Plain and the western Zhejiang hills. The total area is 1220 km2, with mountains and hills, plains, and river surfaces accounting for 39.17%, 45%, and 15.83% of the total area, respectively. Qingshan Reservoir is located upstream of Dongtiaoxi River, which has a catchment area of 603 km2 and a total storage capacity of 215 million m3. The tributary Zhongtiaoxi River runs from Longshangwu in Lin’an to Xiakouqiao in Yuhang, spanning a length of 50 km, with a catchment area of 236 km2 above the Changle hydrological station. The tributary Beitiaoxi River flows from Anji to Longshezui in Yuhang, covering a length of 50 km and a total catchment area of 317 km2.
Its upper streams are mountainous rivers. When heavy rainfall occurs, floodwaters quickly flow into the downstream river networks of the Hangjiahu Plain, causing water levels to rise sharply. Additionally, due to the backwater effect of floods in Lake Tai, the drainage capacity of downstream river channels is reduced, putting considerable pressure on regional flood control [30]. The Dongtiaoxi River Basin has undergone several decades of flood control management, adhering to the overall strategy of “retention upstream, detention midstream, and drainage downstream”, which has continuously improved the flood control and drainage engineering system within the basin [31]. There are six reservoirs in the upper basin, functioning as flood retention projects. The midstream area is sequentially arranged with the Nanhu and Beihu, among others, for flood retention and detention purposes. These are the low-lying areas outside river embankments where floodwaters are temporarily stored [32,33]. The storage and detention functions in the upper and middle basins play a crucial role in controlling flood progression.
On the right bank of the Dongtiaoxi River, the Xixiandatang and Dongtiaoxi Diversion Levee have been constructed, with a flood control standard of a 100-year return period. On the left bank, from the midstream downwards, several polder areas are distributed, with levees built to a flood control standard of a 10-year or 20-year return period. Six sluice gates have been constructed along the right bank of the Dongtiaoxi Diversion Levee to control flood diversion into the lake and to manage the eastward flood discharge.
The spatial relationship of the main features in the Dongtiaoxi River Basin is shown in Figure 2.
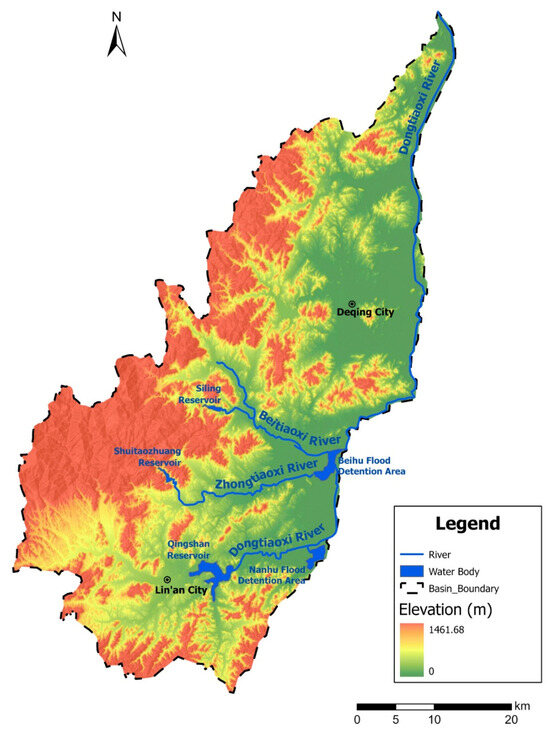
Figure 2.
Topography graph of Dongtiaoxi River Basin.
3.2. Datasets
The elevation data source used in this study is the open-source SRTM (Shuttle Radar Topography Mission) DEM (Digital Elevation Model) data, which was jointly measured by the space agencies of the United States, Germany, and Italy (https://www.earthdata.nasa.gov/, accessed on 12 December 2022). It covers more than 80% of the Earth’s surface. This data uses the WGS84 as the reference coordinate system and is one of the most widely applied data types. In this paper, SRTM DEM (version 3.0) data with a grid resolution of 30 m is used.
The hourly precipitation, evaporation, and runoff data are collected from the local hydrological yearbook, covering the period from 2013 to 2021. The observed precipitation data are from eight rainfall gauging stations: Shiling, Xikou, Nanzhuang, Qiaoding, Qingshan, Linan, Xijiatou, and Sankou. The runoff data is measured at Pingyao hydrological station.
The data on river cross-section, basin characteristics, and scheduling rules are collected from the Yuhang Bureau of Forestry and Water Resources in Zhejiang Province, China.
3.3. Model Calibration and Validation
3.3.1. Xin’anjiang Hydrological Model of Qingshan Reservoir
Nine historical floods between 2013 and 2020 are used to calibrate the Qingshan Reservoir, and two floods in 2021 are used for model validation. The calibration and validation results are presented in Table 2, with an acceptability of 88.9% (8/9) and 100% (2/2), respectively. The final parameters of the Xin’anjiang hydrological model are presented in Table 3.

Table 2.
Calibration and validation results of the Xin’anjiang hydrological model.

Table 3.
Parameters of the Xin’anjiang hydrological model in the Qingshan Reservoir catchment.
3.3.2. One-Dimensional Hydrodynamic Model of Dongtiaoxi River Basin
The 1D hydrodynamic model is developed in three reaches: (1) the main river channel from the Qingshan Reservoir to the Lake Tai in Nantiaoxi River–Dongtiaoxi River, (2) the main tributary Zhongtiaoxi River, from Changle hydrological station, and (3) the other main tributary Beitiaoxi River from Panban hydrological station, as shown in Table 4 and Figure 3.

Table 4.
Modeling scope of 1D river hydrodynamic model.

Figure 3.
Topological graph of 1D river hydrodynamic model in Dongtiaoxi River Basin.
Based on historical flood investigation data of Dongtiaoxi River, detailed records are available for five major flood events: “20190712” flood, “20190809” flood, “20200702” flood, “20210612” flood, and the “20210723” Yanhua Typhoon flood. These events include measurements along control sections or detailed flood marks, making them suitable for model calibration and validation. Four of the five flood events are used for calibration, and the “20210723” Yanhua Typhoon flood is used for validation.
The downstream Pingyao hydrological station is selected as the calibration and validation site. A comparison of the measured water levels from Pingyao station during these five flood events with the simulated water levels shows a close match, as depicted in Table 5 and Figure 4. Through calibration and validation, Manning’s roughness coefficient for the Dongtiaoxi River reaches approximately 0.03 (see Table 6). Specifically, it is around 0.032 upstream of Yuhang station, 0.028 downstream of Pingyao station, and consistently 0.03 between Yuhang and Pingyao stations.

Table 5.
Calibration and validation results of the 1D hydrodynamic model.
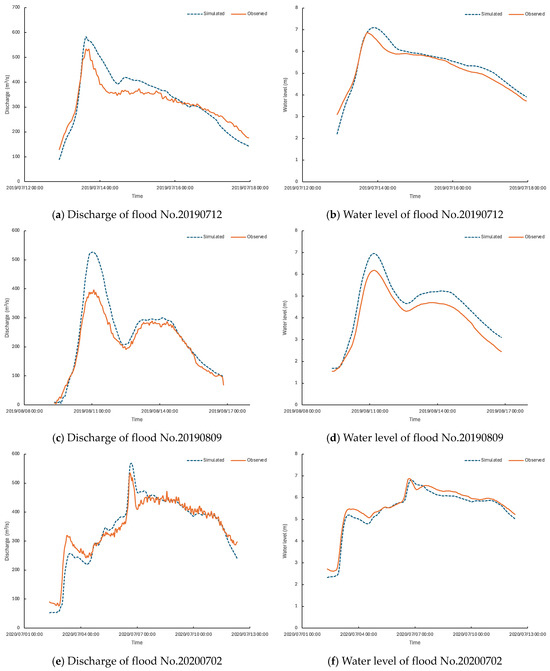
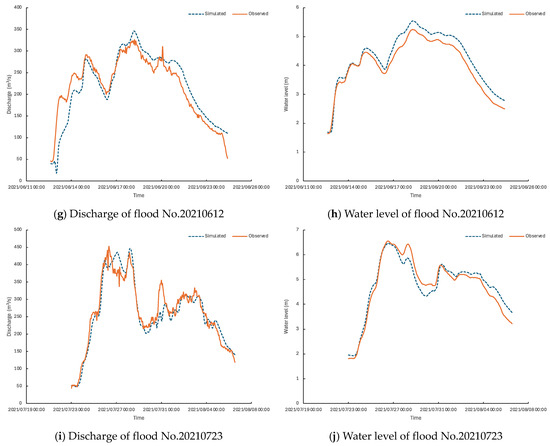
Figure 4.
Comparison of model calculations and measured data at Pingyao station.

Table 6.
Manning’s roughness coefficient applied in the 1D hydrological model.
3.3.3. Two-Dimensional Hydrodynamic Model of Flood Detention Areas
The 2D hydrodynamic model is developed for the Nanhu and Beihu flood detention areas, as listed in Table 7. Numerical computations are completed using the Godunov algorithm, where the Riemann problem is solved using the Roe approximate Riemann solver [34]. Bed slope terms are discretized using characteristic-based grading to ensure model conservation, while resistance terms are discretized implicitly to enhance stability. Spatial reconstruction using the MUSCL method [35] and a predictor–corrector approach is employed to achieve second-order accuracy in both time and space.

Table 7.
Modeling scope for two-dimensional flood storage areas.
The model uses unstructured irregular grids to discretize the study area, providing more flexibility in grid layout and a more accurate reflection of the terrain characteristics of the computational domain. Grid elevations are linearly interpolated from elevation point data of 1:500 topographic maps. For the Nanhu flood detention area, a grid spacing of 50 m is used, resulting in 2854 grids covering a generalized area of 5.056 km2. For the Beihu flood detention area, a grid spacing of 70 m is employed, resulting in 1424 grids covering a generalized area of 5.69 km2, as shown in Figure 5.
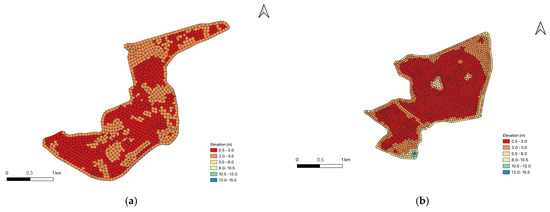
Figure 5.
Grid partitioning and elevation interpolation results for Beihu (a) and Nanhu (b) flood detention areas.
The roughness coefficients in this two-dimensional hydrodynamic model are primarily based on land cover classification [36] and empirical knowledge [37]. Based on satellite imagery, the Nanhu flood detention area is identified as a lake, while the Beihu flood detention area is classified as an ecological wetland. Consequently, a Manning’s roughness coefficient of 0.03 is applied to the land surface within the Nanhu detention area, while a coefficient range of 0.06 to 0.07 is selected for the Beihu detention area.
3.3.4. Flood Diversion Simulation
Key flood diversion gates in the Dongtiaoxi River Basin include Nanhu Gate, Beihu Gate, and Zhuangcun Gate, by which flood diversion is implemented in permanent flood detention areas like Nanhu and Beihu. The scheduling rules for the flood diversion gates are shown in Table 8.

Table 8.
Main scheduling rules of flood diversion gates.
A scenario is simulated when the Beihu diversion gate is open. Figure 6 illustrates the inundation area and depth of the Beihu detention area during two historical floods: Nos. 20190712 and 20200702.
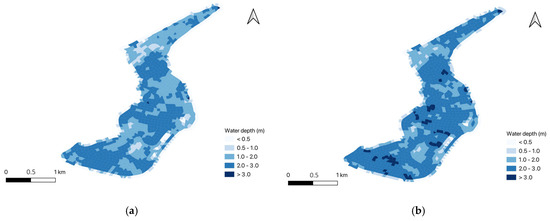
Figure 6.
Flood inundation map of Beihu detention area during flood No. 20190712 (b) and No. 20200702 (b).
4. Discussion
The mountainous upstream areas contribute to rapid runoff and high peak flows, which are then propagated downstream. In the downstream regions, backwater effects can lead to elevated water levels, exacerbating flood conditions. As a holistic modeling approach, the coupled hydrological–hydrodynamic model developed for the Dongtiaoxi River Basin represents a significant advancement for better understanding and management of flood dynamics in complex river systems, capturing the interactions between basin features like mountainous streams, plains river networks, and flood detention areas.
In the case study, the calibration of the Xin’anjiang hydrological model achieves an acceptability rate of 88.9% (eight out of nine), with a Nash–Sutcliffe Efficiency (NSE) coefficient exceeding 0.8 in most cases. The relative error in peak discharge ranges within acceptable limits and the time lag between observed and simulated peak flows is minimal, demonstrating the model’s capability to capture the timing and magnitude of flood peaks accurately. For validation, two flood events in 2021 are utilized, resulting in an acceptability rate of 100% and consistently high NSE coefficients. The 1D hydrodynamic model is calibrated and validated using data from five significant flood events that occurred in recent years. For four out of the five floods analyzed, both flow discharge and water level successfully capture the dynamic interactions between upstream inflows and downstream backwater effects, with relative error and NSE between observed and simulated water levels within acceptable ranges. However, an exception is the flood event of “20190809”, where the simulated results were higher than observed due to a subsequent rising stage following the first flood peak. This high degree of accuracy is critical for making informed decisions about flood management and mitigation. The model’s capability to simulate interactions between basin features provides valuable insights into the timing and magnitude of flood peaks, allowing for better prediction and management of flood events. The 2D hydrodynamic model component provides detailed spatial distributions of inundation extents and depths within flood detention areas, demonstrating the model’s capability to accurately predict flood diversion dynamics and identify critical areas prone to flooding.
Despite the significant contributions of this study to flood simulation and management in the complex river basins, several limitations are acknowledged. These limitations highlight the challenges associated with model calibration and validation influenced by climate change, detecting Manning’s roughness coefficient of the ground surface, and operation constraints of the hydraulic structure. Firstly, while the model employed in this study has been calibrated and validated using historical data, the inherent uncertainty of climate change would continue to pose challenges to achieving higher predictive accuracy. Climate change is expected to alter hydrological patterns in the Dongtiaoxi River Basin, including changes in rainfall intensity, frequency, and seasonality [38]. Since flood simulation models typically rely on historical climate data for calibration and validation, their effectiveness in predicting future flood events under changing climate conditions would be limited. Secondly, Manning’s roughness coefficient for the 2D hydrodynamic model is determined based on land cover classification. However, the effectiveness of this approach cannot be fully validated due to the absence of historical flood marks. Lastly, frequent manual interventions of reservoir and flood detention gates in Section 3.3.4 can introduce potential errors, compromising the accuracy of flood forecasts. This underscores the need for advanced automation and real-time data acquisition systems to enhance the accuracy and efficiency of flood management [39].
While the current model has proven effective in simulating and managing flood events in the Dongtiaoxi River Basin, there are opportunities for further improvement. Integrating advanced technologies, such as artificial intelligence (AI) and machine learning (ML) [40], can enhance the model’s predictive capabilities and operational efficiency. AI algorithms can analyze large datasets to identify patterns and trends in flood behavior providing more accurate and timely predictions. Moreover, the model could be coupled with climate models to assess the impacts of different climate change scenarios on flood risks [41,42]. Finally, the digital transformation of flood management operations, driven by the integration of the hydrological–hydrodynamic model into a comprehensive flood control system, can significantly enhance the basin’s resilience to extreme weather events [43]. This digital approach enables real-time monitoring, prediction, and automatic response, facilitating proactive flood management and reducing the reliance on manual interventions.
5. Conclusions
The study proposes a hydrological–hydrodynamic model designed for complex river basins with mountain–plain terrain and hydraulic structures, integrating the Xin’anjing hydrological model, 1D and 2D hydrodynamic models, reservoir scheduling model, and flood diversion scheduling model. The effectiveness of a coupled hydrological-hydrodynamic model in simulating and managing flood events is demonstrated in the Dongtiaoxi River Basin. The success of the case study affirms the model’s reliability and accuracy and leads to the following conclusions.
- By coupling the hydrological model, hydrodynamic model, and scheduling model, the proposed model can effectively capture the complex hydrodynamic interactions within the basin, including effectively reproduced water levels and discharge rates and detailed representations of floodplain dynamics and inundation patterns.
- Through the reservoir scheduling model and flood diversion scheduling model, the flood simulations effectively estimate the operation impact of reservoirs and flood detention areas, illustrating their potential as flood rehearsal tools capable of informing flood management strategies and emergency response plans.
- The study acknowledges the challenges posed by climate change, uncertainty of model parameters, and potential errors in hydraulic engineering operations.
- Future work should focus on integrating advanced technologies, such as AI, ML, meteorological models, and engineering automatic control, to improve forecasting accuracy and operational efficiency.
Author Contributions
Conceptualization, K.Z. and Z.J.; methodology, K.Z. and X.L.; software, H.Z.; validation, K.Z., Z.J. and Z.L.; formal analysis, K.Z.; investigation, X.L.; resources, Z.J.; data curation, K.Z.; writing—original draft preparation, K.Z.; writing—review and editing, Z.J.; visualization, Z.L.; supervision, H.Z. All authors have read and agreed to the published version of the manuscript.
Funding
This work is financially supported by the projects of the Zhejiang Key Research and Development Program (2021C03017).
Data Availability Statement
Data are contained within the article.
Conflicts of Interest
The authors declare no conflicts of interest.
References
- Nevo, S.; Morin, E.; Gerzi Rosenthal, A.; Metzger, A.; Barshai, C.; Weitzner, D.; Voloshin, D.; Kratzert, F.; Elidan, G.; Dror, G.; et al. Flood forecasting with machine learning models in an operational framework. Hydrol. Earth Syst. Sci. 2011, 26, 4013–4032. [Google Scholar] [CrossRef]
- Alfieri, L.; Burek, P.; Dutra, E.; Krzeminski, B.; Muraro, D.; Thielen, J.; Pappenberger, F. GloFAS—Global ensemble streamflow forecasting and flood early warning. Hydrol. Earth Syst. Sci. 2013, 17, 1161–1175. [Google Scholar] [CrossRef]
- Xiang, Y.; Peng, T.; Qi, H.; Yin, Z.; Shen, T. Improving Flood Forecasting Skill by Combining Ensemble Precipitation Forecasts and Multiple Hydrological Models in a Mountainous Basin. Water 2024, 16, 1887. [Google Scholar] [CrossRef]
- Stoffel, M.; Wyżga, B.; Marston, R.A. Floods in mountain environments: A synthesis. Geomorphology 2016, 272, 1–9. [Google Scholar] [CrossRef]
- Phillips, J.D. Hydrological connectivity of abandoned channel water bodies on a coastal plain river. River Res. Appl. 2013, 29, 149–160. [Google Scholar] [CrossRef]
- Tapas, M.R.; Do, S.K.; Etheridge, R.; Lakshmi, V. Investigating the impacts of climate change on hydroclimatic extremes in the Tar-Pamlico River basin, North Carolina. J. Environ. Manag. 2024, 363, 121375. [Google Scholar]
- Tran TN, D.; Nguyen, B.Q.; Grodzka-Łukaszewska, M.; Sinicyn, G.; Lakshmi, V. The role of reservoirs under the impacts of climate change on the Srepok River basin, Central Highlands of Vietnam. Front. Environ. Sci. 2023, 11, 1304845. [Google Scholar] [CrossRef]
- Vionnet, V.; Fortin, V.; Gaborit, E.; Roy, G.; Abrahamowicz, M.; Gasset, N.; Pomeroy, J.W. Assessing the factors governing the ability to predict late-spring flooding in cold-region mountain basins. Hydrol. Earth Syst. Sci. 2020, 24, 2141–2165. [Google Scholar] [CrossRef]
- Contreras, M.T.; Gironás, J.; Escauriaza, C. Forecasting flood hazards in real-time: A surrogate model for hydrometeorological events in an Andean watershed. Nat. Hazards Earth Syst. Sci. Discuss. 2020, 20, 3261–3277. [Google Scholar] [CrossRef]
- Teraguchi, H.; Nakagawa, H.; Kawaike, K.; Yasuyuki BA, B.A.; Zhang, H. Effects of hydraulic structures on river morphological processes. Int. J. Sediment Res. 2011, 26, 283–303. [Google Scholar] [CrossRef]
- Liu, Q.; Qin, Y.; Zhang, Y.; Li, Z. A coupled 1D–2D hydrodynamic model for flood simulation in flood detention basin. Nat. Hazards 2015, 75, 1303–1325. [Google Scholar] [CrossRef]
- Patel, D.P.; Ramirez, J.A.; Srivastava, P.K.; Bray, M.; Han, D. Assessment of flood inundation mapping of Surat city by coupled 1D/2D hydrodynamic modeling: A case application of the new HEC-RAS 5. Nat. Hazards 2017, 89, 93–130. [Google Scholar] [CrossRef]
- Jain, S.K.; Mani, P.; Jain, S.K.; Prakash, P.; Singh, V.P.; Tullos, D.; Kumar, S.; Agarwal, S.P.; Dimri, A.P. A Brief review of flood forecasting techniques and their applications. Int. J. River Basin Manag. 2018, 16, 329–344. [Google Scholar] [CrossRef]
- Khattak, M.S.; Anwar, F.; Saeed, T.U.; Sharif, M.; Sheraz, K.; Ahmed, A. Floodplain Mapping Using HEC-RAS and ArcGIS: A Case Study of Kabul River. Arab. J. Sci. Eng. 2016, 41, 1375–1390. [Google Scholar] [CrossRef]
- Tran, T.-N.-D.; Nguyen, B.Q.; Zhang, R.; Aryal, A.; Grodzka-Łukaszewska, M.; Sinicyn, G.; Lakshmi, V. Quantification of Gridded Precipitation Products for the Streamflow Simulation on the Mekong River Basin Using Rainfall Assessment Framework: A Case Study for the Srepok River Subbasin, Central Highland Vietnam. Remote Sens. 2023, 15, 1030. [Google Scholar] [CrossRef]
- Thompson, J.R.; Sørenson, H.R.; Gavin, H.; Refsgaard, A. Application of the coupled MIKE SHE/MIKE 11 modelling system to a lowland wet grassland in southeast England. J. Hydrol. 2024, 293, 151–179. [Google Scholar] [CrossRef]
- Chen, Y.; Wang, Y.; Zhang, Y.; Luan, Q.; Chen, X. Flash floods, land-use change, and risk dynamics in mountainous tourist areas: A case study of the Yesanpo Scenic Area, Beijing, China. Int. J. Disaster Risk Reduct. 2020, 50, 101873. [Google Scholar] [CrossRef]
- Liu, Z.; Zhang, H.; Liang, Q. A coupled hydrological and hydrodynamic model for flood simulation. Hydrol. Res. 2019, 50, 589–606. [Google Scholar] [CrossRef]
- Zhang, Y.; Zhou, J.; Lu, C. Integrated Hydrologic and Hydrodynamic Models to Improve Flood Simulation Capability in the Data-Scarce Three Gorges Reservoir Region. Water 2020, 12, 1462. [Google Scholar] [CrossRef]
- Jha, M.K.; Afreen, S. Flooding Urban Landscapes: Analysis Using Combined Hydrodynamic and Hydrologic Modeling Approaches. Water 2020, 12, 1986. [Google Scholar] [CrossRef]
- Han, C.; Mei, Q.; Liu, S.G. Research and application on a coupled hydrological and hydrodynamic model in plain tidal river network. Chin. J. Hydrodyn. 2014, 29, 706–712. [Google Scholar]
- Zhong, H.; Zhang, B.; Ma, T.; Qi, X.; Wang, X.; Shang, H.; Qu, S.; Fang, W. Flood Scenario Simulation, Based on the Hydrological and Hydrodynamic Model in the Puyang River Catchment. Water 2022, 14, 3873. [Google Scholar] [CrossRef]
- Wu, M.; Dong, M.; Chen, F.; Yu, Z.; Luo, Y. A comparison of different station data on revealing the characteristics of extreme hourly precipitation over complex terrain: The case of Zhejiang, China. Earth Space Sci. 2023, 10, e2023EA002925. [Google Scholar] [CrossRef]
- Zhao, R.J. The Xin’anjiang model applied in China. J. Hydrol. 1992, 135, 371–381. [Google Scholar]
- Gill, M.A. Flood routing by the Muskingum method. J. Hydrol. 1978, 36, 353–363. [Google Scholar] [CrossRef]
- Chen, H.; Ahmadianfar, I.; Liang, G.; Bakhsizadeh, H.; Azad, B.; Chu, X. A successful candidate strategy with Runge-Kutta optimization for multi-hydropower reservoir optimization. Expert Syst. Appl. 2022, 209, 118383. [Google Scholar] [CrossRef]
- Strelkoff, T. Numerical solution of Saint-Venant equations. J. Hydraul. Div. 1970, 96, 223–252. [Google Scholar] [CrossRef]
- Defina, A. Two-dimensional shallow flow equations for partially dry areas. Water Resour. Res. 2000, 36, 3251–3264. [Google Scholar] [CrossRef]
- Xue, L.; Hao, Z.; Liu, X.; Li, Y. Numerical simulation and optimal system scheduling on flood diversion and storage in Dongting Basin, China. Procedia Environ. Sci. 2012, 12, 1089–1096. [Google Scholar]
- Ji, Z.; Zhang, G.; Huang, W. Flood Process Forecasting Method of Dongtiaoxi Based on LS-SVM. Zhejiang Hydrotech. 2021, 49, 5–8. [Google Scholar]
- Chen, Y.; Huang, Y.; Zhu, X. On Flood Control in Upper and Middle Reach of Dongtiaoxi River. J. Zhejiang Univ. Water Resour. Electr. Power 2019, 31, 42–46. [Google Scholar]
- Liao, S.; Wang, C.; Ji, R.; Zhang, X.; Wang, Z.; Wang, W.; Chen, N. Balancing Flood Control and Economic Development in Flood Detention Areas of the Yangtze River Basin. ISPRS Int. J. Geo-Inf. 2024, 13, 122. [Google Scholar] [CrossRef]
- Wang, K.; Wang, Z.; Liu, K.; Cheng, L.; Bai, Y.; Jin, G. Optimizing flood diversion siting and its control strategy of detention basins: A case study of the Yangtze River, China. J. Hydrol. 2021, 597, 126201. [Google Scholar] [CrossRef]
- Wang, Z.L.; Geng, Y.F.; Jin, S. The two-dimensional flood routing simulation. Chin. J. Comput. Mech. 2007, 2007, 533–538. [Google Scholar]
- Bellucci, V.; Bruno, C. Incompressible flows with combustion simulated by a preconditioning method using multigrid acceleration and MUSCL reconstruction. Int. J. Numer. Methods Fluids 2001, 36, 619–637. [Google Scholar] [CrossRef]
- Hossain, A.A.; Jia, Y.; Chao, X. Estimation of Manning’s roughness coefficient distribution for hydrodynamic model using remotely sensed land cover features. In Proceedings of the 17th International Conference on Geoinformatics 2009, Fairfax, VA, USA, 12–14 August 2009; IEEE: Fairfax, VA, USA, 2009; pp. 1–4. [Google Scholar]
- O’Brien, J.S. FLO-2D Reference Manual; FLO-2D Inc.: Nutrioso, AZ, USA, 2009. [Google Scholar]
- Xu, Y.P.; Zhang, X.; Ran, Q.; Tian, Y. Impact of climate change on hydrology of upper reaches of Qiantang River Basin, East China. J. Hydrol. 2013, 483, 51–60. [Google Scholar] [CrossRef]
- Wu, S.J.; Chang, C.H.; Hsu, C.T. Real-time error correction of two-dimensional flood-inundation simulations during rainstorm events. Stoch. Environ. Res. Risk Assess. 2020, 34, 641–667. [Google Scholar] [CrossRef]
- Puttinaovarat, S.; Horkaew, P. Flood forecasting system based on integrated big and crowdsource data by using machine learning techniques. IEEE Access 2020, 8, 5885–5905. [Google Scholar] [CrossRef]
- Jasper, K.; Gurtz, J.; Lang, H. Advanced flood forecasting in Alpine watersheds by coupling meteorological observations and forecasts with a distributed hydrological model. J. Hydrol. 2002, 267, 40–52. [Google Scholar] [CrossRef]
- Nguyen, H.M.; Bae, D.H. An approach for improving the capability of a coupled meteorological and hydrological model for rainfall and flood forecasts. J. Hydrol. 2019, 577, 124014. [Google Scholar] [CrossRef]
- Fraehr, N.; Wang, Q.J.; Wu, W.; Nathan, R. Supercharging hydrodynamic inundation models for instant flood insight. Nat. Water 2023, 1, 835–843. [Google Scholar] [CrossRef]
Disclaimer/Publisher’s Note: The statements, opinions and data contained in all publications are solely those of the individual author(s) and contributor(s) and not of MDPI and/or the editor(s). MDPI and/or the editor(s) disclaim responsibility for any injury to people or property resulting from any ideas, methods, instructions or products referred to in the content. |
© 2024 by the authors. Licensee MDPI, Basel, Switzerland. This article is an open access article distributed under the terms and conditions of the Creative Commons Attribution (CC BY) license (https://creativecommons.org/licenses/by/4.0/).